Abstract
Polyurethane (PU) coatings were successfully produced using unmodified kraft lignin (KL) as an environmentally benign component in contents of up to 80 wt%. Lignin samples were precipitated from industrial black liquor in aqueous solution working at room temperature and different pH levels (pH 2 to pH 5). Lignins were characterized by UV-Vis, FTIR, pyrolysis-GC/MS, SEC and 31P-NMR. Results show a correlation between pH level, OH number and molecular weight Mw of isolated lignins. Lignin-based polyurethane coatings were prepared in an efficient one step synthesis dissolving lignin in THF and PEG425 in an ultrasonic bath followed by addition of 4,4-diphenylmethanediisocyanate (MDI) and triethylamine (TEA). Crosslinking was achieved under very mild conditions (1 hour at room temperature followed by 3 hours at 35 °C). The resulting coatings were characterized regarding their physical properties including ATR-IR, TGA, optical contact angle, light microscopy, REM-EDX and AFM data. Transparent homogeneous films of high flexibility resulted from lignins isolated at pH 4, possessing a temperature resistance up to 160 °C. Swelling tests revealed a resistance against water. Swelling in DMSO depends on index, pH of precipitation and catalyst utilization for PU preparation. According to AFM studies, surface roughness is between 10 and 28 nm.
Polyurethane (PU) coatings were successfully produced using unmodified kraft lignin (KL) as an environmentally benign component in contents of up to 80 wt%.
1. Introduction
Within the last century, synthetic polymers have transformed our daily life. Due to a broad variability of appropriate monomer components, polyurethanes (PU) are one of the most versatile classes of synthetic polymers,1,2 known for their broad variety of applications including as foams (flexible foams3,4 for isolation and packaging5 mattress or car seats6), adhesives, elastomers, and coatings.7 According to a marked study, the total PU production was reported to be 5.44 Mio tonnes in 2011 with a forecast of 6.35 Mio tones in 2016, equivalent to an average growth of 3% p.a.8
Polyurethanes are usually synthesized by an exothermic reaction of a diol (or polyol) with an isocyanate leading to the urethane linkage between the monomeric units (Fig. 1).1 The reaction can be catalyzed by tertiary amines or organometallic compounds. In case of bifunctional monomers, linear thermoplastic polyurethanes can be synthesized, whereas polyols or polyisocyanates of higher functionality result in PU networks (thermosets) of varying crosslinking degree. The final polymer properties mainly depend on the chemical nature of the polymer building blocks, the NCO : OH ratio (called index) and the reaction sequence.
Fig. 1. Formation of linear single phase (m = 0) and phase separated (m = 1, 2) PUs in μm scale (R = aliphatic, aromatic residues usually <200 g mol−1). Hard and soft segments are statistically distributed.1.
Thus, PUs are available as thermoplastic, elastomer and thermosetting materials, depending on their chemical composition, structure and functionality of the monomers. For that reason, they cover a broad range of mechanical properties in order to meet specifications for a broad variety of applications. The success of the polyurethane chemistry is based on the reactivity of the isocyanate group with nucleophiles of different nature. However, due to this reactivity, numerous side reactions are observed beside urethane formation resulting in rather complex structures.9
PUs are hitherto almost exclusively prepared from fossil-based monomers. Exceptions are the broad and traditional use of glycerol, castor oil, sugar, sorbitol and cardanol for polyether polyols, oleate in polyester polyols and the use of unmodified castor oil as a substitute for polyether polyols.10
Today, a rapidly increasing number of patents and publications confirm intensive research activities to (at least) partially replace fossil-based components by sustainable ones prepared from renewable resources, such as lignocellulose feedstock (LCF).11 Concerns related to fossil resources and economic aspects such as availability and related costs of raw materials enhance pressure onto the chemical industry. Thus, the potential of renewable resources has to be studied in detail to enable a long-term stepwise feedstock exchange.
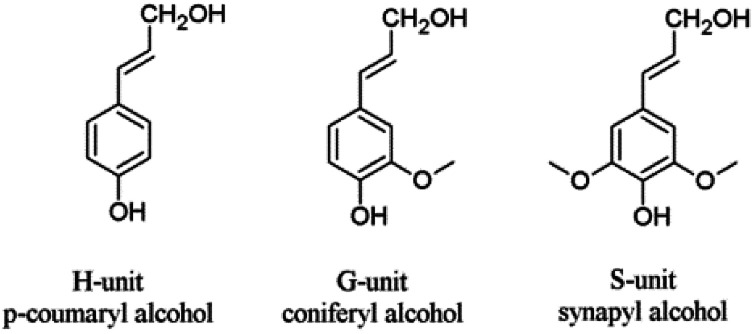
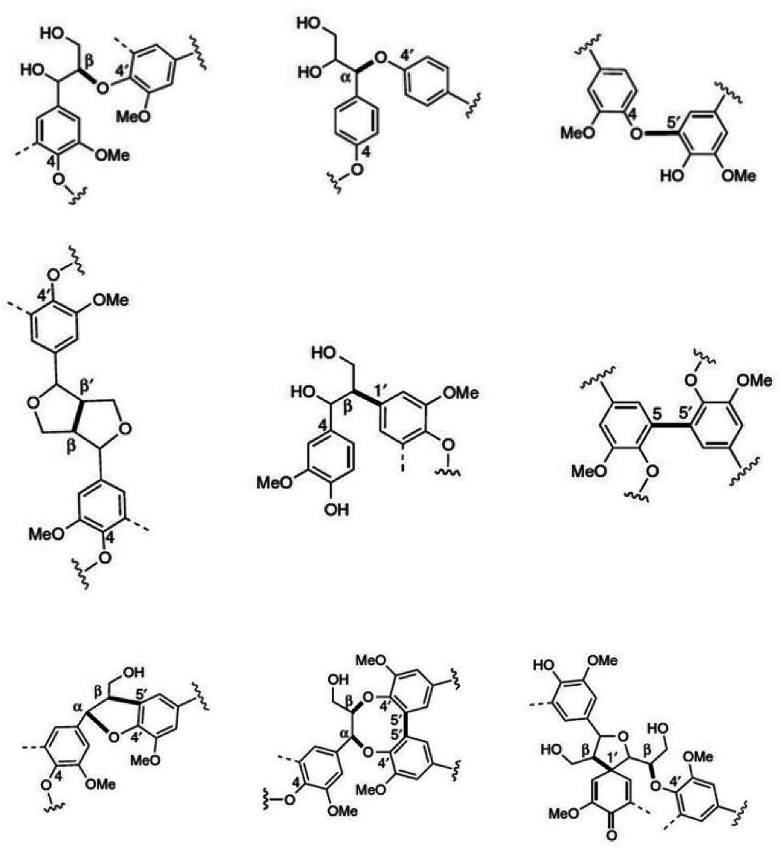
Next to cellulose, lignin is the most abundant renewable resource. Industrially, lignin is available as so-called kraft lignin from black liquor, a by-product of the kraft pulping technology.12–14 Structurally, lignin is a randomly crosslinked polymer consisting of three different phenylpropane derivatives mainly linked by ether bonds (Fig. 2 and 3).
Fig. 2. Lignin units H, G and S derived from corresponding cinnamoyl alcohols.
Fig. 3. Most common monolignol linkages. First line: ether bonds (β-O-4′, α-O-4′, 4-O-5′); second line: C–C-bonds (β-β′, β-1′, 5–5′), and third line: more complex linkages (β-5′/α-O-4′, 5–5′/β-O-4′/α-O-4′, β-1′/β-O-4′).
Today, technical black liquor is almost exclusively used by the pulp and paper industry as renewable energy source for the kraft pulping process, less than 2% are used for other commercial applications, i.e. vanillin production. This energy use is the ecological and economical benchmark and challenging task for lignin valorization efforts.
Besides kraft pulping used in pulp and paper industry, there are various processes studied to isolate lignin from biomass including steam explosion, AFEX, AlkaPolP, soda and organosolv pulping, comprehensively reviewed and recently published by Bozell et al.15 In previous studies, we isolated lignins from beech wood using the organosolv process varying the reaction conditions (temperature, reaction time). According to the NREL data, the resulting lignin fractions were free of carbohydrates.16 In 2012, a pilot plant started the production of organosolv lignin at Leuna, Germany.17 So far, commercially available are kraft lignin and lignosulfonates obtained from industrial wood delignification. Due to the potential availability in large scale (up to 90 Mio tons per year), these lignins attract the highest interest for further exploitation. According to market analysis studies published in 2017 and 2018, the global lignin market is predicted to have an annual growth rate of about 2% until 2023 and an increasing total market size from US$ 904.04 Mio in 2017 to US$ 1021.57 Mio in 2023.18,19
Current lignin research strategies follow two main routes: first, a direct utilization without chemical modification and second, pre-treatment including chemical modification, functionalization and/or fractionation (degradation) to generate a wide range of intermediates, fine chemicals and polymers.20–22 In between, lignin-derived polymers and composites are also studied as potential materials for biomedical applications such as tissue engineering and drug release.23–25 Due to the large number of hydroxyl groups, lignins are intensively studied as candidates to substitute fossil based alcohol and polyol components in polyurethanes, polyesters, epoxides and phenol–formaldehyde resins.26 In addition, lignins of various sources are intensively studied as vanillin substitutes to be used as environmentally benign antioxidants.27 Very recently, we reported differences in antioxidant capacity of technical kraft versus organosolv-derived lignins studied via DPPH assay.28
In case of polyol manufacturing, lignin has been investigated for long (starting with Glasser et al. fifty years ago29) as an interesting substitute for fossil-based polyols due to its high concentration of aliphatic and phenolic hydroxy groups.30 However, any kind of modification significantly rises costs without increasing additional value. Furthermore, due to the random linkage of monolignol units and the resulting heterogeneous and complex 3D structure, chemical modification of lignin is still challenging, particularly regarding reproducibility of the raw material supply. Nevertheless, working with unmodified lignin in polyurethane synthesis could be of significant economic impact and research activities in this field are constantly increasing.
In 2015, successful preparation of lignin-derived polyurethane coatings was reported by Jia and Griffini, respectively.31,32 Jia et al. used organosolv-derived lignins and MDI for PU preparation in 1,4-dioxane curing the final films at 85 °C for 3 hours.31 Griffini et al. studied commercial Indulin AT using boiling Me–THF for fractionation and extraction (soxhlet extractor, 80 °C, 8 hours). Coatings were prepared using toluene diisocyanate (TDI)–trimethylolpropane adduct (TMP) and crosslinking was achieved at elevated temperatures of 120 °C (for 1 hour).32
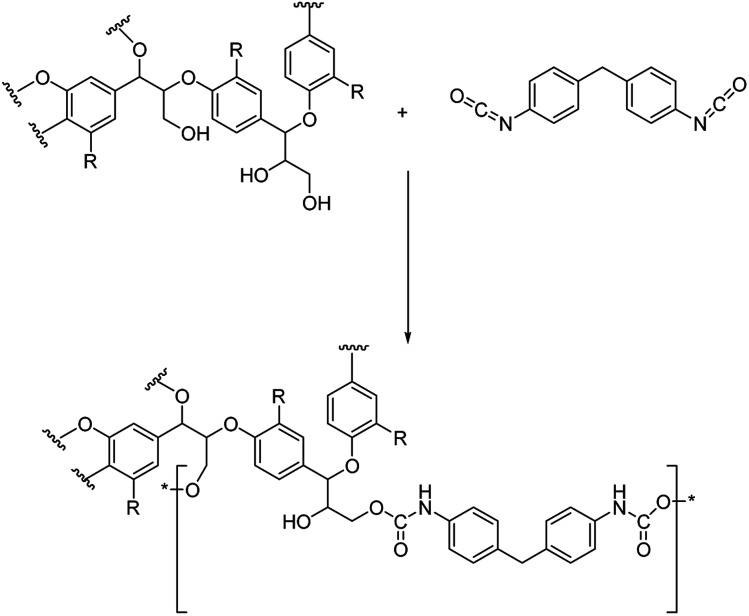
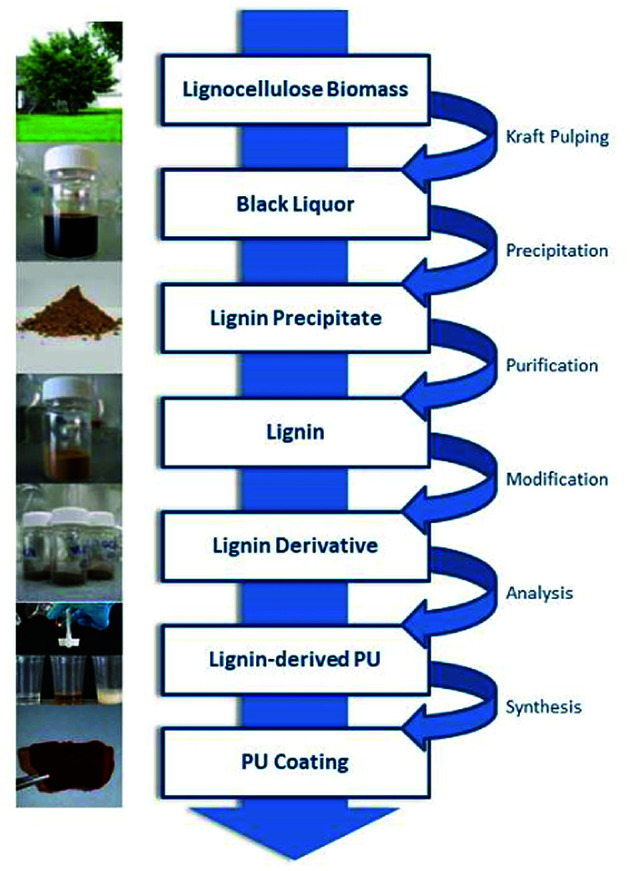
In our approach, lignin isolation was performed at room temperature in aqueous solution. Here, we describe the utilization of black liquor and corresponding unmodified kraft lignin isolated via acidic precipitation from aqueous solution at different pH values. The lignin-polyurethane (LPU) coatings were prepared using 4,4-diphenylmethan di-isocyanate (MDI) and crosslinked at very mild conditions, i.e. maximum temperatures of 35 °C (Fig. 4). The resulting coatings are transparent, homogeneous and highly flexible. Fig. 5 schematically summarizes the single steps presented in this study.
Fig. 4. Schematic urethane linkage formation for the reaction of 4,4-diphenylmethandi-isocyanate (MDI) and lignin (with R = monolignol functionalities according to Fig. 2).
Fig. 5. Generation of lignin-derived polyurethane coatings using unmodified kraft lignin isolated from technical black liquor.
2. Materials and methods
2.1. Materials
Black liquor obtained from kraft pulping (according to the supplier using a mixture of soft and hard wood) was obtained from Zellstoff- und Papierfabrik Rosenthal GmbH (Blankenstein, Germany, MERCER group). 4,4-Diphenylmethandi-isocyanate (MDI) and sodium hydroxide were purchased from Merck in Darmstadt, Germany. DMSO was received from VWR AMRESCO in Darmstadt, Germany. Triethylamine (TEA) was obtained from Carl Roth GmbH in Karlsruhe, Germany. Tetrahydrofuran (THF) was purchased from VWR Chemicals, Germany. PPG400 and PEG425 were obtained from Sigma-Aldrich in Steinheim, Germany. Sulfuric acid was purchased from Fisher Scientific in Loughborough, UK. All chemicals were reagent grade without further purification.
2.2. Extraction of lignin
The kraft lignin (KL) was extracted through the acidic precipitation from black liquor according to a procedure reported by Garcia et al.33 First, about 450 mL of black liquor were filtered with a vacuum filter. The filter cake was rejected. 400 mL filtrate was heated to 50–60 °C. Sulfuric acid (160 mL, 25 vol%) was added while stirring. The mixture was stirred for another hour at room temperature and then vacuum filtrated. The filter cake was washed with distilled water and sulfuric acid (25 vol%) until the requested pH-value was reached (pH 2 to pH 5). Finally, the precipitated lignin was dried in a freeze dryer for 48 hours. Yields are given in Table 1, molecular weight, polydispersity, glass transition temperature, and OH numbers of the lignins see Table 2; FTIR data in Table 3.
Yield of the acidic precipitation at different pH values.
| pH value | Yield (g/(100 mL black liquor)) |
|---|---|
| 2 | 15.81 |
| 3 | 14.65 |
| 4 | 13.53 |
| 5 | 12.94 |
Characterization of the kraft lignin: SEC molecular weight and polydispersity (PD), OH content according to ISO 14900 and 31P NMR.
| Lignin | M w [g mol−1] | M n [g mol−1] | PDI | T g [°C] | OH content (ISO 14900) | Eq. weight [g mol−1] | Functionality | 31P – NMR | |||||
|---|---|---|---|---|---|---|---|---|---|---|---|---|---|
| [mmol g−1] | (mg KOH) g−1 | Aliph. OH [mmol g−1] | Phenol. OH [mmol g−1] | Aliph./total [%] | OH aliph./molecule | OH arom./molecule | |||||||
| pH 2 | 1879 | 574 | 3.3 | 148 | 2.67 | 150 | 375 | 1.5 | 5.0 | 3.6 | 59 | 0.9 | 0.6 |
| pH 3 | 1732 | 538 | 3.2 | 147 | 4.48 | 251 | 223 | 2.4 | 7.3 | 5.9 | 55 | 1.3 | 1.1 |
| pH 4 | 1570 | 441 | 3.6 | 143 | 5.02 | 282 | 199 | 2.2 | 13.3 | 12.5 | 51 | 1.1 | 1.1 |
| pH 5 | 1502 | 490 | 3.0 | 134 | 5.35 | 300 | 187 | 2.6 | 19.0 | 18.2 | 51 | 1.3 | 1.3 |
Assignment of FT-IR signals of kraft lignin and Indulin AT.
| Wavenumber [cm−1] | Peak location [cm−1] | Assignment of IR absorption bands |
|---|---|---|
| 3411 | 3460–3412 | O–H stretching |
| 2935 | 3000–2930 | C–H stretch in methyl and methylene groups |
| 1707 | 1738–1709 | C O stretch in unconjugated carbonyl groups |
| 1599 | 1605–1593 | Aromatic skeleton vibrations (S, G) and C O stretching |
| 1514 | 1514 | C C stretch of aromatic skeletal (lignin) |
| 1460 | 1470–1370 | C–H deformation (lignin) |
| 1425 | 1430–1422 | Aromatic skeleton vibrations combined with C–H in plane deformation |
| 1268 | 1270–1266 | G-ring plus C + O stretching |
| 1219 | 1230–1221 | C–C, C–O and C O stretching (G) |
| 1149 | 1163 | C–O stretch [ |
| 1032 | 1035–1030 | Aromatic C–H in-plane deformation (G, S), C–O deformation in primary alcohols, C–H stretching (unconjugated) |
| 856 | 858–853 | C–H out of plane (G-units) |
| 816 | 832–817 | C–H out of plane (G-units) |
2.3. Synthesis of polyurethane films
PU-films were prepared using different NCO : OH ratios (1.0 to 2.5). The different monomer ratios are listed in Table 4. The calculation was performed according to literature.34 where wMDI, wL and wP are the weights (g) of MDI, lignin and polyoly, respectively. [NCO]MDI is the molar content of isocyanate groups in MDI, 8.0 mmol g−1 for 4,4′-MDI. [OH]L and [OH]P are the molar content of total hydroxyl groups in the lignin and the polyol, respectively. Masses of lignin and polyol were kept constant. Thus, 1 g lignin was dissolved in 6 mL THF under stirring. MDI was added and the mixture was transferred on a PE-transparency and dried for 1 h at room temperature. Finally, the pre-films were cured at 35 °C for 3 h to obtain the final lignin PU-films.
Monomer NCO : OH ratios and PPG 425, PEG 400, respectively.
| NCO : OH ratio | w L [g] | w PPG425 [g] | w PEG400 [g] | w MDI [g] |
|---|---|---|---|---|
| 1.2 | 1.00 | — | — | 0.67 |
| 1.7 | 1.00 | — | — | 0.95 |
| 2.5 | 1.00 | — | — | 1.40 |
| 1.2 | 0.80 | 0.20 | — | 0.69 |
| 1.7 | 0.80 | 0.20 | — | 0.97 |
| 2.5 | 0.80 | 0.20 | — | 1.43 |
| 1.2 | 0.70 | 0.30 | — | 0.70 |
| 1.7 | 0.70 | 0.30 | — | 0.99 |
| 2.5 | 0.70 | 0.30 | — | 1.45 |
| 1.2 | 0.80 | — | 0.20 | 0.68 |
| 1.7 | 0.80 | — | 0.20 | 0.96 |
| 2.5 | 0.80 | — | 0.20 | 1.41 |
| 1.2 | 0.70 | — | 0.30 | 0.68 |
| 1.7 | 0.70 | — | 0.30 | 0.97 |
| 2.5 | 0.70 | — | 0.30 | 1.42 |
This first set of coatings was produced just to compare the impact of the NCO : OH ratio (no other parameter was varied). In addition, other sets of coatings were produced where the effect of PEG425 as plasticizer was studied. In this case, the plasticizer was mixed with lignin to obtain an amount of 1 g of polyol blend. Afterwards, the MDI was added following the above described procedure. Coatings prepared from lignins isolated at different pH values, were produced analogue to the described procedure adapting the MDI amount to the hydroxyl number of the lignin and the resulting polyol blend. Furthermore, in a last set of coatings TEA was added as a catalyst to be compared to non-catalyzed coatings.
2.4. Characterization
Fourier-transform infrared spectroscopy (FTIR)
FTIR spectra of lignin were recorded on a Jasco FTIR 410 spectrometer in a range of 4000–400 cm−1 using a KBr disc containing 1% finely grounded sample. The spectrum was recorded over 23 scans with a resolution of 8 cm−1 (Table 3).
Ultraviolet-visible (UV-Vis) spectroscopy
A Perkin Elmer Lambda 35 UV-Vis spectrophotometer was used for recording the UV-Vis spectra. 5 mg lignin were dissolved in 100 mL 0.1 mol NaOH solution to obtain a concentration of 50 μL mL−1.
Gel permeation chromatography (GPC)
The weight-average (Mw) and number-average (Mn) molecular weight as well as the corresponding polydispersity (PD) were determined by gel permeation chromatography (GPC) using a PSS SECurity2 GPC System. Tetrahydrofuran (THF) was used as the mobile phase with a run time of 30 minutes and an injection volume of 100 μL. Polystyrene standards were used for the calibration at different molecular weights.
Pyrolysis gas chromatography coupled to mass spectrometry (Py-GC-MS)
Approximately 0.5 mg of sample was inserted without further preparation into the bore of the pyrolysis solids injector and then placed with the plunger on the quartz wool of the quartz tube from the furnace pyrolyzer Pyrojector IITM (SGE Analytical Science, Melbourne, Australia). The pyrolyzer was operated at a constant temperature of 550 °C. The pressure of the helium carrier gas at the inlet to the furnace was 95 kPa. The pyrolyzer was connected to a Trace 2000 gas chromatograph (ThermoQuest/CE Instruments, Milan, Italy) with a quadrupole mass spectrometer Voyager (ThermoQuest/Finnigan, MassLab Group, Manchester, UK) operated in electron impact ionization (EI) mode. A fused silica GC capillary column DB-5 MS 30 m long, 0.25 mm I.D., 0.25 μm film thickness (J&W, Folsom, CA, USA) was used. The GC temperature of the capillary column varied from 60 °C (1 min hold) at 2.5 °C min−1 to 100 °C and then 10 °C min−1 to 280 °C (20 min hold at 280 °C). The temperature of the split/splitless injector was 250 °C and the split flow was 10 cm3 min−1. Helium, grade 5.0 (Westfalen AG, Muenster, Germany) was used as a carrier gas at a constant pressure of 70 kPa during the entire analysis. The transfer line temperature was 280 °C. The MS ion source temperature was maintained at 250 °C. The ionization kinetic energy of the impacting electrons was 70 eV. The current emission of the rhenium filament was 150 μA. The MS detector voltage was 350 V. Mass spectra chromatograms—total ion current (TIC)—were obtained by automatic scanning in the mass range of m/z 35 to 455 u. Pyrolysis-GC/MS data were processed with Xcalibur software (version 1.2, ThermoQuest, Milan, Italy) and the NIST 05 mass spectra library (Gaithersburg, MD, USA).
Hydroxyl (OH) number determination
The determination of hydroxyl number was carried out with lignins following ISO 14900:2001(E)35 developed for polyether polyols with steric hindrance. Each lignin sample was boiled under reflux in 25 mL of acetylation reagent solution with a blank sample simultaneously under the same conditions. After three hours at reflux, the flasks were left to cool down to room temperature. 25 mL of sample and blank, respectively, were filled up with water to 100 mL and were titrated with sodium hydroxide (0.5 M). The split up of the acetylated samples and blanks allowed a triple determination via titration. Different amounts of sample and blank were needed. The differences were used to determine the total hydroxyl content.
31P nuclear magnetic resonance spectroscopy (31P NMR)
Spectra were recorded on a Bruker DRX-400 spectrometer using pyridine-d5/CDCl3 (Aldrich) in a 1.6 : 1 v/v ratio as solvent mixture, chromium(iii) acetylacetonate (Aldrich, 5.0 mg mL−1) and cyclohexanol (Aldrich, 10.85 mg mL−1) served as the internal standard and relaxation reagent, respectively. 2-Chloro-4,4,5,5-tetramethyl-1,3,2-dioxapholane was used as phosphorylation reagent.36
Attenuated resonance infrared spectroscopy (ATR-IR)
ATR spectra of the lignin-polyurethane (LPU) films were conducted using a Bruker Platinum ATR VERTEX 70 with 23 scan times and a resolution of 8 cm−1.
Light microscopy
The homogeneity of the different lignin-based coatings was examined by reflected-light microscopy with a KEYENCE VH-Z100UR.
Raster electron microscopy with X-ray analysis (REM-EDX)
Characterization of texture and phases and the thin LPU layer were determined by REM-EDX microscopy using a ESEM Quanta FEG 250 FEI with Apollo XL30 EDX.
Atomic force microscopy (AFM)
Imaging measurements were performed on the PU films by means of an Scanning Thermal microscopies (Thermomicroscopes system) driven by SPM software (Thermomicroscopes ProScan Version 2.1) in tapping mode with a scan rate of 0.3 Hz and 0.5 Hz using commercially available silicon Contact MPP-Rotated probes purchased from Bruker (Bruker AFM probes) Tip (radius: 8 mm, front angel: 15°, back angel 25°) conditions by room temperature in the 20–22 °C range.
Swelling tests
Swelling of the LPU films was measured in DMSO and water at 30 °C for 24 hours. After swelling, the coatings were cooled down to room temperature, dried and then weighed.
Thermogravimetric analysis (TGA)
TGA measurements were performed with about 10 mg of lignin using a Netzsch (Selb, Germany) TGA 209 F1 with a heating rate of 20 °C min−1 under nitrogen atmosphere. The temperature ranged from ambient to 800 °C.
Differential scanning calorimetry (DSC)
The thermal behavior was examined by DSC using a NETZSCH DSC 200 PC. 4–5 mg lignin were analyzed in a temperature range from 25 to 170 °C with a nitrogen flow rate of 60 mL min−1 and a heating rate of 20 °C min−1 (Table 6).
TGA results: decomposition temperatures for kraft lignin (KL) isolated at pH 4 and corresponding lignin-derived polyurethanes (LPU) prepared with and without TEA, respectively.
| Sample | T 5% [°C] | T 10% [°C] | T 50% [°C] | R 700 [%] |
|---|---|---|---|---|
| KL/isolated at pH 4 | 133 | 223 | 579 | 44 |
| LPU/with TEA | 190 | 226 | 360 | 29 |
| LPU/without-TEA | 170 | 218 | 356 | 32 |
Optical contact angle (OCA)
Optical Contact Angle (OCA). Static optical contact angle was performed with a TBU goE OCA. Measurements on the PU films were performed at room temperature using an OCA (Data Physics) equipped with a CCD photocamera. 40 μL were used to dispense liquid droplets. A minimum of 5 measurements were taken in different regions on the surface of each PU film and results were averaged. Water (H2O) and were used as probe liquids (Table 7).
Contact angle measurements of PU coatings containing lignins isolated at different pH values.
| Coating sample | θ H2O [deg] |
|---|---|
| PU-coating/lignin isolated at pH 2 | 92.28 ± 0.49 |
| PU-coating/lignin isolated at pH 3 | 80.49 ± 1.03 |
| PU-coating/lignin isolated at pH 4 | 83.28 ± 0.24 |
| PU-coating/lignin isolated at pH 5 | 86.01 ± 0.22 |
3. Results and discussion
3.1. Characterization of kraft lignin isolated at different pH
The acidic precipitation of kraft lignin was performed at four different pH values, pH 2, pH 3, pH 4 and pH 5. The yields are presented in Table 1 showing a slight but reproducible tendency to lower values at increasing pH due to solubility alterations.
Weight-average (Mw) and number-average (Mn) molecular weights and corresponding polydispersity (Mw/Mn) determined via gel permeation chromatography (GPC) are summarized in Table 2.
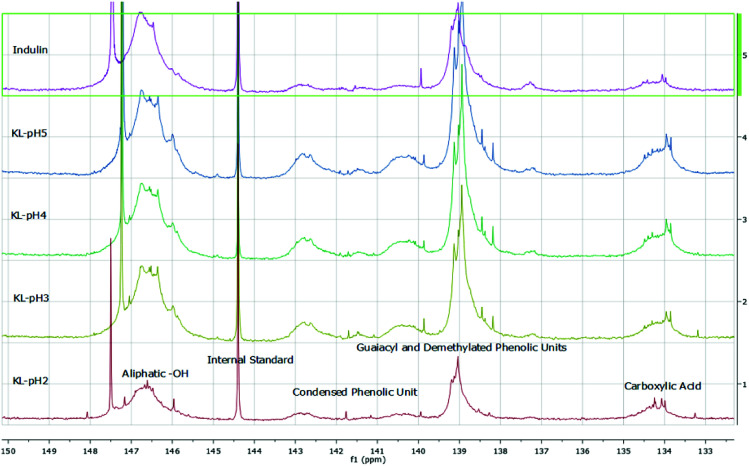
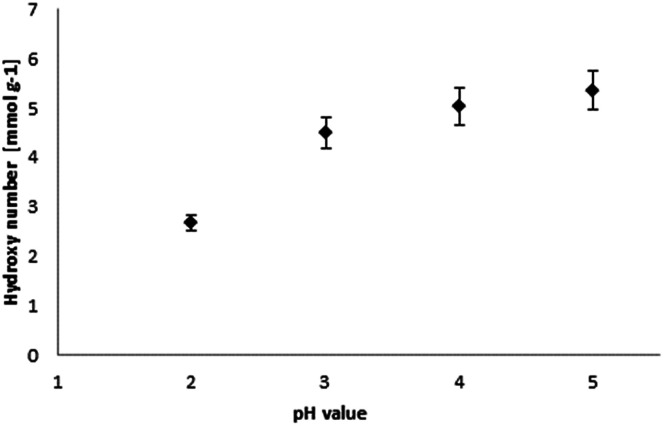
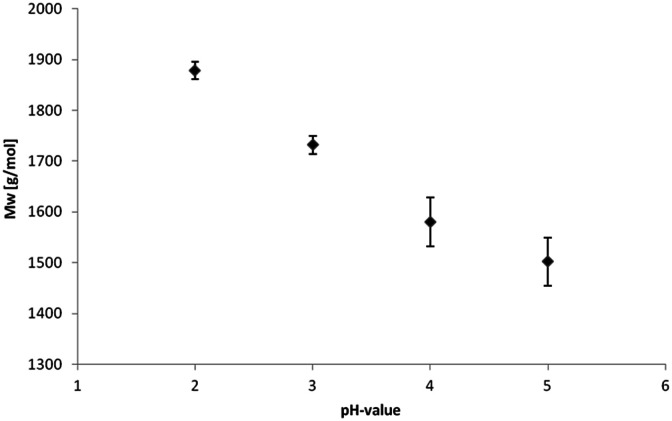
The isolated lignin samples showed a polydispersity ranging from 3.0 to 3.6. Typical literature values for kraft lignins were Mw = 1500–5000 g mol−1, Mn = 1000–3000 g mol−1 and PD = 2.5–3.5.36 In accordance with literature data, fractions of lower molecular weight resulted from the lignin depolymerisation mainly due to cleavage of α-O-4 and phenolic β-O-4 linkages.37–39 As shown in Table 2 and Fig. 6, the number of aliphatic and aromatic OH groups determined via31P NMR spectroscopy and titration (according to ISO 14900) showed an increase at decreasing molecular weight which is favorable for the polyurethane synthesis. In general, elimination reactions and Williamson ether formation have to be considered at lower pH values. In accordance with literature data, the ratio of G units in low molecular weight lignins was found to be significant in comparison to the other both units. The molecular weight increase can be associated with the presence of intermolecular carbon–carbon and ether bonds. Determination of hydroxyl number via titration was performed at least in quintuplicates (Fig. 7).
Fig. 6. 31P-NMR data obtained for kraft lignins isolated at different pH values compared to Indulin AT.
Fig. 7. Relation of hydroxyl number and pH value for lignin precipitation.
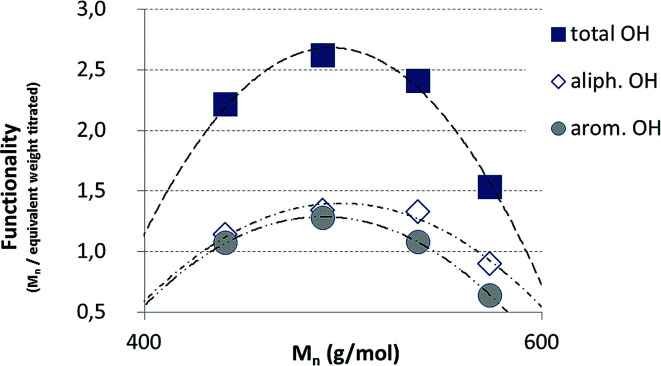
The hydroxyl numbers for the four lignins varied between 2.67 mmol g−1 (150 mg KOH per g) for pH 2 and 5.35 mmol g−1 (300 mg KOH per g, see also Table 2). In addition, Fig. 7 shows the relationship between hydroxyl number and pH value of the isolated lignins: the higher the pH value, the higher the hydroxyl number. We observed the best PU crosslinking for lignin precipitated at pH 4. Based on 31P NMR data for aliphatic and aromatic OH, the functionality of lignins isolated at different pH values were estimated in accordance to procedures established by Argyropoulos and comprehensively reviewed by Ragauskas.40,41 In ongoing studies, quantitative yields will be determined in order to specify the precipitation sequence. Most probably, small fragments with higher phenolate functionalities will first precipitate due to hydrogen bond formation. Considering the polyol : isocyanate ratio (g g−1) and assuming no crosslink formation by isocyanates (allophanates), crosslinking densities of the final polyurethanes were estimated (Fig. 8) confirming data reported by Nacas et al. regarding NCO : OH ratio influence on kraft lignin-derived PU (Fig. 9).42
Fig. 8. Estimated functionalities of the precipitated lignin fractions.
Fig. 9. Relation of SEC molecular weight data and pH value for lignin precipitation.
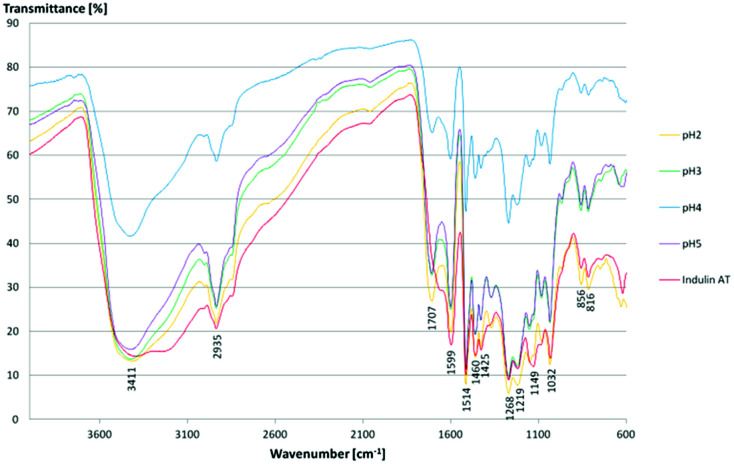
FTIR spectroscopy results confirmed literature data for kraft lignins isolated via acidic precipitation (Fig. 10).43,44 The assignment of the most characteristic FTIR absorption bands is given in Table 3. As all the lignins showed a similar location of the bands, exemplarily, one sample (lignin isolated at pH 2) is presented and compared to literature data. Thus, regarding FTIR data, lignins isolated at room temperature from aqueous black liquor equal those samples treated in organic solvents at high temperatures (Me–THF at 80 °C for 8 hours).32
Fig. 10. FTIR spectra of kraft lignins and Indulin AT.
For all lignins, a broad absorption band was observed in the range of 3.500–3.000 cm−1, which can be ascribed to the O–H stretching signal of hydrogen bonded hydroxyl groups. Other relevant bands are C O and C–O stretching and deformation and some aromatic skeletal vibrations. Here, the C C stretching vibration of the aromatic skeleton at 1514 cm−1 is of particular interest. Moreover, some vibrations can be assigned to the corresponding monolignols: the aromatic skeleton vibrations of S and G units at 1599 cm−1, the G ring at 1268 cm−1, the C–C, C–O and C O stretching of G units at 1219 cm−1, aromatic C–H in-plane deformation of S and G units at 1032 cm−1 and the double band for the C–H out of plane signal of G units at 856 cm−1 and 816 cm−1. The Indulin AT shows similar absorption bands except for one signal at 1707 cm−1 assigned to the C O stretch in unconjugated carbonyl groups. Due to the alkaline pre-treatment of the Indulin AT, ester bonds are preferably splitted. Thus, the corresponding IR signal is not as dominant as in the kraft lignin spectra.45
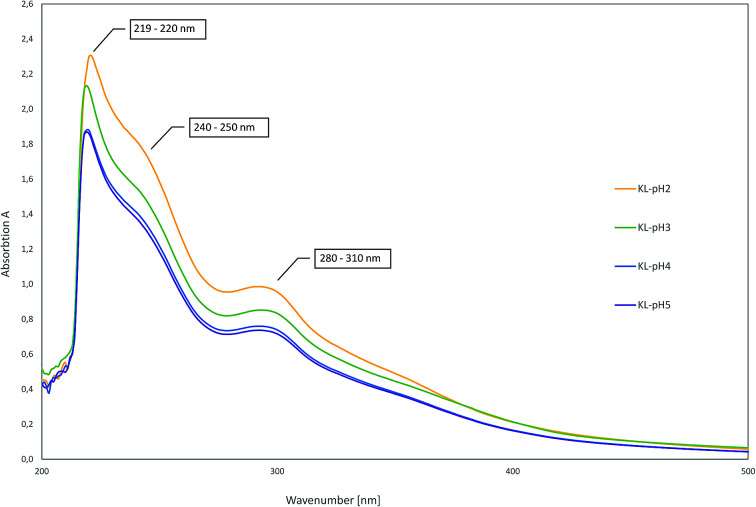
As there are more absorption bands indicating the presence of G units compared to S units, typical for softwood biomass. This is advantageous for the preparation of the LPU films because of the more homogenous structure of softwood in comparison to hardwood lignin.12,14,36 Moreover, the high number of G units detected via FTIR is in accordance with the GPC results. The UV-Vis spectra of the different lignins are very similar to each other with two absorption maxima (Fig. 11). One sharp band appears at 220–230 nm representing aromatic groups in general. The second maximum appears at 280–300 nm indicating non-conjugated phenolic fragments such as sinapyl-, coniferyl- and p-coumaryl alcohol. Moreover, there is a shoulder between 240–250 nm assigning conjugated phenolic groups. In accordance with literature results, the UV absorption bands in accordance with FTIR and GPC results indicated a softwood lignin containing mainly G units. In case of hardwood lignins with a higher ratio of S-units, the UV-Vis absorption bands were shifted to lower wavelengths.37,46
Fig. 11. UV-Vis spectra of lignins precipitated at different pH-values.
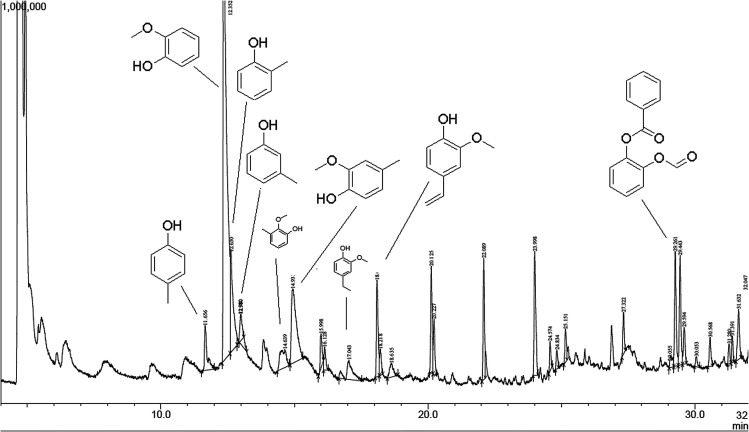
The pyrolysis-GC/MS was conducted in order to elucidate the structure of the lignin samples more in detail. The lignin and phenolic acid compounds are easily identified by mass spectrometry, because they maintain the ring substitution patterns from the lignin polymer and therefore can be identified as being derived from the p-hydroxyphenyl (H), guaiacyl (G), or syringyl (S) units of lignin. Py-GC/MS provides information about S, G, and H lignin units, enabling the calculation of the S/G ratio. This is a valuable parameter to determine the quality of pulpwood materials.
The released phenolic fragments can be derived either from G, S or H lignin units. The pyrogram of lignin pH 2 at 550 °C is shown in Fig. 12, together with the corresponding identities of the released phenolic compounds according to their retention time. In addition, each fragment was assigned to the specific monolignol origin.
Fig. 12. Pyrolysis-GC/MS chromatogram of lignin isolated at pH 2 (pyrolyzed at 550 °C).
In general, the predominant lignin derivatives are phenol, 2-methoxy (guaiacol) (1); phenol, 2-methoxy-5-methyl (2); phenol, 4-ethyl-2-methoxy (p-ethylguaiacol) (3) and acetophenon, 4-hydroxy-2-methyl (4). All four compounds were also present in lignin pH 3, pH 4 and pH 5. The chemical structures are shown in Fig. 13 confirming literature data obtained from LCMS and MALDI studies to determine molecular weights of oligomeric structures.47
Fig. 13. Chemical structures of the four predominant derivatives of lignin pH 2: (a) phenol, 2-methoxy (guaiacol); (b) phenol, 2-methoxy-5-methyl; (c) phenol, 4-ethyl-2-methoxy (p-ethylguaiacol) (d) acetophenon, 4-hydroxy-2-methyl.
In addition, other compounds were detected such as ethanon, 1-(3-hydroxy-4-methoxyphenyl) and vanillin which are both derived from G-units. References for more compounds derived from H-units are o- and p-cresol and methyl-(2-hydroxy-3-ethoxybenzyl)-ether. Most of the compounds formed during pyrolysis are phenolic molecules which are methoxy or hydroxy substituted in ortho position confirming the dominant abundance of G units (compared to S and H units). These observations are in line with the results obtained from FTIR spectroscopy, confirming the softwood lignin characteristics.
3.2. Lignin-derived polyurethanes (LPU)
The LPU coatings were prepared using different monomer ratios and 40 μg TEA given in Table 4
In the absence of a catalyst, the electrophilic carbon of the isocyanate is attacked by the nucleophilic active hydrogen-containing compound, adding the hydrogen to the NCO group. The reactivity of the NCO groups is increased due to the presence of electron withdrawing groups. While aromatic isocyanates are more reactive than aliphatic ones, steric hindrance at NCO groups reduces the reactivity. For OH, the reactivity decreases from primary to tertiary alcohols with lowest values for phenolic OH. Isocyanate reactions are influenced to different extents by different catalysts. Tertiary amines and metal compounds (tin) are most widely used catalysts for polyurethane synthesis. The catalytic activity of tertiary amines closely parallels to the base strength of the amines except when steric hindrance becomes pronounced.48–50 In our studies, catalytic effects could even be observed influencing the PU coating quality, in particular the homogeneity of the coating surface. In general, tertiary amines influence the crosslinking density thereby also improving the coating stability, an effect also observed by other groups.31,32
To get a first idea of the homogeneity of the lignin-derived coatings, they were observed via reflected light microscopy showing that homogeneous coatings could be obtained using lignins of Mn < 500 g mol−1 (equivalent Mw < 1570 g mol−1) and OH-numbers above 5 mmol g−1 (samples isolated at pH 4 and 5).
Using scanning electron microscopy (SEM), the thickness of spin-coated films was determined to range between 150–160 μm (Fig. 14).
Fig. 14. Left: light microscopy of the border area of the coating; middle: SEM analysis to determine the thickness (158,7 μm); right: SEM showing the smooth surface of the coating.
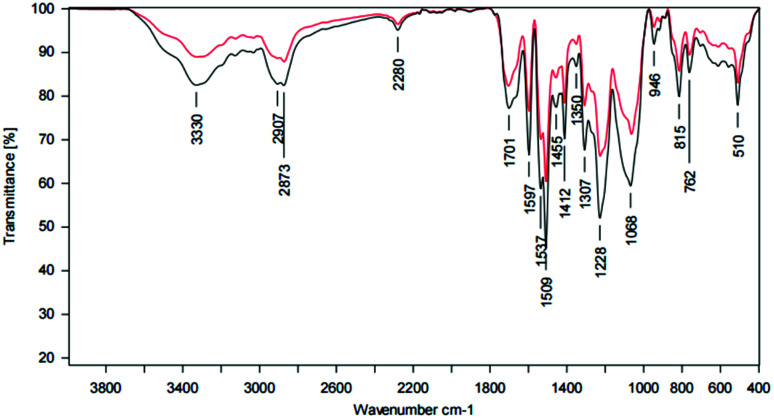
ATR-IR analysis revealed a broad band at 3331 cm−1, slightly shifted to lower wavenumbers and indicates the N–H stretching of secondary amines, like they are present in urethane groups. Moreover, the C O stretching of carbonyl groups in urethanes at 1703 cm−1, the deformation of –NH or –NH2 at 1597 cm−1, the C–O stretching of esters at 1307 cm−1 and 1065 cm−1 and the C–N stretching of urethane groups at 1225 cm−1 also prove the existence of urethane groups in the coatings, claiming that the synthesis was successful. There were still some traces of the educts left, as the N C O stretching of the isocyanates at 2279 cm−1 shows. The comparison of coatings with and without TEA, respectively, showed clear differences for the N C O stretching band and isocyanate residuals. NCO excess was chosen due to the sterically hindered hydroxy groups within the complex lignin structure (Fig. 15, Table 5).
Fig. 15. ATR spectrum of a LPU coating (lignin isolated at pH 4, 20% PEG425) with TEA (black curve) and without TEA (red curve).
Assignment of ATR spectra of LPU coatings (lignin pH 2, 20% PEG425) with and without TEA.
| Wavenumber [cm−1] | Peak location [cm−1] | Assignment of absorption bands |
|---|---|---|
| 3331 | 3350–3310 | N–H stretching of secondary amines |
| 2911 | 3000–2842 | C–H stretch in methyl and methylene groups |
| 2873 | 2880–2670 | O–CH3 stretching |
| 2279 | 2270 | N C O stretching |
| 1703 | 1740–1690 | C O stretching of carbonyl groups in urethanes |
| 1597 | 1650–1550 | Deformation of –NH or –NH2 |
| 1509 | 1515–1505 | Aromatic skeleton vibrations of G-units |
| 1412 | 1470–1400 | C–H deformation of saturated hydrocarbons (–CH2 and –CH3) |
| 1307 | 1330–1050 | C–O stretching of esters |
| 1225 | 1224 | C–N stretching of urethane groups |
| 1065 | 1330–1050 | C–O stretching of esters |
| 815 | 840–800 | Benzene ring with 2 adjacent H-atoms: 1,4-disubstitution; 1,3,4-trisubstitution etc. |
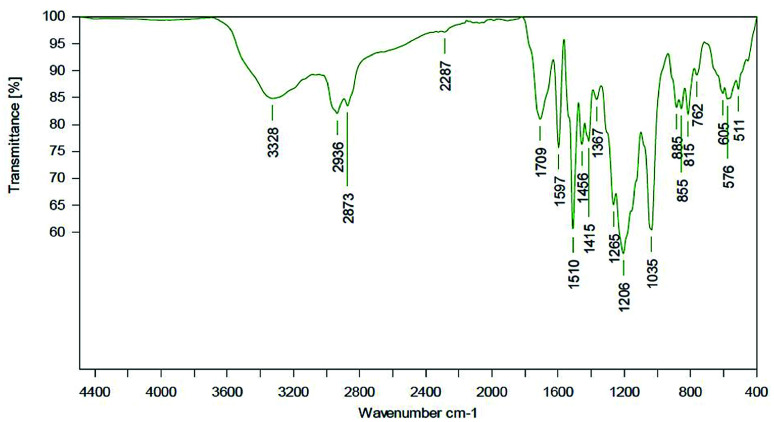
Most probably, deprotonated phenolates catalyze isocyanate reaction (with other isocyanates and/or urethanes) resulting in trimer and allophanate signals.51,52 During process optimization, the NCO residuals could further be reduced to a very weak signal (Fig. 16).
Fig. 16. ATR spectrum of a LPU coating (lignin isolated at pH 4, 20% PEG425) with TEA. LPU prepared with lignin isolated at pH 4, and PPG425 (20%).
TGA measurements were performed to describe and evaluate the thermal stability of both, the kraft lignins and the corresponding LPU coatings (Table 6).
The lignins, isolated at different pH values, show three thermal degradation signals in the range of 130–580 °C. The weight loss can be assigned to evaporation of solvent/water (first signal), followed by splitting of monolignol linkages, in particular α- and β-aryl-alkyl-ether linkages, aliphatic chains and decarboxylation reactions, respectively. The main mass loss for LPU coatings at 356 and 360 °C most obviously can be assigned to C–C-bond splitting of monolignol units and OH groups with a slight difference between catalysed and uncatalyzed LPU.32
3.3. Solvent resistance of LPU coatings
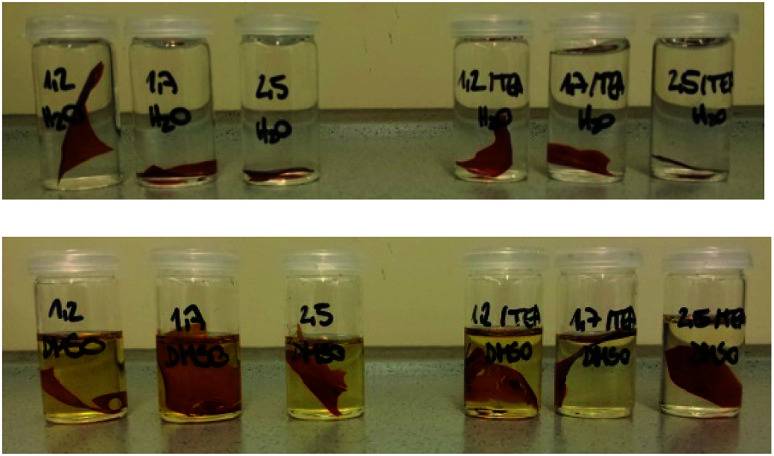
The solvent resistance of the LPU coatings was examined in DMSO, THF and water. While the coatings were partially soluble in DMSO most probably due to lignin residuals, they were very stable in water. As shown in Fig. 17, with increasing NCO : OH ratio the color intensity decreased. In addition, there was a difference in swelling behavior and solvent resistance depending on the use of catalyst: when TEA was added during PU formation, the samples in DMSO were less colored. In case of NCO : OH ratio of 1.7 and 2.5, respectively, using TEA, the samples did not show any color (Fig. 17, second row, right side).
Fig. 17. Swelling tests in water (top) and DMSO (bottom) of lignin-PU coatings using KL isolated at pH 4, 20 wt% PPG 425, and NCO : OH ratios from left to right: 1.2, 1.7 and 2.5 (without TEA) and 1.2, 1.7 and 2.5 (with TEA), respectively.
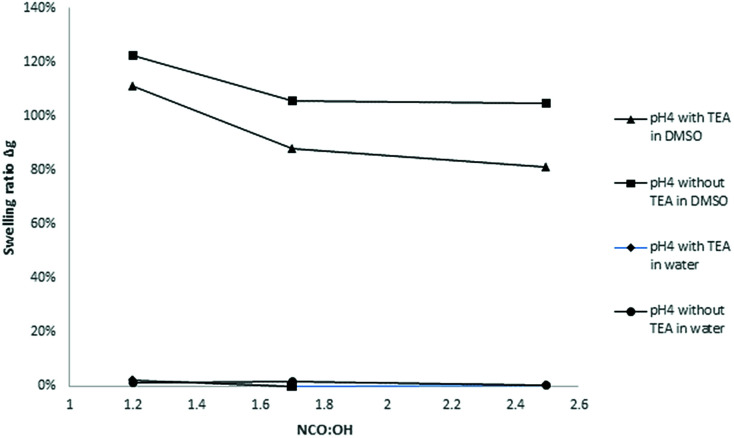
The swelling rate was calculated according to Jia et al.31 where Δg1 is the weight after swelling and Δg0 is the weight before swelling. In Fig. 18, the swelling ratios of coatings based on lignin pH 4 with 20% PPG425 in dist. water and DMSO are plotted against the NCO : OH ratio.
Fig. 18. Influence of the NCO : OH molar ratio on the swelling ratio Δg (coatings with lignin pH 4, 20% PPG425).
In water, the swelling ratio was constant and slightly positive for most of the investigated samples. As there is no coloring of the water, the coatings were quite stable in water. For further confirmation, the refractive index of the aqueous solution was determined proving that there are no other compounds dissolved in the water. The higher the NCO : OH ratio, the lower the swelling ratio in DMSO, which means that the LPU films showed increasing solvent resistance. Jia et al. also reported swelling tests of LPU in DMSO stating that the color of the DMSO solution after the swelling test gradually became less intense with the increase in the NCO : OH molar ratio.
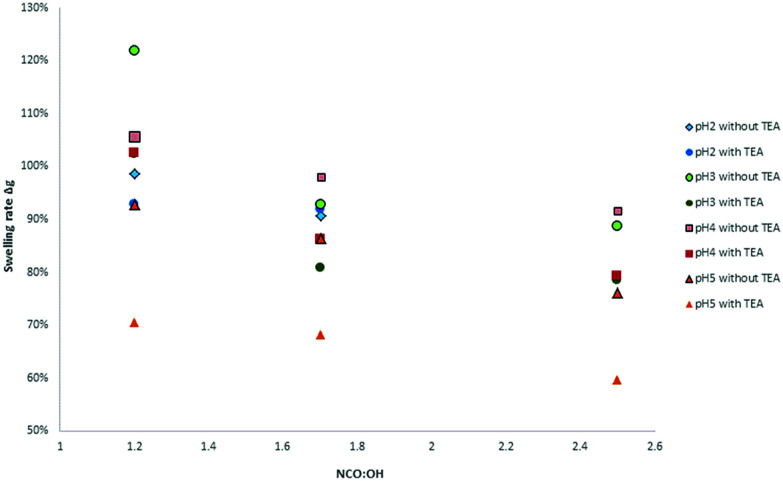
Moreover, the swelling ratios significantly decreased with increasing NCO : OH ratio (from 1.2 to 2.5). These observations are in accordance with the results of Jia et al.31 At higher NCO : OH ratios, the crosslinking density will be enhanced to a certain extent limited to the formation of allophanates. With NCO : OH ratios higher than 1.7, there is just a small increase possible without trimerization (Fig. 19).
Fig. 19. Dependency of NCO : OH ratio of various lignins on the swelling rate in DMSO.
Furthermore, there were differences between the coatings with and without TEA for the swelling test in DMSO. Coatings without TEA showed a higher swelling ratio and more intense coloring of the DMSO after swelling compared to TEA containing coatings. Besides catalyst activity, the TEA effect might be discussed in terms of ammonium phenolate salt formation and subsequent effects on solubility and hydrogen bridge formation.
Via simple solution casting, highly flexible coatings could be prepared (Fig. 20). In ongoing studies, the thickness of the films will be varied systematically in order to study corresponding relationships regarding the mechanical stability.
Fig. 20. Flexible lignin-PU coatings of different color intensity according to the lignin content up to 70% synthesized with KL isolated at pH 4.
Surface roughness and coating homogeneity of the lignin-derived polyurethanes were investigated using atomic force microscopy (AFM). Studies were performed in order to show influence of purification and preparation on surface roughness. Results showed that the synthesis optimization methods resulting in improved homogeneity with roughness ranging between 10–28 nm (Fig. 21).
Fig. 21. Coatings prepared according to standard PU synthesis from left to right: using lignin (pH 2) without TEA; lignin (pH 3) without TEA; lignin (pH 4) and TEA, drying temperature 40 °C/24 h.
Wide angle X-ray scattering (WAXS) and XRD studies are ongoing to compare commercial fossil-based polyurethanes with the lignin-derived samples particularly regarding their morphological details. Previous studies on commercially relevant samples showed differences depending on nature and length of the corresponding chain extenders.53 Furthermore, it might be essential to study storage effects due to potential lignin degradation. For kraft lignin samples purified by selective extraction, we observed depolymerization processes initiated by temperature and UV irradiation, respectively.28,54
The wettability properties of the surfaces of all lignin-based PUs were investigated by means of static contact angle measurements against water (Table 7). The LPU coatings possess a rather hydrophobic character with water contact angles θH2O up to 92 degree, higher than literature data for LPUs reported by Jia et al. prepared from organosolv lignin (61 °C)32 and Griffini et al. using Me-THF-extracted lignins (84.4°)32
4. Conclusions
This study aimed to describe utilization of technical black liquor and resulting kraft lignin as a renewable resource for the production of bio-based polyurethane coatings for application in areas such as construction. In difference to published studies using organic solvents at high temperature, the lignin samples in this study were isolated via acidic precipitation at room temperature from aqueous solution. In addition, polyurethane crosslinking was achieved at mild reaction conditions working at mild temperatures of 35 °C maximum. For the first time, the lignin amount could be increased up to 80 wt%. Subsequent film formation via spin-coating resulted flexible transparent coatings of high homogeneity. TGA measurements revealed T50% values of 360 °C for the LPU films. Wettability tests using optical contact angle measurements against water showed θH2O values up to 92° confirming the hydrophobic character of the LPU coatings. Nanoindentation studies are ongoing in order to develop structure–property-relationships regarding mechanical stability of the LPUs.
Conflicts of interest
There are no conflicts to declare.
Supplementary Material
Acknowledgments
This research was supported by the Federal Ministry of Education and Research (BMBF) program “IngenieurNachwuchs” project LignoBau (03FH013IX4). The authors gratefully acknowledge Zellstoff- und Papierfabrik Rosenthal GmbH (Blankenstein, Germany, MERCER group) for providing the black liquor. We thank Manuela Schebera, Bonn-Rhein-Sieg University of Applied Sciences performing the AFM measurements, and Dr Christian Pritzel, University Siegen for the REM studies.
References
- Engels H.-W. Pirkl H.-G. Albers R. Albach R. W. Krause J. Hoffmann A. Casselmann H. Dormish J. Angew. Chem. 2013;125:9596–9616. doi: 10.1002/ange.201302766. [DOI] [PubMed] [Google Scholar]
- Datta J. Kasprzyk P. Polym. Eng. Sci. 2018;58:E14–E35. doi: 10.1002/pen.24633. [DOI] [Google Scholar]
- Hemmilä S. Adamopoulos O. Karlsson A. Kumar A. RSC Adv. 2017;7:38604–38630. doi: 10.1039/C7RA06598A. [DOI] [Google Scholar]
- Albach R., Innovation and legislation on blowing agents in PUR rigid foams, in Natural Foam Blowing Agents, Sustainable Ozone- and Climate-Friendly Alternatives to HCFCs, ed. V. Hasse, L. Ederberg, R. Kirch, I. C. Croiset and J. Usinger, Deutsche Gesellschaft für Technische Zusammenarbeit (GTZ) GmbH, Bonn, 2009 [Google Scholar]
- Zhu S. Chen K. Xu J. Li J. Mo L. RSC Adv. 2018;8:15754. doi: 10.1039/C8RA01089G. [DOI] [PMC free article] [PubMed] [Google Scholar]
- Duval A. Lawoko M. React. Funct. Polym. 2014;85:78–96. doi: 10.1016/j.reactfunctpolym.2014.09.017. [DOI] [Google Scholar]
- Joshi M. Adak B. Butola B. S. Prog. Mater. Sci. 2018;97:230–282. doi: 10.1016/j.pmatsci.2018.05.001. [DOI] [Google Scholar]
- Marked Analysis: Polyurethane Chemicals and Products in Europe, Middle East and Africa (EMEA) Non-Foam Products: Coatings, IAL Consultants, London, 2012, vol. 3, sect. 1 [Google Scholar]
- Datta J. Włoch M. Polym. Bull. 2015;73:1459–1481. doi: 10.1007/s00289-015-1546-6. [DOI] [Google Scholar]
- Ionescu M., Chemistry and Technology of Polyols for Poly-urethanes, Rapra Technology, 2005, ISBN 1-85957-491-2 [Google Scholar]
- Kamm B., Gruber P. R. and Kamm M., Biorefineries-Industrial Processes and Products, in Ullmann's Encyclopedia of Industrial Chemistry, Wiley-VCH, Weinheim, 2016 [Google Scholar]
- Alzagameem A., El Khaldi-Hansen B., Kamm B. and Schulze M., in Biomass and Green Chemistry, Springer, 2018, pp. 95–132, ISBN 978-3-319-66736-2 [Google Scholar]
- Kamm A., Kamm M., Hirth T. and Schulze M., in Biorefineries – Industrial Processes and Products, M. Kamm., B. Kamm and P. C. Gruber, Wiley-VCH, Weinheim, 2006, vol 2, pp. 97–150. ISBN 3-527-31027-4 [Google Scholar]
- Hansen A., Kamm B. and Schulze M., in Analytical Techniques and Methods for Biomass Products, ed. S. Vaz Jr and P. Seidl, Springer, 2017, pp. 15–44, ISBN 978-3-319-41414-0. 10.1007/978-3-319-41414-0 [DOI] [Google Scholar]
- Bozell J. J., Chmely S. E., Hartwig W. H., Kye R., Labbe N., enugopal P. V. and Zuleta E., in Lignin Valorization: Emerging Approaches, ed. G. T. Beckham, Royal Society of Chemistry, 2018, pp. 21–61, ISBN 1782625542, 9781782625544 [Google Scholar]
- Hansen B. Kusch P. Schulze M. Kamm B. J. Polym. Environ. 2016;24:85–97. doi: 10.1007/s10924-015-0746-3. [DOI] [Google Scholar]
- Schulze P. Seidel-Morgenstern A. Lorenz H. Leschinsky M. Unkelbach G. Bioresour. Technol. 2016;199:128–134. doi: 10.1016/j.biortech.2015.09.040. [DOI] [PubMed] [Google Scholar]
- Lignin Market Analysis by Product (Lignosulphonates, Kraft Lignin, Organosolv Lignin) by Application (Macromolecules, Aromatics), by Region (North America, Europe, APAC, Central & South America, MEA), and Segment Forecasts, 2014–2025, ID: 4240413 Report, Grand View Research, San Francisco, CA, USA, 2017, p. 110 [Google Scholar]
- Lignin Market—Forecasts from 2018 to 2023, ID: 4479455, Knowledge Sourcing Intelligence LLP, Noida, India, 2018, p. 104 [Google Scholar]
- Rinaldi R. Jastrzebski R. Clough M. T. et al. . Angew. Chem., Int. Ed. 2016;55:2–54. doi: 10.1002/anie.201510351. [DOI] [PMC free article] [PubMed] [Google Scholar]
- Liu H. Chung H. J. Polym. Sci. 2017;55:3515–3528. doi: 10.1002/pola.28744. [DOI] [Google Scholar]
- Kurple K., US. Pat., PCT/US96/20140, WO97/24362, 2000
- Richter A. P. Brown J. S. Bharti B. et al. . Nat. Nanotechnol. 2015;10:817–824. doi: 10.1038/nnano.2015.141. [DOI] [PubMed] [Google Scholar]
- Sipponen M. H. Farooq M. Koivisto J. Pellis A. Seitsonen J. Österberg M. Nat. Commun. 2018;9:2300. doi: 10.1038/s41467-018-04715-6. [DOI] [PMC free article] [PubMed] [Google Scholar]
- Witzler M. Alzagameem A. Bergs M. et al. . Molecules. 2018;23:1885. doi: 10.3390/molecules23081885. [DOI] [PMC free article] [PubMed] [Google Scholar]
- Fache M. Boutevin B. Caillol S. ACS Sustainable Chem. Eng. 2016;4:35–46. doi: 10.1021/acssuschemeng.5b01344. [DOI] [Google Scholar]
- Li R. J. Gutierrez J. Chung Y. L. Frank C. W. Billingtonc S. L. Sattely E. S. Green Chem. 2018;20:1459. doi: 10.1039/C7GC03026F. [DOI] [Google Scholar]
- Alzagameem A. El Khaldi-Hansen B. Büchner D. et al. . Molecules. 2018;23:2664. doi: 10.3390/molecules23102664. [DOI] [PMC free article] [PubMed] [Google Scholar]
- Saraf V. P. Glasser W. G. Wilkes G. L. McGrath J. E. J. Appl. Polym. Sci. 1985;30:2207–2224. doi: 10.1002/app.1985.070300533. [DOI] [Google Scholar]
- Gouveia J. R. da Costa C. L. Tavares L. B. Dos Santos D. J. Mini-Rev. Org. Chem. 2018;15 doi: 10.2174/1570193X15666180514125817. [DOI] [Google Scholar]
- Jia Z. Lu C. Zhou P. Wang L. RSC Adv. 2015;5:53949–53955. doi: 10.1039/C5RA09477A. [DOI] [Google Scholar]
- Griffini G. Passoni V. Suriano R. Levi M. Turri S. ACS Sustainable Chem. Eng. 2015;3:1145–1154. doi: 10.1021/acssuschemeng.5b00073. [DOI] [Google Scholar]
- García A. Toledano A. Serrano A. Egüés I. González M. Marín F. Labidi J. Sep. Purif. Technol. 2009;68:193–198. doi: 10.1016/j.seppur.2009.05.001. [DOI] [Google Scholar]
- Pan X. Saddler J. N. Biotechnol. Biofuels. 2013;6:12–21. doi: 10.1186/1754-6834-6-12. [DOI] [PMC free article] [PubMed] [Google Scholar]
- ISO International Standard 14900 (2001), Plastics – polyols for use in the production of polyurethane – determination of hydroxyl number, reference number ISO 14900:2001 (E)
- Argyropoulos D. S. Granata A. J. Agric. Food Chem. 1995;43:1538–1544. doi: 10.1021/jf00054a023. [DOI] [Google Scholar]
- Lupoi J. S. Singh S. Parthasarathi R. Simmons B. A. Henry R. J. Renewable Sustainable Energy Rev. 2015;49:871–906. doi: 10.1016/j.rser.2015.04.091. [DOI] [Google Scholar]
- Liu W.-J. Jiang H. Yu H.-Q. Green Chem. 2015;17:4888–4907. doi: 10.1039/C5GC01054C. [DOI] [Google Scholar]
- Schutyser W. Renders T. Van den Bosch S. Koelewijn S. F. Beckham G. T. Sels B. F. Chem. Soc. Rev. 2018;47:852–908. doi: 10.1039/C7CS00566K. [DOI] [PubMed] [Google Scholar]
- Jiang Z.-H. Argyropoulos D. S. Grantana A. Magn. Reson. Chem. 1995;33:375–382. doi: 10.1002/mrc.1260330509. [DOI] [Google Scholar]
- Pu Y. Cao S. Ragauskas A. J. Energy Environ. Sci. 2011;4:3154–3166. doi: 10.1039/C1EE01201K. [DOI] [Google Scholar]
- Nacas A. M. Ito N. M. De Sousa Jr R. R. Spinacé M. A. Dos Santos D. J. J. Adhes. 2016:18–29. [Google Scholar]
- Cateto C. A. Barreiro M. F. Rodrigues A. Brochier-Salon M. C. Thielemans W. Belgacem M. N. J. Appl. Polym. Sci. 2008;109:3008–3017. doi: 10.1002/app.28393. [DOI] [Google Scholar]
- Cateto C. A. Barreiro M. F. Rodrigues A. E. Naceur Belgacem M. React. Funct. Polym. 2011;71:863–869. doi: 10.1016/j.reactfunctpolym.2011.05.007. [DOI] [Google Scholar]
- Mohammadali A. Haiming G. A. Mahesh B. Shulin C. Int. J. Biol. Macromol. 2015;75:58–66. doi: 10.1016/j.ijbiomac.2014.12.049. [DOI] [PubMed] [Google Scholar]
- Saariaho A. M. Argyropoulos D. S. Jaeaeskelaeinen A. S. Vuorinen T. Vib. Spectrosc. 2005;37:111–121. doi: 10.1016/j.vibspec.2004.08.001. [DOI] [Google Scholar]
- Saariaho M. Jaaskelainen A. S. Nuopponen M. Vuorinen T. Appl. Spectrosc. 2003;57:58–66. doi: 10.1366/000370203321165214. [DOI] [PubMed] [Google Scholar]
- Sharmin E. and Zafar F., Polyurethane, Polyurethane: An Introduction, ed. F. Zafar and E. Sharmin, IntechOpen, 2012, 10.5772/51663. available from: https://www.intechopen.com/books/polyurethane/polyurethane-an-introduction [DOI] [Google Scholar]
- Gora R. Hutta M. Vrska M. Katuscak S. Jablonsky M. J. Sep. Sci. 2006;29:2179–2189. doi: 10.1002/jssc.200600048. [DOI] [PubMed] [Google Scholar]
- Mohammadali A. Haiming G. A. Mahesh B. Shulin C. Int. J. Biol. Macromol. 2015;75:58–66. doi: 10.1016/j.ijbiomac.2014.12.049. [DOI] [PubMed] [Google Scholar]
- Joshi M. Adak B. Butola B. S. Prog. Mater. Sci. 2018 doi: 10.1016/j.pmatsci.2018.05.001. [DOI] [Google Scholar]
- Lang M. Shrestha U. M. Dadmun M. Front. Energy Res. 2018;6:4. doi: 10.3389/fenrg.2018.00004. [DOI] [Google Scholar]
- Walbrück K. Schulze S. E. Klein M. Witzleben St. J. Chem. Chem. Eng. 2016;9:494–499. [Google Scholar]
- Do X. T. Nietzsch A. Jung C. Witzleben S. Schulze M. Preprint. 2017:2017100128. [Google Scholar]


