Abstract
Ship emulsified oil wastewater was used as the research object in this study. The highly efficient coagulant demulsification degreasing mechanism and microbubble flotation technology were combined and the effects of coagulant type and dosage amount on the demulsification of emulsified oil wastewater were evaluated. The influence of the mixed coagulation effect of pH values, temperature, and hydraulic condition parameters were determined and water intake, air intake, and oil content were regulated. The coagulant for the demulsification of emulsified oil wastewater was screened; the dosage was 500 mg L−1, and the removal capacity of the coagulant was in the following order: polyaluminum ferric chloride (PAFC) > polyaluminum chloride (PAC) > polysilicate aluminum ferric sulfate (PSAFS) > alum > Al2(SO4)3 > polyferric sulfate > FeCl3. Polyacrylamide (PAM) with added water was used to further reduce the oil content. The PAFC, PAC, and PSAFS were selected as coagulation–air flotation dynamic test alternative agents. The investment quantities of PAFC, PSAFS and PAM were 300 mg L−1, 300 mg L−1 and 30 mg L−1, respectively. The stirring time was 5 min, the pH value was 6.5–6.9, the flow rate was 0.25 m3 h−1, the oil content of the emulsified oil wastewater was 3000–5000 mg L−1 and the effluent oil was stable below 15 ppm. The microbubble generation device using air flotation effluent was used in the two air flotation treatments to enhance the device efficiency. The air flotation device adopted the structural design of the upper part of the water inlet and the lower part of the micro-air bubble, which can increase the collision probability of the microbubble and improve the efficiency of oil removal.
Ship emulsified oil wastewater was used as the research object in this study.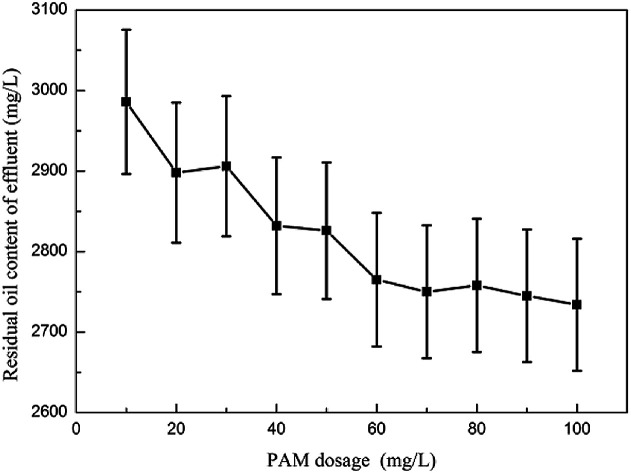
1. Introduction
With economic development in recent years, the number of ships has increased significantly and the existing oil–water separation devices cannot effectively treat oil-containing wastewater from ships that hold a large amount of emulsified oil.1 The discharge of untreated wastewater into seawater can seriously harm the marine ecological environment,2 therefore, the Marine Environment Protection Committee stipulates that the oil content in the discharged water body cannot exceed 15 ppm.3 However, the components are complex due to the fact that marine oil-bearing wastewater contains a large amount of surfactant emulsification and inorganic ions that contain iron, and the standards required by the Marine Environment Protection Committee are difficult to meet.4 The emulsified oil content in a ship's wastewater is relatively large due to the leakage from marine machinery and the heavy use of detergents.5 The emulsified oil particles in the wastewater have small particle size and a large viscosity, and the oil beads have a negative charge.6 If these particles are improperly treated, they will be discharged into natural water bodies and block the gas exchange, affect photosynthesis, destroy the ecological balance of the water body, contaminate the soil, and harm human health.7 In view of the difficulty in the treatment of emulsified oil wastewater and its serious environmental hazards, it must be treated thoroughly and economically with an emulsified oil wastewater treatment process and technology before being discharged into the water body.8 This treatment has important research value and practical significance for the protection of marine ecology and the development of ship emulsified oil wastewater treatment equipment.9
At the core of emulsified oil and oil wastewater treatment is the breaking of the emulsified oil.10 Breaking milk is generally divided into two processes, namely, flocculation and coalescence.11 The general methods for the demulsification of emulsified oils include physical, chemical, and biological methods. There are many types of coagulants, and they can be divided according to chemical composition into inorganic, organic, biological, and composite coagulants.12 The gravity method can only remove floating oil and dispersed oil.13 The coarse granulation method has a poor removal effect on emulsified oil. Both methods have poor treatment effects on emulsified oil in wastewater and have almost no demulsification capacity; they include membrane separation method and the adsorption method.14 Only wastewater with low oil content can be removed, it is easy to be blocked, and the cost is high; the biological treatment of oily wastewater has a long residence time and a large area, and the treatment effect on high-concentration oily wastewater is not ideal.15,16 Ultrasonic wave is a new treatment method of demulsification and degreasing; however, the technology is not sufficiently developed, the treatment effect on high-concentration emulsified oil wastewater is not ideal, it has not been widely used, and its processing cost is high.17 As an efficient chemical pretreatment method, the coagulation method can effectively remove slicks, emulsified oils, suspended solids, COD, and turbidity in oily wastewater.18 With microbubble flotation, the wastewater can be treated to reduce the oil content and the turbidity of the effluent.19 Therefore, coagulant and a new type of super-microbubble-generating device were selected in this study for treating emulsified oil wastewater.
The experiment was performed to study the effects of inorganic coagulant, inorganic polymer coagulant, and its combination with polyacrylamide (PAM) on ship-borne emulsified oil wastewater. Two factors, namely, the dosage of coagulant and the content of emulsified oil, were selected to test the emulsified oil wastewater under the same hydraulic conditions. The oil content of the effluent was measured to compare and screen out the optimal coagulant and dosage. The emulsified oil wastewater was treated at different reaction times, stirring speeds, reaction temperatures, pH values, and emulsified oil concentrations to select the best reaction conditions. Under this hydraulic condition, the coagulation and microbubbles were combined and reacted in an air flotation device to study the influences of factors, such as the amount of air bubbles, the content of oil in the water, the PAM, and the flow rate of the influent on the oil removal of the device. The oil content of the water, the thickness of the dross layer, and the observed water content of the dross were compared, and the parameter range for the treatment of the emulsified oil wastewater was confirmed by the coagulation–microbubble flotation device.
2. Materials and methods
2.1. Materials
The used agents, including aluminum sulfate, alum (KAl(SO4)2·12H2O), ferric chloride, polyaluminum chloride (PAC), polyferric sulfate (PFS), polyaluminum ferric chloride (PAFC), polyaluminum polysilicate (PSAF), PAM, sulfuric acid, sodium chloride, magnesium sulfate, anhydrous sodium sulfate, sodium hydroxide, zinc sulfate, manganese sulfate, sodium silicate, sodium chlorate, ferrous sulfate, petroleum ether, sodium dodecyl benzene sulfonate, and triiron tetroxide, were of analytical grade. They were acquired from Nanjing Shengjianquan Co. Ltd. The test wastewater was prepared by the method defined in MEPC.60 (33). The emulsified oil wastewater was tan in color. Table 1 lists the specific parameters.
Physicochemical properties of the emulsified oil wastewater.
| Oil content (mg L−1) | Turbidity (NTU) | pH value | Oil droplet diameter (μm) | COD (mg L−1) |
|---|---|---|---|---|
| 3000–5000 | 7000–10 000 | 6.5–6.8 | 10–15 | 7800–17 000 |
2.2. Coagulation–flotation experiments
Different doses of coagulant were added to the emulsified oil wastewater of a ship, and the wastewater was treated with PAM. The ship had an oil content of 3000–5000 mg L−1. The coagulation test was conducted to obtain the oil content in the clear water layer, and the data were plotted to compare the degreasing effects of different coagulants. A 1000 mL beaker was used to collect emulsified oil wastewater containing a certain amount of oil in a six-line mixer. Different doses of coagulant were added to the beaker and stirred rapidly at 800 rpm for 1 min and with medium speed at 150 rpm for 5 min. The coagulant was also slowly stirred at 50 rpm for 10 min and precipitated for 15 min. The supernatant (100 mL) was extracted from the beaker to determine the absorbance of the supernatant in each beaker by ultraviolet spectrophotometry, and its oil content was calculated. The air flotation device diagram is shown in Fig. S1.† The coagulation–microbubble flotation device flowchart is shown in Fig. S2.†
The test flotation device was made of plexiglass with a device height of 0.6 m, a diameter of 0.3 m, and a device volume of 42.39 L. The height of the contact chamber was 0.4 m, the diameter of the contact chamber was 0.15 m, the water-collecting pipe was 0.1 m from the bottom of the air flotation device, the inner diameter was 0.025 m, and a collecting hole with an aperture of 6 mm was set every 30°. The slag tap had an inner diameter of 0.05 m and was located 0.05 m from the top of the device. The inlet diameter of the air flotation device, inlet pipe, and outlet pipe was 0.025 m, and the inner diameter of the emptying pipe was 0.01 m. The microbubble generator used in this experiment was a new type of super-microbubble generator. The inlet pressure varied according to the type of microbubble generator. Therefore, the air-floating pressure was adjusted by changing the intake air volume in this test. The equipment required for the test was connected in accordance with the test procedure shown in the figure. A certain amount of fresh water was added to the initial startup water for the super-microbubble generator in the air flotation unit. After normal operation, the effluent of the air flotation unit would act as an ultramicron system. The prepared emulsified wastewater with approximately 5000 mg L−1 of oil content was put into the water tank to be tested. The valve of the water tank was opened to be tested. The water pump 1, dosing pump 1 (plus PAFC) and dosing pump 2 (plus PAM) were switched on. The influent flow was adjusted to 0.25 m3 h−1. The stirrer was opened to stir. The stirring speed was set constant to 350 rpm for 5 min. The outlet valve of the stirring chamber was turned on, and the microbubble generator was started to allow the outlet water and microbubbles to enter the flotation device. After the flotation device became stable, the water sample was taken from the outlet of the flotation device every 5 min for three times and then every 10 min. The thickness of the scum layer in the flotation device was measured and recorded before sampling. After the end of the test, the absorbance of the water sample was measured by ultraviolet spectrophotometry, and the oil content was calculated.
3. Results and discussion
3.1. Optimization of the flocculation process
The optimization of the flocculation processes is shown in Fig. S2–S9.† The emulsion demulsification performance of the coagulant oil wastewater was selected.20 When the dosage was 500 mg L−1, the demulsification capacity of the coagulant was in the order of polyaluminum silicate > PAC > polyaluminum ferrosilicate > alum > aluminum sulfate > polymeric iron sulfate > ferric chloride. The addition of PAM could further reduce the oil content of the effluent. Comprehensive consideration was given to the selection of PSAF, PAC, and polysilicate aluminum ferric sulfate (PSAFS) as alternative reagents for coagulation–air flotation dynamic tests.21 The PAFC dosage was 300 mg L−1, the PAM dosage was 30 mg L−1, the stirring speed was 350 rpm, the stirring time was 5 min, the pH value was 6.5–6.9, the flow rate was 0.25 m3 h−1, the oil content of the emulsified oil wastewater was 3000–5000 mg L−1, the effluent oil was basically stable below 15 ppm. When the PAFC dosage was 300 mg L−1, the PAM dosage was 30 mg L−1, the stirring speed was 350 rpm, and the stirring time was 5 min, the demulsification and degreasing effects of emulsified oil wastewater with oil content of 5000 ppm were the best.22
3.2. Flocculation process
3.2.1. The effect of PAM dosage on the oil removal performance
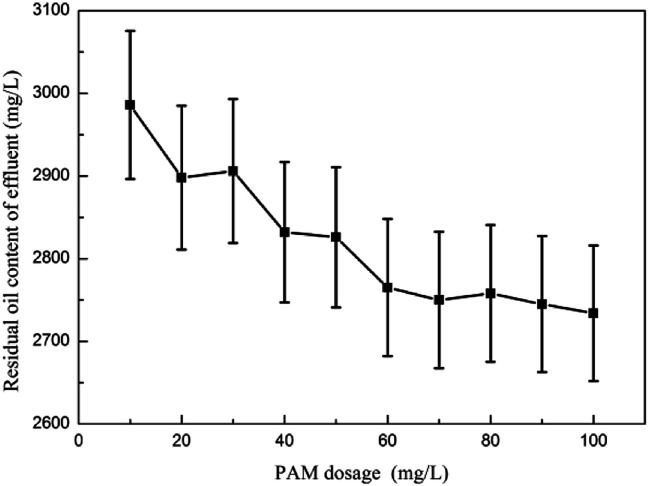
Fig. 1 shows the effect of PAM dosage on the oil removal performance. The test results showed that PAM had virtually no demulsification effect on the emulsified oil.23 The change in the effluent oil content was within the error range, no pods were formed within the reaction system, and the oil content of the influent water remained basically unchanged.24 When coagulant was added to remove oil, the interference of its separate demulsification and degreasing could be eliminated.
Fig. 1. The effect of PAM dosage on oil removal performance.
3.2.2. The effect of inorganic coagulant dosage on oil removal performance
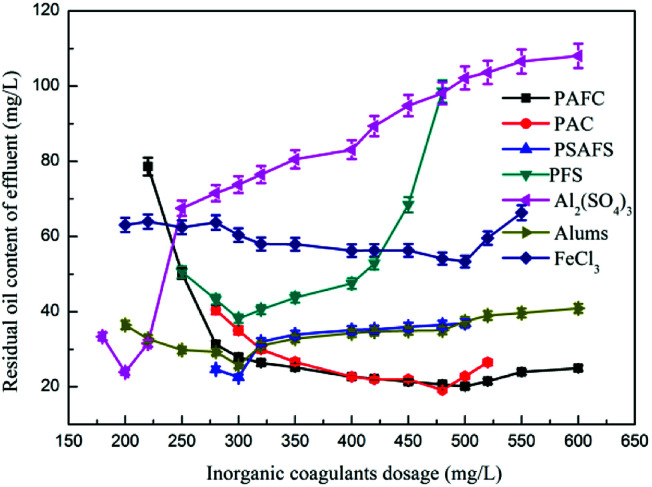
Fig. 2 shows the effect of inorganic coagulant dosage on the oil removal performance. Experiments showed that when Al2(SO4)3 was used as a demulsifier, the amount of flocs produced in the reaction system with increasing amount of Al2(SO4)3 was large and loose. When the Al2(SO4)3 dosage was 200 mg L−1, the effects of demulsification and degreasing on the emulsified oil wastewater were the best, and the oil content in the effluent was 23.87 mg L−1. When alum was used as a demulsifier, the amount of flocs produced in the emulsified oil wastewater was large and the floret was small and dense.25 After the agitation was completed, the floating speed of the flocs became slow, and the thickness of the scum layer became small. Small flocs that did not fully float were mixed easily.26 When the alum dose was 300 mg L−1, the effluent oil content after treatment was 25.70 mg L−1. When the dosage of aluminum salt coagulant was insufficient, the positively charged ions produced by the aluminum salt solution were insufficient to neutralize the negative charge in the system and the emulsion oil could not be fully demulsified and remained in the form of emulsified oil in water.27 When the dosage was extremely high, a large amount of positively charged aluminum ions would exist in the water, which would neutralize with the negatively charged colloidal particles to render the colloidal particles unstable again.28
Fig. 2. The effect of inorganic coagulant dosage on oil removal performance.
When FeCl3 was used as a coagulant to break the emulsion, fine and compact pods could be produced during stirring and coagulation, and the pods sank and settled slowly when standing. When the FeCl3 dosage was 500 mg L−1, the oil content of the treated water was 53.32 mg L−1. As the FeCl3 dosage gradually increased, the oil content of the effluent increased accordingly.
The emulsified oil wastewater was treated with PFS. The pods produced during the agitation process were small and dense, and the ash floated for a long time. A small amount of fine flocs remained in the effluent.29 The PFS dosage in the 250–400 mg L−1 effluent oil content was between 38.12 mg L−1 and 50.56 mg L−1. Insufficient or excessive dosage would cause a sharp increase in the effluent oil content because the PFS hydrolyzed into polynuclear hydroxy compounds in the wastewater, neutralized the negative charge in the oil particles, and reduced the zeta potential caused by the colloids.30 When a certain dosage was reached, this neutralization effect was maximized.31 When PFS continued to increase, the colloids became positively charged and the zeta potential increased, thereby making it stable. Continued dosing of PFS would destroy the equilibrium achieved.32
When PAC was used as a demulsification coagulant, a large amount of flocs could be produced by adding a small PAC dosage to the emulsified oil wastewater. The flocculation was large and dense, and the scum had a high oil content.33 The scum layer became thick and was stirred. The completion of the floc flotation speed then became slow, which left fine flocs in the water supernatant and affected the water content. When the dosage was 300–520 mg L−1, the effluent oil content could reach 16.78 mg L−1. The demulsification and coagulation performances of PAC on emulsified oil wastewater were better than those of inorganic aluminum salt coagulants such as aluminum sulfate and alum. PAC could be rapidly dissolved in wastewater, the reaction time for flocs was shortened, and the number of flocs produced increased. PAC contained a large amount of aluminum ion aggregates and was highly stable as compared with aluminum sulfate coagulants such as aluminum sulfate and alum.
When the PSAFS dosage was more than 260 mg L−1, the coagulant rapidly dissolved in the water and produced large and dense silk flowers and the floating speed was fast; however, the fresh water layer would retain a small amount of flocs, which affected the water quality. The PSAFS dosage in the 280–320 mg L−1 treatment reached 22.54 mg L−1, the scum layer was thin, and the water content was low. When the PSAFS dosage was 300 mg L−1, the demulsification effect on emulsified oil wastewater was the best. The effluent oil content was 22.54 mg L−1.
When PAFC was added separately to treat emulsified oil wastewater, it rapidly dissolved in the wastewater and produced a large number of large and dense flocs. With the increase in PAFC dosage, the floc volume increased considerably. When the PAFC dosage was less than 200 mg L−1, the effects of demulsification and coagulation were not obvious.34 When the PAFC dosage was in the range of 250–1000 mg L−1, the oil content in the effluent tended to be stable and the number of fine flocs in the water increased with the PAFC dosage. The final determination of the optimal dosage of PAFC was 300 mg L−1.
In summary, the inorganic polymer coagulant had better demulsification and degreasing effects on emulsified oil wastewater than inorganic coagulant. The iron salt coagulant had the color of iron in the water after treatment, and the deoiling effect was not ideal. PAFC, PAC, and PSAFS dosages and flocs were bulky and loose. The floating time was short, which was suitable for a wide pH range. From an economic perspective, PAFC, PAC, and PSAFS achieved better results in the treatment of emulsified oil wastewater when the dosage was relatively low. PAFC was selected as an alternative agent for the coagulation–air flotation test, and it was further compared with PAC and PSAFS through a combined dynamic test.
3.2.3. The effects of inorganic coagulants/PAM dosage on oil removal performance
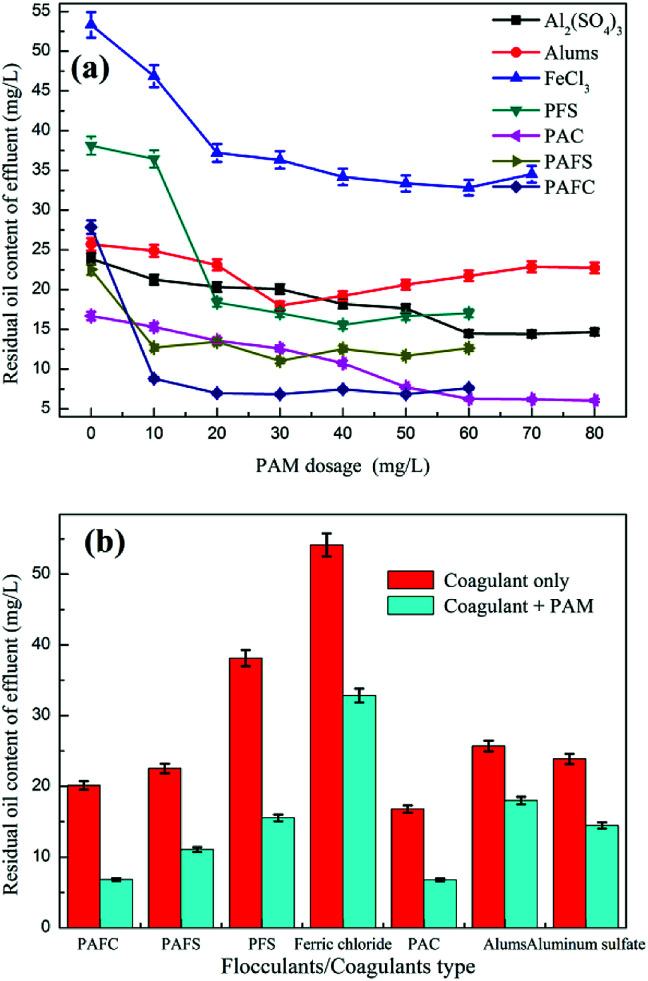
Fig. 3 shows the effect of inorganic coagulants/PAM dosage on the oil removal performance. The experiment showed that the addition of PAM could further reduce the oil content of the effluent. With the increase in the PAM dosage, the floc produced by Al2(SO4)3 dissolved in water was large and loose, and the flotation speed became faster in a shorter time; the inside could be fully floated. In the case when the PAM dosage was low, the floating speed of the flocs was slow. After standing was completed, the fine flocs remaining in the fresh water layer could not be fully floated. The alum complex PAM treatment of shipboard oily wastewater could complete the demulsification and coagulation processes under the condition that PAM was not added; however, the effects of demulsification and degreasing were slightly lower than those with aluminum sulfate. When the PAM dosage was greater than 20 mg L−1, the effluent oil content of FeCl3 tended to be stable. When FeCl3 coagulant was dissolved in water, the aqueous solution would have a certain color, thereby affecting the water color. When the PAM dosage was more than 20 mg L−1, the PFS water content could reach 18 mg L−1. The effect of the emulsified oil wastewater treatment presented the order of PAFC > PAC > PSAFS > PFS > aluminum sulfate > alum > ferric chloride. PAFC, PAC, and PSAFS combined with PAM degreasing could make the effluent oil approximately 10 mg L−1. However, PAFC and PAC alone used a large amount of 500 mg L−1, whereas PSAFS alone had a degreasing dose of 300 mg L−1. The PAFC dosage was considerably reduced when it was used in combination with PAM. In the dosage of 300 mg L−1 and 30 mg L−1 of PAM, the oil content in the effluent could be reduced to less than 10 mg L−1. The pods were large and loose and could be captured. In most of the emulsified oil in the reaction system, the scum floated fast, the water quality was high, and no small floc residue was observed.35 Although degreasing with 500 mg L−1 of PAC combined with 50 mg L−1 of PAM could reduce the oil content of the effluent to less than 10 mg L−1, the dosages of PAC and PAM were relatively large and the deliquescence in the air was difficult to preserve for a long time. When degreasing with 300 mg L−1 of PSAFS compounded with 10 mg L−1 of PAM, the effluent oil content was as small as approximately 10 mg L−1, and the pharmaceutical dosage was small. After the stirring was completed, the floating speed became less than the PAFC, which left a small amount of fine squid in the effluent and affected the water quality. PSAFS was difficult to store and was deliquescent, and the water easily blackened with PSAFS aqueous solution.
Fig. 3. The effects of inorganic coagulants/PAM dosage on oil removal performance.
3.3. Coagulation–flotation process
3.3.1. The effect of air intake on oil removal performance
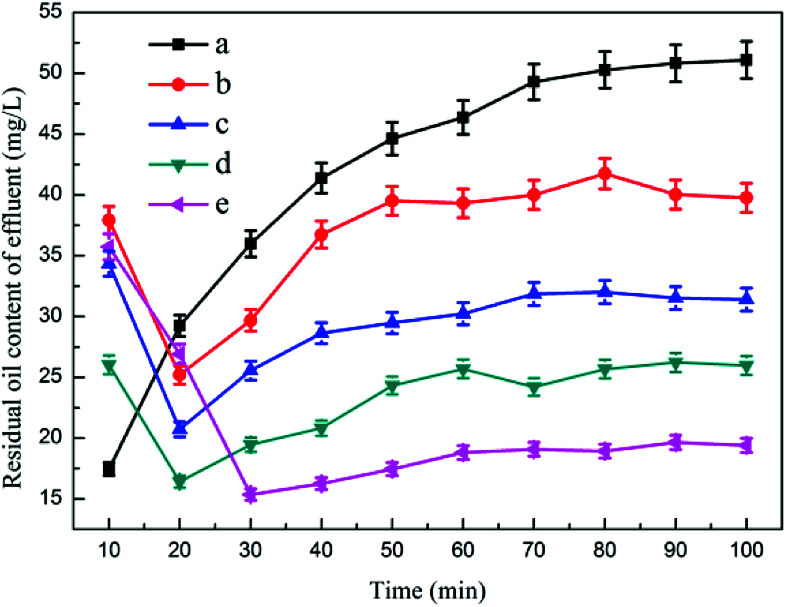
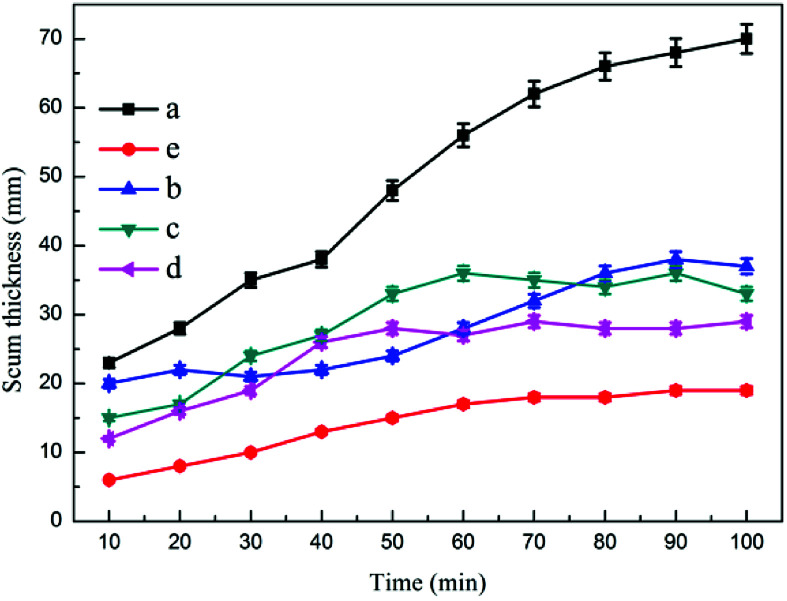
Fig. 4 and 5 show the effects of air intake on dynamic oil removal and chamber scum thickness, respectively. The test data showed that when the combined device was stable, the oil content in the effluent tended to be stable. As the flow rate of microbubbles in the reaction increased, the oil content in the effluent gradually decreased. The microbubbles would adsorb on the colloidal particles in the emulsified oil wastewater, which increased the buoyancy and flow thrust of the colloidal particles, thereby allowing them to rapidly float to the water surface, accelerating the solid–liquid phase separation, and increasing the amount of microbubbles.36 The probability of collision between bubbles and between bubbles and skeins in the reaction system increased, and the oil content of the effluent decreased accordingly. When no microbubbles floated in the flotation device, the thickness of the dross layer on the upper part of the device gradually increased, and the water content of the dross was high.37 The thickness of the dross layer gradually decreased with the steady flow of microbubbles, and the water content of the dross decreased.
Fig. 4. The effect of air intake on dynamic oil removal: (a) no aeration, (b) 0.25 m3 h−1, (c) 0.375 m3 h−1, (d) 0.5 m3 h−1, (e) 0.75 m3 h−1.
Fig. 5. The effect of air intake on chamber scum thickness: (a) no aeration, (b) 0.25 m3 h−1, (c) 0.375 m3 h−1, (d) 0.5 m3 h−1, (e) 0.75 m3 h−1.
3.3.2. The effect of PAM on oil removal performance
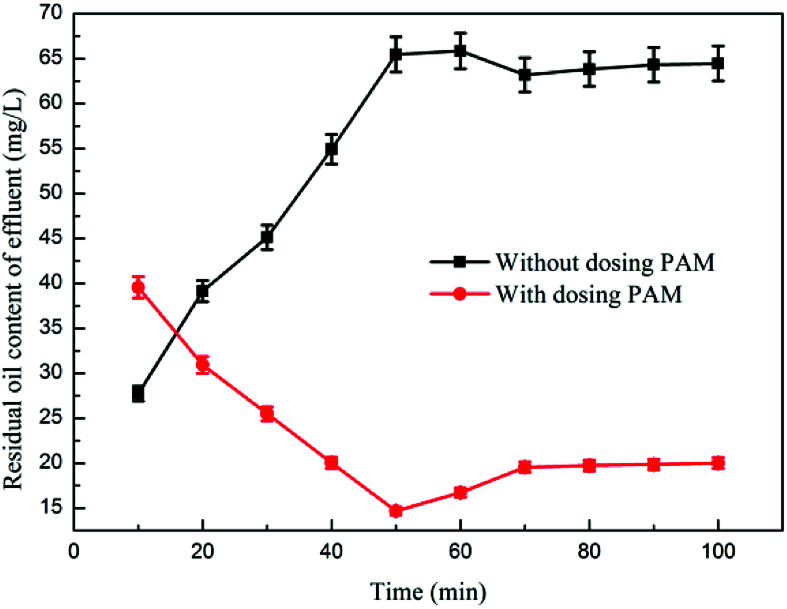
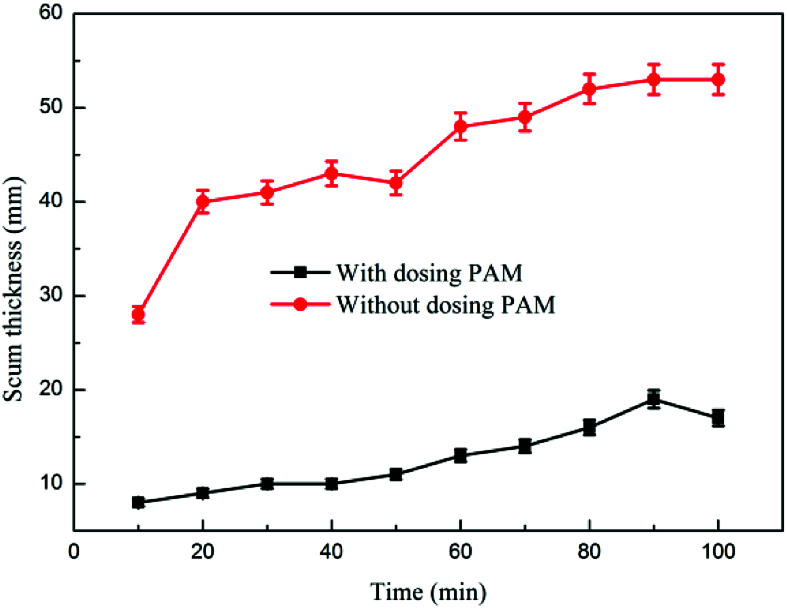
Fig. 6 and 7 show the effects of PAM on dynamic oil removal and scum layer thickness, respectively. The experimental data indicated that when the coagulation–microbubble flotation dynamic test was combined using an ultra-microbubble generator and an air flotation device, the coagulation–microbubble combination device could stably run out of water when no PAM dosage was set. Under the condition of adding PAM, the oil content at approximately 64 mg L−1 in the effluent initially decreased and then increased. As the test progressed, the oil content in the effluent gradually decreased and tended to be stable because the effluent of the previous test remained in the flotation device.38 In the first stage, the effluent oil remaining in the last test was high. As the test progressed, the microbubble-generating device was run by clear water, and it was added to the flotation device in the form of microbubbles. The oil content of the effluent was reduced in the flotation device. As the reaction continued, the remaining effluent was completely discharged. The water used by the microbubble generator was entirely supplied by the effluent from the air flotation chamber at the time the water was discharged.39 The oil content increased slightly and gradually stabilized at approximately 20 mg L−1. Without the addition of PAM, the thickness of the complicated layer in the air flotation device gradually increased with the test, and the dross had a high water content and could flow out from the slag discharge port. Under the condition of adding PAM, the thickness of the scum layer was small, the water content of the scum was low, and the entire scum was in a fluffy state and could not flow out from the slag discharge port.
Fig. 6. The effect of PAM on dynamic oil removal.
Fig. 7. The effect of PAM on scum layer thickness.
3.3.3. The effect of inlet flow rate on oil removal performance
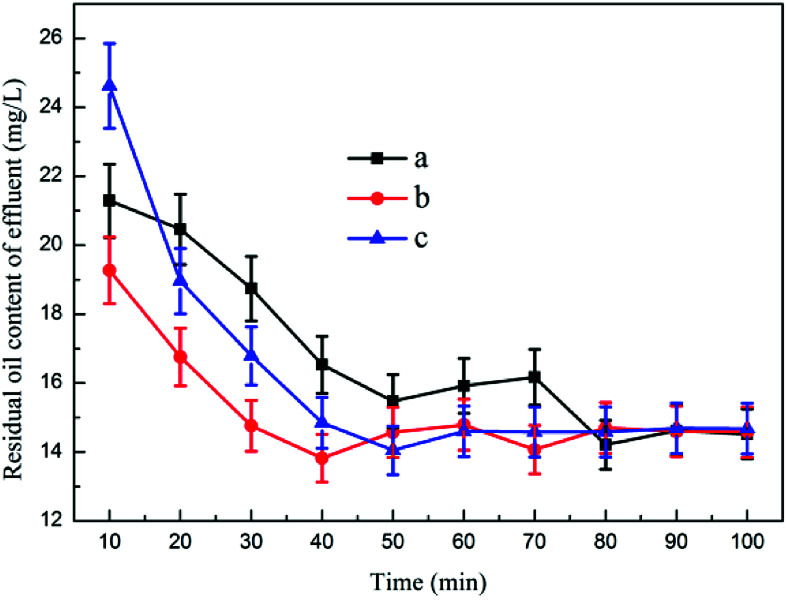
Fig. 8 shows the effect of inlet flow rate on dynamic oil removal. The experimental data indicated that as the reaction proceeded, the oil content of the effluent gradually decreased and tended to be stable. The size of the influent water flow did not have a considerable effect on the oil content of the effluent after the device operation became stable, and the oil content of the effluent was less than 15 ppm. The scum layer in the flotation device did not change remarkably, and the water content of the dross was low. The air flotation and coagulation devices fully considered the impact of flow changes on the effluent at the time of design and formulated the optimal dosage plan to cope with the changes in the influent water content over a wide range.40 Fig. S10† shows the kinetic studies for oil removal at different inlet flow rates, and the result demonstrated that the kinetic study for oil removal at the inlet flow rate of 0.125 m3 h−1 was consistent with the first-order reaction kinetic model with Radj2 0.8302.
Fig. 8. The effect of inlet flow rate on dynamic oil removal: (a) 0.125 m3 h−1, (b) 0.2 m3 h−1, (c) 0.25 m3 h−1.
3.3.4. The effect of inlet oil content on the oil removal performance
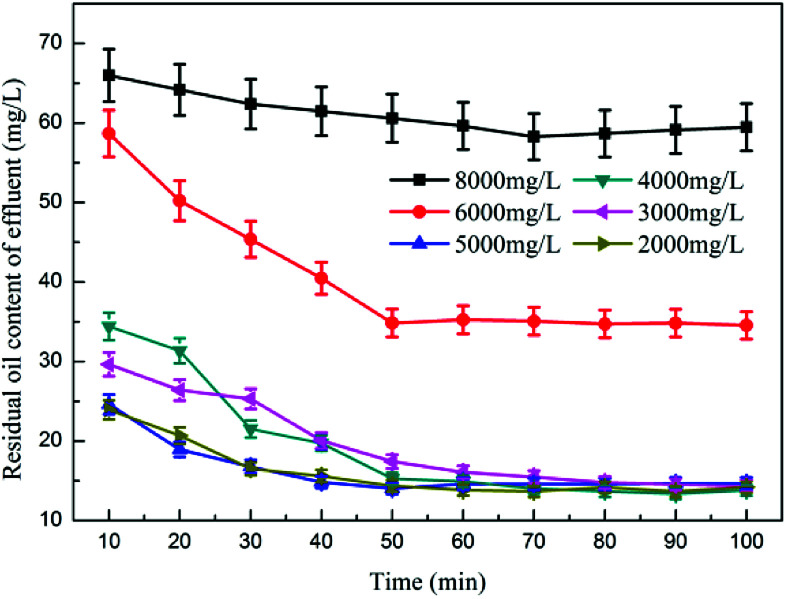
Fig. 9 shows the effect of inlet oil content on dynamic oil removal. The test data indicated that the coagulation–microbubble flotation device could efficiently demulsify the emulsified oil wastewater with oil content of 3000–5000 mg L−1. After processing, the effluent oil content was below 15 mg L−1. When the oil content was greater than 6000 mg L−1, the oil content in the effluent increased, and the expected treatment target could not be achieved.41 This result is caused by the limited demulsification capacity of the PAFC in the dynamic device. As the oil content increased, the PAFC could not completely demulsify the oil, thereby increasing the oil content in the water.
Fig. 9. Effect of inlet oil content on dynamic oil removal.
4. Conclusions
In this study, the effective treatment of emulsified oil wastewater by the coagulation–flotation process was investigated. When the dosage was 500 mg L−1, the demulsification capacity of the coagulant was in the order of polyaluminum ferrosilicate > PAC > polyaluminum silicate iron > alum > aluminum sulfate > PFS > ferric chloride. The addition of flocculant PAM further strengthened the web-trapping capability of the inorganic polymer coagulant and could greatly shorten the flocculation time. The inorganic coagulant presented strong electric-neutralizing capability; however, its poor flocculation capability could not aggregate oil particles that had been demulsified. The polyaluminum salt had strong flocculating and turbidity removal capabilities but with poor electric-neutralizing capability. The polymeric iron salt could be used for low-temperature wastewater, the flocculation was rapid and easy to separate, and the applicable range was wide. When the PAFC dosage was 300 mg L−1, the PAM dosage was 30 mg L−1. When the stirring speed was 350 rpm and the stirring time was 5 min, the emulsified oil wastewater with oil content of 5000 ppm exerted the best demulsification and degreasing effects; the effluent oil content reached 15 ppm. The PAFC and PAM compounds obtained the best treatment effects. The effect of the compounded PAFC and PAM treatment on emulsified oil wastewater was better than that of PAFC only, and the water content of the scum layer was considerably lower than that of the PAFC alone. The coagulation–microbubble flotation device could efficiently demulsify and degrease the emulsified oil wastewater with pH of 6.7–6.9, flow rate of 0.250 m3 h−1, and oil content of 3000–5000 ppm. The resulting COD and turbidity in the treated effluent after coagulation–flotation process were 30–60 mg L−1 and 100–120 NTU, respectively. The capability of the floating water to conduct secondary air flotation on the effluent not only enhanced the degreasing effect of the device but also reduced the amount of fresh water used as microbubble-generating water, thereby reducing operating costs. The microbubble generator in this experiment used direct water to generate microbubbles, which did not require the use of air pressure and dissolved air tanks, thereby considerably reducing the footprint of the entire plant and the investment in production operations. The device can improve the removal efficiency of the emulsified oil and also reduce the time for coagulation and air flotation, which is of considerable importance for reducing the volumes of the stirring device, the air floatation device, the floor space and energy consumption of the devices. Fig. S11† shows the kinetic studies for oil removal for different initial inlet oil content, and the result demonstrated that the kinetic studies for oil removal at initial oil content of 4000 mg L−1 and 3000 mg L−1 were consistent with the first-order reaction kinetics model with Radj2 of 0.8013 and 0.8929, respectively.
Conflicts of interest
There are no conflicts to declare.
Supplementary Material
Acknowledgments
This research was supported by National Natural Science Foundation of China (No. 51508268), Natural Science Foundation of the Jiangsu Province in China (No. BK20150951), National Key Research and Development Program of China (2017YFB0602500), and 2018 Six Talent Peaks Project of Jiangsu Province (JNHB-038).
Electronic supplementary information (ESI) available. See DOI: 10.1039/c8ra06565a
References
- Qian D. Chen D. Li N. Xu Q. Li H. He J. Lu J. J. Membr. Sci. 2018;554:16–25. doi: 10.1016/j.memsci.2017.12.084. [DOI] [Google Scholar]
- Lara-Ortega F. J. Robles-Molina J. Brandt S. Schuetz A. Gilbert-Lopez B. Molina-Diaz A. Garcia-Reyes J. F. Franzke J. Anal. Chim. Acta. 2018;1020:76–85. doi: 10.1016/j.aca.2018.02.077. [DOI] [PubMed] [Google Scholar]
- Rehman K. Imran A. Amin I. Afzal M. J. Hazard. Mater. 2018;349:242–251. doi: 10.1016/j.jhazmat.2018.02.013. [DOI] [PubMed] [Google Scholar]
- Yu L. Yang Y. Yang B. Li Z. Zhang X. Hou Y. Lei L. Zhang D. Chem. Eng. J. 2018;344:462–468. doi: 10.1016/j.cej.2018.03.073. [DOI] [Google Scholar]
- Cho H. Choi Y. Lee S. Desalination. 2018;437:195–209. doi: 10.1016/j.desal.2018.03.009. [DOI] [Google Scholar]
- Kung C. H. Zahiri B. Sow P. K. Merida W. Appl. Surf. Sci. 2018;444:15–27. doi: 10.1016/j.apsusc.2018.02.238. [DOI] [Google Scholar]
- Cao J. Wanga Z. Yang X. Tu J. Wu R. Wang W. Appl. Surf. Sci. 2018;444:399–406. doi: 10.1016/j.apsusc.2018.02.282. [DOI] [Google Scholar]
- Phanthong P. Reubroycharoen P. Kongparakul S. Samart C. Wang Z. Hao X. Abudula A. Guan G. Carbohydr. Polym. 2018;190:184–189. doi: 10.1016/j.carbpol.2018.02.066. [DOI] [PubMed] [Google Scholar]
- Wan Z. Liu Y. Chen S. Song K. Yu P. Zhao N. Ouyang X. Wang X. Colloids Surf., A. 2018;546:237–243. doi: 10.1016/j.colsurfa.2018.03.017. [DOI] [Google Scholar]
- Li Y. Wang M. Sun D. Li Y. Wu T. Appl. Clay Sci. 2018;157:227–236. doi: 10.1016/j.clay.2018.02.014. [DOI] [Google Scholar]
- Wen X. Du C. Zeng G. Huang D. Zhang J. Yin L. Tan S. Huang L. Chen H. Yu G. Hu X. Lai C. Xu P. Wan J. Chemosphere. 2018;200:173–179. doi: 10.1016/j.chemosphere.2018.02.078. [DOI] [PubMed] [Google Scholar]
- Flores N. Brillas E. Centellas F. Maria Rodriguez R. Lluis Cabot P. Antonio Garrido J. Sires I. J. Hazard. Mater. 2018;347:58–66. doi: 10.1016/j.jhazmat.2017.12.059. [DOI] [PubMed] [Google Scholar]
- Abbas M. Adil M. Ehtisham-ul-Haque S. Munir B. Yameen M. Ghaffar A. Shar G. A. Tahir M. A. Iqbal M. Sci. Total Environ. 2018;626:1295–1309. doi: 10.1016/j.scitotenv.2018.01.066. [DOI] [PubMed] [Google Scholar]
- Zhang Y. Xue J. Liu Y. El-Din M. G. J. Hazard. Mater. 2018;347:470–477. doi: 10.1016/j.jhazmat.2017.12.013. [DOI] [PubMed] [Google Scholar]
- Shih T. Liu N. Zhang Q. Chen Y. Zhang W. Liu Y. Qu R. Wei Y. Feng L. Sep. Purif. Technol. 2018;194:135–140. doi: 10.1016/j.seppur.2017.11.019. [DOI] [Google Scholar]
- Wu W. Palmarin M. J. Young S. Sep. Purif. Technol. 2018;195:281–287. doi: 10.1016/j.seppur.2017.11.051. [DOI] [Google Scholar]
- Wang J. Wang H. Sep. Purif. Technol. 2018;195:358–366. doi: 10.1016/j.seppur.2017.12.039. [DOI] [Google Scholar]
- Sun Y. Zhu C. Zheng H. Sun W. Xu Y. Xiao X. You Z. Liu C. Chem. Eng. Res. Des. 2017;119:23–32. doi: 10.1016/j.cherd.2017.01.009. [DOI] [Google Scholar]
- Tang M. Sun Y. Zhu C. Xu Y. Zheng H. Xiao X. Sun W. Wu H. Liu C. Desalin. Water Treat. 2017;65:284–293. doi: 10.5004/dwt.2017.20314. [DOI] [Google Scholar]
- Raheem A. Prinsen P. Vuppaladadiyam A. K. Zhao M. Luque R. J. Cleaner Prod. 2018;181:42–59. doi: 10.1016/j.jclepro.2018.01.125. [DOI] [Google Scholar]
- Bean J. K. Bhandari S. Bilotto A. Ruiz L. H. Environ. Sci. Technol. 2018;52:4960–4968. doi: 10.1021/acs.est.7b06009. [DOI] [PubMed] [Google Scholar]
- Middea A. Spinelli L. de Souza Junior F. G. Neumann R. Fernandes T. Leite Faulstich F. R. Gomes O. J. Appl. Polym. Sci. 2018;135:46162. doi: 10.1002/app.46162. [DOI] [Google Scholar]
- de Melo E. D. Mounteer A. Reis E. Costa E. Vilete A. J. Environ. Manage. 2018;212:349–356. doi: 10.1016/j.jenvman.2018.02.036. [DOI] [PubMed] [Google Scholar]
- Manna S. Saha P. Roy D. Adhikari B. Das P. J. Environ. Manage. 2018;212:424–432. doi: 10.1016/j.jenvman.2018.02.037. [DOI] [PubMed] [Google Scholar]
- Yue X. Zhang T. Yang D. Qiu F. Li Z. Zhu Y. Yu H. J. Cleaner Prod. 2018;180:307–315. doi: 10.1016/j.jclepro.2018.01.160. [DOI] [Google Scholar]
- Bashir M. A. Thiri M. Yang X. Yang Y. Safdar A. M. J. Cleaner Prod. 2018;180:466–471. doi: 10.1016/j.jclepro.2018.01.126. [DOI] [Google Scholar]
- Yi G. Chen S. Quan X. Wei G. Fan X. Yu H. Sep. Purif. Technol. 2018;197:107–115. doi: 10.1016/j.seppur.2017.12.058. [DOI] [Google Scholar]
- Ma J. Shi J. Ding L. Zhang H. Zhou S. Wang Q. Fe X. Jiang L. Fu K. Sep. Purif. Technol. 2018;197:407–417. doi: 10.1016/j.seppur.2018.01.036. [DOI] [Google Scholar]
- Yue X. Zhang T. Yang D. Qiu F. Zhu Y. Fang J. J. Ind. Eng. Chem. 2018;61:188–196. doi: 10.1016/j.jiec.2017.12.016. [DOI] [Google Scholar]
- Domingos R. D. A. Da Fonseca F. V. J. Environ. Manage. 2018;214:362–369. doi: 10.1016/j.jenvman.2018.03.022. [DOI] [PubMed] [Google Scholar]
- Ebrahimi P. Vilcaez J. J. Environ. Manage. 2018;214:370–378. doi: 10.1016/j.jenvman.2018.03.008. [DOI] [PubMed] [Google Scholar]
- Nieuwenhuis E. Post J. Duinmeijer A. Langeveld J. Clemens F. Water Res. 2018;135:155–167. doi: 10.1016/j.watres.2018.02.026. [DOI] [PubMed] [Google Scholar]
- Sun S. Jia L. Li B. Yuan A. Kong L. Qi H. Ma W. Zhang A. Wu Y. Sci. Total Environ. 2018;624:491–498. doi: 10.1016/j.scitotenv.2017.12.029. [DOI] [PubMed] [Google Scholar]
- Ali A. Quist-Jensen C. A. Drioli E. Macedonio F. Desalination. 2018;434:161–168. doi: 10.1016/j.desal.2017.11.035. [DOI] [Google Scholar]
- Ge J. Zong D. Jin Q. Yu J. Ding B. Adv. Funct. Mater. 2018;28:1705051. doi: 10.1002/adfm.201705051. [DOI] [Google Scholar]
- Gomes Paixao M. V. Balaban R. D. C. Int. J. Biol. Macromol. 2018;108:119–126. doi: 10.1016/j.ijbiomac.2017.11.166. [DOI] [PubMed] [Google Scholar]
- Pantziaros A. G. Jaho S. Karga I. Iakovides I. C. Koutsoukos P. G. Paraskeva C. A. J. Chem. Technol. Biotechnol. 2018;93:730–735. doi: 10.1002/jctb.5422. [DOI] [Google Scholar]
- Ramezanzadeh M. Asghari M. Ramezanzadeh B. Bahlakeh G. Chem. Eng. J. 2018;337:385–397. doi: 10.1016/j.cej.2017.12.102. [DOI] [Google Scholar]
- Zhao C. Zheng H. Gao B. Liu Y. Zhai J. Zhang S. Xu B. Ultrason. Sonochem. 2018;42:31–41. doi: 10.1016/j.ultsonch.2017.11.006. [DOI] [PubMed] [Google Scholar]
- Velioglu S. Han L. Chew J. W. J. Membr. Sci. 2018;551:76–84. doi: 10.1016/j.memsci.2018.01.027. [DOI] [Google Scholar]
- Lu T. Qi D. Zhang D. Lu Y. Zhao H. J. Nanopart. Res. 2018;20:88. doi: 10.1007/s11051-018-4193-7. [DOI] [Google Scholar]
Associated Data
This section collects any data citations, data availability statements, or supplementary materials included in this article.


