Abstract
Herein, we demonstrate a facile and green rapid approach for the synthesis of uniform poriferous hydroxylapatite [Ca10(PO4)6(OH)2, HA] and poriferous silver nanoparticle (Ag NPs)-decorated hydroxylapatite (HA@Ag) nanocomposites with excellent antibacterial properties. All the nanocomposites were fully characterized in the solid state via various techniques such as X-ray powder diffraction (XRD), transmission electron microscopy (TEM), Fourier transform infrared spectroscopy (FTIR), automatic specific surface area and porosity analysis (BET) and field emission scanning electron microscopy (FESEM). The results show that HA has a porous rod-like structure, which the HA@Ag nanocomposites retained, and the surface of HA was loaded with globular-like Ag NPs with an average diameter of about 5.8 nm, which exhibit a well-crystalline state. The experimental parameters such as pH, the molar ratio of HA and Tollens' reagent, and reductant have a significant effect on the size and distribution of the Ag NPs. Moreover, the antimicrobial activities of HA and HA@Ag against Escherichia coli (E. coli), Pseudomonas aeruginosa (P. aeruginosa) and Staphylococcus aureus (S. aureus) were evaluated via broth dilution, filter paper diffusion, optical density (OD600) and electron microscopy observation. The as-prepared HA@Ag nanocomposites exhibit excellent antibacterial activities, especially for S. aureus. The minimum inhibition concentration (MIC) of HA@Ag is only 3.9 μg mL−1.
We demonstrate a facile and green rapid approach for the synthesis of uniform poriferous hydroxylapatite (HA) and poriferous silver nanoparticles (Ag NPs)-decorated hydroxylapatite (HA@Ag) nanocomposites with excellent antibacterial properties.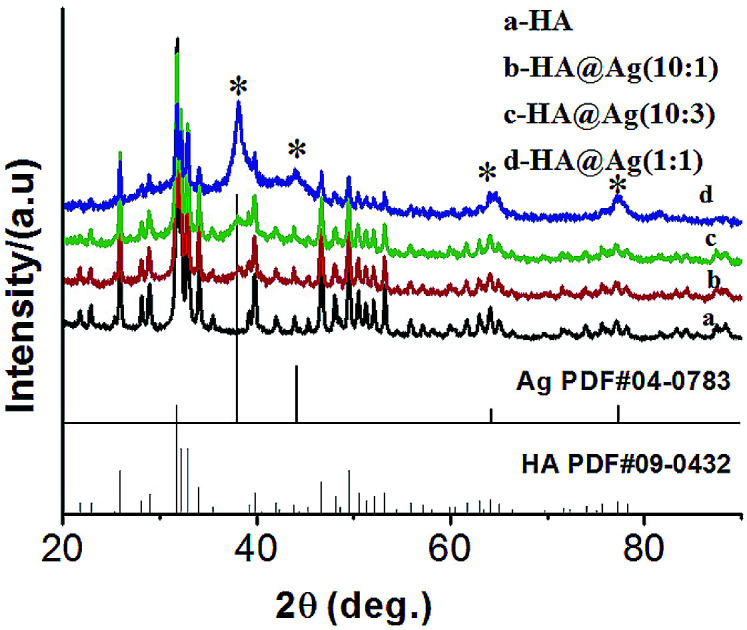
1. Introduction
With economic and technological progress, a multitude of microbiotic and antibacterial agents have been developed for the treatment of infectious diseases. Despite their low incidence, infection due to S. aureus or E. coli is a common clinical problem.1–3 However, pathogenic microorganisms still threaten public health and cause millions of infection-related sicknesses annually.4–6 The antibacterial property of silver has been known for several centuries due to its inhibitory effect on the growth of bacteria,7,8 long-term activity9 and lack of bacterial resistance risk.10 However, it is reported that a high concentration of silver can kill human cell lines, such as lymphocytes, monocytes and human mesenchymal stem cells, which is in the range of 1–2.5 μg mL−1.11 Furthermore, some authors suggested that silver concentrations higher than 10 μg mL−1 can be toxic to human cells.12,13 With the development of fabrication strategies for novel nanomaterials and nanostructures,14–16 Ag-loaded nanocomposites have been regarded as a very broad-spectrum antimicrobial agent,17,18 which can encourage their potential applications in various fields such as food preservation, clothing, fabric, cosmetics, biomedicine and water purification.19,20 The sterilization effect of Ag-loaded nanomaterials mainly depends on the release of silver ions.21,22 To maintain their antibacterial property, Ag nanoparticles (NPs) need supporting matrices to retain their features.23–25 Therefore, it is essential to design and prepare some novel Ag-loaded nanostructures for newer possibilities with this antibacterial agent. To date, several types of Ag-incorporated nanomaterials have been reported, and Ag NPs immobilized on different types of inorganic and organic substrates have been demonstrated to exhibit enhanced and prolonged antibacterial performances.26–28 For example, Ag-graphene nanocomposites,29–32 Ag-oxide nanocomposites33–35 and Ag-macromolecules.36–38 Moreover, Ag-loaded nanocomposites can prevent the uncontrollable growth and aggregation of Ag NPs. However, although these silver-containing materials have attracted significant interest in recent years, they are difficult to apply practically in the human body due to their non-biocompatibility.
Hydroxylapatite [Ca10(PO4)6(OH)2, HA] is a well-known calcium phosphate ceramic, which is the major component in bone and teeth.39 Significantly, HA possess high biocompatibility. When bone is fractured or a cavity is formed in a tooth, synthetic HA powder is frequently used as substitute material. It has also been reported that porous HA shows both osteoinductivity and directly bonds to living bone when implanted in bone defects.40 In some cases, composite materials such as synthesized HA/polymers or metals are used for better mechanical integration as well as bioactivity when implanted in the body, which provide an excellent platform for the existing bone to grow.41 However, the lack of antibacterial property in HA restricts its direct application in the biomedical field.42 Thus, in recent years, numerous of HA-based composites possessing antibacterial properties have been reported. For example, spark plasma sintered HA–ZnO ultrafine composite,43 electrophoretic-deposited HA–Cu nanocomposite coatings,44 HA/ZnO/CNT nanocomposite,45 alginate/HA bio-nanocomposite film.46 These composites combine the advantages of HA as a carrier and the antibacterial activities of the loaded component. As is well known, silver is the most effective inorganic antimicrobial; therefore, the references about Ag and HA nanocomposites are also abundant. However, to the best of our knowledge, most of these reported composites are in the form of coatings, fibers and films.47–50 Specifically, the research on hybrid powders, especially Ag NPs loaded on the surface of HA is rare.42,51 In fact, composite particles have broader applications as antibacterial additives in disinfectant powder, fluid, and polymer filler. Thus, it is still a significant task to prepare Ag/HA nanocomposite particles with high dispersibility and excellent antibacterial activity, through a convenient liquid phase chemical method.
Herein, we adopted the hydrothermal method for the preparation of porous HA, and then successfully achieved HA@Ag nanocomposites using a simple liquid chemical reduction method. We investigated the effect of experimental conditions on the morphology and size of HA and HA@Ag, and the amount of loaded Ag NPs. The structure and morphology of the obtained samples were measured via various techniques such as X-ray powder diffraction (XRD), field emission scanning electron microscopy (FESEM), transmission electron microscopy (TEM), Fourier transform infrared spectroscopy (FTIR) and automatic specific surface area and porosity analysis (BET). The antibacterial activity of HA and HA@Ag against the Gram-negative bacteria Escherichia coli (E. coli) and Pseudomonas aeruginosa (P. aeruginosa) and Gram-positive bacteria Staphylococcus aureus (S. aureus) were testified via broth dilution, filter paper diffusion, optical density (OD600) and cellular microscopic observation.
2. Experimental
2.1. Reagents
AgNO3, calcium nitrate (Ca(NO3)2·4H2O), phosphorus pentoxide (P2O5) and ethyl alcohol (C2H5OH) were purchased from the Chemical Reagent Corporation of the Chinese National Medical Group (Beijing, China). Tannic acid, glucose, ammonia (NH3·H2O, 25–28%) and sodium chloride (NaCl) were purchased from Tianjin Kemiou Chemical Reagent Co. Ltd. (Tianjin, China). Nutrient agar and broth medium were purchased from Beijing Aoboxing Biotechnology Corporation (Beijing, China). All reagents were used as received without further purification. E. coli, P. aeruginosa and S. aureus bacteria strains were purchased from the China General Microbiological Collection Center (CGMCC). Distilled water was used throughout the experiment.
2.2. Instruments and characterization
XRD patterns were collected on an X'pert Philips diffractometer equipped with Cu Kα radiation (λ = 1.5418 Å), and operated at 40 kV and 40 mA. TEM images were obtained using a JEOL JEM-100CX transmission electron microscope. FTIR spectra were obtained on an AVATAR 360 Fourier transform infrared spectrometer. BET analysis was conducted by nitrogen adsorption in a nitrogen adsorption apparatus (Micromeritics, ASAP 2020M+C). The BET surface area (SBET) was determined via the multipoint BET method using the adsorption data in the relative pressure (P/P0) range of 0–1. The samples were degassed at 150 °C prior to the nitrogen adsorption measurements.
2.3. Preparation of HA and HA@Ag nanocomposite
For the preparation of HA, firstly, 0.40 g Ca(NO3)2·4H2O (0.67 mol L−1) and 0.07 g P2O5 (0.02 mol L−1) were separately dissolved in a mixed solvent (25 mL of distilled water and alcohol). Then, the Ca(NO3)2 solution was injected into a 100 mL round bottom flask at 60 °C with magnetic stirring for about 30 min. Secondly, the pre-prepared P2O5 solution was added dropwise into the above Ca(NO3)2 solution. Meanwhile, the pH of the solution was tuned to 10 with NH3·H2O. After reaction for 0.5 h, the resulting solution was sealed in a Teflon-lined stainless-steel autoclave at 160 °C for 12 h. Finally, the solution was naturally cooled, centrifuged and washed to obtain HA.
To obtain HA@Ag nanocomposites, the as-prepared HA (0.13 g) was dissolved in 18 mL distilled water at 60 °C. Subsequently, 5 mL of 0.09 mol L−1 Tollens' reagent was injected into the HA solution; meanwhile, the pH of the solution was adjusted to 12. After mixing for 20 min, tannic acid (0.01 mol L−1, 2 mL) was added dropwise into the mixed solution, and immediately, the milky-white solution turned into a dark red-brown suspension. After 10 min of stirring, the solution was aged for about 1 h. Finally, the resulting solution was centrifuged and washed to obtain the HA@Ag nanocomposites. Using the same method, a series of HA@Ag nanocomposites with different reductants (namely, tannic acid and glucose), reaction temperatures (namely, 60 °C, 80 °C, 100 °C), molar ratios (namely, 10 : 1, 10 : 3, and 1 : 1; corresponding to Ag contents of 1.07, 3.13, and 9.72 wt%, respectively) of HA to Ag+ were prepared by fixing the quantity of HA in the experiments.
2.4. Antibacterial activity testing
To study the antibacterial activity of HA and HA@Ag, E. coli, P. aeruginosa and S. aureus were selected as representative bacteria. All equipment and materials in the process were sterilized for about 20 min in an autoclave (0.1 MPa, 121 °C) before the experiments.52 The minimum inhibitory concentration (MIC) and minimum bactericidal concentration (MBC) were used to appraise the antimicrobial activities of the nanocomposites by repeating the serial broth dilution method several times.53 For the MIC test, a solution containing a certain concentration of HA@Ag solution (1000, 500, 250, 125, 62.5, 31.3, 15.6, 7.8, 3.9, 2.0, 1.0, and 0 μg mL−1) was mixed with 20 μL bacterial suspension at a concentration of 106 colony forming units (CFU) mL−1, then incubated at 37 °C for 20 h. Finally, the MIC, which is defined as the lowest concentration of sample that inhibits the visible growth of the bacteria, was determined via a turbid-metric method after incubation. The MBC is the minimum concentration of the sample required to kill 99.9% bacteria after a defined period of incubation. In the test, the bacterial suspension containing different amounts of HA or HA@Ag with a concentration equal or greater than the MIC was coated on the nutrient agar plate. Subsequently, the bacterial suspension-treated agar plates were put into a bacteria incubator (37 °C, 20 h). The number of survival colonies was counted to determine the MBC of HA and HA@Ag.
The antibacterial activity was also studied via the filter paper diffusion method. Initially, 100 μL bacteria suspensions were put uniformly on the surface of an agar Petri dish and solidified. Then, filter paper with a diameter of 5 mm was positioned on the Petri dish and marked. Subsequently, the sample solutions with different concentrations were added on the filter paper. Also, normal saline as a control sample was dropped into the center of the filter paper. Finally, the agar Petri dishes were put into an incubator (37 °C, 20 h). The antibacterial effect was evaluated by the diameter of visible transparent inhibitory zone.
The antibacterial activity was also studied by the bacterial growth kinetics in broth media. The detailed steps are presented in the literature.54
In addition, the morphology changes in the bacteria treated with the HA@Ag nanocomposites were estimated by SEM. Bacterial suspensions (40 μL) and broth medium (2 mL) were mixed and cultured at 37 °C for about 6 h. Subsequently, 100 μg mL−1 HA@Ag nanocomposite solution was added, and then continued to be cultured under the same condition for another 6 h. Finally, the bacteria were collected by centrifugation. For the preparation of bacterial SEM samples, the bacteria were soaked in glutaraldehyde solution (2.5% w/v) at −4 °C for about 30 min and centrifuged at 6000 rpm for 5 min. Finally, the bacteria were dehydrate using a series of alcohol solution, and the collected bacteria were observed by SEM.
3. Results and discussion
3.1. The XRD patterns of HA and HA@Ag nanocomposites
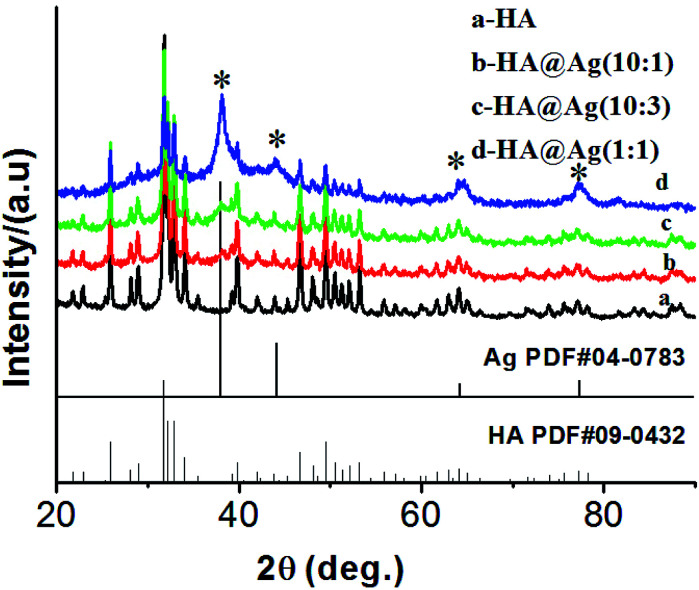
Fig. 1 shows the XRD patterns of the HA (a) and HA@Ag nanocomposites (b, c, and d) with three different molar ratios of HA to Ag+ of 10 : 1, 10 : 3, and 1 : 1, respectively. It can clearly be seen that the samples have multiple diffraction peaks in their patterns (Fig. 1a–d), and the peaks at the 2θ values of 25.9°, 31.8°, 32.9°, 34.1°, 39.8°, 46.7°, 49.5°, 50.5°, 53.1° and 64.1° are assigned to diffractions from the (002), (211), (300), (202), (310), (222), (213), (321), (004) and (304) lattice planes of HA (JCPDS no. 09-0432), respectively. Furthermore, as shown in Fig. 1b–d, the samples present other multiple diffraction peaks besides the diffraction peaks of HA. The relevant peaks are 38.1°, 44.3°, 64.4°, 77.4° and 81.5°, which are assigned to the diffractions of the (111), (200), (220), (311) and (222) lattice planes of face-centered cubic (fcc) silver (JCPDS no. 04-0783), respectively. Meanwhile, the intensity of the diffraction peaks of Ag was enhanced gradually with an increase in the amount of silver in the nanocomposites. The analysis of the XRD patterns demonstrate that we successfully synthesized the HA and HA@Ag composites.
Fig. 1. XRD patterns of HA (a) and HA@Ag nanocomposites with different molar ratios of HA to Ag+ (b) 10 : 1, (c) 10 : 3, (d) 1 : 1.
3.2. Morphologies of HA and HA@Ag nanocomposites
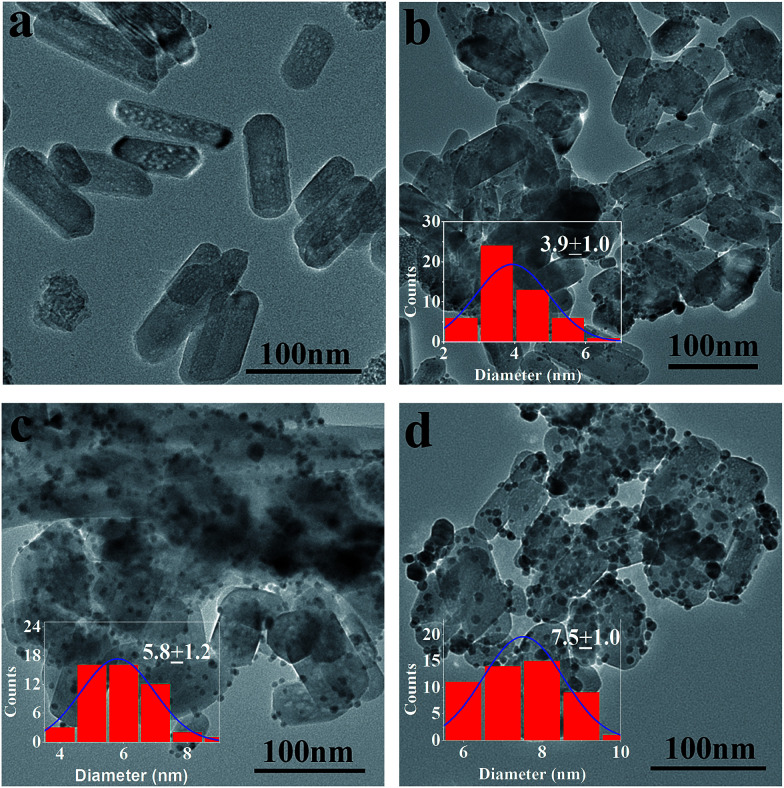
Fig. 2 shows the TEM images of HA (a) and HA@Ag nanocomposites with three different molar ratios of HA to Ag+ for (b) 10 : 1, (c) 10 : 3, and (d) 1 : 1, and the insets are the histograms of the Ag particle size distribution. From Fig. 2b–d, it is clearly seen that the amount of Ag NPs loaded on the surface of HA gradually increased with an increase in the molar ratio of Ag+ to HA. However, when the molar ratio of HA to AgNO3 was 1 : 1 (as shown in Fig. 1d), the particles size of Ag NP size was the biggest, and some of them were aggregated. Agglomerated Ag NPs will limit the antibacterial properties of the nanocomposites. Thus, the results show that the perfect HA@Ag nanocomposites are obtained when the molar ratio of HA to AgNO3 is 10 : 3, and the average diameter of the Ag NPs is about 5.8 nm. It is noteworthy that the black blocky shadows in Fig. 2c are not Ag NP aggregates. That image is unclear and exhibits a shape more like HA, which is due to the coated HA and out of focus TEM observation. Meanwhile, from Fig. 2a, it is obviously seen that HA possesses a porous structure. Compared with the pristine HA, it is found from Fig. 2b–d that this porous structure is retained in the HA@Ag nanocomposites although partial HA surfaces are covered with Ag NPs. Furthermore, it is interesting to find that the length of HA decreases after the loading of Ag NPs, which indicates some HA shrunk or broke. This may be attributed to the etching effect of Ag+ ions.55
Fig. 2. TEM images of HA (a) and HA@Ag nanocomposites with different molar ratios of HA to Ag+ (b) 10 : 1, (c) 10 : 3, and (d) 1 : 1, and the insets are the histograms of the Ag particle size distribution.
From the results of researching different experimental conditions, we determined the optimum reaction conditions for the preparation of the HA@Ag nanocomposites. Specifically, the mole ratio of HA and Ag+ of 10 : 3, the reaction temperature of 60 °C, reducing agent tannic acid, and aging time of 1 h (the data is not shown herein, except for the different mole ratios of HA to Ag+). Since the sample with an HA to Ag+ mole ratio of 10 : 3 exhibited the smallest Ag NP size, and antibacterial activity increases with a decrease in mean size,56 it was chosen as the representative sample for the BET analysis and antibacterial test.
3.3. FTIR spectra of HA and HA@Ag nanocomposites
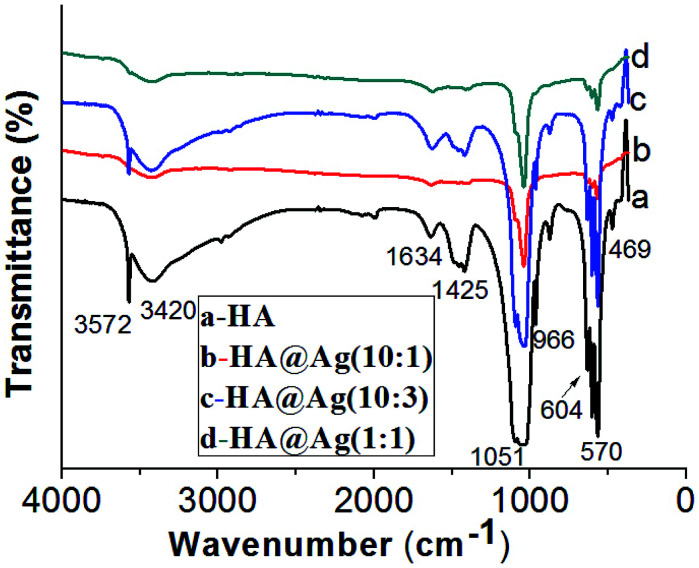
Fig. 3 shows the FTIR spectra of HA (a) and HA@Ag nanocomposites with three different molar ratios of HA to Ag+ of 10 : 1 (b), 10 : 3 (c) and 1 : 1 (d). For the FTIR spectrum of HA shown in Fig. 3a, the absorption bands at 3572 cm−1, 3420 cm−1, and 1634 cm−1 are caused by the stretching vibration of the hydroxyl group in the adsorbed water. The strong absorption band at 1051 cm−1 and shoulder peak at 966 cm−1 are attributed to the bending and stretching of the P–O bond from the PO43− groups, respectively. The absorption bands at 570 cm−1, 604 cm−1 and 469 cm−1 are ascribed to the asymmetric and symmetric stretching vibration of the P–O bond from the PO43− group. There is a weak absorption band for CO32− at 1425 cm−1, which may be attributed to the presence of B-type carbonate (CO32−) for the PO43−-substituted HA.45 The FTIR results are consistent with that reported in the literature,57 which further demonstrates that the blank sample is HA. Compared with spectrum of pristine HA, the FTIR spectra of HA@Ag (as shown in Fig. 3b–d) are mostly consistent with that in Fig. 3a, which suggests that the state of the surface chemical bonding for the Ag NP-loaded HA nanocomposites barely changed. However, the frequencies of the bands appear to be red-shifted to lower wavenumbers, especially for the bands centred at 1050 cm−1. This may be due to the combination of the Ag NPs with the hydroxyl or PO43− groups of HA. Notably, the intensity of the adsorption bands in Fig. 3b is lower that of the other samples, which may be because the KBr tablet was not well prepared, leading to a decrease in the transmittance.
Fig. 3. FTIR spectra of HA (a) and HA@Ag nanocomposites with different molar ratios of HA to Ag+ (b) 10 : 1, (c) 10 : 3, (d) 1 : 1.
3.4. BET analysis of HA and HA@Ag nanocomposite
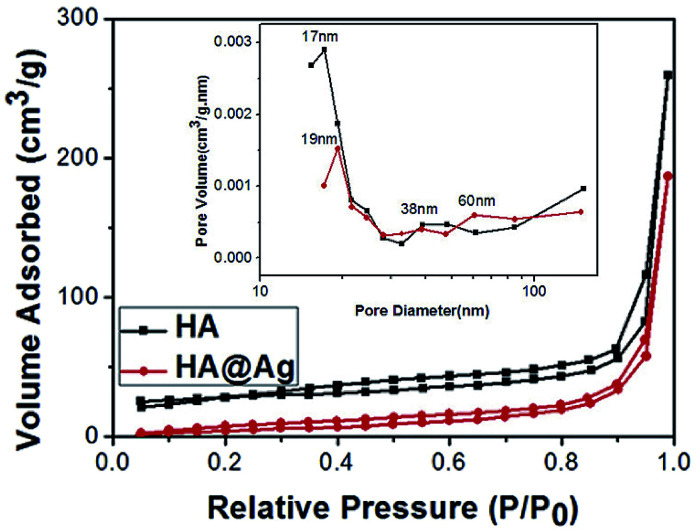
To further determine whether the HA and HA@Ag nanocomposites have a porous structure, we tested the sponginess of the HA materials and HA@Ag nanocomposites through nitrogen stripping absorption. The specific surface area of the HA and HA@Ag nanocomposites was calculated using the BET method based on the adsorption isotherm data under relative pressure (P/P0), and the pore size distribution curves of HA and HA@Ag nanocomposites were plotted using the Barrett–Joyner–Halenda (BJH) method based on the adsorption isotherms. Fig. 4 shows the nitrogen stripping absorption curves of HA and HA@Ag nanocomposite with an HA to Ag+ molar ratio of 10 : 3, and the inset is the pore size distribution curve. It can be seen that both the neat HA and HA@Ag nanocomposites exhibit an obvious absorption stripping phenomenon. The specific surface area of HA and HA@Ag nanocomposites is 32.9 and 35 m2 g−1, respectively. From the BJH pore size distribution, it can be found that the average pore size of HA is about 17 nm, but a few pores are around 38 nm. Meanwhile, the average pore size of the HA@Ag nanocomposites is about 19 nm, with partial pore size distribution around 38 nm and 60 nm. Depending on the type of the pore size distribution of porous materials (that is, the pore size of microporous materials is less than 2 nm, the pore size of mesoporous materials range from 2 nm to 50 nm and the pore size of macroporous materials is greater than 50 nm), it can be inferred that the as-prepared HA is a mesoporous material, and the HA@Ag nanocomposites are porous materials. The results suggest that the Ag NP loading has no significant effect on the surface structure of HA, except for an enlargement in pore size.
Fig. 4. Nitrogen stripping absorption curves of HA and HA@Ag nanocomposite with an HA to Ag+ molar ratio of 10 : 3, and the inset is the pore size distribution curve.
3.5. Antimicrobial activities of HA@Ag nanocomposites
Table 1 shows the MIC and MBC values of the Ag particles, HA and HA@Ag nanocomposites against E. coli, S. aureus and P. aeruginosa measured by the broth dilution method. Herein, Ag particles with an average diameter of 400 nm were prepared according to our previous work,58 which were not surface modified by polyacrylic acid (PAA) and used as the control sample. The porous HA@Ag nanocomposites were prepared under the optimum reaction conditions, and the average particle size of the Ag NPs loaded on HA was 5.8 nm. As seen in Table 1, the MIC and MBC values of the Ag particles against E. coli, S. aureus and P. aeruginosa are greater than 125 μg mL−1. Meanwhile, the pristine porous HA could only inhibit the growth of the three types of bacteria in at a rather high concentration, but not kill the bacteria thoroughly. In contrast, the MIC and MBC values of the HA@Ag porous nanocomposites against E. coli, S. aureus and P. aeruginosa were less than 15.6 μg mL−1 and 62.5 μg mL−1, respectively. It is obviously demonstrated that the loading of Ag NPs on HA carrier endows the HA@Ag nanocomposites with excellent antibacterial activities. The bacteriostasis and bactericidal action of the nanocomposites is better than that of each component (Ag particles or HA). The result suggests that the HA@Ag nanocomposites have excellent properties inhibiting and killing bacteria, which are especially prominent for the Gram-positive bacteria S. aureus. Compared with other reported Ag–HA composite NPs,59,60 the as-prepared HA@Ag nanocomposites herein exhibit superior MIC and MBC values, which may be due to the even distribution of Ag NPs on the surface of HA. More importantly, as nanocomposites, the mass fraction of Ag NPs in HA@Ag is only about 3% (assuming that there is no loss in the reaction process). Furthermore, the MIC and MBC values of the HA@Ag nanocomposites is as good as that of Ag/PAA NPs, which have been previously reported.58 Thus, a lower silver content can sharply reduce the application cost of the composites as antibacterial agents. Meanwhile, HA as a carrier can improve the durable antimicrobial property of the composite materials due to its porous structure for a sustained release effect.
MIC and MBC values of Ag particles, HA and HA@Ag nanocompositesa.
| MIC (μg mL−1) | MBC (μg mL−1) | |||||
|---|---|---|---|---|---|---|
| E. coli | P. aeruginosa | S. aureus | E. coli | P. aeruginosa | S. aureus | |
| Ag particles | 125 | 250 | 125 | 250 | 500 | 250 |
| HA | 500 | 1000 | 250 | — | — | — |
| HA@Ag | 7.8 | 15.6 | 3.9 | 15.6 | 62.5 | 7.8 |
—: indicates no antibacterial activity was shown.
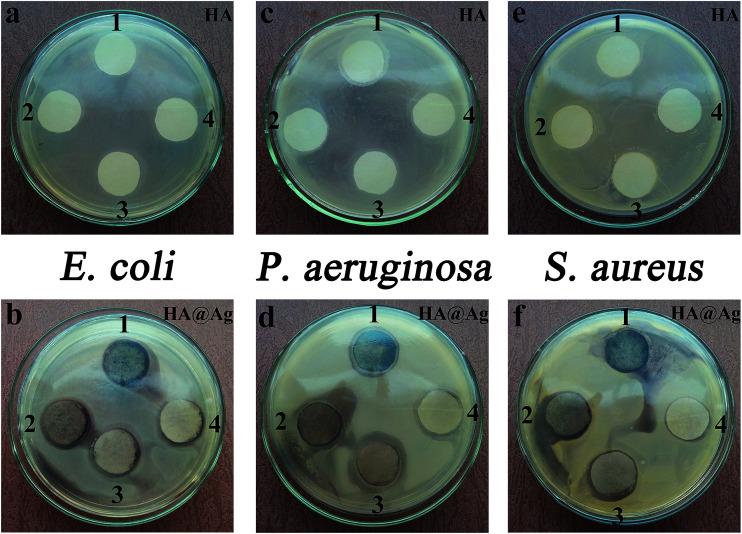
In addition to the measurement of MIC and MBC values for the Ag particles, HA and HA@Ag nanocomposites against E. coli, P. aeruginosa and S. aureus, we also employed the filter paper diffusion method to test the antibacterial properties of the HA and HA@Ag nanocomposites for the three types of bacteria. Fig. 5 shows the inhibition zone photographs of HA and HA@Ag nanocomposites against E. coli (a and b), P. aeruginosa (c and d), and S. aureus (e and f), respectively. The positions of HA (1–4) correspond to the concentrations of 1000, 500, 250, and 125 μg mL−1 and the positions of HA@Ag nanocomposites (1–4) correspond to the concentrations of 125, 62.5, 15.6, and 7.8 μg mL−1, respectively. As shown in Fig. 5a, c, and e, HA could inhibit the growth of E. coli, P. aeruginosa, and S. aureus when its concentration was more than 500 μg mL−1, but the inhibition zones are not very obvious. However, the diameter of the inhibition zone of the HA@Ag nanocomposites, as shown in Fig. 5b, d, and f, against E. coli, P. aeruginosa and S. aureus was 19.0 mm, 21.0 mm and 21.0 mm at the sample concentration of 15.6 μg mL−1, respectively. The above test results intuitively and clearly indicate that the HA@Ag nanocomposites have good antibacterial property, even at a very low concentration.
Fig. 5. Inhibition zone photographs of the HA and HA@Ag nanocomposites against bacteria E. coli (a and b), P. aeruginosa (c and d) and S. aureus (e and f). The positions (1–4) in the top row correspond to HA concentrations of 1000, 500, 250, and 125 μg mL−1, and in the bottom row to HA@Ag nanocomposites concentrations of 125, 62.5, 15.6, and 7.8 μg mL−1, respectively.
To investigate the antibacterial process of HA and HA@Ag nanocomposites, we tested the bacterial growth curves in liquid broth media. The time-dependent changes in bacteria growth were detected via the OD600 method using a UV-vis spectrophotometer. Fig. 6 shows the growth curves for the bacteria of E. coli (A), P. aeruginosa (B) and S. aureus (C) with different concentrations of HA@Ag nanocomposite treatment for 48 h, and the control test was the bacteria in broth medium without HA@Ag nanocomposite treatment. It can be seen from Fig. 6 that the HA@Ag nanocomposites at all tested concentrations have a strong suppression and killing effect on the proliferation of the tested strains at a low concentration. For E. coli and S. aureus (as shown in Fig. 6A and C), the HA@Ag nanocomposite completely inhibited the growth of the bacteria during the whole growth process when their concentration was higher than the MIC values (7.8 and 3.9 μg mL−1). Specifically, the surviving strain number after treatment with the HA@Ag nanocomposite was much less than that of the normal bacteria. For P. aeruginosa (as shown in Fig. 6B), when the concentration of the HA@Ag nanocomposite was 30 μg mL−1, the growth of the bacteria was only delayed through the whole growth process, and they did not proliferate until the concentration of the HA@Ag nanocomposite reached 80 μg mL−1. This test result is consistent with that of the broth dilution method.
Fig. 6. Growth curves of E. coli (A), P. aeruginosa (B) and S. aureus (C) with different concentrations HA@Ag nanocomposite treatments (b, c and d) and normal bacteria without HA@Ag nanocomposites treatment as the control test (a).
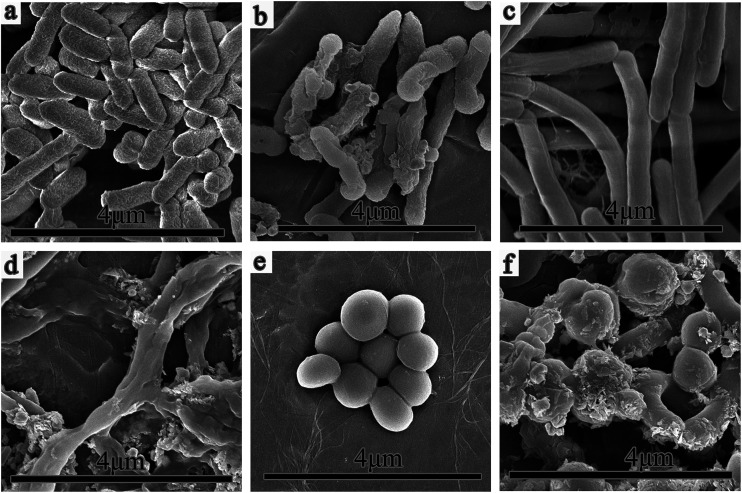
Finally, we observed the morphology changes in the original and treated bacteria through SEM to study the influence of the HA@Ag nanocomposites on bacteria. Fig. 7 shows the SEM images of the normal and treated bacteria with HA@Ag nanocomposite solution (100 μg mL−1) for E. coli (a and b), P. aeruginosa (c and d), and S. aureus (e and f), respectively. It can clearly be seen from Fig. 7a that the original E. coli cells exhibit uniform and smooth short and rod morphologies, and the length of the rods is about 2 μm. While, as shown in Fig. 7b, after treatment with the HA@Ag nanocomposite, the rod-like cells exhibited significant changes, such as much shorter length and rougher surfaces. Most of the bacteria cells were destroyed, and some bacteria were even broken into fragments, which indicates the occurrence of great interactions between the HA@Ag nanocomposites and bacteria, and as a result, obvious damage to the bacterial cells. The same phenomenon can be seen from the comparison of Fig. 7c and d for P. aeruginosa. After treatment with the HA@Ag nanocomposites, a large amount of sample was attached on the surface of the bacterial cells, and the bacteria cells were even more damaged. As the representative Gram-positive bacteria, the normal S. aureus cells observed in Fig. 7e was in the shape of smooth spheres with an average diameter of 0.7 μm. Whereas, the treated cells shown in Fig. 7f exhibit great changes, for instance, membrane deformation and rough surfaces together with the appearance of cell debris. A similar phenomenon can be seen, where plenty sample was attached on the surface of the bacteria cells, and most of the bacteria cells were damaged, and some of them even broken into debris. Thus, the changes in the morphologies of the normal bacteria and treated bacteria by HA@Ag nanocomposites directly indicate that the HA@Ag nanocomposites have a significant effect on the survival of the bacteria.
Fig. 7. SEM images of the normal and treated bacteria with 100 μg mL−1 of HA@Ag nanocomposites solution for E. coli (a and b), P. aeruginosa (c and d), and S. aureus (e and f).
4. Conclusions
In summary, porous HA with excellent dispersibility and uniformity was successfully prepared via the hydrothermal method, and subsequently, HA@Ag nanocomposites with a porous structure were successfully fabricated via the chemical reduction method. The optimum reaction conditions for the preparation of the HA@Ag nanocomposites was determined by investigating different experimental parameters. Specifically, the mole ratio of HA to Ag+ of 10 : 3, the reaction temperature of 60 °C, tannic acid as the reducing agent, and aging time of 1 h. The morphology and structure of the HA@Ag nanocomposites were well characterized using various techniques such as XRD, ETM, FTIR and BET. The results showed that Ag NPs with an average diameter of 5.8 nm were decorated uniformly on the surface of HA, and the porous characteristics of HA were remained in the HA@Ag nanocomposites. Furthermore, the antibacterial study showed that the HA@Ag nanocomposites have excellent antibacterial properties, especially for S. aureus. Meanwhile, compared with the single component of Ag particles, the combination with HA sharply reduce their application cost as an antibacterial agent. HA as a carrier also improved the durable antimicrobial property of the composite materials due to its large porosity and specific chemical composition. Furthermore, based on the well-known hypotoxicity of Ag NPs and high biocompatibility of HA, the as-prepared HA@Ag nanocomposites are potential antibacterial materials, which can be directly applied in the human body.
Conflicts of interest
There are no conflicts to declare.
Supplementary Material
Acknowledgments
The authors are grateful for the funding support from the National Natural Science Foundation of China (grant No. U1604126), the Natural Science Foundation of Henan province (grant No. 182300410223), key scientific research project of colleges and universities in Henan province (grant no. 17A150003, 18A430008, 18A430001), and key scientific and technological project of Henan Province (Grant No. 172102210015).
References
- Ji H. Sun H. Qu X. Adv. Drug Delivery Rev. 2016;105:176–189. doi: 10.1016/j.addr.2016.04.009. [DOI] [PubMed] [Google Scholar]
- Yu M. Wang Z. Lv M. Hao R. Zhao R. Qi L. Liu S. Yu C. Zhang B. Fan C. Li J. ACS Appl. Mater. Interfaces. 2016;8:19866–19871. doi: 10.1021/acsami.6b07631. [DOI] [PubMed] [Google Scholar]
- Crémet L. Corvec S. Bémer P. Bret L. Lebrun C. Lesimple B. Miegeville A. F. Reynaud A. Lepelletier D. Caroff N. J. Infect. 2012;64:169–175. doi: 10.1016/j.jinf.2011.11.010. [DOI] [PubMed] [Google Scholar]
- Stojanoski V. Sankaran B. Prasad B. V. Poirel L. Nordmann P. Palzkill T. BMC Biol. 2016;14:81. doi: 10.1186/s12915-016-0303-0. [DOI] [PMC free article] [PubMed] [Google Scholar]
- Hao R. Zhao R. Qiu S. Wang L. Song H. Science. 2015;348:1100–1101. doi: 10.1126/science.348.6239.1100-d. [DOI] [PubMed] [Google Scholar]
- Zhao R. T. Lv M. Li Y. Sun M. X. Kong W. Wang L. H. Song S. P. Fan C. H. Jia L. L. Qiu S. F. Sun Y. S. Song H. B. Hao R. Z. ACS Appl. Mater. Interfaces. 2017;9:15328–15341. doi: 10.1021/acsami.7b03987. [DOI] [PubMed] [Google Scholar]
- Cho K. H. Park J. E. Osaka T. Park S. G. Electrochim. Acta. 2005;51:956–960. doi: 10.1016/j.electacta.2005.04.071. [DOI] [Google Scholar]
- Díaz M. Barba F. Miranda M. Guitián F. Torrecillas R. Moya J. S. J. Nanomater. 2009;11:498–505. [Google Scholar]
- Mahendra R. Alka Y. Aniket G. Biotechnol. Adv. 2009;27:76–83. doi: 10.1016/j.biotechadv.2008.09.002. [DOI] [PubMed] [Google Scholar]
- Floresa C. Y. Diaza C. Ruberta A. Benítez G. A. Moreno M. S. Lorenzo F. de Mele M. A. Salvarezza R. C. Schilardi P. L. Vericat C. J. Colloid Interface Sci. 2010;350:402–408. doi: 10.1016/j.jcis.2010.06.052. [DOI] [PubMed] [Google Scholar]
- Peetsch A. Greulich C. Braun D. Stroetges C. Rehage H. Siebers B. Köller M. Epple M. Colloids Surf., B. 2013;102:724–729. doi: 10.1016/j.colsurfb.2012.09.040. [DOI] [PubMed] [Google Scholar]
- Monteiro D. Gorup L. F. Takamiya A. S. Ruvollo-Filho A. C. de Camargo E. R. Barbosa D. B. Int. J. Antimicrob. Agents. 2009;34:103–110. doi: 10.1016/j.ijantimicag.2009.01.017. [DOI] [PubMed] [Google Scholar]
- DeVasConCellos P. Bose S. Beyenal H. Bandyopadhyay A. Zirkle L. G. Mater. Sci. Eng., C. 2012;32:1112–1120. doi: 10.1016/j.msec.2012.02.020. [DOI] [PMC free article] [PubMed] [Google Scholar]
- Ferreira L. Fonseca A. M. Botelho G. Almeida-Aguiar C. Neves I. C. Microporous Mesoporous Mater. 2012;160:126–132. doi: 10.1016/j.micromeso.2012.05.006. [DOI] [Google Scholar]
- Shrestha L. K. Shrestha R. G. Vilanova N. Rodriguez-Abreu C. Ariga K. J. Nanosci. Nanotechnol. 2014;14:2238–2244. doi: 10.1166/jnn.2014.8548. [DOI] [PubMed] [Google Scholar]
- Sun Y. Xia Y. Science. 2002;298:2176–2179. doi: 10.1126/science.1077229. [DOI] [PubMed] [Google Scholar]
- Chernousova S. Epple M. Angew. Chem., Int. Ed. 2013;52:1636–1653. doi: 10.1002/anie.201205923. [DOI] [PubMed] [Google Scholar]
- Hajipour M. J. Fromm K. M. Ashkarran A. A. Jimenez de Aberasturi D. Ruiz de Larramendi I. Rojo T. Serpooshan V. Parak W. J. Mahmoudi M. Trends Biotechnol. 2012;30:499–511. doi: 10.1016/j.tibtech.2012.06.004. [DOI] [PubMed] [Google Scholar]
- Knetsch M. L. Koole L. H. Polymers. 2011;3:340–366. doi: 10.3390/polym3010340. [DOI] [Google Scholar]
- Llorens A. Lloret E. Picouet P. A. Trbojevich R. Fernandez A. Trends Food Sci. Technol. 2012;24:19–29. doi: 10.1016/j.tifs.2011.10.001. [DOI] [Google Scholar]
- Kumar R. Münstedt H. Biomaterials. 2005;26:2081–2088. doi: 10.1016/j.biomaterials.2004.05.030. [DOI] [PubMed] [Google Scholar]
- Marambio-Jones C. Hoek E. M. J. Nanopart. Res. 2010;12:1531–1551. doi: 10.1007/s11051-010-9900-y. [DOI] [Google Scholar]
- Lemire J. A. Harrison J. J. Turner R. J. Nat. Rev. Microbiol. 2013;11:371–384. doi: 10.1038/nrmicro3028. [DOI] [PubMed] [Google Scholar]
- Liu J. Y. Sonshine D. A. Shervani S. Hurt R. H. ACS Nano. 2010;4:6903–6913. doi: 10.1021/nn102272n. [DOI] [PMC free article] [PubMed] [Google Scholar]
- Xiu Z. M. Zhang Q. B. Puppala H. L. Colvin V. L. Alvarez P. J. Nano Lett. 2012;12:4271–4275. doi: 10.1021/nl301934w. [DOI] [PubMed] [Google Scholar]
- Naska A. Bera S. Bhattachary R. Saha P. Roy S. S. Sen T. Jana S. RSC Adv. 2016;6:88751–88761. doi: 10.1039/C6RA14808E. [DOI] [Google Scholar]
- Wu K. Zhang S. Lin S. Wang J. X. Le Y. J. Nanosci. Nanotechnol. 2018;18:7767–7774. doi: 10.1166/jnn.2018.15541. [DOI] [Google Scholar]
- Mallakpour S. Hatami M. Polymer. 2018;154:188–199. doi: 10.1016/j.polymer.2018.08.077. [DOI] [Google Scholar]
- Suela K. John A. Arni V. Nicholas P. P. David J. M. Tobias H. Sebastien P. F. Giulio I. L. ACS Appl. Mater. Interfaces. 2016;8:19038–19046. doi: 10.1021/acsami.6b06052. [DOI] [PubMed] [Google Scholar]
- Shao W. Liu X. F. Min H. H. Dong G. H. Feng Q. Y. Zuo S. L. ACS Appl. Mater. Interfaces. 2015;7:6966–6973. doi: 10.1021/acsami.5b00937. [DOI] [PubMed] [Google Scholar]
- Chen J. N. Sun L. Cheng Y. Lu Z. C. Shao K. Li T. T. Hu C. Han H. Y. ACS Appl. Mater. Interfaces. 2016;8:24057–24070. doi: 10.1021/acsami.6b05730. [DOI] [PubMed] [Google Scholar]
- Rojas-Andrade M. D. Chata G. Rouholiman D. Liu J. L. Saltikov C. Chen S. W. Nanoscale. 2017;9:994–1006. doi: 10.1039/C6NR08733G. [DOI] [PubMed] [Google Scholar]
- Sinha T. Ahmaruzzaman Md. Adhikari P. P. Bora R. ACS Sustainable Chem. Eng. 2017;5:4645–4655. doi: 10.1021/acssuschemeng.6b03114. [DOI] [Google Scholar]
- Saravanan R. Khan M. M. Gupta V. K. Mosquera E. Gracia F. Narayanang V. Stephen A. RSC Adv. 2015;5:34645–34651. doi: 10.1039/C5RA02557E. [DOI] [Google Scholar]
- Ali M. Movahed H. Paydar R. RSC Adv. 2016;6:13657–13665. doi: 10.1039/C5RA21350A. [DOI] [Google Scholar]
- Wang X. Y. Zhu S. X. Liu L. Li L. D. ACS Appl. Mater. Interfaces. 2017;9:9051–9058. doi: 10.1021/acsami.7b00885. [DOI] [PubMed] [Google Scholar]
- Shubhangi B. Mayur T. Ayesha K. Satyawati J. RSC Adv. 2016;6:56674–56683. doi: 10.1039/C6RA08397H. [DOI] [Google Scholar]
- Ma P. M. Jiang L. Yu M. M. Dong W. F. Chen M. Q. ACS Sustainable Chem. Eng. 2016;4:6417–6426. doi: 10.1021/acssuschemeng.6b01106. [DOI] [Google Scholar]
- Tamai N. Myoui A. Tomita T. Nakase T. Tanaka J. Ochi T. Yoshikawa H. J. Biomed. Mater. Res. 2002;59:110–117. doi: 10.1002/jbm.1222. [DOI] [PubMed] [Google Scholar]
- Lin L. Chow K. L. Leng Y. J. Biomed. Mater. Res., Part A. 2009;89:326–335. doi: 10.1002/jbm.a.31994. [DOI] [PubMed] [Google Scholar]
- Pattanayak D. K. Rao B. T. Rama Mohan T. R. J. Sol-Gel Sci. Technol. 2011;59:432–447. doi: 10.1007/s10971-010-2354-y. [DOI] [Google Scholar]
- Shi C. Gao J. Wang M. Fu J. Wang D. Zhu Y. Mater. Sci. Eng., C. 2015;55:497–505. doi: 10.1016/j.msec.2015.05.078. [DOI] [PubMed] [Google Scholar]
- Indu B. Bikramjit B. Int. J. Appl. Ceram. Technol. 2018;15:961–969. doi: 10.1111/ijac.12846. [DOI] [Google Scholar]
- Hadidi M. Bigham A. Saebnoori E. Hassanzadeh-Tabrizi S. A. Rahmati S. Alizadeh Z. M. Nasirian V. Rafienia M. Surf. Coat. Technol. 2017;321:171–179. doi: 10.1016/j.surfcoat.2017.04.055. [DOI] [Google Scholar]
- Ding M. Sahebgharania N. Musharavatib F. Jaberc F. Zalnezhada E. Yoon G. H. Ceram. Int. 2018;44:7746–7753. doi: 10.1016/j.ceramint.2018.01.203. [DOI] [Google Scholar]
- Gholizadeh B. S. Buaza F. Hosseini S. M. Mousavi S. M. Int. J. Biol. Macromol. 2018;116:786–792. doi: 10.1016/j.ijbiomac.2018.05.104. [DOI] [PubMed] [Google Scholar]
- Yuan Q. Xu A. Zhang Z. Chen Z. Wan L. Shi X. Lin S. Yuan Z. Deng L. Mater. Chem. Phys. 2018;218:130–139. doi: 10.1016/j.matchemphys.2018.07.038. [DOI] [Google Scholar]
- Zhang X. Chaimayo W. Yang C. Yao J. Miller B. L. Yates M. Z. Surf. Coat. Technol. 2017;325:39–45. doi: 10.1016/j.surfcoat.2017.06.013. [DOI] [Google Scholar]
- Anjaneyulu U. Priyadarshini B. Grace A. N. Vijayalakshmi U. J. Sol-Gel Sci. Technol. 2017;81:750–761. doi: 10.1007/s10971-016-4243-5. [DOI] [Google Scholar]
- Predoi D. Popa C. L. Chapon P. Groza A. Iconaru S. L. Materials. 2016;9:778. doi: 10.3390/ma9090778. [DOI] [PMC free article] [PubMed] [Google Scholar]
- Narendran P. Rajendran A. Garhnayak M. Garhnayak L. Nivedhitha J. Devi K. C. Pattanayak D. K. Colloids Surf., B. 2018;169:143–150. doi: 10.1016/j.colsurfb.2018.04.039. [DOI] [PubMed] [Google Scholar]
- Gao M. J. Sun L. Wang Z. Q. Zhao Y. B. Mater. Sci. Eng., C. 2013;33:397–404. doi: 10.1016/j.msec.2012.09.005. [DOI] [PubMed] [Google Scholar]
- Cioffi N. Torsi L. Ditaranto N. Tantillo G. Ghibelli L. Sabbatini L. Bleve-Zacheo T. D'Alessio M. Zambonin P. G. Traversa E. Chem. Mater. 2005;17:5255–5262. doi: 10.1021/cm0505244. [DOI] [Google Scholar]
- Cao R. Francisco-Fernandez M. Quinto E. J. BMC Bioinf. 2010;11:77–89. doi: 10.1186/1471-2105-11-77. [DOI] [PMC free article] [PubMed] [Google Scholar]
- Liu A. Sun L. Zhao Y. Zhang Z. Curr. Nanosci. 2012;8:861–867. doi: 10.2174/157341312803988999. [DOI] [Google Scholar]
- Wu Y. Yang Y. Zhang Z. Wang Z. Zhao Y. Sun L. Adv. Powder Technol. 2018;29:407–415. doi: 10.1016/j.apt.2017.11.028. [DOI] [Google Scholar]
- Dhand V. Rhee K. Y. Park S. J. Mater. Sci. Eng., C. 2014;36:152–159. doi: 10.1016/j.msec.2013.11.049. [DOI] [PubMed] [Google Scholar]
- Ni Z. H. Wang Z. H. Sun L. Li B. J. Zhao Y. B. Mater. Sci. Eng., C. 2014;41:249–254. doi: 10.1016/j.msec.2014.04.059. [DOI] [PubMed] [Google Scholar]
- Iqbal N. Kadir M. R. A. Malek N. A. N. N. Mahmood N. H. B. Murali M. R. Kamarul T. Mater. Sci. Eng., C. 2013;48:3172–3177. [Google Scholar]
- Jegatheeswaran S. Sundrarajan M. Mater. Sci. Eng., C. 2015;51:174–181. doi: 10.1016/j.msec.2015.02.012. [DOI] [PubMed] [Google Scholar]


