

Abstract
Goal:
To develop a low-cost magnetic resonance imaging (MRI)-free transcranial focused ultrasound (FUS) system for microbubble-mediated therapy.
Methods:
A 128-element 11 MHz array for skull localization was integrated within a 256-module multi-frequency (306/612/1224 kHz) dual-mode phased array. The system’s transcranial transmit and receive performance was evaluated with ex-vivo human skullcaps using phase aberration corrections calculated from computed tomography (CT)-based simulations via ultrasound-based (USCT) and landmark-based (LMCT) registrations, and a gold-standard fixed source emitter (FSE)-based method.
Results:
Displacement and rotation registration errors of 1.4 ± 0.4 mm and 2.1 ± 0.2° were obtained using USCT, resulting in sub-millimeter transmit targeting errors driven at 306 kHz (0.9 ± 0.2 mm) and 612 kHz (0.9 ± 0.3 mm), and source localization errors of 1.0 ± 0.3 mm and 0.6 ± 0.2 mm at receive frequencies of 306 kHz and 612 kHz, respectively (mean ± SD). Similar errors were obtained using LMCT and no significant differences between these two approaches were found on either transmit (p = 0.64/0.99) or receive (p = 0.45/0.36) at 306 kHz/612kHz. During volumetric multi-point exposures, approximately 70% and 60% of the transmit frames in which microbubble activity was detected via FSE were recovered using USCT when imaging at the second-harmonic and half-harmonic, respectively, compared to 60% and 69% using LMCT.
Conclusion:
This low-cost ultrasound-guided transcranial FUS system affords USCT skull registration with accuracy comparable to LMCT methods.
Significance:
Such systems have great potential to advance the adoption of microbubble-mediated FUS brain therapy by improving access to the technology.
Keywords: Computed tomography, passive acoustic mapping, skull registration, transcranial focused ultrasound
I. INTRODUCTION
FOCUSED ultrasound (FUS) in conjunction with intravenously circulating microbubbles has been widely investigated for transcranial therapy, due to its ability to transiently and selectively increase blood-brain-barrier (BBB) permeability [1] for targeted drug delivery to the brain. Various therapeutic agents can be delivered to the brain parenchyma using this non-invasive technique, and positive therapeutic outcomes have been demonstrated in pre-clinical disease models [2-4]. The approach is now in clinical trials for the treatment of primary (clnicaltrials.gov, NCT02253212 [5], NCT02343991 [6], NCT04446416, and NCT04118764) and metastatic (NCT03714243 [7]) brain tumors, Alzheimer’s disease (NCT02986932 [8], NCT03671889 [9]), and amyotrophic lateral sclerosis (NCT03321487 [10]). Although MR-thermography is critical for guiding thermal applications of FUS brain therapy [11, 12], MRI is not an ideal imaging modality for treatment monitoring and control during FUS and microbubble-mediated BBB permeabilization due to the non-thermal nature of the procedures [1, 8]. Furthermore, the temporal resolution of MRI (acquisition times ~100-102 sec) is low relative to the time course of the interactions between ultrasound-stimulated microbubbles and the surrounding vasculature (10−6-10−3 sec). Lastly, the high costs associated with MRI will limit the technology’s immediate use primarily to the developed world.
Previous studies have linked spectral characteristics of the cavitation emissions generated during microbubble-mediated FUS treatments with the observed bioeffects [13-15], suggesting these signals may provide feedback for online monitoring and control of the procedures. One general approach is to use sub- or ultra-harmonic signals to calibrate ultrasound exposure levels such that BBB permeability is increased without causing overt tissue damage [16-19]. Others have used second-harmonic and broadband signals to control exposures [15, 20]. With an array of receivers, cavitation activity can be mapped spatially [21-23] via beamforming techniques [24, 25], and this approach that has been employed during microbubble-mediated brain therapy in vivo [26, 27]. Our group has recently developed large-aperture hemispherical transmit/receive phased array systems for microbubble-mediated transcranial therapy delivery and simultaneous three-dimensional (3D) cavitation mapping [18, 28, 29]. With one of these systems, we have demonstrated the feasibility of using 3D microbubble imaging to calibrate exposure levels for safe BBB opening [18] and to predict the tissue damage volume distributions during non-thermal brain ablation [30] in vivo in rabbits.
Another important aspect of transcranial microbubble-mediated FUS therapies involves the aberration corrections needed to compensate for the focal distortions induced by the presence of the human skull [31, 32]. In the existing clinical FUS brain systems, CT-based skull aberration correction are employed to correct the phase and amplitude of each individual phased array element on the basis of the skull density information derived from preoperative CT scans of the patient’s head [32-34]. Intraoperative MRI is required for targeting and the registration of the CT coordinates system of the skull to the ultrasonic space [12].
Due to the limited accessibility and the high cost of MRI, it would be favorable to develop an ultrasound-based skull registration method without the use of MRI. For instance, an optically tracked A-mode ultrasound probe was used to localize the anatomical landmarks on the bone surface transcutaneously [35] and the transformation matrix was optimized with iterative closest point (ICP) algorithm [36]. However, an optical tracking system has to be introduced into the registration technique. An alternative approach has been developed in our lab by using a high frequency (11 MHz) ultrasound transducer array to localize the outer surface of the skull and directly register its geometry from the CT coordinate system to the ultrasonic treatment space [37] via optimization with an ICP algorithm [38], achieving average sub-millimeter displacement and sub-degree rotation registration error comparable to the gold-standard landmark-based registrations. This earlier work investigated only the registration aspect as the localization array was not integrated within a therapy device, although simulations showed the possibility of using this ultrasound-based registration method to achieve trans-skull focusing at 230 kHz with a focal pressure reduction of approximately 1% and a targeting error around 1 mm on average relative to the case with landmark-based registration. Separate work from Crake et al. employed a similar approach when integrating a combined localization and passive imaging array within a commercial transcranial MRI-guided FUS system, achieving translational and rotational registration errors on the order of ±2 mm and ±2° respectively [39].
To further investigate the feasibility of ultrasound-guided FUS brain therapy, we have integrated a high frequency (11 MHz) array for skull localization within an existing clinical-scale multi-frequency (306, 612, and 1224 kHz) sparse hemispherical transmit/receive phased array [18]. The resulting FUS brain system enables direct characterization of the array performance obtained from ultrasound-based skull CT registration. In this study, we characterized the array’s transcranial transmit and receive capabilities via benchtop experiments with ex-vivo human skull specimens and phase aberration corrections calculated via USCT. For comparison, measurements were also carried out with the LMCT approach and the gold-standard FSE-based method.
II. Materials and methods
A. Clinical Scale Ultrasound-Guided Phased Array Brain System
A clinical-scale ultrasound-guided phased array brain system was developed by integrating a high-frequency skull localization array within an existing transmit/receive array for transcranial therapy delivery and simultaneous treatment monitoring. The base frame of the array was a hemispherical dome (radius of curvature = 15.9 cm, aperture = 31.8 cm) that was formed by assembling four separate quadrants of plastic 3D printed shells (Accura® ClearVue™, Viper™ si2SLA®; 3D systems, Inc., Rock Hill, SC, USA). The transmit/receive array is similar to that described in [18, 29], and consists of 256 modules distributed sparsely over the inner surface of the hemispherical shell with 64 modules per quadrant [Fig. 1(a)]. The sparse module arrangement was optimized via numerical simulations to suppress grating/side lobe formation [18]. Each module comprises three concentric cylindrical lead zirconate titanate (PZT-4) elements (Del Piezo Specialties, LLC, West Palm Beach, FL, USA) driven in their lateral coupling mode resonance frequencies at 306, 602, and 1224 kHz [Fig. 1(b)]. The element dimensions [29] were designed to maintain the ratio of element size to the acoustic wavelength to achieve a similar steering range across all three driving frequencies. Cylindrical holders were rapid prototyped to hold the concentric elements and keep their front surface at the same height. A layer of thin film (Mylar™; DuPont, Wilmington, DE, USA) was epoxied to the front surface to seal the modules and provide air loading for the cylindrical transducers. Signal and ground wires were attached to the inner and outer surface of each cylindrical element and soldered to an adapter connected to a circuit board to enable channel switching. The modules from each quadrant were connected to a multiplexer board and a custom driving system, which enabled selection of the desired transmit and receive frequencies across the entire array. Variable gain pre-amplifiers were added to the receive lines. Following construction of the transmit/receive array, the module locations were confirmed via acoustic triangulation using a narrowband FSE (piezoceramic tube; 1 mm diameter, 5 mm length, 0.5 MHz center frequency) following the procedures described in previous studies [18, 28].
Fig. 1.

(a) Transmit/receive module and high frequency element layouts. The array is separated into four quadrants (circles, squares, stars, and triangles). (b) Transmit/receive module design schematic. (c) High frequency element design schematic. (d) Experimental setup.
The high-frequency skull localization array is similar to that described in [37], and consists of 128 elements (center frequency = 11.2 ± 0.4 MHz, bandwidth = 2.0 ± 0.9 MHz; mean ± SD) distributed sparsely over the remaining hemispherical array aperture [Fig. 1(a)]. Each element was made of lead zirconate titanate (PZT-5) in square shape with dimensions of 2 × 2 mm2 and it was seated on a rectangular rapid prototyped holder (2 × 2 × 10 mm3), [Fig. 1(c)]. The elements were backed with a 3:1 by weight mixture of PZT powder (Del Piezo Specialties, LLC, West Palm Beach, FL, USA) and epoxy (EPO-TEK 301, Epoxy Technology, Billerica, Massachusetts, United States). The impulse response of the 11 MHz element was obtained by analyzing the pulse-echo signals from an acrylic mini hemispherical dome with aperture of 10 cm and wall thickness of 6 mm placed at the geometric focus of the clinical prototype phased array. The elements were driven by a pulser/receiver (DPR300, Imaginant Inc., Pittsford, NY, USA) one by one with 1 sec interval. The echoes were received by the same element and the raw radio frequency (RF) signals were saved via an oscilloscope card (Alazar Technologies Inc., Pointe-Claire, QC, Canada) installed on PC (200 μs capture length, 100 MS/s sampling rate, 64 averages). Pre-amplifiers with 10 × gain setting were also added to maximize the reflected signals. In addition, a series of matched filters were obtained for each channel by recording the waveforms of the first echo reflected from the mini dome, serving as a unique template for each channel for the later cross-correlation process with the echoes from the skull outer surface [Fig. 2(a)]. Following construction of the high-frequency skull localization array, the element locations were confirmed via acoustic triangulation [28].
Fig. 2.
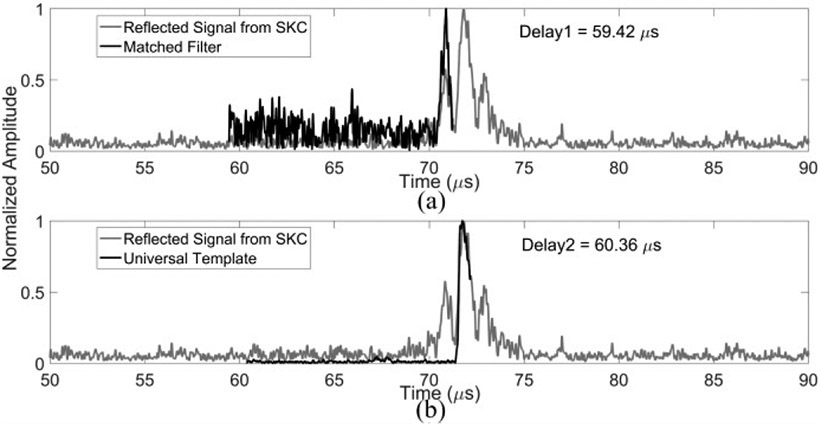
Cross-correlation of a representative echo (channel #37) reflected from an ex-vivo human skullcap (SKC) with (a) an element-specific matched filter and (b) a universal template signal. Hilbert transform magnitudes are plotted.
B. Benchtop Experiments
The experimental setup is illustrated in Fig. 1(d). A skull holder frame was mounted to the phased array. There was one screw on each side to mount the mating skull frame attached to the skull caps, in order to assure repeatable placement of ex-vivo skull cap during the measurements. 4 different ex-vivo human skull caps were used in this study. The skull caps were placed in degassed, deionized (DI) water and degassed in a vacuum chamber for at least 2 hours before being placed in the phased array pre-filled with degassed, DI water.
The localization of the outer surface of the skull was performed with a pulser / receiver and an in-house built circuit, which allowed the 11 MHz elements to be serially excited with a 2.12-μs burst. The echoes (200 μs capture length) from the skull caps were amplified, recorded and averaged over the 128 acquisitions at a sampling rate of 100 MS/s. Registration with the gold-standard landmark method was also conducted by moving the FSE to a minimum of four fiducial markers in the skull to measure the coordinates relative to the geometric focus (0, 0, 0) in the ultrasound space. The locations of the same markers were later located in CT images in order to calculate the transformation matrix, so that the skull data in CT space could be converted to US space [40]. The four skull cap specimens SKA-D and the corresponding CT images as described in Ref.[34] were used in this study. The skull density and thickness information were derived from the CT images for simulations. The protocol to preserve the skull cap specimens has been described in Ref.[41], without collecting any personal data. The skull CT consisted of 512 × 512 × 297 voxels on average, with voxel dimensions of 0.625 mm × 0.625 mm × 0.625 mm.
Two sets of skull aberration corrections were calculated using a 3D full-wave model based on the linearized Westervelt equation, with transformation matrices obtained from both ultrasound- and landmark-based methods [40]. FSE-based phase aberration correction was also performed to offer a comparison. The FSE was driven with an impulse function and the emitted signal was received by the transducers on the phased array at one of the three frequencies (306, 612, and 1224 kHz) without and with the insertion of ex-vivo skull specimen (sampling rate: 40 MS/s). Receive averaging (128 averages) was used to increase the signal-to-noise ratio (SNR). The received RF waveforms from either simulations or benchtop measurements were digitally filtered using a fourth order Butterworth bandpass filter with a bandwidth ± 200 kHz from the center frequency at 306 kHz and 612 kHz.
The phase corrections from each of the three different correction methods were then applied to the therapeutic array to access the targeting errors and insertion loss by measuring the acoustic field distribution at the geometric focus of the hemispherical array. The characterization of acoustic field distribution was similar to the process described in [29]. The therapeutic array was driven with a 50 - 100 μs-burst at a pulse repetition frequency (PRF) of 50 Hz by an in-house built 256-channel driving system. A calibrated fiber optic hydrophone (active element diameter = 10 μm, FT-17-22, Precision Acoustics, Dorset, UK), mounted on a three-axis positioning system (Superior Electric Motors, Inc., Bristol, CT, USA; Velmex, Inc., Bloomfield, NY, USA), was used to receive the transmitted signals and calibrate the acoustic pressure. The hydrophone signals were captured by a digital oscilloscope (TDS 3012B, Tektronix, Richardson, TX, USA) and saved via an RS-232 serial connection to a central processing unit (CPU) for further analysis. The spatial-peak-temporal-peak (SPTP) negative pressure at each operating frequency was obtained at various electronic beam steering distances along the lateral and axial axes within the field with and without the insertion of skull specimen. The effective steering range was then calculated as the range within which the SPTP negative pressure at the target is greater than or equal to 50% of the SPTP pressure at the geometric focus. It was estimated for each operating frequency via one dimensional (1D) Gaussian fitting to the data shown on Fig. 3. The errors of the pressure measurements came from the 13% uncertainty of the fiber optic hydrophone sensitivity. The errors of the steering range were based on the uncertainty of 5% in the Gaussian fitting procedure.
Fig. 3.
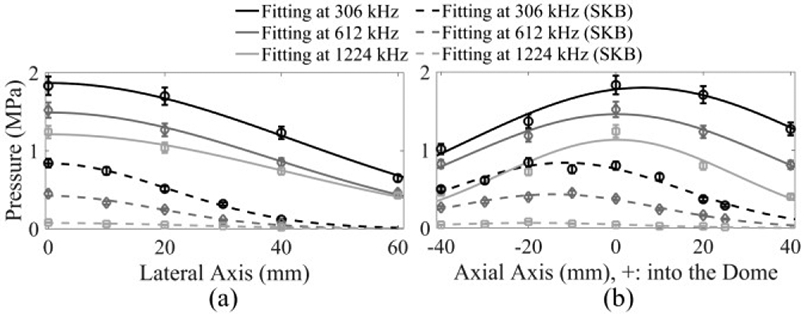
SPTP negative pressure obtained in water (solid lines) and when transmitting through an ex-vivo human skullcap (SKB, dashed lines) as a function of target location for beam steering along (a) lateral (X) and (b) axial (Z) axes at transmit frequencies of 306 kHz (black), 612 kHz (dark gray) and 1224 kHz (light gray). 1D Gaussian fits were added to the plots.
Receiver performance was investigated by capturing signals from an FSE (captured burst length: 200 μs; sampling rate: 40 MS/s) as well as from microbubbles (Definity™, Lantheus Medical Imaging, North Billerica, MA, USA) flowing in a polytetrafluoroethylene tube phantom volumetrically (inner diameter = 0.8 mm, outer diameter = 1.4 mm, Cole-Parmer, Vernon Hills, IL). The microbubbles were gravity fed at a flow rate of approximately 3.2 mL/min. The microbubbles were diluted in DI water with a ratio 1:106 by volume, corresponding to the concentration of approximately 5.3 × 10³ bubbles/mL [28]. Throughout the volumetric sonication, the therapeutic array was driven with a burst length of 150 μs to the target (0, 0, −10) through skulls (SKC & SKD) and electronically focused to 45 (66) different targets in total for a sonication duration of 90 (62) sec at 0.5 Hz PRF, covering the bottom portion of the tube phantom with a volume of approximately 10 mm × 2 mm × 3 mm. The acoustic pressure through SKC was approximately 0.6 MPa (0.4 MPa) at 306 kHz (612 kHz), and 0.4 MPa (0.3 MPa) through SKD. Skull aberration correction was done at the location (0, 0, −10) mm and was applied to the other targeting locations in the electronic steering volume. Received data was captured for 410 μs beginning simultaneously with the transmit event, using the elements on the array in receive mode at the subharmonic or second harmonic of the driving frequency. The data were recorded using two 128-channel receivers (SonixDAQ; Ultrasonix, Inc., Richmond, BC, Canada) at a sampling rate of 10 MS/s.
C. Localization of the Skull Outer Surface
The localization of the outer surface of the skull was based on an ICP approach as described in [37, 38]. To extract the skull outer surface, the CT image intensity in Hounsfield units was first converted to a density map based on a linear relationship [42]. The outer surface of the skull was segmented from the CT data by thresholding the density (ρ > 1200kg/m3) and the isosurface of skull data was found. The resulting surface was defined by a series of vertices and faces in 3D. Rough alignment was done by manually rotating and translating the skull data in CT coordinate space.
The echoes from the mini hemispherical dome and the skulls were then analyzed. Since the mini dome had a homogeneous structure and smooth surface, it was easier to find the rising edge of the reflected signals. Similar to the method described in [37], the reflection data were digitally filtered with a fourth-order Butterworth bandpass filter and the signal envelope was extracted via the Hilbert transform. One channel was selected as a template. The inflection point of the rising edge of the signal envelop was manually chosen. It was used to find the lags via cross-correlation between the channels in order to locate the inflection point for the other elements. The reflected RF signals from the mini dome and the corresponding inflection point locations were then used for the cross-correlation with the signals from the skull surfaces, acting as matched filters since they contained the impulse response information for each specific channel. Fig. 2 provides an example of the cross-correlation performed with and without the use of matched filter. Although the universal template waveform used in Fig. 2(b) has higher signal-to-noise-ratio (SNR) than the element-specific matched filter in Fig. 2(a), it failed to identify the rising edge of the reflected signal from the ex-vivo human skull cap, resulting in a distance difference of 1.4 mm in water. The time associated with the location of the inflection point was denoted as Δti. The localization of the skull outer surface can then be treated as solving an optimization problem using a closest-points based approach. As shown in Fig. 4, the distance from the i th element to where the first echo occurred could be inferred from the time of flight Δti, as cΔti/2, where c is the speed of sound in water. This distance had been served as a radius for a spherical bounding surface centered at each 11 MHz element ri. The purpose of the optimization is then to minimize the cost function described as follows [37]:
| (1) |
where x is the vector of values that minimized the cost function, including three Euler angles (i.e., roll, pitch, yaw) and translations along the three Cartesian directions, Di(x) is the absolute value of the shortest distance between the spherical control surface for the i th element and the vertices on the skull outer surface, Pi(x) is a penalty function. Di(x) was denoted as:
| (2) |
where T(x) is the transformation matrix that convert the skull vertices from CT to ultrasound coordinate system, rj is a vector representing the location of a point j on the skull outer surface, ri is a vector representing the location of the 11 MHz element i, and ∣∣·∣∣ represents the Euclidean norm. The value of the penalty function Pi(x) depends on the relative position of the skull outer surface to the spherical control surfaces, as expressed as follows:
| (3) |
| (4) |
Fig. 4.
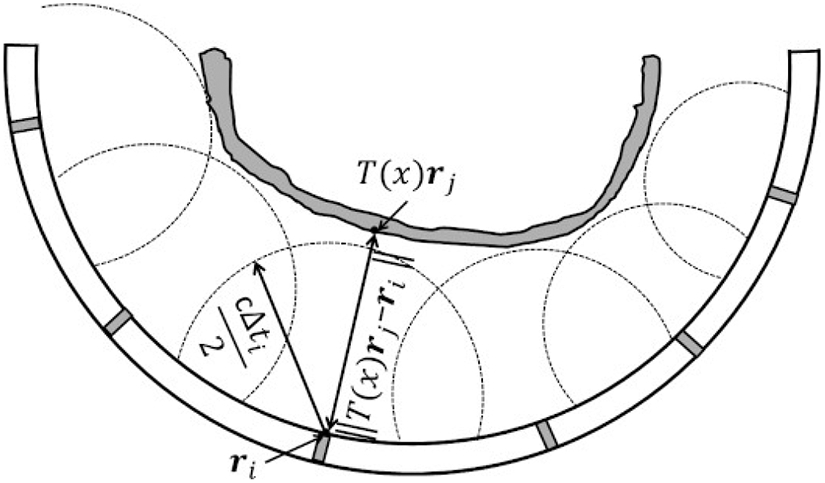
Illustration of the spherical control surfaces centered at transducer element i with location vector ri and having radius of cΔti/2, and the shortest absolute distance from element i to a vertices rj on the skull outer surface with transformation matrix T(x) applied. The optimized situation was that the radius equals to the shortest distance, i.e., skull sits right at the spherical boundaries.
If the shortest distance from the i th element to the outer surface of skull (i.e., ∣∣T(x)rj − ri∣∣,) is smaller than the radius of the spherical control surface (i.e., cΔti/2), the penalty function has the value of the distance the skull outer surface has intruded the spherical boundary with the multiplication of a weighting factor a, (a = 0.5 by default). Otherwise, the penalty function is 0 for the cases that the outer surface of the skull has no intersection with the spherical boundaries. The optimization was conducted by using a constrained solver in MATLAB to solve the transformation matrix T(x) that minimized Equation. (1). The initial starting rotational angles and translations were all set to 0. The restricting rotations about and translations along each axis were ± 10° and ± 3 mm, respectively. For each iteration during the optimization, the cost function was evaluated for the elements that could provide reflected signals with clear rising edges (79 elements in total for the localization of all 4 skull specimens used in this study), in order to avoid errors in the calculation of Δti negatively impacting the optimization process. The remaining 49 elements provided either low or no signals due to the oblique incidence angles on the skull surfaces or the open circuit condition during construction. The convergence time of the optimization varied between 100-500 sec using a computer with Intel(R) Core(TM) i5-6500 CPU.
D. Reconstruction of Passive Acoustic Map (PAM)
The reconstruction of PAM was performed offline following data acquisition. For the passive imaging experiments, the therapeutic array transmit frequency was set to either 306 or 612 kHz, with corresponding receive frequencies of 612 and 306 kHz, respectively. Signals captured in the control case of flowing DI water in the tube phantom, were subtracted from the microbubble cavitation data. This was done to minimize the reflections from stationary features such as the skull surfaces, water-air interface, tube walls and so on. A fourth-order Butterworth filter was used to filter the raw RF data to eliminate the DC bias and the transmit frequency, with 400 kHz bandwidth centered about the receive frequency. The filtered RF data were then beamformed and reconstructed using PAM similar to the beamforming algorithm described in previous studies [24, 28]. A pre-defined cubic imaging region of interest (20 × 20 × 20 mm3 with voxel size of λ/10 depending on the receive frequency) was chosen with the targets centered in the reconstruction volume. The received signals from the array can be delayed and summed to achieve the image intensity at each voxel in the way described in [34]. In this study, the amplitude scale factor was set to 1 for all receivers. The skull delay term was achieved using one of the three skull correction methods, LMCT-based simulation, USCT-based simulation, or FSE-based measurement.
E. Skull Phase Aberration Corrections
Skull phase aberration corrections were calculated via simulation based on the density maps derived from the preoperative CT scans, and then compared with the gold-standard FSE-based phase correction method. RF signals were received by the receive elements via experiments and numeric simulation with and without skull insertion. As shown in Fig. 5, the examples of the cross-correlation with three different methods at 306 [Fig. 5(a,b)] and 612 kHz [Fig. 5(d,e)] were given before (top) and after (bottom) the skull delay terms were applied. Examples of the time delays induced by the skull (SKB) over the entire 256 receive element were shown at the receive frequency of 306 kHz [Fig. 5(c) top] and 612 kHz [Fig. 5(f) top]. The corresponding phase differences between the LMCT-, USCT-, and FSE-based methods were displayed at 306 kHz [Fig. 5(c) bottom] and 612 kHz [Fig. 5(f) bottom] as well.
Fig. 5.

Illustration of skull aberration calculations at the array’s geometric focus for a single skull cap (SKB). Signals measured using the FSE-based method (a,d) and simulated using the LMCT- and USCT-based methods (b,e) are shown with and without the presence of an intervening skullcap for a single receiver element (channel #143, top row), along with the aligned signals following cross-correlation (bottom row) at receive frequencies of 306 kHz (a,b) and 612 kHz (d,e). Skull-induced time delay terms (top) and the corresponding phase differences between the LMCT-, USCT- and FSE-based methods (bottom) across the entire 256-module array at receive frequencies of 306 kHz (c) and 612kHz (f).
The geometry of the simulation was defined as follows. First, a skull density map was achieved, and skull matrix was extracted the same way as described in Section IIC. To preserve the original CT data, the array geometry was then transformed from the ultrasound space to the CT space by the multiplication of the inverse of the T matrix obtained from the ultrasound- and landmark-based localization modalities. A larger numerical volume was created to include both skull and array geometries. The skull matrix, with a discretization size of 0.625 mm × 0.625 mm × 0.625 mm, was resampled to be able to fit in the new simulation volume, with a spatial discretization of 10 points per wavelength in water, about 0.49 mm (0.25mm) at 306 kHz (612 kHz). Due to memory limitations, 1224 kHz wasn’t simulated. For each cylindrical transducer, the transducer geometry was first discretized into small elements in a polar coordinate system (10 points per wavelength in water, 1 degree) and then converted to Cartesian system.
A hybrid full-wave ultrasound propagation model was used to simulate the ultrasound propagation inside the phased array without / with skull and solved with finite difference method. The governing wave equation to model the linear ultrasound propagation in water domains can be expressed as [43]:
| (5) |
where p is the acoustic pressure, c is the speed of sound in water, α is the attenuation at angular frequency ω (α = 0), and ρ is the density of the propagation medium (ρ = 1000 kg/m3), respectively.
In solid (e.g., skull) domains, the governing equation is given by [44]:
| (6) |
where u is the particle displacement vector in the three Cartesian directions, τ is the symmetric stress tensor. The longitudinal speed of sound, cL, and attenuation coefficient, αL, in the skull bone, were obtained using a spline interpolation of the acoustic data over a range of frequencies from a previous study [41]. The shear speed of sound and attenuation coefficient were scaled from the longitudinal acoustic parameters as a function of density: and [45].
In order to maintain the numerical stability of the model, a maximum Courant-Friedrichs-Lewy value of 0.1 was used, and the spatial discretization was λ/10 at the given driving frequency. Each therapeutic element in transmit mode was driven with a sinusoidal signal. The Neumann boundary condition was used on the interfaces between transducer faces and water. The absorbing boundary condition [46] was used on other boundaries so that the incoming sound waves would not be reflected back into the simulation domain.
The wave propagation time in simulation was approximately 133 μs, allowing the wave to travel for a distance of 20 cm. The total size of the numerical domain was approximately 660 × 611 × 564 voxels (1320 × 1221 × 1128 voxels) at 306 kHz (612 kHz). The linear full-wave model was implemented in C++ and message passing interface (MPI, Intel®, Santa Clara, CA, USA) parallel computations [47]. The simulations were run on a computer cluster with an OpenHPC setup (CentOS + Warewulf + SLURM) consisting of 3 partitions, two partitions (Intel Xeon E5-2640 at 2.50 GHz and E5-2630 v3 at 2.40 GHz) of which were with four computing nodes each, and the other one (Intel Xeon E5430 at 2.66 GHz) with 8 nodes.
III. Results
A. High Frequency Ultrasound Skull Registration
The total displacement and rotation errors using the ultrasound-based registration method were 1.4 ± 0.4 mm and 2.1 ± 0.2° on average among all four skull cap specimens, assuming that the landmark-based registration method provides the ground truth data.
B. Transmit Array Characterization
The electronic beam steering capabilities of the therapeutic array for each driving frequency without/ with the presence of human skull cap are shown in Fig. 3. The array’s SPTP pressure was approximately 1.8, 1.5, and 1.2 MPa without skull and 0.8, 0.4, and 0.08 MPa with human skull insertion at a driving system input voltage of 90 V peak-to-peak for the operating frequencies of 306, 612, and 1224 kHz, respectively. The corresponding effective steering ranges are summarized in TABLE 1. Similar steering ranges were achieved for each of the operating frequencies.
TABLE 1.
Effective transmit steering range at different driving frequencies with and without an intervening ex-vivo human skull cap (SKB). The errors quoted are based on the uncertainty in the Gaussian fitting procedure.
| Frequency (kHz) | 306 | 612 | 1224 | ||
|---|---|---|---|---|---|
| Steering Range (mm) | No Skull | Lateral | 99 ± 3 | 90 ± 3 | 96 ± 3 |
| Axial | 97 ± 8 | 85 ± 5 | 63 ± 8 | ||
| Skull | Lateral | 49 ± 1 | 45 ± 2 | 55 ± 3 | |
| Axial | 62 ± 3 | 57 ± 1 | 52 ± 4 | ||
C. Transmit Characterization of Transcranial Aberration Correction Methods
Fig. 6 quantifies the performance of each trans-skull aberration correction technique when applied to the transmit array driven at the frequencies of 306 kHz and 612 kHz. Target location was 10 mm above the geometric focus along the axial axis. The USCT numeric model gave an average skull insertion loss of approximately 55 ± 9 % and 80 ± 7 % over all four skulls at 306 kHz and 612 kHz, respectively, similar to the value achieved with the CT simulation based on the gold-standard registration method with landmarks (LMCT). In terms of the average skull insertion loss, both CT-based correction methods had values of 55 ± 8 %, similar to the gold-standard FSE-based method at 306 kHz. The values were increased to 80 ± 6 %, approximately 5% higher than the FSE-based case at 612 kHz. As to the peak side lobe ratio, defined as the ratio of the peak pressure of the side lobe over the main lobe, the average value from the USCT-based method was 0.50 ± 0.04 at the operating frequency of 306 kHz, close to both the LMCT- and FSE-based methods, which were 0.48 ± 0.05 and 0.48 ± 0.03, respectively. At 612 kHz, the USCT- and LMCT-based methods have peak side lobe ratio of 0.80 ± 0.05 and 0.70 ± 0.07, respectively, higher than the FSE-based-method of 0.50 ± 0.09. In addition, both USCT- and LMCT-based methods resulted in similar targeting errors, whose focuses were 0.9 ± 0.2 mm (0.9 ± 0.3 mm) and 0.8 ± 0.3 mm (0.9 ± 0.2 mm) on average shifted away from the geometric focus at 306 kHz (612 kHz), respectively. No significant difference was found between them in terms of the targeting errors based on the results of two-tailed t-tests at both 306 kHz (t(6) = 0.49, p = 0.64) and 612 kHz (t(6) = 0.0069, p = 0.99). Comparing to the CT-based method, the FSE-based method provides a more accurate targeting performance with focal shifts of 0.1 ± 0.2 mm and 0.2 ± 0.2 mm at 306 kHz and 612 kHz, respectively. The full-width-at-half-maximum (FWHM) was measured for each focus via two-dimensional (2D) Gaussian fitting. The USCT results were no worse than the LMCT and the FSE-based skull aberration correction methods. Improvement of targeting accuracy and focus integrity was shown from the measurement with all three phase correction methods when comparing to the case with no phase correction applied to the transmit array case as expected.
Fig. 6.
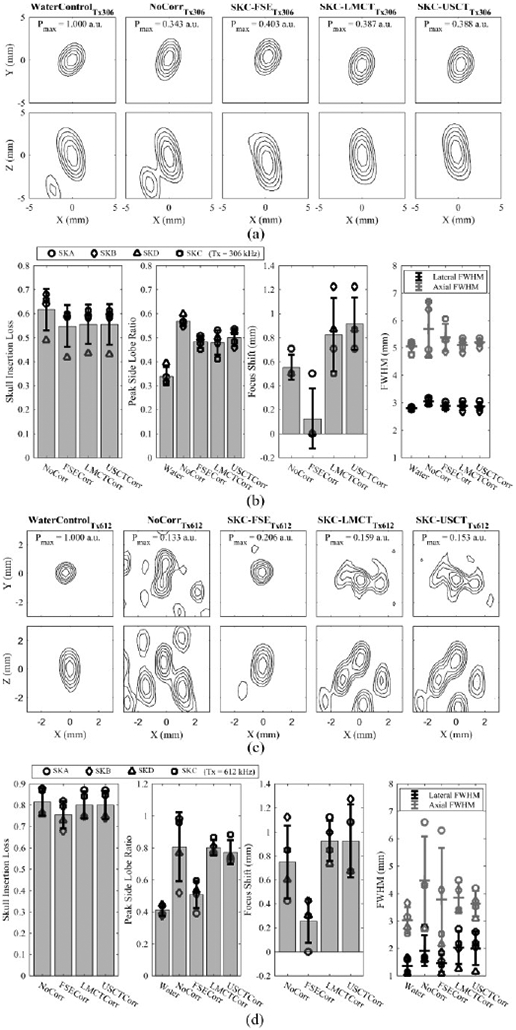
(a) Normalized contour images of the acoustic field distribution obtained in water and when transmitting through an ex-vivo human skullcap (SKC) without aberration corrections and with FSE-, LMCT-, and USCT-based skull phase corrections at a transmit frequency of 306 kHz. The SPTP negative pressure is given normalized to the water control case. (b) Transmit focal quality metrics quantified across multiple skullcaps (SKA-D) at a transmit frequency of 306 kHz. Error bars represent one standard deviation. (c) and (d) illustrate analogous data to (a) and (b), respectively, at a transmit frequency of 612 kHz.
D. Receive Characterization of Transcranial Aberration Correction Methods
The results from all fixed source experiments testing the transcranial receive capability from all four skull caps are summarized in Fig. 7 through different image quality metrics. A small decrease of trans-skull intensity of the reconstructed source with PAM was observed with the USCT method, which was 18 ± 5 % and 5 ± 3 % on average receiving at 306 kHz and 612 kHz, respectively, approximately 2% lower than the intensity reconstructed with the FSE-based correction method and similar to the values achieved with LMCT-based method. The peak side lobe ratio of the image intensity was also quantified. When the array received at 306 kHz, the ratio was on average of 0.18 ± 0.05 from both the USCT- and LMCT-based correction methods, similar to the mean ratio of 0.16 ± 0.04 obtained by the FSE-based method. A higher side lobe intensity was observed with the receive frequency at 612 kHz, with a ratio of 0.5 ± 0.2 from both USCT- and LMCT-based methods and 0.33 ± 0.06 by the FSE-based method. In addition, a trans-skull positional error with respect to the true source location in the water control case was observed in the reconstructed images. For the source located at the geometric focus of the hemispherical array, the error with the USCT-based method was 1.0 ± 0.3 mm (0.6 ± 0.2 mm) and 1.0 ± 0.3 mm (0.7 ± 0.1 mm) with the LMCT-based method, both of which were higher than the FSE-based correction method, with a localization error of 0.2 ± 0.2 mm (0.2 ± 0.1) at the receive frequency of 306 kHz (612 kHz). No significant difference was found between the LMCT- and USCT-based methods in terms of the errors of the transcranial source localization based on the results of two-tailed t-tests at both 306 kHz (t(6) = 0.81, p = 0.45) and 612 kHz (t(6) = 1.0, p = 0.36). When comparing the size of the reconstructed source, the USCT and LMCT had a wider intensity-FWHM on average, especially along the axial direction at the higher receive frequency. All three correction methods showed improvement of the imaging quality compared to the ones with no skull phase aberration correction.
Fig. 7.
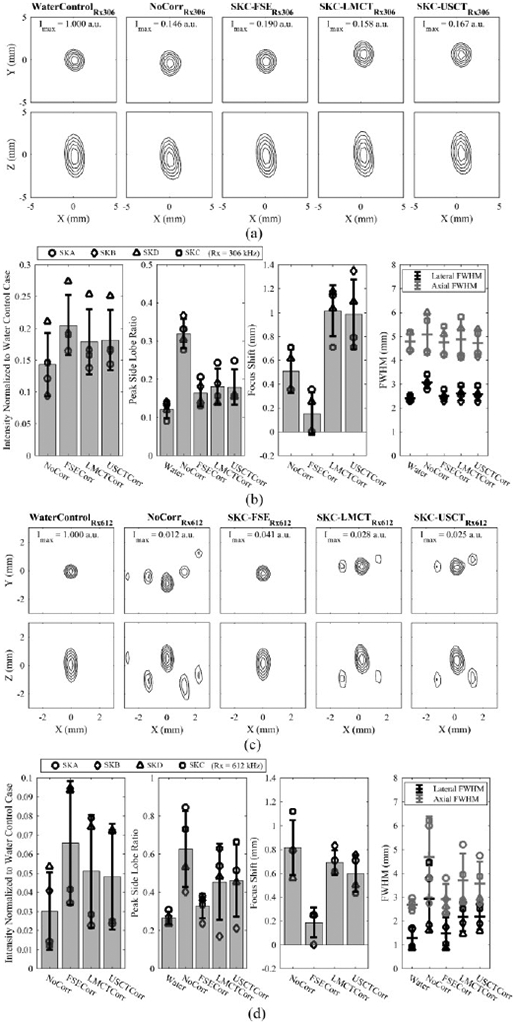
(a) Normalized MIP contour images of the FSE located at the array’s geometric focus, reconstructed in water and when transmitting through an ex-vivo human skullcap (SKC) without aberration corrections and with FSE-, LMCT-, and USCT-based skull phase corrections at a receive frequency of 306 kHz. The SPTA intensity is given normalized to the water control case. (b) Image quality metrics quantified across multiple skullcaps (SKA-D) at a receive frequency of 306 kHz. Error bars represent one standard deviation. (c) and (d) illustrate analogous data to (a) and (b), respectively, at a receive frequency of 612 kHz.
E. Volumetric Multi-Point Microbubble Imaging
Fig. 8 depicts results from a tube phantom experiment imaged at both second- and half- harmonic through the thickest skullcap (SKC) among the four specimens. It shows that transcranial microbubble imaging without skull delay corrections results in substantial distortion [29, 34]. The use of skull delay corrections with all three methods allowed a large portion of the tube to be visible. To further compare the three correction methods, the number of good reconstruction frames (peak side lobe intensity < −3 dB) over the total number of frames were summarized in TABLE.2. It is shown that the USCT-based method provided a successful reconstruction rate of 69.8% and 59.7% of the transmit frames in which microbubble activity was detected via the gold-standard FSE-based method at the second-harmonic and at the half-harmonic imaging frequencies, respectively, compared to 59.3% and 68.9 % for the LMCT-based method.
Fig.8.
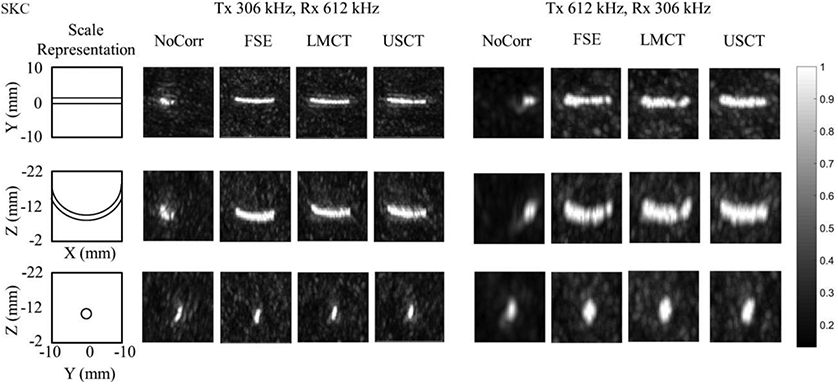
Normalized multi-frame MIP images of the tube phantom obtained through an ex-vivo human skullcap (SKC).
TABLE.2.
Percentage of frames in which spatially-coherent microbubble activity (peak side lobe ratio ⩽ −3 dB) was recovered via LMCT- and USCT-based skull phase correction methods relative to the number of frames containing spatially-coherent microbubble activity using FSE-based corrections.
| Skull Phase Correction Method | LMCT | USCT | |
|---|---|---|---|
| Percentage of Frames | Second-harmonic | 69.8% | 59.3% |
| Half-harmonic | 59.7% | 68.9% | |
IV. Discussion
The results of this study show that the USCT-based non-invasive skull aberration correction method can achieve similar transcranial transmit and receive performance as the gold-standard LMCT-based method, via the trans-skull experiments done on a clinical scale prototyped hemispherical array that combined a 128-element diagnostic transducer array and a 256-module multi-frequency therapeutic transmit/receive array. This demonstrates the potential of integrating the subarrays for skull localization, therapy, and passive imaging into one system for the microbubble-based transcranial treatments.
Targeting errors resulting from registration errors were investigated experimentally. Average errors of approximately 0.9 mm were obtained at the operating frequencies of 306 and 612 kHz. These targeting errors are acceptable for applications such as targeted drug delivery, in which the treatment volume is much larger than a single focal volume, and the targeting accuracy is not as critical as high intensity FUS for the thermal ablation in the treatments such as essential tremor [48, 49]. USCT-based skull correction method has shown the capability to restore the focal pressure to levels similar to the LMCT- and FSE-based methods at 306 kHz, and around 5% lower than the FSE-based method at the operating frequency of 612 kHz.
Sources reconstructed via PAM with the skull delay corrections from USCT-based method were compared to the LMCT- and FSE-based methods, in several aspects including the source intensity restoration, localization accuracy and the change of intensity-FWHMs. No obvious differences were observed between the USCT- and LMCT-based methods, which demonstrate the promise of using ultrasound-based methods for skull registration in transcranial treatments. The lateral intensity-FWHMs were increased in both non-invasive CT-based methods compared to the FSE. The performance achieved by CT-based methods is expected to be worse than the FSE-based due to the limited resolution of CT images [50], the errors introduced by registration and the simplification of the numerical model compared to the physical reality [51, 52] due to the computational burden. Volumetric microbubble imaging was done in order to show how the targeting errors and source localizing errors from both transmit and receive sides affected the rate of good reconstruction. It can be seen that USCT achieved similar performance as LMCT under different driving and imaging combinations.
A matched filter was obtained and applied to identify the rising edge of the reflected signal from skulls for each element in the diagnostic phased array. The advantage of using matched filter can be seen in Fig. 2, as it can identify the rising edge more accurately. The average total displacement error was 1.4 mm, which was 0.5 mm larger than the results by using a single filter template as described in the previous work [37]. The matched filter worked well with the elements located at the bottom of the dome since normal or small angles of incidence can be achieved. For the elements that were facing the frontal and occipital region of the skulls in the experiments, the reflected signals may not be received by the same elements due to oblique incidence angle, which limited the use of matched filter. The current system has an initial pulse with ring-down lasting for approximately 10μs after the element was triggered. In addition, the average total rotation error was 2.1° on average, which was approximately 1° higher than the previous work [37]. The errors mainly came from the yaw angles over the axial axis after optimization. A local minimum of the cost function may be achieved after the optimization instead of a global minimum with the current constraints setting in the solver. Although our optimization results did not hit the constraints, it may be beneficial to introduce random weighting factors to each high frequency element [36] and test the corresponding registration errors. Although the displacement and rotation errors were not as good as the previous study [37], the performance of the phase correction with the ultrasound-based registration method wasn’t substantially affected when compared to the landmark-based method.
There are several limitations of this work. First, in the reconstruction of the signals from the FSE or the microbubble cavitation, no amplitude corrections were applied to the receivers. Second, the CT images of the skull cap specimens were achieved separately without being mounted on the prototyped hemispherical phased array, which may result in a worse estimation of the true position of the skulls for the ground truth comparison. Third, only fixed locations relative to the array were measured in our experiments, while in actual clinical trials, targets are chosen relative to the brain, which may increase the targeting errors. In the future, a tube phantom can be fixed to the skull cap specimen and measure the combined targeting errors resulting from both the skull displacement and aberration corrections. Fourth, the measured locations were within a volume of 15 mm radius from the geometric focus of the phased array. Since our sparse phased array can provide an effective steering range through human skull cap at each driving frequency beyond 45 mm and 57 mm in lateral and axial directions, respectively, the transcranial targeting and acoustic source localization errors could be measured over a larger volume in future studies, including at peripheral targets located farther from the midbrain. Fifth, the sonication with the 1224 kHz elements was not performed in this work, due to the memory limitation given the short wavelength and large simulation space in the full-wave ultrasound propagation model. PAM reconstructed from the 1224 kHz receive array has been tested with and without skull insertion, however, no good reconstruction of the tube was obtained with the presence of skull. It may be a result of the nearly 93% skull insertion loss at 1224 kHz [29]. In addition, maximum output acoustic pressure at 612 kHz could not be employed with skull insertion when received at 1224 kHz, to avoid signal saturation during data acquisition, which resulted in an insufficient pressure to induce microbubble cavitation. This crosstalk issue between the 612 kHz and 1224 kHz needs to be addressed to allow the 1224 kHz receive array to be used to monitor the microbubble cavitation in in-vivo studies in the future.
Due to the higher sparsity and element count of the high-frequency skull localization array, it was able to achieve 1-mm lower translation errors in 3D human skull cap localization compared to Crake, et al.’s work [39]. However, B-mode image wasn’t available here due to the sparsity of the high-frequency skull localization array. Instead of comparing the ultrasound-based localization with the MR image of the skull cap in Crake’s study, CT images of the skull cap specimens were used in our study due to the motivation to achieve MRI-free transcranial ultrasonic treatment and monitoring. In addition to the high-frequency skull localization array, a dual-mode therapeutic sparse transducer array was integrated to our clinical prototype allowing for transmit and receive with various frequency combination, similar to our previous work [18, 29]. Crake’s work, however, used receive arrays in dual-mode for both 3D PAM and skull localization, which is easier to be integrated into the commercially available MR guided focused ultrasound device [39]. Without the insertion of human skull cap, the peak side lobe ratio of the point source localization with our device was 0.18 ± 0.05 (306 kHz) and 0.27 ± 0.03 (612 kHz) in the acoustic field, both lower than the results in Crake’s work [39], resulting from the random distribution of the transducer element in 3D space. The peak side lobe ratio of the point source localization was reduced through human skull caps, which were 0.18 ± 0.05 and 0.5 ± 0.2 at the receive frequencies of 306 kHz and 612 kHz with USCT-based method, respectively. In terms of the monitoring and control of microbubble cavitation in in-vivo experiments, the capability to increase blood-brain-barrier permeability in a controlled and safe manner has been demonstrated in previous study [18]. In-vivo experiments may be performed to test the targeting errors and treatment efficacy with the USCT-based method, which will be compared to the conventional registration method with MRI [12] in the future. In addition, the PAM was performed offline in this study. To achieve a real-time reconstruction in the future, the raw RF data could be downloaded to the PC memory from the SonixDAQs and transferred to a graphics processing unit (GPU) for an accelerated beamforming instead of via MATLAB [18, 30].
The integration of the high-frequency skull localization array with the therapeutic array may also enable motion tracking of the head during treatment and provide simultaneous adjustment to the existing skull phase aberration correction. With the current control circuit design, 1 Hz cycling rate was used and 128 sec in total were needed to cycle through each individual 11 MHz element in the array in order to obtain the reflection data from skull with good SNR. The maximum cycling rate of the circuit board employed in this work is 100 Hz. To speed up the localization procedure, a transducer design with a wider bandwidth and higher sensitivity to the reflected signals could be developed. This would improve the SNR and thereby reduce the number of signal acquisitions needed to determine the inflection point of the rising edge of the reflected signal envelopes. To further increase the localization speed, high-frequency array elements from four different quadrants could be excited simultaneously, reducing the total acquisition time to 0.32 sec. These approaches will be subject of future work.
V. CONCLUSION
A clinical-scale prototype ultrasound-guided transcranial FUS system for microbubble-mediated brain therapy was constructed by integrating a high frequency skull localization array into a transmit/receive phased array for therapy delivery and simultaneous treatment monitoring. Total displacement and rotation errors of 1.4 ± 0.4, mm and 2.1 ± 0.2° were obtained using ultrasound-based skull registration, resulting in ~1 mm targeting and source localization errors at both 306 and 612 kHz. These results were found to be comparable to those achieved using the gold-standard landmark-based skull registration method. A marginally lower success rate was observed during reconstruction of microbubble cavitation via USCT compared to LMCT when imaging at the second-harmonic, though no obvious differences in successful reconstruction rate were found in the volumetric multi-point microbubble images. This fully ultrasound-based prototype FUS brain treatment system demonstrates the potential of MRI-free treatments for bubble-mediated applications and represents an important step towards increasing access to these therapies.
Acknowledgment
The authors would like to thank Ran An, Fedon Orfanidis, Tyler Portelli, Kogee Leung, and Amy Chen for their suggestions and technical assistance.
This work was supported by the W. Garfield Weston Foundation, the National Institute of Biomedical Imaging and Bioengineering of the National Institutes of Health (grant number: R01 EB003268), the Canadian Institutes of Health Research (grant number: FDN 154272), the Canada Research Chair Program and the Temerty Chair in Focused Ultrasound Research at Sunnybrook Health Sciences Centre.
Contributor Information
Lulu Deng, Physical Sciences Platform, Sunnybrook Research Institute, Toronto, ON, Canada..
Steven D. Yang, Physical Sciences Platform, Sunnybrook Research Institute, Toronto, ON, Canada.
Meaghan A. O’Reilly, Physical Sciences Platform, Sunnybrook Research Institute and the Department of Medical Biophysics, University of Toronto, ON, Canada..
Ryan M. Jones, Physical Sciences Platform, Sunnybrook Research Institute, Toronto, ON, Canada..
Kullervo Hynynen, Physical Sciences Platform, Sunnybrook Research Institute, the Department of Medical Biophysics, and the Institute of Biomedical Engineering, University of Toronto, Toronto, ON, Canada..
References
- [1].Hynynen K, McDannold N, Vykhodtseva N, and Jolesz FA. (2001, Sep.). Noninvasive MR imaging-guided focal opening of the blood-brain barrier in rabbits. Radiology [Online], 220(3), pp. 640–646. Available: https://pubs.rsna.org/doi/10.1148/radiol.2202001804 [DOI] [PubMed] [Google Scholar]
- [2].Konofagou EE, Tung YS, Choi J, Deffieux T, Baseri B, and Vlachos F. (2012, Jun.). Ultrasound-induced blood-brain barrier opening. Curr. Pharm. Biotechnol. [Online], 13(7), pp. 1332–1345. Available: https://www.eurekaselect.com/97989/article [DOI] [PMC free article] [PubMed] [Google Scholar]
- [3].O'Reilly MA and Hynynen K. (2012, May). Ultrasound enhanced drug delivery to the brain and central nervous system. Int. J. Hyperthermia [Online], 28(4), pp. 386–396. Available: https://www.tandfonline.com/doi/full/10.3109/02656736.2012.666709 [DOI] [PMC free article] [PubMed] [Google Scholar]
- [4].Aryal M, Arvanitis CD, Alexander PM, and McDannold N. (2014, Jun.). Ultrasound-mediated blood-brain barrier disruption for targeted drug delivery in the central nervous system. Adv. Drug. Deliv. Rev. [Online], 72, pp. 94–109. Available: 10.1016/j.addr.2014.01.008 [DOI] [PMC free article] [PubMed] [Google Scholar]
- [5].Carpentier A et al. (2016, Jun.). Clinical trial of blood-brain barrier disruption by pulsed ultrasound. Sci. Transl. Med. [Online], 8(343), pp. 343re2. Available: https://stm.sciencemag.org/content/8/343/343re2 [DOI] [PubMed] [Google Scholar]
- [6].Mainprize T et al. (2019, Jan.). Blood-Brain Barrier Opening in Primary Brain Tumors with Non-invasive MR-Guided Focused Ultrasound: A Clinical Safety and Feasibility Study. Sci. Rep. [Online], 9(1), pp. 321. Available: https://www.nature.com/articles/s41598-018-36340-0 [DOI] [PMC free article] [PubMed] [Google Scholar]
- [7].Meng Y et al. (2021, Oct.). MR-guided focused ultrasound enhances delivery of trastuzumab to Her2-positive brain metastases. Sci. Transl. Med. [Online], 13(615), pp. eabj4011. Available: https://www.science.org/doi/10.1126/scitranslmed.abj4011 [DOI] [PubMed] [Google Scholar]
- [8].Lipsman N et al. (2018, Jul.). Blood-brain barrier opening in Alzheimer's disease using MR-guided focused ultrasound. Nature Communications [Online], 9, pp. 2336. Available: https://www.nature.com/articles/s41467-018-04529-6 [DOI] [PMC free article] [PubMed] [Google Scholar]
- [9].Rezai AR et al. (2020, Apr.). Noninvasive hippocampal blood–brain barrier opening in Alzheimer’s disease with focused ultrasound. Proc. Natl. Acad. Sci. [Online], 117(17), pp. 9180–9182. Available: https://www.pnas.org/content/117/17/9180 [DOI] [PMC free article] [PubMed] [Google Scholar]
- [10].Abrahao A et al. (2019, Sep). First-in-human trial of blood-brain barrier opening in amyotrophic lateral sclerosis using MR-guided focused ultrasound. Nature Communications [Online], 10, pp. 4373. Available: https://www.nature.com/articles/s41467-019-12426-9 [DOI] [PMC free article] [PubMed] [Google Scholar]
- [11].Hynynen K, Darkazanli A, Unger E, and Schenck JF. (1993, Jan.- Feb.). MRI-guided noninvasive ultrasound surgery. Med. Phys. [Online], 20(1), pp. 107–115. Available: 10.1118/1.597093 [DOI] [PubMed] [Google Scholar]
- [12].McDannold N, Clement GT, Black P, Jolesz F, and Hynynen K. (2010, Feb.). Transcranial magnetic resonance imaging- guided focused ultrasound surgery of brain tumors: initial findings in 3 patients. Neurosurgery [Online], 66(2), pp. 323–332. Available: 10.1227/01.NEU.0000360379.95800.2F [DOI] [PMC free article] [PubMed] [Google Scholar]
- [13].McDannold N, Vykhodtseva N, and Hynynen K. (2016, Feb.). Targeted disruption of the blood-brain barrier with focused ultrasound: association with cavitation activity. Phys. Med. Biol. [Online], 51(4), pp. 793–807. Available: 10.1088/0031-9155/51/4/003 [DOI] [PubMed] [Google Scholar]
- [14].Tung YS, Vlachos F, Choi JJ, Deffieux T, Selert K, and Konofagou EE. (2010, Oct.). In vivo transcranial cavitation threshold detection during ultrasound-induced blood-brain barrier opening in mice. Phys. Med. Biol. [Online], 55(20), pp. 6141–6155. Available: 10.1088/0031-9155/55/20/007 [DOI] [PMC free article] [PubMed] [Google Scholar]
- [15].Arvanitis CD, Livingstone MS, Vykhodtseva N, and McDannold N. (2012, Sep.). Controlled ultrasound-induced blood-brain barrier disruption using passive acoustic emissions monitoring. PLoS One [Online], 7(9), pp. e45783. Available: 10.1371/journal.pone.0045783 [DOI] [PMC free article] [PubMed] [Google Scholar]
- [16].O'Reilly MA and Hynynen K. (2012, Apr.). Blood-brain barrier: real-time feedback-controlled focused ultrasound disruption by using an acoustic emissions-based controller. Radiology [Online], 263 (1), pp. 96–106. Available: https://pubs.rsna.org/doi/10.1148/radiol.11111417 [DOI] [PMC free article] [PubMed] [Google Scholar]
- [17].Burgess A and Hynynen K. (2014, May). Drug delivery across the blood-brain barrier using focused ultrasound. Expert Opin. Drug Deliv. [Online], 11(5), pp. 711–721. Available: 10.1517/17425247.2014.897693 [DOI] [PMC free article] [PubMed] [Google Scholar]
- [18].Jones RM, Deng L, Leung K, McMahon D, O'Reilly MA, and Hynynen K. (2018, Apr.). Three-dimensional transcranial microbubble imaging for guiding volumetric ultrasound-mediated blood-brain barrier opening. Theranostics [Online], 8(11), pp. 2909–2926. Available: https://www.thno.org/v08p2909.htm [DOI] [PMC free article] [PubMed] [Google Scholar]
- [19].Tsai CH, Zhang JW, Liao YY, and Liu HL. (2016, Apr.), Real-time monitoring of focused ultrasound blood-brain barrier opening via subharmonic acoustic emission detection: implementation of confocal dual-frequency piezoelectric transducers. Phys. Med. Biol. [Online], 61(7), pp. 2926–2946. Available: 10.1088/0031-9155/61/7/2926 [DOI] [PubMed] [Google Scholar]
- [20].Sun T et al. (2017, Jul.). Closed-loop control of targeted ultrasound drug delivery across the blood–brain/tumor barriers in a rat glioma model. Proc. Natl. Aca. Sci. [Online], 114(48), pp. E10281–E10290. Available: https://www.pnas.org/content/114/48/E10281 [DOI] [PMC free article] [PubMed] [Google Scholar]
- [21].Salgaonkar VA, Datta S, Holland CK, and Mast TD. (2009, Dec.). Passive cavitation imaging with ultrasound arrays. J. Acoust. Soc. Am. [Online], 126(6), pp. 3071–3083. Available: https://asa.scitation.org/doi/10.1121/1.3238260 [DOI] [PMC free article] [PubMed] [Google Scholar]
- [22].Gateau J, Marsac L, Pernot M, Aubry JF, Tanter M, and Fink M. (2010, Jan.). Transcranial ultrasonic therapy based on time reversal of acoustically induced cavitation bubble signature. IEEE Trans. Biomed. Eng. [Online], 57(1), pp. 134–144. Available: https://ieeexplore.ieee.org/document/5247101 [DOI] [PMC free article] [PubMed] [Google Scholar]
- [23].Gyongy M and Coussios CC. (2010, Jan.). Passive spatial mapping of inertial cavitation during HIFU exposure. IEEE Trans. Biomed. Eng. [Online], 57(1), pp. 48–56. Available: https://ieeexplore.ieee.org/document/5170065 [DOI] [PubMed] [Google Scholar]
- [24].Norton SJ and Won IJ. (2000, May). Time exposure acoustics. IEEE Trans. Geosci. Remote Sens. [Online], 38(3), pp. 1337–1343. Available: https://ieeexplore.ieee.org/document/843027 [Google Scholar]
- [25].Norton SJ, Carr BJ, and Witten AJ. (2006, Apr.). Passive imaging of underground acoustic sources. J. Acoust. Soc. Am. [Online], 119(5), pp. 2840–2847. Available: https://asa.scitation.org/doi/10.1121/1.2188667 [Google Scholar]
- [26].Arvanitis CD and McDannold N. (2013, Nov.). Integrated ultrasound and magnetic resonance imaging for simultaneous temperature and cavitation monitoring during focused ultrasound therapies. Med. Phys. [Online], 40(11), pp. 112901. Available: https://aapm.onlinelibrary.wiley.com/doi/full/10.1118/1.4823793 [DOI] [PMC free article] [PubMed] [Google Scholar]
- [27].Burgess MT, Apostolakis I, and Konofagou EE. (2018, Mar.). Power cavitation-guided blood-brain barrier opening with focused ultrasound and microbubbles. Phys. Med. Biol. [Online], 63(6), pp. 065009. Available: 10.1088/1361-6560/aab05c [DOI] [PMC free article] [PubMed] [Google Scholar]
- [28].O'Reilly MA, Jones RM, and Hynynen K. (2014, Apr.). Three-dimensional transcranial ultrasound imaging of microbubble clouds using a sparse hemispherical array. IEEE Trans. Biomed. Eng. [Online], 61(4), pp. 1285–1294. Available: https://ieeexplore.ieee.org/document/6714610 [DOI] [PMC free article] [PubMed] [Google Scholar]
- [29].Deng L, O'Reilly MA, Jones RM, An R, and Hynynen K. (2016, Dec.). A multi-frequency sparse hemispherical ultrasound phased array for microbubble-mediated transcranial therapy and simultaneous cavitation mapping. Phys. Med. Biol. [Online], 61(24), pp. 8476–8501. Available: 10.1088/0031-9155/61/24/8476 [DOI] [PMC free article] [PubMed] [Google Scholar]
- [30].Jones RM, McMahon D, and Hynynen K. (2020, Jun.). Ultrafast three-dimensional microbubble imaging in vivo predicts tissue damage volume distributions during nonthermal brain ablation. Theranostics [Online], 10(16), pp. 7211–7230. Available: https://www.thno.org/v10p7211.htm [DOI] [PMC free article] [PubMed] [Google Scholar]
- [31].Fry FJ and Barger JE. (1978, May). Acoustical properties of the human skull. J. Acoust. Soc. Am. [Online], 63(5), pp. 1576–1590. Available: https://asa.scitation.org/doi/10.1121/1.381852 [DOI] [PubMed] [Google Scholar]
- [32].Clement GT and Hynynen K. (2002, Apr.). A non-invasive method for focusing ultrasound through the human skull. Phys. Med. Biol. [Online], 47 (8), pp. 1219–1236. Available: 10.1088/0031-9155/47/8/301 [DOI] [PubMed] [Google Scholar]
- [33].Aubry JF, Tanter M, Pernot M, Thomas JL, and Fink M. (2003, Jan.). Experimental demonstration of noninvasive transskull adaptive focusing based on prior computed tomography scans. J. Acoust. Soc. Am. [Online], 113(1), pp. 84–93. Available: 10.1121/1.1529663 [DOI] [PubMed] [Google Scholar]
- [34].Jones RM, O'Reilly MA, and Hynynen K. (2015, Jul.). Experimental demonstration of passive acoustic imaging in the human skull cavity using CT-based aberration corrections. Med. Phys. [Online], 42(7), pp. 4385–4400. Available: 10.1118/1.4922677 [DOI] [PMC free article] [PubMed] [Google Scholar]
- [35].Amstutz C et al. (2003, Dec.). A-mode ultrasound-based registration in computer-aided surgery of the skull. Arch. Otolaryngol. Head Neck Surg. [Online], 129 (12), pp. 1310–1316. Available: 10.1001/archotol.129.12.1310 [DOI] [PubMed] [Google Scholar]
- [36].Fieten L, Schmieder K, Engelhardt M, Pasalic L, Radermacher K, and Heger S. (2009, May). Fast and accurate registration of cranial CT images with A-mode ultrasound. Int. J. Comput. Assist. Radiol. Surg. [Online], 4(3), pp. 225–237. Available: https://link.springer.com/article/10.1007/s11548-009-0288-z [DOI] [PubMed] [Google Scholar]
- [37].O'Reilly MA, Jones RM, Birman G, and Hynynen K. (2016, Sep.). Registration of human skull computed tomography data to an ultrasound treatment space using a sparse high frequency ultrasound hemispherical array. Med. Phys. [Online], 43(9), pp. 5063. Available: https://aapm.onlinelibrary.wiley.com/doi/abs/10.1118/1.4960362 [DOI] [PMC free article] [PubMed] [Google Scholar]
- [38].Besl PJ and McKay ND. (1992, Feb.). A method for registration of 3-D shapes. IEEE Trans. Pattern Anal. Mach. Intell. [Online], 14(2), pp. 239–256. Available: https://ieeexplore.ieee.org/document/121791 [Google Scholar]
- [39].Crake C, Brinker ST, Coviello CM, Livingstone MS, and McDannold NJ. (2018, Mar.). A dual-mode hemispherical sparse array for 3D passive acoustic mapping and skull localization within a clinical MRI guided focused ultrasound device. Phys. Med. Biol. [Online], 63(6), pp. 065008. Available: 10.1088/1361-6560/aab0aa [DOI] [PMC free article] [PubMed] [Google Scholar]
- [40].Horn BKP. (1987, Apr.). Closed-form solution of absolute orientation using unit quaternions. J. Opt. Soc. Am. A [Online], 4(4), pp. 629–642. Available: 10.1364/JOSAA.4.000629 [DOI] [Google Scholar]
- [41].Connor CW, Clement GT, and Hynynen K. (2001, Nov.). A unified model for the speed of sound in cranial bone based on genetic algorithm optimization. Phys. Med. Biol. [Online], 47(22), pp. 3925–3944. Available: 10.1088/0031-9155/47/22/302 [DOI] [PubMed] [Google Scholar]
- [42].Buhlmann S, "Heat Transfer Calculations Using Finite Difference Equations” in Chemie Ingenieur Technik, 49(11). Croft Von D. R. und Lihey DG. Applied Science Publishers Ltd., London, UK, 1977, pp. 922–923. [Google Scholar]
- [43].Auld BA, Acoustic fields and waves in solids. Vol. 2. New York, Wiley-Interscience, 1973. [Google Scholar]
- [44].Pichardo S, Sin VW, and Hynynen K. (2011, Jan.). Multi-frequency characterization of the speed of sound and attenuation coefficient for longitudinal transmission of freshly excised human skulls. Phys. Med. Biol. [Online], 56(1), pp. 219–250. Available: 10.1088/0031-9155/56/1/014 [DOI] [PMC free article] [PubMed] [Google Scholar]
- [45].White PJ, Clement GT, and Hynynen K. (2006, Jul.). Longitudinal and shear mode ultrasound propagation in human skull bone. Ultrasound Med. Biol. [Online], 32(7), pp. 1085–1096. Available: 10.1016/j.ultrasmedbio.2006.03.015 [DOI] [PMC free article] [PubMed] [Google Scholar]
- [46].Mur G (1981, Nov.). Absorbing Boundary Conditions for the Finite-Difference Approximation of the Time-Domain Electromagnetic-Field Equations. IEEE Trans. Electromagn. Compat. [Online], EMC-23(4), pp. 377–382. Available: https://ieeexplore.ieee.org/document/4091495 [Google Scholar]
- [47].Pulkkinen A, Werner B, Martin E, and Hynynen K. (2014, Apr.). Numerical simulations of clinical focused ultrasound functional neurosurgery. Phys. Med. Biol. [Online], 59(7), pp. 1679–1700. Available: 10.1088/0031-9155/59/7/1679 [DOI] [PMC free article] [PubMed] [Google Scholar]
- [48].Lipsman N et al. (2013, May). MR-guided focused ultrasound thalamotomy for essential tremor: a proof-of-concept study. Lancet Neurol. [Online], 12(5), pp. 462–468. Available: 10.1016/S1474-4422113170048-6 [DOI] [PubMed] [Google Scholar]
- [49].Elias WJ et al. (2013, Aug.). A pilot study of focused ultrasound thalamotomy for essential tremor. N. Engl. J. Med. [Online], 369(7), pp. 640–648. Available: https://www.nejm.org/doi/10.1056/NEJMoa1300962 [DOI] [PubMed] [Google Scholar]
- [50].Treece GM, Gee AH, Mayhew PM, and Poole KE. (2010, Jun.). High resolution cortical bone thickness measurement from clinical CT data. Med. Image Anal. [Online], 14(3), pp. 276–290. Available: 10.1016/j.media.2010.01.003 [DOI] [PMC free article] [PubMed] [Google Scholar]
- [51].Komatitsch D, Barnes C, and Tromp J. (2000, Mar.). Wave propagation near a fluid-solid interface: A spectral-element approach. Geophysics [Online], 65(2), pp. 623–631. Available: https://library.seg.org/doi/10.1190/1.1444758 [Google Scholar]
- [52].Huttunen T, Kaipio JP, and Monk P. (2008, Mar.). An ultra-weak method for acoustic fluid–solid interaction. J. Comput. Appl. Math. [Online], 213(1), pp. 166–185. Available: 10.1016/j.cam.2006.12.030 [DOI] [Google Scholar]