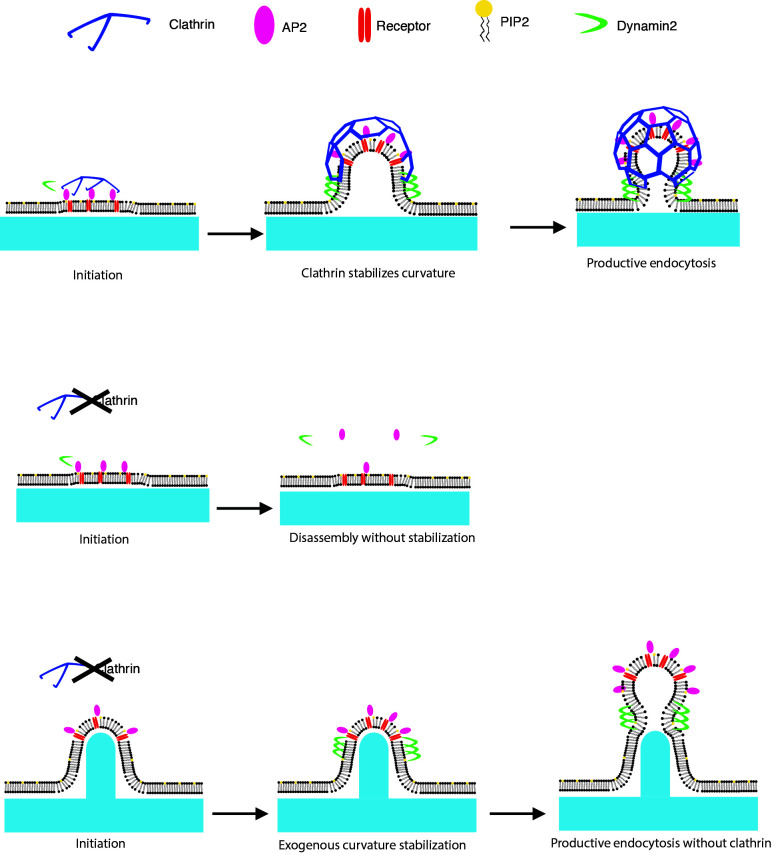
Cail et al. demonstrate that induced nanoscale membrane curvature can recruit endocytic proteins and produce cargo-laden vesicles without the coat protein clathrin; however, the induced curvature does not bypass AP2 and FCHo1/2 functions. This work suggests that the essential function of clathrin is to physically stabilize the curvature of the evolving vesicle.
Abstract
During clathrin-mediated endocytosis (CME), flat plasma membrane is remodeled to produce nanometer-scale vesicles. The mechanisms underlying this remodeling are not completely understood. The ability of clathrin to bind membranes of distinct geometries casts uncertainty on its specific role in curvature generation/stabilization. Here, we used nanopatterning to produce substrates for live-cell imaging, with U-shaped features that bend the ventral plasma membrane of a cell into shapes resembling energetically unfavorable CME intermediates. This induced membrane curvature recruits CME proteins, promoting endocytosis. Upon AP2, FCHo1/2, or clathrin knockdown, CME on flat substrates is severely diminished. However, induced membrane curvature recruits CME proteins in the absence of FCHo1/2 or clathrin and rescues CME dynamics/cargo uptake after clathrin (but not AP2 or FCHo1/2) knockdown. Induced membrane curvature enhances CME protein recruitment upon branched actin assembly inhibition under elevated membrane tension. These data establish that membrane curvature assists in CME nucleation and that the essential function of clathrin during CME is to facilitate curvature evolution, rather than scaffold protein recruitment.
Graphical Abstract
Introduction
Mammalian cell membrane shape is established and maintained in complex 3D environments, wherein nanoscale membrane bending is induced by both external environmental factors and intrinsic cellular processes (Chen et al., 1997). Features such as the ECM and cell–cell junctions force the cell to adopt particular geometries, and internal processes such as endocytic vesicle formation reshape the membrane from within (Suleiman et al., 2013; Liu et al., 2010; Kovtun et al., 2020). To generate vesicles, the cell must bend regions of its membrane into a spherical shape on the order of 100 nm across, an energetically costly process that requires passing through an unfavorable U-shaped transition state (Hassinger et al., 2017).
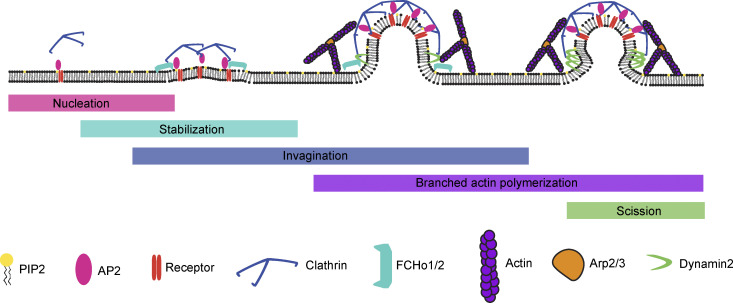
Clathrin-mediated endocytosis (CME), the best-studied form of cargo uptake, is a constitutive process that regulates an array of cellular functions including signaling, adhesion, and migration (Tan et al., 2018; Ezratty et al., 2009; Paul et al., 2015). CME is frequently viewed as a modular process, with overlapping and non–mutually exclusive steps leading up to membrane scission as follows: (1) nucleation of a nascent site, (2) site stabilization, (3) membrane invagination, (4) actomyosin force production, and (5) membrane scission (Fig. 1; McMahon and Boucrot, 2011). Many key components of the modules have been identified: the adaptor protein AP2 nucleates a clathrin-coated pit (CCP) by binding to cargoes and phosphatidylinositol 4,5-bisphosphate on the plasma membrane (Jackson et al., 2010; Cocucci et al., 2012). The FCHo1/2 proteins stabilize the nascent site in concert with EPS15/R, promoting AP2’s open conformation (Ma et al., 2016). The coat protein clathrin begins to bind to the CCP as soon as AP2 marks the nascent site (Hong et al., 2015; Cocucci et al., 2012). As the endocytic site matures, a feedback loop between curvature generation and stabilization occurs, with incorporation of more adaptors, cargoes, and curvature-generating proteins, while branched actin networks, nucleated by the Arp2/3 complex, produce a pushing force to overcome membrane tension and invaginate the pit, culminating in the production of a clathrin-coated vesicle and membrane scission catalyzed by the GTPase dynamin (Ford et al., 2002; Ehrlich et al., 2004; Yarar et al., 2005; Grassart et al., 2014; Busch et al., 2015).
Figure 1.
CME is viewed as a modular process, beginning with nucleation by AP2 and early binding to clathrin. This is followed by stabilization through FCHo1/2, invagination, force production through the actomyosin network, and scission.
Both how and when curvature is generated during CME have been topics of active research for decades, complicated by the fact that the process occurs rapidly and below the diffraction limit of the light microscope. Disruptions to CME such as siRNA knockdowns and chemical inhibitions have revealed many mechanistic aspects of curvature generation, for instance demonstrating the importance of epsin’s ENTH domain, Hip1R’s ability to bind actin, and branched actin polymerization (Kazazic et al., 2009; Engqvist-Goldstein et al., 2001; Boulant et al., 2011). However, whether and how membrane geometry is coupled to the activities of proteins in other CME modules is not certain: does curvature progress concomitantly with nucleation, stabilization, and coat buildup, or is curvature formation unlinked to these earlier modules? CCPs preferentially localize to sites of high induced membrane curvature in cultured cells, indicating that induced cell membrane geometry may influence normal endocytic activities (Zhao et al., 2017). However, at which stages curvature assists endocytic site formation is not known.
In vitro evidence has shown that clathrin, an oligomeric protein comprised of a heavy chain (CLTC) and two light chains (CLTA and CLTB), preferentially binds to membranes of high curvature, and that clathrin associated with low-tension liposomes has a propensity to form spherical cages (Dannhauser and Ungewickell, 2012; Zeno et al., 2021). These data are consistent with the observation that clathrin heavy chain knockdown in live cells causes accumulation of CME proteins in flat membrane-bound patches, leading to the hypothesis that clathrin’s role is to generate vesicle curvature through a Brownian ratchet mechanism (Hinrichsen et al., 2006). However, this conclusion is tempered by the observation that clathrin at membranes can take on many distinct shapes, including spherical cage, barrel, flat lattice, and tubular lattice; in situ EM has emphasized the abundance of flat clathrin assemblies and provided evidence for a flat-to-curved transition of CCPs (Heuser and Evans, 1980; Elkhatib et al., 2017; Sochacki et al., 2021; Avinoam et al., 2015). The observations that clathrin associates with membranes of different shapes and assembles into different geometries have led to debate about clathrin’s activity during CME: what role does it play in membrane budding, given its affinity for membranes of different curvatures? By creating nanofabricated ridges on a material with ideal optical properties for live-cell imaging, to induce a range of nanoscale membrane curvatures mimicking ECM fibers across the ventral cell membrane, we set out to investigate (1) how the biochemical interactions of CCP formation are related to the mechanical process of curvature generation and (2) which proteins might play an essential CME role specifically in inducing or stabilizing membrane curvature.
Results
Ormocomp nanoridges induce membrane curvature and recruit the endocytic machinery
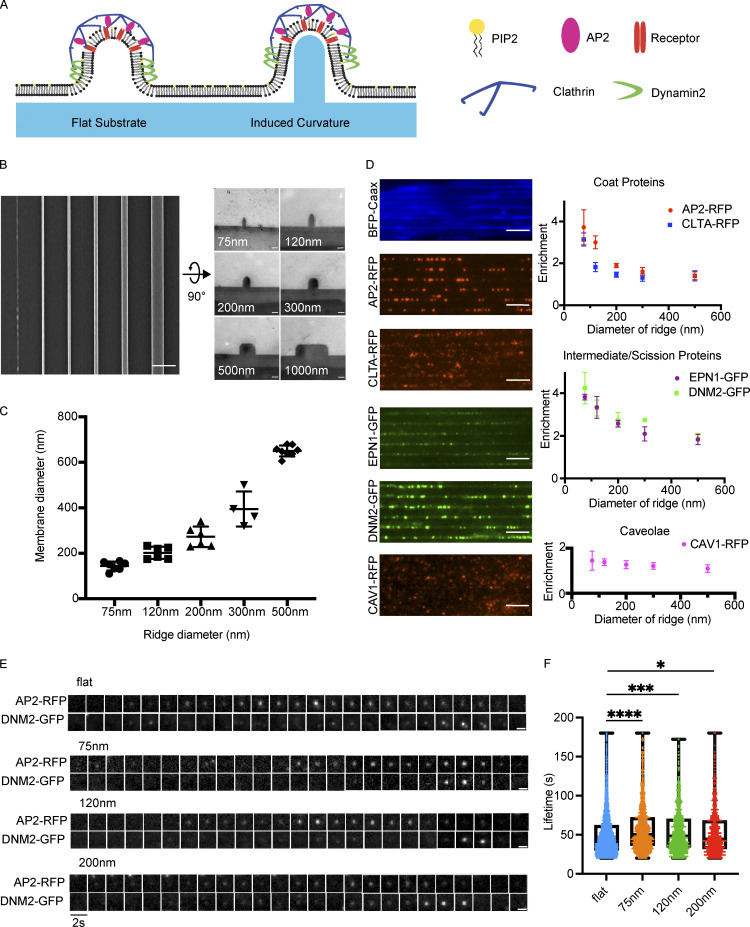
To induce membrane curvature across nanometer-range scales, we applied a low-cost, high-throughput nanofabrication method termed UV-nanoimprint lithography (UV-NIL; Figs. 2 A and S1 A; Bender et al., 2002). The principal advantage of UV-NIL is its ability to create sub-100-nm structures, allowing the creation of structures on the scale of a macromolecular ensemble such as a CCP (Schmid and Michel, 2000). We selected the material Ormocomp as our substrate because of the near-exact match of its refractive index to that of glass, allowing us to conduct total internal reflection fluorescence (TIRF) microscopy, a standard imaging method in the CME field (Fig. S1 B; Gissibl et al., 2017; Merrifield et al., 2002).
Figure 2.
Ormocomp nanoridges induce curvature and localize the endocytic machinery. (A) Model of CCPs on flat Ormocomp or on the nanoridge substrate. (B) En face scanning EM (left, scale bar 2 μm) and thin-section TEM (right, scale bar 100 nm) of nanoridge substrates showing how the substrates would form invaginations in the ventral cell membrane. (C) Quantification of induced membrane diameter of MDA cells grown on nanoridge substrates. Mean ± SD, n ≥ 4 pillar-membrane contacts per condition. (D) Screen of genome-edited MDA cells expressing endocytic proteins on 75-nm nanoridges, showing increased localization to sites of high curvature. Quantification of enrichment as function of curvature to right. Mean ± SD, n ≥ 5 cells per condition. Scale bar, 5 μm. (E) Example montages of CCPs from the nanoridge substrates demonstrate the canonical fluorescence intensity profile of a CCP on flat or nanoridge substrates. Scale bar, 1 μm. (F) Quantification of average lifetime of CCPs from nanoridge substrates demonstrates slightly increased lifetime as function of induced curvature. ****, P < 0.0001; ***, P < 0.001; *, P < 0.05, Student’s t test. Mean with interquartile range, n ≥ 675 traces from three cells per condition.
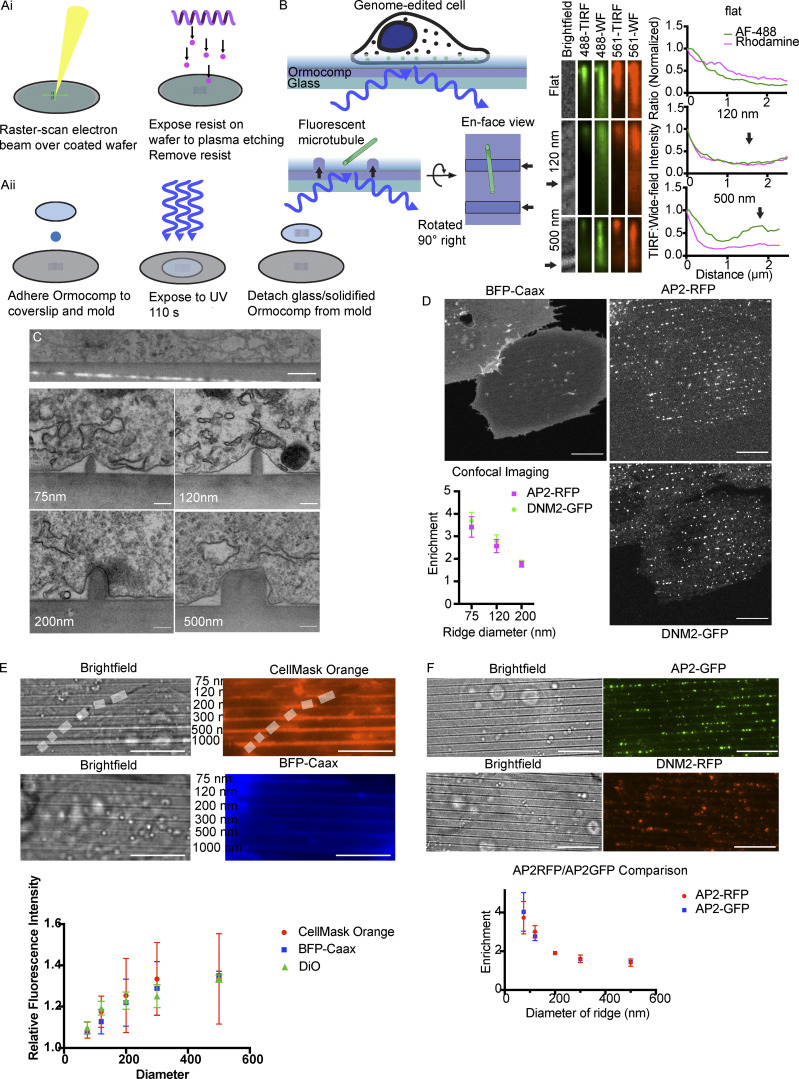
Figure S1.
Curvature alters CCP localization. (A, i and ii) Nanofabrication process, describing mold creation through electron-beam lithography and reactive ion etching, followed by UV-NIL to produce solidified Ormocomp substrates. (B) Refractive-index matching between Ormocomp and glass allows for TIRF microscopy of cells or microtubules. Comparison of fluorescence intensity between TIRF and WF imaging of tilted microtubules reveals the typical exponential decay of the TIRF field for flat substrate or smaller ridges, while larger ridges (≥500 nm) create a secondary TIRF field, especially for shorter (488-nm) wavelengths. Arrows indicate position of nanoridges beneath MTs. (C) Representative TEM images of cells grown on Ormocomp substrates demonstrating the membrane shape induced by the nanoridges. Scale bars: 2 μm in top image, 200 nm in bottom panels. (D) Maximum-intensity projections of BFP-Caax, AP2-RFP, and DNM2-GFP from confocal imaging of a cell on the 75-nm ridges, with quantification of enrichment of AP2-RFP and DNM2-GFP from confocal imaging. Mean ± SD, n = 3 cells per condition. Scale bar, 10 μm. (E) Representative images of membrane markers CellMask Orange and BFP-Caax showing that the entire ventral membrane is illuminated, as well as quantifying the increase in fluorescence intensity of CellMask Orange, BFP-Caax, and Vybrant DiO atop the nanoridge substrates as a function of substrate size. Scale bar, 10 μm; mean ± SD, n = 10 membrane–ridge contacts from three cells per condition. (F) RFP and GFP swaps on AP2 and DNM2 demonstrate that curvature enrichment is independent of the fluorophore chosen. Scale bar, 10 μm; mean ± SD, n = 3 cells per condition.
To produce substrates through UV-NIL, we first created a mold through electron-beam lithography and reactive-ion etching on a silicon wafer (Fig. S1 A; Fischer and Chou, 1992). This mold features millimeter-long, cylindrical invaginations spaced at a pitch of 2 μm, with widths of 75, 120, 200, 300, 500, and 1,000 nm (Fig. 2 B). The depth of an invagination is 200 nm for 75-nm ridges, 250 nm for 120-nm ridges, and 300 nm for larger sizes. This mold served as the basis for Ormocomp substrate production. The resulting substrates bear the inverse geometry of the mold and therefore have cylindrical protrusions, which we term nanoridges. Upon exposure to UV irradiation, Ormocomp polymerizes through polyacrylate chemistry. Ormocomp substrate manufacturing requires only ∼15 min per substrate, making replicated experiments and wider screenings more practical than with more standard, slower nanofabrication processes.
To determine the effect of nanoridge structures on the evanescent field in TIRF microscopy, we imaged tilted fluorescent microtubules under both wide-field (WF) and TIRF microscopy in 488- and 561-nm channels (Fig. S1 B; Gell et al., 2009). On flat Ormocomp, the fluorescence intensity ratio of TIRF:WF images of microtubules, with one end near the substrate and the other end projecting upward, demonstrates the exponential decay of fluorescence intensity within a few hundred nanometers of the substrate surface typical of a TIRF evanescent field. We performed the same analysis on microtubules leaning against a nanoridge, with one end near the substrate between two nanoridges and the other end projecting upward. For smaller nanoridges (≤300 nm), the same exponential decay of fluorescence intensity occurs along the length of the microtubule, unchanged by the presence of a nanoridge beneath the microtubule. However, an increase in TIRF fluorescence was observed for microtubules across larger nanoridges (≥500 nm), with a larger increase for 488-nm light compared with 561-nm light.
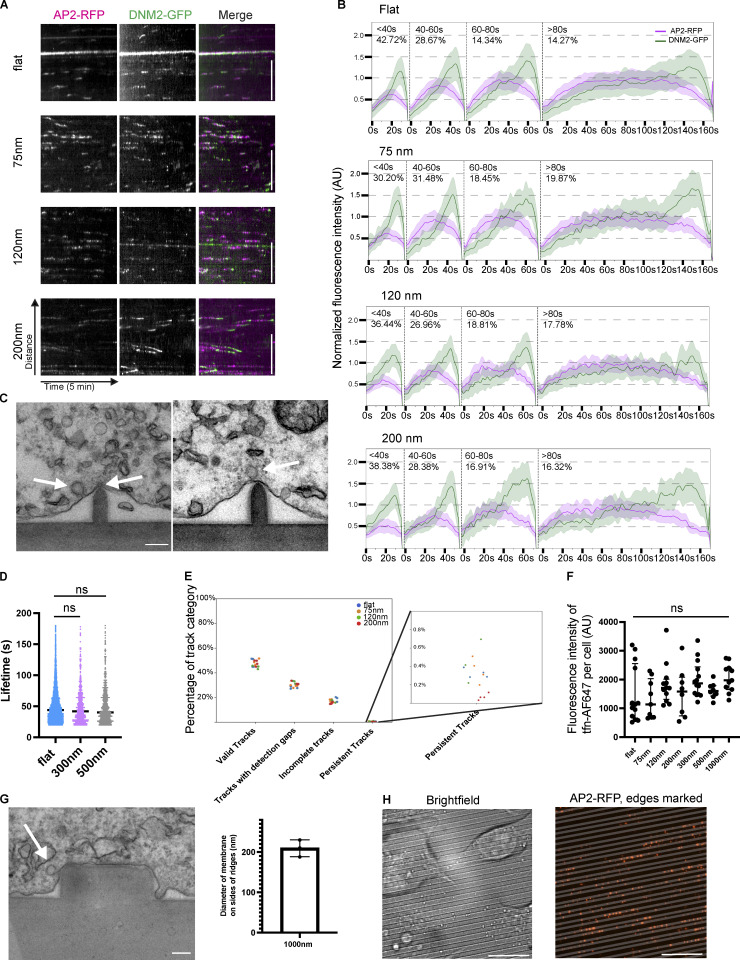
To visualize how the nanoridges affect plasma membrane shape, we seeded MDA-MB-231 (MDA) cells on nanoridge substrates and performed thin-section transmission EM (TEM) of substrate-grown cells to measure the diameter of the membrane invaginations induced by each nanoridge (Fig. S1 C). By measuring the diameter of multiple ridge-membrane interfaces across more than three cells per ridge size, we found that the nanoridges induce consistent membrane diameter as a function of ridge size (Fig. 2 C). The smallest nanoridge, 75 nm, induced a membrane diameter of ∼142 nm, ∼50% larger than the diameter of a fully formed vesicle, with a linear increase up to the 500-nm ridge, which induced ∼650-nm-diameter curvature. The shape of the membrane bent around nanoridges was similar to the shapes seen in MDA cell membranes wrapped around collagen fibers, which were shown to induce clathrin structures known as tubular clathrin/AP2 lattices (Elkhatib et al., 2017). Thus, Ormocomp nanoridges provide a robust method to create reproducible membrane curvature and decouple curvature generation from cell-intrinsic processes such as vesicle formation, forming cell membrane shapes already experienced by cells in vivo.
To determine the effect of the diameter of induced membrane curvature on the endocytic machinery, we seeded on nanoridge substrates MDA cells, genome-edited to express fluorescent fusion proteins under endogenous regulatory control, and imaged these cells on a TIRF microscope (Fig. 2 D; Doyon et al., 2011; Hong et al., 2015). These cells were genome-edited previously using transcription activator–like effector nucleases to express fluorescent fusion proteins (GFP or RFP) linked to the C-terminus of CLTA, dynamin2 (DNM2), or caveolin1 or an internal fusion tag in the mu subunit of AP2; all alleles were tagged. Imaging of plasma membrane markers showed that the entirety of the ventral plasma membrane is illuminated by the TIRF evanescent field (Figs. 2 D and S1 E). The endocytic proteins demonstrated a striking preference for the higher-curvature ridges (e.g., 75, 120, and 200 nm; Fig. 2 D), as reported previously for cells grown on quartz substrates (Zhao et al., 2017). This observation was true of early-arriving endocytic proteins AP2 and CLTA, as well as the intermediate curvature-generating protein epsin1 and late-peaking scission GTPase DNM2. The protein caveolin1, which is a marker of caveolae and not a component of CME sites, demonstrated no preferred binding to membranes of high curvature (Rothberg et al., 1992).
Because Ormocomp nanoridges promised better optical properties than the previously used quartz substrates for TIRF microscopy and could be produced with higher throughput, we next performed an image-based analysis of CME proteins associated with these structures. Maximum-intensity projections of 3-μm stacks from confocal imaging of the ventral cell surface revealed that AP2 and DNM2 localization to nanoridges was consistent across imaging modalities and was not an artifact of our TIRF imaging (Fig. S1 D). To quantify the enrichment of endocytic proteins on nanoridges with high curvature, we developed automated image processing tools. Using the bright-field image of a cell on a substrate, we used a line detection algorithm to create a mask that discriminates between on- and off-ridge sections of the cell. We next used automated puncta detection to localize fluorescent puncta (Tinevez et al., 2017). We corrected for increased cell membrane fluorescence on nanoridges by measuring the on-ridge increase in fluorescence of cell membrane markers BFP-Caax, Vybrant DiO, and CellMask Orange, which were in good agreement (Fig. S1 E). By measuring the relative abundance of endocytic proteins on ridges vs. flat membrane and dividing by the corrected area of the mask, we determined an enrichment score, which is a relative increase in the abundance of endocytic protein localization as a function of curvature. An enrichment score of 1 corresponds to no increase in localization, and scores >1 indicate an increase in the number of fluorescent puncta compared with flat membrane. The enrichment score, by definition, has a linear correlation with the percentage of puncta appearing on the mask (i.e., nanoridge) region of the cell.
The enrichment score demonstrates the strong preference of the endocytic machinery for regions of high plasma membrane curvature (Fig. 2 D). At the 75-nm ridge, AP2-RFP shows a nearly fourfold increase in puncta localization relative to flat membranes. Epsin1-GFP and DNM2-GFP both show a greater than fourfold enrichment. Swapping the fluorophores on AP2 and DNM2 to GFP and RFP, respectively, resulted in little difference in enrichment (Fig. S1 F). These enrichments decrease with increasing diameter, until at the 500-nm ridge, there is essentially no detectable enrichment. CLTA, in contrast with other endocytic proteins, demonstrates an approximately threefold enrichment at the smallest substrate size but precipitously decreases its enrichment as ridge size increases. This reduced enrichment may be because of the detection of clathrin at other trafficking events within the cell body such as endosomes and the TGN (Stoorvogel et al., 1996; Daboussi et al., 2012). Caveolin1-RFP showed no change in enrichment score as a function of curvature, despite caveolae being another form of endocytic uptake. Enrichment scores for AP2 and DNM2 from confocal imaging were similar to those determined by TIRF imaging (Fig. S1 D). These data demonstrate that CME proteins—but not necessarily proteins from other endocytic processes—robustly reorganize across the cell in response to induced membrane curvature, with preferential localization at highest induced positive curvature.
We next investigated whether the puncta of endocytic proteins present on nanoridges represent productive CCPs, tubular clathrin/AP2 lattices, or ectopic protein localization. We imaged double-genome-edited MDA cells expressing AP2-RFP and DNM2-GFP at 0.5 Hz via TIRF on a range of ridge sizes. Montages and kymographs from two-color videos on Ormocomp substrates demonstrated the characteristic track of gradual AP2-RFP fluorescence increase accompanied by a burst of DNM2-GFP at the end of each track, a hallmark of productive endocytosis (Figs. 2 E and S2 A; Doyon et al., 2011). Through TEM imaging, we found the canonical spiked coat of clathrin on nanoridges and on CCPs budding from them (Fig. S2 C). Using automated site detection/tracking and binning based on nanoridge size, we measured the lifetime of valid endocytic sites and found that the AP2 lifetime on flat substrates was 50.9 ± 28 s, very similar to previously reported values for CME sites on glass (Fig. 2 F; Aguet et al., 2013; Hong et al., 2015). Endocytic sites on induced curvature had slightly lengthened lifetimes: 58.4 ± 30 s for 75-nm ridges, 54.8 ± 28 s for 120-nm ridges, and 53.5 ± 29 s for 200-nm ridges. At diameters >200 nm, endocytic dynamics were unchanged by nanoridges (Fig. S2 D). The nanoridges did not change the percentages of transient, broken, or incomplete CCPs and did not change the bulk rate of endocytosis as measured by fluorescent transferrin uptake assay (Fig. S2, E and F). These data indicate that localized curvature preferentially induces endocytic sites without altering overall endocytic profile.
Figure S2.
Characterization of CCPs on nanoridges. (A) Representative kymographs of CCPs on nanoridge substrates showing the canonical fluorescence profile with gradual AP2 buildup followed by a late burst of Dynamin2. Scale bar, 5 μm. (B) Averaged, binned CCPs from automated detections on flat and curved substrates demonstrating the same fluorescence profile for all detections, indicating no difference in CCP activity as a function of curvature. Mean ± 0.25SD, n ≥ 675 traces from three cells per condition. (C) Representative thin-section TEM images of CCPs budding from the side of nanoridge substrates, visible through the spiked coat that is typical of a clathrin-coated vesicle, on 120-nm ridges. Arrows indicate clathrin-coated vesicles or growing clathrin-coated pits. (D) Average lifetimes of CCPs on 300- and 500-nm ridges demonstrating that at ridge sizes >200 nm, there is no difference in endocytic lifetime relative to flat membrane. Mean with interquartile range, P value from Student’s t test; n ≥ 450 traces from three cells per condition. (E) Measurement of the percentage of valid, gapped, incomplete, or persistent tracks, demonstrating that substrate size does not affect this distribution; n = 4 cells per condition. (F) Quantification of mean pixel intensity for cells after transferrin endocytosis, demonstrating no detectable difference in fluorescence intensity as a function of ridge size. P value from ANOVA test. Mean ± SD, n = 10 cells per condition. (G) Thin-section TEM of 1,000-nm ridge showing the induced curvature of the ventral cell membrane on the side but not the top of the ridge, with quantification of membrane diameter from 1,000-nm ridge. Scale bar, 200 nm. Mean ± SD, n = 3 membrane–ridge contacts. Arrow indicates a clathrin-coated vesicle. (H) Representative bright-field and AP2-RFP image demonstrating preferential localization of AP2-RFP to the edge of the ridges, where induced curvature is present, rather than to the flat middles. Scale bar, 10 μm.
TEM imaging of the 1,000-nm substrate revealed a flat top with curved sides (Fig. 2 B); cells grown on this size of ridge bear membrane curvature along the side of the ridge and flat membrane along the top of the ridge (Fig. S2 G). The diameter of the approximate semicircle on this curved edge of the ridge is ∼210 nm, similar to that of the 120-nm nanoridge (Fig. S2 G). Consistent with the conclusion that substrate-induced membrane curvature recruits the endocytic machinery, AP2-RFP preferentially appears at the edges of the 1,000-nm ridges (Fig. S2 H). Indeed, a CCP can be seen by TEM protruding from the high-curvature edge (Fig. S2 G).
Nucleation module: Induced curvature does not rescue endocytic site formation upon AP2 knockdown
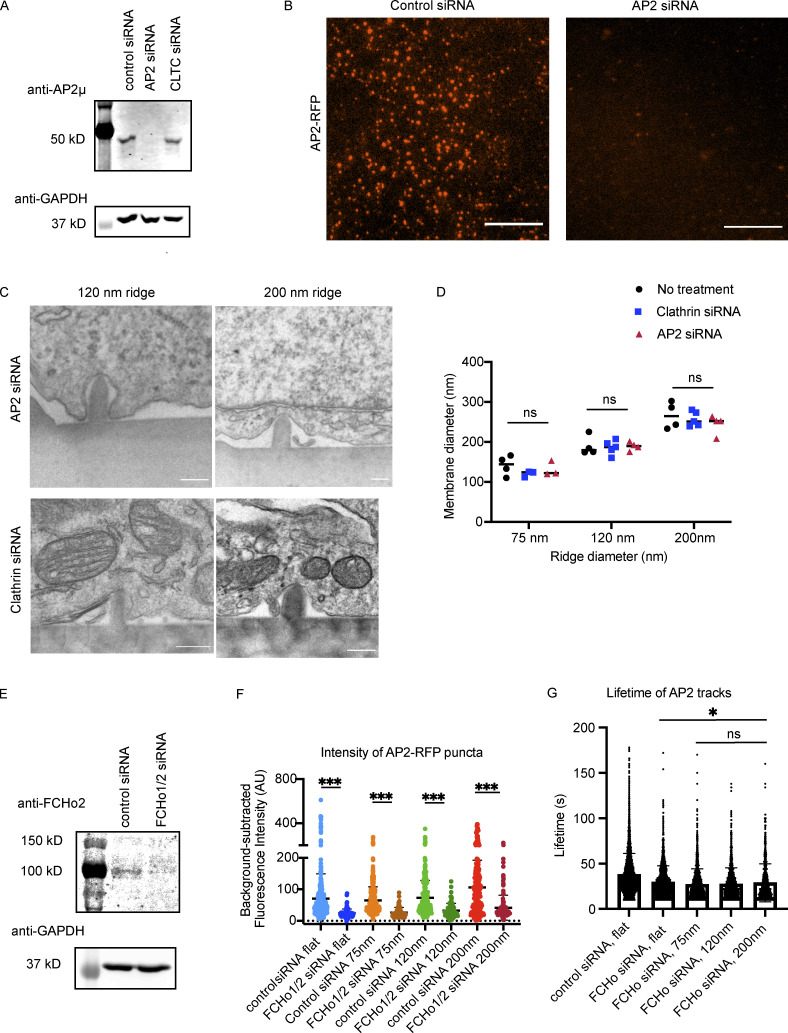
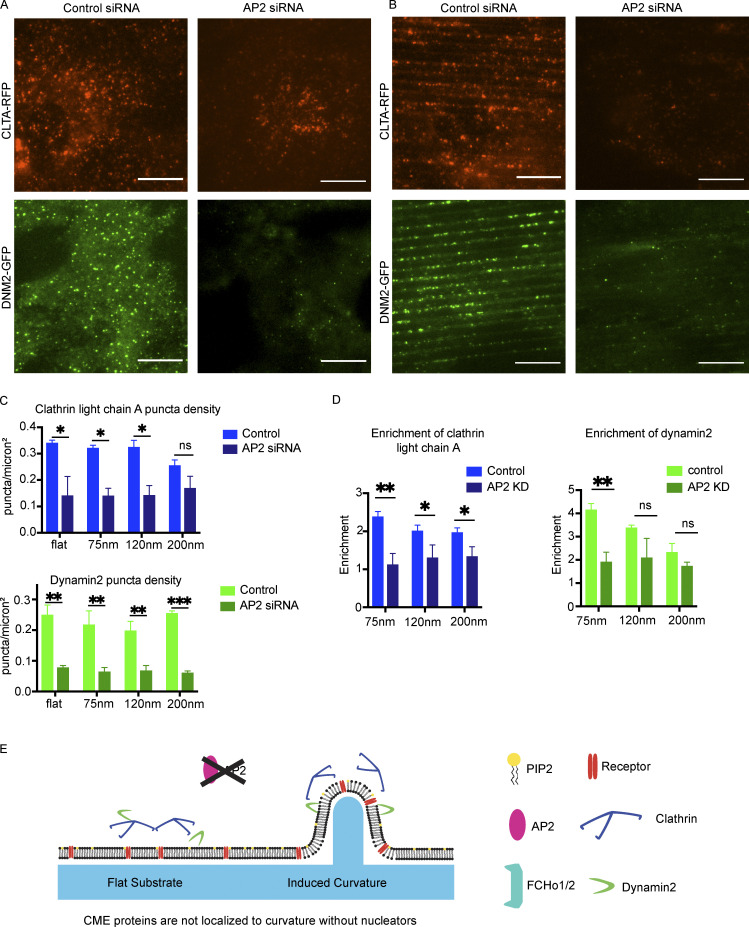
To test whether formation of curvature-dependent CME sites requires the adaptor protein AP2, or whether the CME sites can form without AP2-induced receptor clustering when membrane curvature is stably induced, we knocked down AP2 expression by siRNA and imaged cells on flat and curved substrates. AP2 expression was depleted by >90%, as demonstrated by Western blot and by a decrease in AP2 fluorescence in AP2-RFP–tagged cells (Fig. S3, A and B). AP2 knockdown leads to a marked decrease in CLTA-RFP and DNM2-GFP puncta on flat substrates. This decrease in endocytic proteins is not rescued by induced curvature (Fig. 3, A and B). AP2-depleted cells on a flat substrate showed threefold decreased density of DNM2-GFP puncta and twofold decreased density of CLTA-RFP puncta (Fig. 3 C). Despite the diameter of induced membrane curvature being unchanged by AP2 siRNA (Fig. S3, C and D), the enrichment score for CLTA-RFP decreased significantly upon AP2 knockdown, from ∼2.4 to 1.1 on 75-nm substrates; this decrease in enrichment score was observed across substrate sizes, indicating that clathrin is curvature insensitive when AP2 is knocked down (Fig. 3 D). The remaining DNM2-GFP puncta, however, were still twofold enriched on sites of high curvature, which is a more modest enrichment than in control cells and may reflect dynamin’s participation in other endocytic pathways. These data indicate that AP2 is essential for CLTA/DNM2 clustering irrespective of induced curvature, and therefore that AP2 functions upstream of membrane curvature development (Fig. 3 E).
Figure S3.
AP2 or FCHo1/2 siRNAs reduce expression. (A) Western blot demonstrating reduced AP2 mu subunit expression upon siRNA treatment. (B) Representative images of AP2-RFP from control or AP2 siRNA cells showing reduced AP2-RFP expression upon siRNA treatment. Scale bar, 10 μm. (C) Representative TEM images from AP2 and clathrin siRNA cells showing that membrane adhesion to nanoridges is not affected by siRNA treatment, with quantification in D. Mean, n ≥ 4 membrane–ridge contacts from three cells each; P values from ANOVA. (E) Western blot demonstrates reduced FCHo1/2 expression after exposure to siRNAs. (F) Brightness of automatically detected AP2-RFP puncta demonstrates a decrease upon FCHo1/2 siRNA treatment that is unchanged by curvature. Mean with interquartile range. ***, P < 0.001, from multiple t test. n ≥ 65 puncta from three different cells per condition. (G) Quantification of lifetimes of all AP2 tracks from control or siRNA-treated cells. There is a persistent reduction in lifetime after FCHo1/2 siRNA treatment, which is unchanged by induced membrane curvature, indicating that sites do not mature correctly to full CCPs but instead disassemble. Mean with interquartile range. *, P < 0.05; ns, P > 0.05, from ANOVA. n ≥ 780 traces from three different cells per condition.
Figure 3.
Induced curvature does not rescue nucleation disruption. (A and B) Representative images of cells from flat substrate (A) or 75-nm ridges (B) expressing CLTA RFP or dynamin2 GFP with control or AP2 siRNA. Scale bar, 10 μm. (C) Quantification of CLTA or dynamin2 puncta density as a function of induced curvature; **, P < 0.01; *, P < 0.05; ns, P > 0.05 from multiple t test with Welch correction. Mean ± SD, n = 3 cells per condition. (D) Enrichment score for clathrin and dynamin is reduced after AP2 knockdown. **, P < 0.01; *, P < 0.05; ns, P > 0.05 from multiple t test. Mean ± SD, n = 3 cells per condition. (E) Model of endocytic protein localization after AP2 knockdown, showing no detectable difference without nucleating factor AP2.
Curvature stabilization module: Induced curvature rescues AP2/DNM2 localization but not CME site number or turnover upon FCHo1/2 knockdown
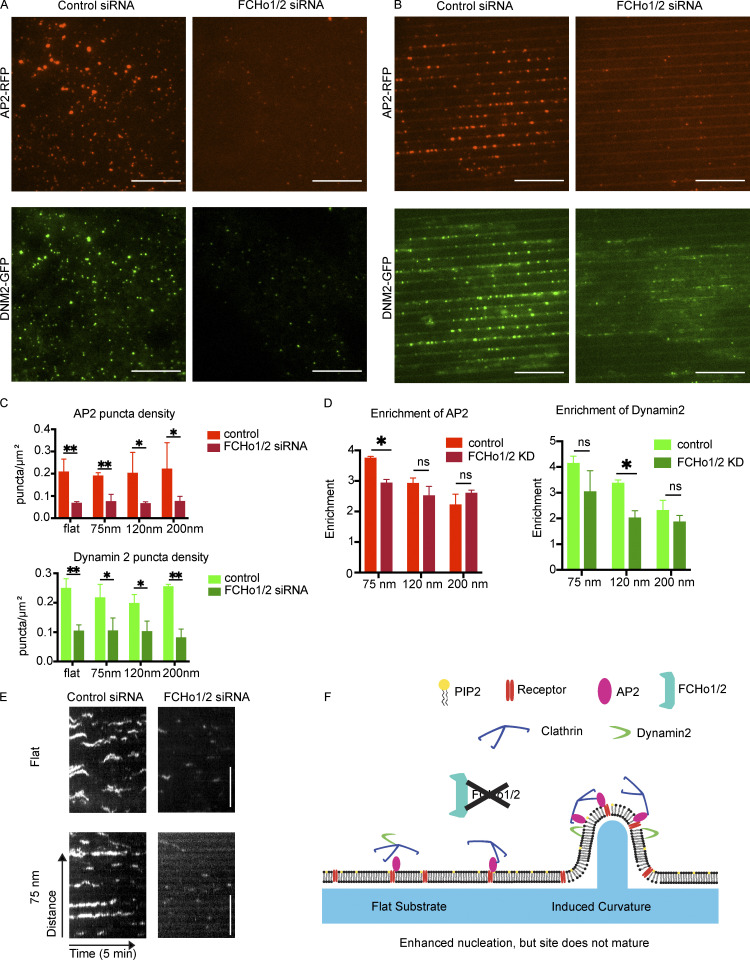
Once we found that AP2 disruption decreased CME site formation irrespective of membrane curvature, we next wondered how stabilization of nascent CME sites is affected by nanoridge substrates. To answer this question, we knocked down the FCHo1/2 proteins by siRNA, which led to an ∼80% decrease in FCHo protein expression as measured by Western blot (Fig. S3 E). Previously, it was established that CCP formation is suppressed by FCHo1/2 knockdown: although AP2 can bind to the membrane and to cargoes, the nascent sites are unstable and disassemble before committing to CME (Cocucci et al., 2012). Consistent with this observation, we found that FCHo1/2 knockdown cells had fewer, dimmer AP2-RFP/DNM2-GFP puncta compared with control cells (Fig. 4 A). This reduction in number and intensity of AP2-RFP/DNM2-GFP puncta was also apparent on nanoridge substrates (Fig. 4 B). Automated puncta detection found a >3-fold decrease in AP2-RFP puncta and >2-fold decrease in DNM2-GFP puncta per square micrometer after FCHo1/2 disruption across all substrate sizes, evidence of aborted CCP formation, as well as a 2.5-fold decrease in mean pixel intensity of AP2 puncta, unchanged by nanoridge size (Figs. 4 C and S3 F).
Figure 4.
Curvature enhances nucleation but does not bypass CCP stabilization. (A and B) Representative images of cells on flat substrate (left) or 75-nm ridges (right) demonstrating a reduction in AP2-RFP and DNM2-GFP number and intensity after FCHo1/2 knockdown, which is not rescued by induced curvature. (C) Quantification of puncta density after siRNA treatment showing reduction in number with siRNA treatment that is not rescued by induced curvature. **, P < 0.01; *, P < 0.05; ns, P > 0.05 from multiple t test. Mean ± SD, n = 3 cells per condition. (D) Enrichment score for AP2-RFP and DNM2-GFP demonstrates enrichment of both proteins on nanoridges after FCHo1/2 disruption, despite the decreased number and intensity. *, P < 0.05; ns, P > 0.05 from multiple t test. Mean ± SD, n = 3 cells per condition. (E) Kymographs of AP2-RFP demonstrate short, dim tracks, typical of abortive CCPs lacking FCHo1/2. Scale bar, 5 μm. Brightness of FCHo1/2 knockdown kymographs is increased 5× for visualization. (F) Model of CCP nucleation in response to induced curvature after FCHo1/2 knockdown, in which curvature enhances the nucleation of AP2 sites, but the sites are not stabilized and therefore disassemble rather than maturing.
Interestingly, the remaining puncta, although dimmer, were still strongly enriched at sites of high membrane curvature, with an approximately threefold enrichment for both AP2-RFP and DNM2-GFP puncta at 75 nm, similar to the enrichment observed for cells treated with control siRNA (Fig. 4 D). This enrichment decreased as curvature decreased, consistent with control cells. Many DNM2-GFP puncta, while localized to the nanoridges, do not have a corresponding AP2-RFP spot, underscoring the possibility that curvature may also be important in non-CME events in which dynamin2 participates (Fig. 4 B). Kymographs of AP2-RFP from time-lapse imaging revealed short, dim AP2 tracks, similar to what was observed previously for cells lacking the FCHo1/2 CCP stabilization complex (Fig. 4 E). Automated AP2-RFP lifetime analysis found that, while the average lifetime for all AP2-RFP detections in control cells was ∼40 s, this lifetime decreased to <30 s for FCHo1/2 KD cells and was unchanged by nanoridge size, consistent with aborted CCP formation when the sites lacked the stabilizing complex (Fig. S4 G). Taken together, these data indicate that nanoridges cannot rescue the CCP stabilization defect that results upon FCHo1/2 knockdown, but that CCP nucleation is nevertheless strongly curvature sensitive, as AP2 clusters on nanoridges even without maturing. Thus, curvature assists CME site formation starting at its earliest stage, but CCP stabilization factors are still necessary for committed CME (Fig. 4 F).
Figure S4.
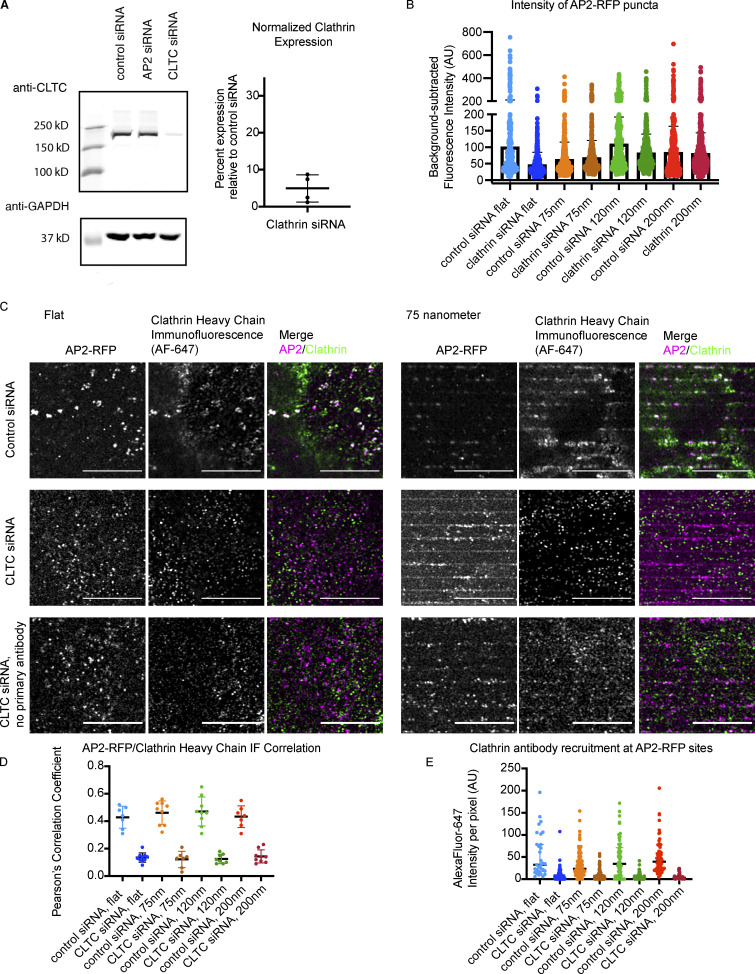
Clathrin siRNA reduces expression and detection through IF. (A) Western blot demonstrating reduced clathrin heavy chain expression upon siRNA treatment, with quantification of average knockdown efficiency. Mean ± SD, n = 4. (B) Intensity of AP2-RFP puncta with control or clathrin siRNA. Mean with interquartile range, n ≥ 350 puncta from three cells per condition. (C) Representative images of IF to clathrin heavy chain from control and clathrin knockdown cells on flat substrates or 75-nm ridges, highlighting reduced clathrin heavy chain detection after knockdown regardless of curvature. (D) Pearson’s correlation coefficient of AP2-RFP and clathrin heavy chain IF with or without clathrin knockdown. Mean ± SD, n = 10 cells per condition. (E) Quantification of clathrin heavy chain fluorescence intensity per pixel at sites of AP2-RFP for flat or curved substrates with and without knockdown. Mean with interquartile range; n ≥ 200 puncta form three cells per condition.
Induced curvature rescues endocytic site formation upon clathrin knockdown
Clathrin heavy chain knockdown leads to formation of unstable nascent endocytic sites that stall as flat patches (Hinrichsen et al., 2006). Because there is debate about clathrin’s role during CME, we wondered how these unstable nascent endocytic sites formed upon clathrin knockdown would respond to stable membrane curvature. Upon siRNA treatment, clathrin heavy chain expression was reduced by 95.1%, as measured by ratiometric densitometry of Western blots from each knockdown experiment (Fig. S4 A). Previously, it was established that CME in mammalian cells fails when clathrin heavy chain is knocked down, with reduced endocytic patch formation and transferrin uptake (Hinrichsen et al., 2003). Consistently, compared with sites seen in cells treated with control siRNA, clathrin knockdown in cells grown on flat substrates led to markedly dimmer AP2-RFP and DNM2-GFP puncta with reduced puncta intensity, indicating that true endocytic sites are not formed (Fig. 5 A). AP2-RFP puncta in clathrin knockdown cells were reduced to ∼40% of the fluorescence intensity of control AP2-RFP sites (Fig. S4 B).
Figure 5.
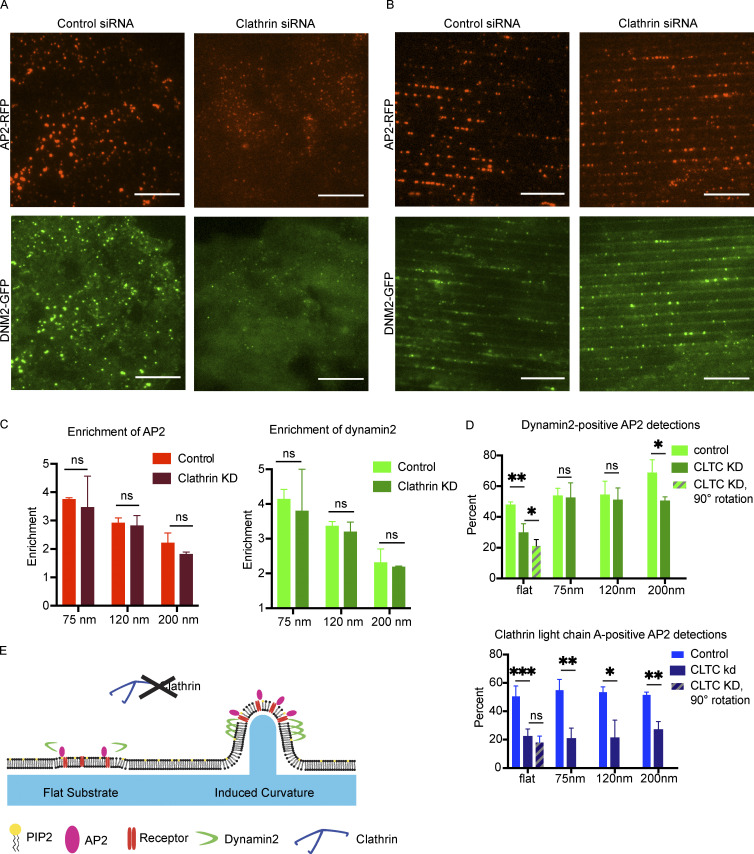
Curvature rescues a defect in endocytic site formation resulting from clathrin knockdown. (A and B) Representative images of control or clathrin siRNA cells grown on flat (A) or 75-nm ridge (B) substrate showing a marked increase in endocytic site fluorescence intensity and overlap of AP2 with dynamin2 in clathrin knockdown cells grown on nanoridge substrates. Scale bar, 10 μm. (C) Enrichment of AP2-RFP and DNM2-GFP is unchanged after clathrin knockdown, indicating that localization of CCPs to regions of induced membrane curvature is independent of clathrin expression. P values from multiple t tests, Mean ± SD, n = 3 cells per condition. (D) Induced curvature rescues the AP2 overlap with DNM2-GFP for automated AP2 detections; however, it does not rescue the AP2 overlap with residual CLTA-RFP detection for automated AP2 detections. ***, P < 0.001; **, P < 0.01; *, P < 0.05; ns, P > 0.05 from multiple t test. Mean ± SD, n = 3 cells per condition. (E) Model of endocytic protein stabilization in the absence of clathrin coats at regions of induced membrane curvature.
However, when clathrin knockdown cells were grown on 75–200-nm nanoridges, there was a striking enrichment in AP2-RFP puncta and an increase in puncta intensity and apparent site size, with AP2-RFP puncta bearing 90–110% of the fluorescence intensity of sites from the same nanoridge size treated with control siRNA, as well as a robust recruitment of DNM2-GFP puncta (Figs. 5 B and S4 B). Thin-section TEM imaging revealed that the diameter of the membrane on nanoridges was unaffected by clathrin knockdown (Fig. S3, C and D). The enrichment score for AP2-RFP and DNM2-GFP was unchanged by clathrin siRNA relative to control siRNA-treated cells (Fig. 5 C). To determine the extent of clathrin heavy chain recruitment to sites of curvature after clathrin knockdown, we performed immunofluorescence (IF) of clathrin heavy chain on cells treated with control or clathrin siRNA (Fig. S4 C). In control cells, there was clear overlap of clathrin heavy chain IF with AP2-RFP, and a strong enhancement of clathrin heavy chain on high-curvature ridges; however, upon clathrin knockdown, the overlap of clathrin heavy chain IF with AP2 was markedly reduced and appeared quite similar to what we observed with secondary-antibody staining alone (Fig. S4 C). Pearson’s correlation coefficient between AP2-RFP and clathrin heavy chain IF was reduced from ∼0.45 to ∼0.1 across all substrate sizes, and the fluorescence intensity of the clathrin heavy chain channel at sites of AP2-RFP was reduced >10-fold. After clathrin knockdown, the majority of AP2-RFP sites bore no clathrin heavy chain signal above background, which was unchanged by induced curvature (Fig. S4, D and E).
We next used computational tools to measure the percentage of AP2 sites that recruited other CME proteins upon siRNA treatment (Aguet et al., 2013; Burckhardt et al., 2021). After clathrin heavy chain knockdown, the percentage of AP2-RFP detections that overlapped with DNM2-GFP decreased from 49 to 29% (Fig. 5 D). Automated puncta correlation is sensitive to the density of fluorescent proteins and the tracking radius (i.e., the distance between detections in the two channels that are classified as correlated) and so has some rate of false positives. To estimate uncorrelated detections that were due to chance rather than true recruitment, we rotated the DNM2-GFP channel from clathrin siRNA-treated cells by 90° and reanalyzed the correlation, finding that 21% of AP2-RFP detections were DNM2-GFP positive; this result implies that much of the observed overlap in these two channels is spurious, but that a statistically significant increase over chance in DNM2 overlap with AP2 occurs after clathrin heavy chain knockdown. Quantification of the overlap between AP2-RFP and DNM2-GFP on 75-nm ridges after clathrin heavy chain knockdown demonstrates a dramatic rescue in DNM2-positive AP2 tracks, to 52%, matching the overlap observed in cells treated with control siRNA. This increase in overlap persists across nanoridge sizes <200 nm.
In contrast, overlap between AP2-GFP and clathrin light chain A (CLTA-RFP), a subunit of the clathrin coat not targeted by our siRNA, was markedly decreased from 51 to 22% after clathrin heavy chain knockdown (Fig. 5 D). When the CLTA-RFP channel was rotated by 90°, the correlation measured was 18%, a statistically insignificant difference from the unrotated stacks; thus, the majority of these correlated detections are likely due to chance rather than actual recruitment of CLTA by AP2. This decrease in fluorescence overlap is not changed by induced curvature, evidence that the rescue of the endocytic events is not provided by residual clathrin heavy chain, which would be accompanied by enhanced CLTA detection. These data, combined with the marked reduction in clathrin heavy chain IF, support a model of endocytic site formation in which, in the context of acute clathrin heavy chain knockdown, induced membrane curvature is sufficient to stabilize a CCP and recruit both early and late endocytic machinery even with minimal clathrin recruitment (Fig. 5 E).
CME sites on curved substrates show characteristic fluorescence dynamics profiles even when clathrin is knocked down
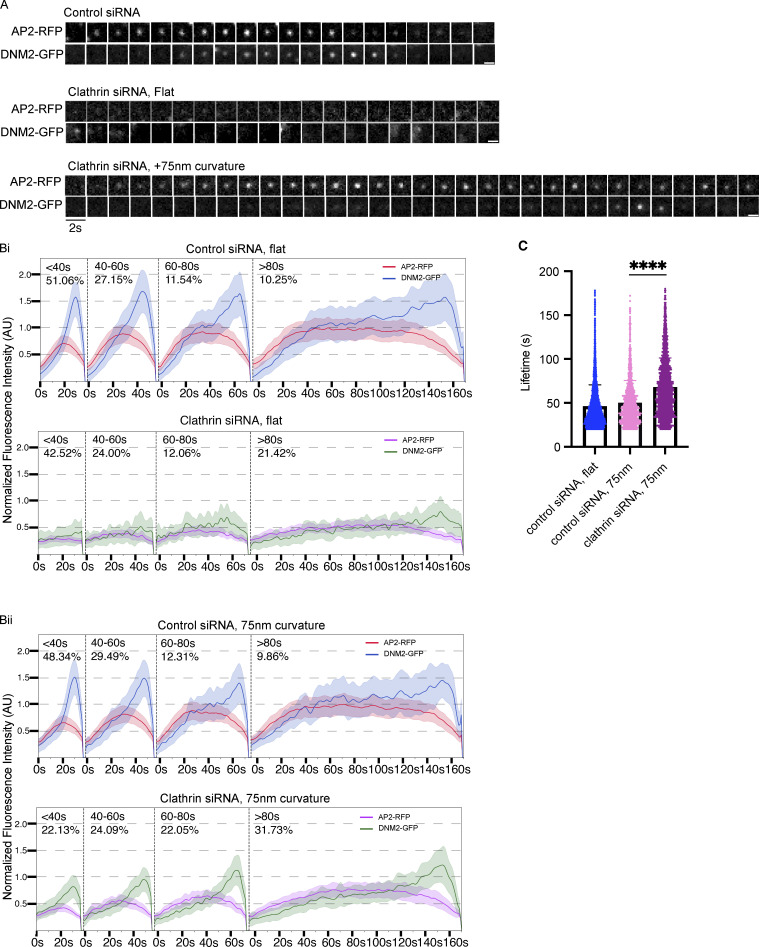
Once we established that AP2 and dynamin2 localization in clathrin knockdown cells could be rescued by induced membrane curvature, we wondered whether these rescued sites turn over with characteristic dynamics even when clathrin is severely depleted. We recorded time-lapse TIRF microscopy of AP2/DNM2 double-labeled cells after clathrin heavy chain knockdown. We found that for cells treated with control siRNA, the sites of AP2/DNM2 colocalization appeared as canonical endocytic sites, with a gradual increase in AP2 followed by a burst of DNM2 to indicate vesicle scission (Fig. 6 A).
Figure 6.
Curvature rescues endocytic dynamics site after clathrin knockdown. (A) Representative montages of AP2-RFP/DNM2-GFP sites from control or clathrin knockdown cells, with or without induced membrane curvature, showing that with induced curvature there is enhanced AP2-RFP fluorescence and DNM2-GFP recruitment. Scale bar, 1 μm. (B) Averaged, binned tracks of AP2-RFP and DNM2-GFP from control (Bi) or clathrin knockdown (Bii) cells, demonstrating that induced membrane curvature restores track profiles to canonical form. Mean ± 0.25SD, n ≥ 1,200 tracks from three cells per condition. (C) Average lifetimes from B showing that with clathrin knockdown, CCPs on nanoridges have an increased lifetime of ∼70 s on average compared with 55 s for control events on nanoridges. ****, P < 0.0001, Student’s t test. Mean with interquartile range, n ≥ 1,200 tracks from three cells per condition.
After binning the AP2/DNM2 positive tracks according to lifetime, we found that, for cells grown on flat substrates, clathrin heavy chain knockdown results in an AP2 fluorescence signal decrease to only ∼35% of control-siRNA treated cells (Fig. 6 Bi). The remaining DNM2 signal showed a nearly symmetrical, noisy distribution over time, rather than a late-peaking recruitment characteristic of cells treated with control siRNA. However, tracks for cells grown on 75-nm substrates demonstrated a rescue of AP2 fluorescence intensity to ∼70% of control, and the DNM2 signal demonstrated late peaks characteristic of productive vesicle formation (Fig. 6 Bii). We found the average lifetime of clathrin knockdown tracks (68 ± 33 s) was significantly increased over control siRNA cells (50 ± 26 s), indicating that despite the otherwise normal fluorescence dynamics, vesicle turnover is affected by clathrin heavy chain knockdown (Fig. 6 C).
Actin module: Induced curvature enhances AP2/DNM2 recruitment upon branched actin inhibition and membrane tension elevation and lengthens AP2/DNM2 track lifetime
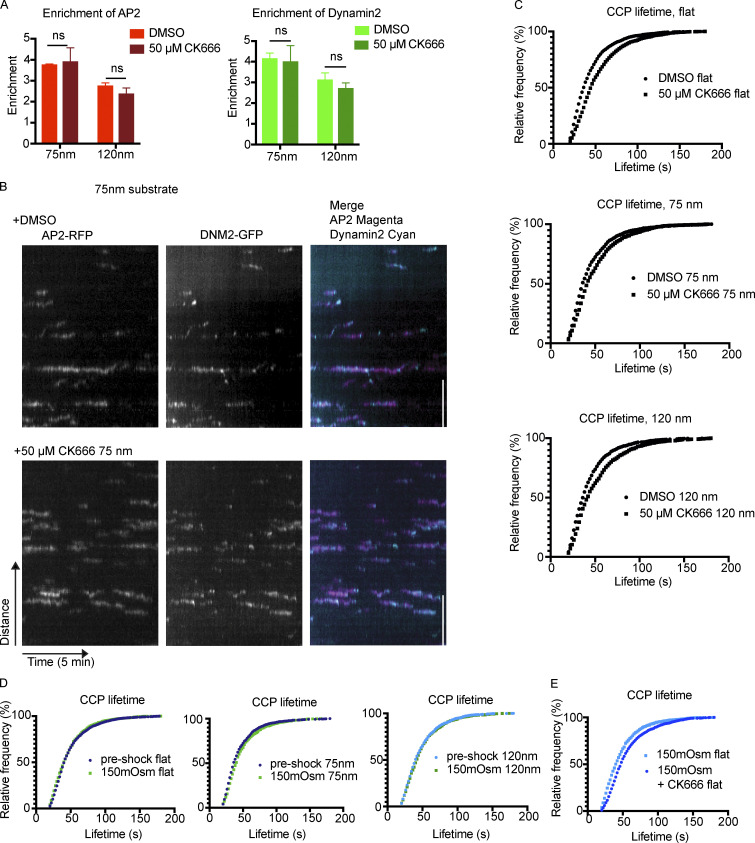
Actin polymerization is a central force-producing mechanism during membrane-remodeling processes such as CME (Kaksonen et al., 2006). In Saccharomyces cerevisiae and Schizosaccharomyces pombe, Arp2/3-nucleated branched actin polymerization is necessary for endocytosis to overcome the high internal turgor pressure within the organism, while in mammalian cells the dependence on branched actin networks is indispensable in cases of high membrane tension (Aghamohammadzadeh and Ayscough, 2009; Boulant et al., 2011). To test how the actin module is connected to curvature production, we used the Arp2/3 inhibitor CK666 to disrupt branched actin polymerization in cells grown on Ormocomp (Nolen et al., 2009). Treatment with 50 μM CK666 alone had no effect on endocytic site enrichment to nanoridges, and caused only a 10% increase in lifetime of CME sites for cells on flat Ormocomp (Fig. S5, A–C). CCPs on 75- or 120-nm ridges demonstrated a slightly more modest 5–7% increase in lifetime upon CK666 treatment (Fig. S5 C). We hypothesize that this effect is because Ormocomp’s elastic modulus is ∼50× lower than that of glass and therefore might cause cells grown on Ormocomp to have lower membrane tension than cells grown on glass (Gissibl et al., 2017).
Figure S5.
CK666 or osmotic shock alone has little effect on CCPs on Ormocomp. (A) Enrichment of AP2/DNM2 is unchanged by CK666 treatment. P value from multiple t test, n = 3 cells per condition. Mean ± SD. (B) Example kymographs from 75-nm ridges demonstrate that CK666 treatment does not notably alter endocytic profiles compared to DMSO treatment. Scale bar, 5 μm. (C) Relative frequencies of CCPs from flat or nanoridge substrates with CK666 demonstrates ∼5–10% increase in lifetimes with CK666 treatment (compared with a 20–50% increase for cells grown on glass), evidence of low dependence on actin polymerization for most CCPs on Ormocomp. n ≥ 200 tracks from three cells per condition. (D) Average CCP lifetime is unchanged by shock with 150 mOsm media, across nanoridge sizes. n ≥ 200 tracks from three cells per condition. (E) Combination of 150 mOsm with CK666 leads to modest increase in endocytic lifetime on flat Ormocomp substrates. n ≥ 200 tracks from three cells per condition.
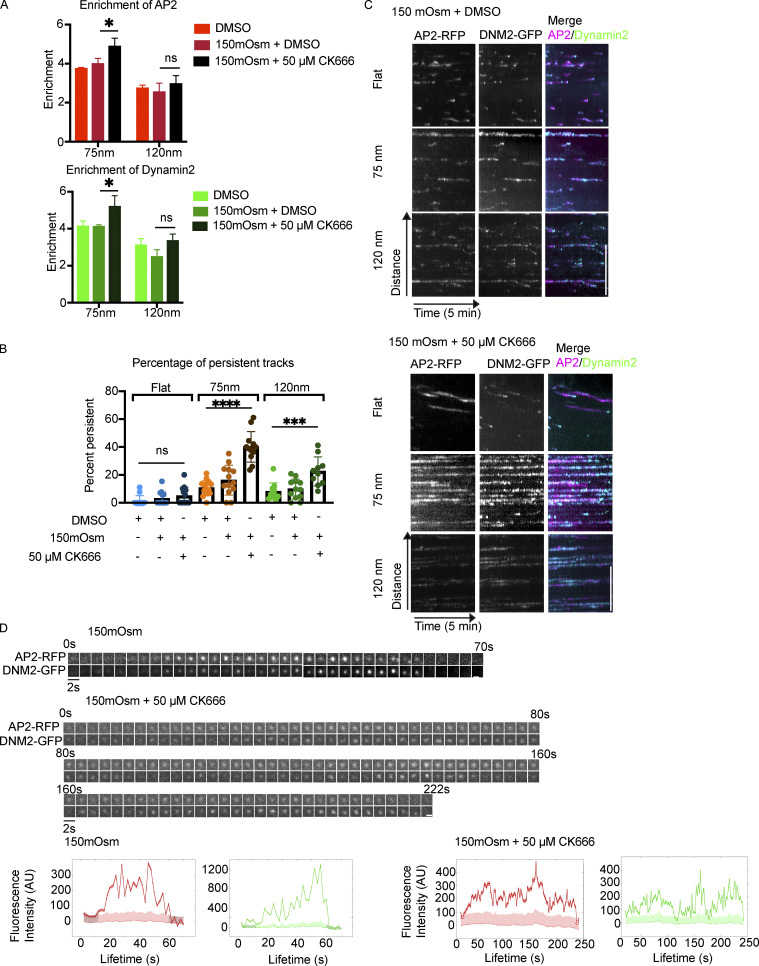
To increase CME dependence on the actin module, we elevated the membrane tension of MDA cells on Ormocomp with hypotonic shock (Boulant et al., 2011). Upon incubation in medium with reduced osmolarity of 150 mOsmol, there was no effect on CCP lifetime on flat or curved substrates, and curvature-induced CCP recruitment was still observed (Figs 7 A and S5 D). However, combination of elevated membrane tension from osmotic shock and 50 μM CK666 increased the endocytic lifetimes on flat substrates by 20% (Fig. S5 E). Cells with elevated membrane tension and inhibited Arp2/3 complex showed a striking response to nanoridge substrates: there was an increase in AP2-RFP and DNM2-GFP enrichment relative to cells subjected to hypotonic shock or CK666 treatment alone. AP2 showed a 4.9-fold enrichment (up from 3.8 for osmotic shock alone) and DNM2 showed a 5.2-fold enrichment (up from 4.1 for osmotic shock alone) on 75-nm ridges (Fig. 7 A). An enrichment score of 4.9 corresponds to ∼90% of AP2 detections colocalizing to nanoridges, meaning very few endocytic proteins are detectable at regions lacking induced curvature.
Figure 7.
CK666 treatment under elevated tension increases enrichment and lifetime at sites of high curvature. (A) Combination of osmotic shock and CK666 enhances CCP localization to 75-nm nanoridges. Mean ± SD. *, P < 0.05; ns, P > 0.05 from multiple t test, n = 3 cells per condition. (B and C) Osmotic shock and CK666 together cause a marked increase in percentage of tracks identified as persistent (i.e., present throughout 5-min time-lapses), as quantified in B and demonstrated in kymographs in C. Scale bar, 5 μm. Mean ± SD. ****, P < 0.0001; ***, P < 0.001; ns, P > 0.05, ANOVA; n ≥ 16 kymographs from three cells per condition. (D) Representative montages of CCPs from osmotic shock alone (top) and osmotic shock with CK666 (bottom), showing persistence of AP2/DNM2 fluorescence with correlated bursts of fluorescence intensity across the two fluorophores, with fluorescence traces below. Scale bar, 1 μm.
The dynamics of these sites were also markedly altered, with many long-lasting AP2-RFP tracks featuring repeated bursts of DNM2-GFP fluorescence (Fig. 7, B–D). These persistent AP2 tracks are correlated with strong, fluctuating DNM2-GFP signal throughout the lifetime of the movie, often correlated with increases in AP2-RFP fluorescence (Fig. 7 D). Quantification of the number of persistent tracks—i.e., tracks lasting the entirety of our 5-min time-lapses—indicated a robust increase on 75 nm ridges, from 16% of tracks being persistent in 150 mOsm cells alone to 40% persistent in cells subjected to 150 mOsm + 50 μM CK666 treatment (Fig. 7 E). Persistent tracks are largely lacking from cells on flat substrates, although there is a doubling of persistent tracks from 2.5 to 5% on flat substrates upon treatment with osmotic shock and CK666. This increased enrichment at nanoridges and lengthened AP2/DNM2 track lifetime after Arp2/3 inhibition indicate that curvature enhances CCP localization in the absence of branched actin filament polymerization, which implies interplay between branched actin network assembly and curvature generation under high membrane tension.
Curvature-rescued CME sites in clathrin KD cells take up endocytic cargoes
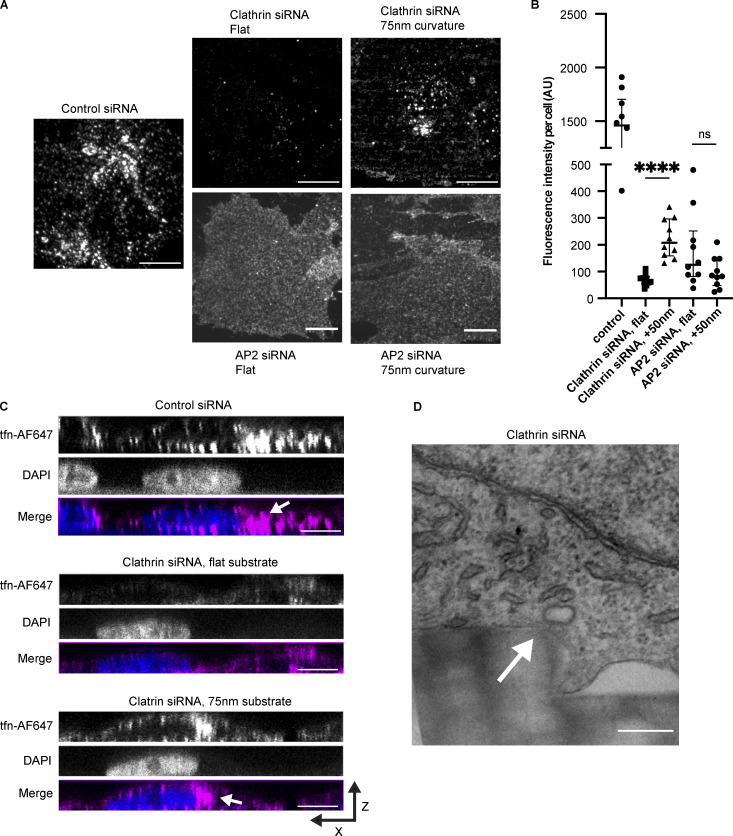
Having observed that curvature-rescued CME sites turn over with fluorescence profiles similar to those of control CME sites, we next sought to determine whether these sites also take up cargo in the absence of clathrin. To test this possibility, we performed transferrin uptake assays with Alexa Fluor 647–labeled transferrin (tfn-AF647). Upon exposure to media containing tfn-AF647, control siRNA-treated cells demonstrated hundreds of trafficked tfn-AF647 puncta in the cell body (Fig. 8 A). Clathrin siRNA-treated cells on flat substrate demonstrated a dramatically reduced number of weakly fluorescent puncta apparently associated with the cell surface, likely representing transferrin molecules bound to their receptor and clustered, but failing to internalize. With 75 nm curvature, however, clathrin heavy chain siRNA-treated cells demonstrated a marked increase in the number and intensity of tfn-AF657 puncta. To quantify the uptake of fluorescent cargo, we drew regions-of-interest around individual cells and measured the mean pixel intensity across 10 cells per condition. We found the mean pixel intensity of control cells to be ∼1,200 ± 500 AU (Fig. 8 B). Clathrin knockdown cells on flat substrate had a mean pixel intensity of 69 ± 22 AU, while clathrin knockdown cells with 75 nm of induced membrane curvature demonstrated a >threefold increase in mean pixel intensity to 223 ± 73 AU. The intensity of curvature-rescued cells was >fourfold less than for control cells, which is consistent with (1) exogenous curvature only partially rescuing endocytosis, and (2) only the ventral membrane contacting nanoridges, and thus having induced membrane curvature.
Figure 8.
Curvature rescues cargo uptake after clathrin knockdown. (A) Representative maximum-intensity projections of Alexa Fluor 647–labeled transferrin from control, clathrin siRNA, and AP2 siRNA cells with or without curvature, showing an increase in fluorescence intensity of clathrin knockdown cells with induced curvature that is absent from AP2 knockdown cells. Scale bar, 10 μm. (B) Quantification of mean pixel intensity from transferrin uptake assays. Mean ± SD. ****, P < 0.0001; ns, P > 0.05 from Student’s t test, n = 10 cells per condition. (C) X-Z projections of control or clathrin knockdown cells, showing that with induced curvature, the fluorescence of Alexa Fluor 647–transferrin is present near the DAPI stain, rather than membrane-associated cargoes. Scale bar, 10 μm. Arrows indicate perinuclear transferrin puncta. (D) Elliptical, electron-clear area visible from the side of a nanoridge substrate from a clathrin knockdown cell, which may be a clathrin-free vesicle caught near the moment of scission. Scale bar, 200 nm. Arrow indicates putative vesicle.
To determine where the tfn-AF647 puncta are located within the cell, we created X-Z projections of confocal microscopy images (Fig. 8 C). Control cells demonstrated perinuclear tfn-AF647 localization, representing trafficking to an endosomal compartment after uptake. In contrast, clathrin siRNA cells on flat substrate showed only membrane-associated tfn-AF647 puncta. However, with induced membrane curvature, we observed perinuclear tfn-AF647 puncta in clathrin knockdown cells, demonstrating that not only is there an increase in clustering of cargo with curvature, but that these clustered sites are potentiated for endocytosis even after disruption of the requisite clathrin coat. Through TEM imaging of clathrin knockdown cells, we found associated with the plasma membrane on regions of induced membrane curvature, membrane-enclosed structures that lack a detectable clathrin coat and have an elliptical shape; these structures, which were not present in electron micrographs from untreated cells, and which were morphologically distinct from caveolae, might represent vesicles forming through curvature-induced rescue of clathrin knockdown near the time of scission (Fig. 8 D).
To test whether curvature can rescue cargo uptake in the absence of AP2, we repeated the transferrin uptake assay in the context of AP2 knockdown (Fig. 8 A). AP2 knockdown leads to membrane-associated tfn-AF647 signal, as the transferrin binds to its receptor on the plasma membrane but cannot cluster or be taken into the cell. AP2-knockdown cells grown on 75-nm ridges demonstrated tfn-AF647 evenly on the plasma membrane, and no internal puncta were visible over the diffuse membrane signal. Furthermore, in AP2-knockdown cells no statistically significant change in average pixel intensity was observed in response to induced membrane curvature (Fig. 8 B). This result indicates that transferrin and/or its receptor are not detectably curvature sensitive in AP2 knockdown cells, and that CME protein preference for high membrane curvature is due to proteins that function downstream of AP2.
Discussion
In this study, to gain insights into the feedback between membrane geometry and biochemical activity, we induced nanoscale membrane curvature in live cells using a novel substrate system with optimal optical properties for live-cell imaging. An attractive hypothesis for how membrane curvature development is controlled during vesicle formation is that the membrane geometry itself acts as a signal to control biochemical reaction rates such as bin-amphiphysin-RVS domain protein recruitment, receptor clustering, or lipid phosphatase activity (Liu et al., 2009). Indeed, in vitro experiments have shown that high membrane curvature and specific lipid characteristics coordinate to induce actin polymerization, as occurs at a late stage of endocytosis (Daste et al., 2017). Membrane geometry and biochemical reaction rates might feed back on each other across CME stages as a flat membrane matures into a spherical vesicle.
Previous studies using techniques such as quartz nanofabrication, collagen fibers, and liposomes have shown that CME proteins and CCPs are preferentially recruited to or formed at highly curved membranes (Zhao et al., 2017; Elkhatib et al., 2017; Busch et al., 2015). Our findings are consistent with these observations. Ormocomp nanoridges might have additional effects beyond inducing membrane curvature, for example, altering membrane tension. However, for two reasons, we favor the conclusion that curvature is the central driver for our observations. First, our results are in agreement with conclusions from other studies cited above, in which membrane curvature was induced via a variety of techniques. Second, on 1,000-nm nanoridges, where membrane curvature is induced on the sides of the ridges but not the top, AP2 puncta accumulate on the high-curved edges of the ridges specifically (Fig. S2 H). The smallest membrane diameter induced by our nanoridge substrates is 50% larger than the diameter of a completed vesicle; thus, the effect of curvature in enriching CCPs is possibly due to enhanced nucleation, which implies that the fully-formed CCP must migrate away from the ridge before scission. This scenario is consistent with TEM images in which the coat is visible atop the nanoridges, but fully formed CCPs are slightly removed from the top of the ridges (Fig. S2 C).
The enrichment score used in this paper gives mechanistic insight into the stepwise progression of vesicle formation and the affinities of proteins for curved membranes. For instance, the relatively low enrichment of caveolin1 on curved nanoridges implies that nucleation on membranes of high curvature is not a general feature common to all endocytic processes and may depend on the specific mechanism of curvature generation used by the associated machinery.
Clathrin’s enrichment on curved membranes decreased after AP2 knockdown even though other putative curvature-generating, clathrin-binding proteins such as epsin and amphiphysin could potentially have recruited it to regions of induced membrane curvature. This observation is consistent with previous reports that clathrin recruitment to CME sites depends on AP2 (Kelly et al., 2014). Interestingly, in MDA cells used in this study, dynamin2 still bore some curvature enrichment, although significantly less than in control cells, after AP2 knockdown eliminated all productive CME sites. This enrichment might be due to some innate curvature preference for dynamin2, or it might be due to its roles in other curvature-sensitive endocytic pathways (Schafer et al., 2002; Henley et al., 1998).
AP2 is the nucleator of CME; however, CME cannot proceed to completion without a suite of other factors such as the stabilizing complex FCHo1/2, without which the AP2 site disassembles (Cocucci et al., 2012). When FCHo1/2 is depleted, AP2 is still enriched on nanoridges, almost as strongly as in control cells. However, the sites still disassemble. This observation is evidence that curvature assists in CME even during the nucleation stage, perhaps because AP2 has curvature affinity. Whether this curvature effect is because of intrinsic affinity of a single AP2 complex for curvature, or because AP2 clustering results in steric hindrance that is relieved by local curvature, is a topic for future work (Stachowiak et al., 2010).
Clathrin’s role during CME has been a topic of debate since the discovery through EM some 40 yr ago of its heterogeneous conformations on the plasma membrane (Heuser and Evans, 1980). While many CME proteins have been shown to sense curvature on their own in purified systems, clathrin’s ability to respond to curvature in vitro depends on its oligomeric assembly into a macromolecular ensemble and is greatly enhanced by other proteins present during CME (Busch et al., 2015; Zeno et al., 2018; Zeno et al., 2021). One proposed model for endocytic membrane curvature formation is that clathrin does not itself generate curvature but acts as a Brownian ratchet, exchanging subunits as the pit grows to stabilize the membrane curvature generated by thermal fluctuations and membrane-bending proteins (Sochacki and Taraska, 2019; Avinoam et al., 2015). Consistent with this model, we found that our artificially induced nanoscale membrane curvature itself was sufficient to produce nearly normal CME protein dynamics and cargo uptake in the context of clathrin knockdown. Thus, even though AP2 and clathrin arrive at a CCP at nearly the exact same time, clathrin must necessarily act downstream of AP2, as our results indicate that its essential role is during membrane invagination rather than during CME nucleation. While the (∼5%) remaining clathrin heavy chain present after siRNA knockdown is probably insufficient to form a cage around the CME site, we cannot rule out the possibility that this remaining pool can form some triskelia that aid the vesicle formation observed after clathrin knockdown. High-resolution imaging such as platinum-replica scanning EM or correlative fluorescence EM to visualize transferrin puncta at an ultrastructural level would illuminate the structure of curvature-induced pits and vesicles and provide additional mechanistic insights into the interplay between curvature and clathrin function. Our curvature-rescued endocytosis in the near-complete absence of clathrin may also be relevant to other trafficking events such as compensatory endocytosis, where coat proteins might be absent, or in divergent endocytosis such as viral uptake, as viral particles are orders of magnitude stiffer than the human plasma membrane and are typically larger than canonical CCP cargoes (Sokac et al., 2003; Mateu, 2012; Ehrlich et al., 2004). Stable membrane curvature from sources outside the cell may be sufficient to drive the formation of endocytic vesicles irrespective of the coat machinery.
Arp2/3-dependent actin polymerization is crucial for endocytic uptake under high membrane tension; however, actin polymerization has also been implicated in endocytic hotspot dynamics, which are important in cargo-specific uptake mechanisms and cell motility. Here, we have shown that when actin polymerization is inhibited under elevated tension, induced membrane curvature enhances CCP site recruitment even above the already high curvature enrichment, and it templates the formation of persistent AP2/dynamin2 tracks wherein dynamin undergoes periodic intensity bursts. These persistent sites are reminiscent of clathrin plaques seen in other cellular contexts, where multiple vesicles are formed from one patch of endocytic proteins, rather than stalled CCPs where dynamin2 recruitment is diminished (Taylor et al., 2011; Grove et al., 2014). The large increase in persistent sites on regions of induced membrane curvature when Arp2/3 is inhibited demonstrates a previously unappreciated aspect of clathrin plaque formation: that membrane shape can influence whether a CME site forms a transient or persistent structure. Perhaps these data reflect a role of actin polymerization in hotspot disassembly, or perhaps endocytic hotspots are upregulated in response to higher membrane tension and a decreased ability of CME sites to properly mature because of actin inhibition (Leyton-Puig et al., 2017; Boulant et al., 2011).
The high-throughput UV-NIL approach to nanofabricate substrates from Ormocomp that we described here uniquely enables both precise control of membrane curvature and state-of-the-art imaging. This approach makes possible in vivo discovery and studies of other curvature-sensitive proteins and processes, so how and when 3D nanogeometry affects biochemical reaction rates underlying diverse cellular processes can be determined.
Materials and methods
Substrate nanofabrication
Nanoridge substrates were made from Ormocomp (Microresist Technologies) adhered to Fisher #1 25-mm coverslips (12-545-86). Coverslips were prepared by cleaning with isopropyl alcohol followed by spin-coating at 2,000 rpm for 45 s, covered with ∼50 μl of hexamethyldisilazane (440191; Sigma-Aldrich), and cured for 5 min at 180°C. Ormocomp was shaped using a silicon wafer mold, and polymerized by exposure to 110 s of UV at 14 mW on OAI Mask Aligner model 204. Silicon molds were made using EBL (VB300; Vistec) on ZEP520A resist followed by inductively coupled plasma reactive ion etching using sulfur hexafluoride (2%) and molecular oxygen (98%) at −150°C in liquid nitrogen–cooled chambers (Oxford Plasmalab RIE). ZEP520A was removed from silicon using acetone/isopropyl alcohol washes. The hydrophobicity of the silicon mold was maintained by gas-phase trichloro-perfluorooctyl silane deposition (448931-10 G; Sigma-Aldrich) for 30 min in vacuum chamber followed by curing at 150°C for 10 min. Polymerized Ormocomp substrates were stored at RT for ≤2 wk before use and irradiated with UV light for 12 min to sterilize before use in cell culture. Ormocomp substrate shape was determined by scanning EM imaging: Ormocomp was sputter-coated in titanium to a thickness of 1–2 nm and imaged on a Hitachi S-5000 scanning EM.
Cell culture and transfection
MDA-MB-231 cells were genome-edited using transcription activator–like effector nucleases to express fluorescent fusion proteins (GFP or RFP) linked to the c-terminus of CLTA, dynamin2 (DNM2), or caveolin1 or an internal fusion tag in the mu subunit of AP2, attached by a flexible linker; all alleles were tagged (Hong et al., 2015). Cells were grown in DMEM/f12 (10565-018; Life Technologies) with 10% (vol/vol) FBS (89510-186; Seradigm) and penicillin/streptomycin (15140-122; Life Technologies) to ≤20 passages. Cells were plated directly onto sterilized Ormocomp substrates at 70% confluence (∼8 × 10⁵ cells per well) 18–24 h before experiments or imaging.
Cells were prepared for TEM by fixation in 2% glutaraldehyde in cytoskeleton stabilization buffer (100 mM methyl ester sulfonate, 150 mM NaCl, 5 mM EGTA, 5 mM MgCl2, and 5 mM glucose in ddH2O, pH 6.8); rinsed 3× in PBS, pH 7.4; stained in 1% osmium tetroxide and 1.6% potassium ferricyanide in PBS, pH 7.4; and rinsed 3× in PBS, pH 7.4. Cells were dehydrated in 7-min washes in 30, 50, 70, 95, 100, and 100% ice-cold ethanol and infiltrated in epon-araldite resin. Resin was polymerized in a 60°C oven for 24 h, and 70-nm sections were cut with an Ultracut E (Leica) and collected onto formvar-coated 50-mesh copper grids. Grids were poststained with 2% uranyl acetate followed by Reynold’s lead citrate for 5 min each. Sections were imaged using a Tecnai 12 120 kV TEM (FEI), and data were recorded using an UltraScan 1000 with Digital Micrograph 3 software (Gatan). Membrane diameter measurements were made using ImageJ.
BFP-Caax in mammalian expression vector (pTagBFP2-C1), a generous gift from the Michael Rape lab (University of California, Berkeley, Berkeley, CA), was transfected into cells on Ormocomp substrates at 70% confluence using lipofectamine 3000 (L3000008; Invitrogen) according to manufacturer protocols (https://tools.thermofisher.com/content/sfs/manuals/lipofectamine3000_protocol.pdf). Cells were imaged 18–24 h after transfection. CellMask Orange (C10045; Invitrogen) and Vybrant DiO (V22886; Invitrogen) were diluted 1,000× in medium before staining; staining was performed for 10 min at 37°C, followed by two washes in fresh 37°C medium before imaging.
Dharmacon Smartpool siRNAs (L-004001-01-0005, L-008170-00-0005, L-014114-02-0005, and L-024508-02-0005) were used to knock down clathrin heavy chain, AP2Mu1, FCHo1 with FCHo2, respectively, or a nontargeting control (D-001810-10-05) was used. Cells were transfected using Lipofectamine 3000 according to manufacturer protocols using an siRNA final concentration of 20 nM. Briefly, 3.75 μl of Lipofectamine 3000 was added to 125 μl of Opti-MEM medium (31985062; Gibco), and 5 μl of siRNA was added to another 125 μl of Opti-MEM medium; the two solutions were mixed, incubated at RT for 5 min, and added dropwise to cells. Cells were incubated for 72 h after transfection before imaging. 18–24 h before imaging or experiment, cells were split. 50% of cells were seeded on Ormocomp substrates. The remaining cells were grown for Western blot analysis to determine knockdown efficiency.
For Western blots, cells were washed on ice in cold DPBS (14190-144; Gibco), lysed on ice using prechilled cell scrapers (3008; Corning) in lysis buffer (150 mM NaCl, 1% NP-40, 50 mM Tris, pH 8.0, and 1× Roche protease inhibitor tablet [11697498001]), with immediate addition of 4× Laemmli buffer and 0.5% (vol/vol) β-mercaptoethanol. Samples were thoroughly mixed by scraping tubes along a tube rack, boiled for 5 min, and centrifuged at 17,900 g for 5 min before running at 120 V on a 10% SDS-polyacrylamide gel. Gels were transferred to nitrocellulose membrane (10600006; GE Healthcare) for 90 min at 40 V in 4°C transfer buffer (25 mM Tris base, 192 mM glycine, and 20% [vol/vol] methanol) and blocked for 1 h at RT in 5% milk in TBSt (10 mM Tris, 0.09% [wt/vol] NaCl, and 0.05% [vol/vol] Tween-20, pH 7.5). Membranes were probed with clathrin heavy chain antibody (ab21679, rabbit; Abcam) at 1:500 dilution in TBSt with 5% milk, AP2M1 antibody (ab75995, rabbit; Abcam) at 1:1,000 dilution in TBSt with 5% milk, or FCHo2 antibody (ab122407, rabbit; Abcam) or GAPDH antibody (ab9485, rabbit; Abcam) at 1:2,000 dilution in TBSt, all for 1 h at RT, followed by 4× 10-min washes in TBSt. Secondary antibodies (926-32213; LI-COR Biosciences; donkey anti-rabbit) were blotted at 1:2,500 dilution in TBSt for 1 h at RT, followed by 4× 10-min washes in TBSt and immediate imaging on LICOR Odyssey CLx.
Transferrin uptake assays were performed by serum-starving cells in DMEM/f12 with 0.5% (wt/vol) BSA (A9647; Sigma Life Sciences) for 30 min followed by adding fresh DMEM/f12/BSA with Alexa Fluor 647–labeled transferrin at a concentration of 10 μg/ml (009-600-050; Jackson ImmunoResearch). Cells were exposed to transferrin for 2 min followed by 2-min chase in fresh DMEM/f12/BSA. Cells were then washed 1× with ice-cold DPBS. Cells were fixed in 4% PFA (Electron Microscopy Solutions) in Tris/potassium chloride cytoskeleton buffer (10 mM MES, 150 mM NaCl, 5 mM EGTA, 5 mM glucose, 5 mM MgCl2, and 0.005% sodium azide, pH 6.1) for 20 min at RT, followed by 3 × 5–min washes in 50 mM ammonium chloride in cytoskeleton buffer, mounted on microscope slides in fluorescence mounting medium (H-2000; Vectashield), and either imaged immediately on a confocal microscope or stored at 4°C overnight until confocal imaging.
Control and clathrin-knockdown cells were prepared for IF by fixing in 4% PFA in PBS, pH 7.4, for 20 min at RT, followed by quenching in 50 mM ammonium chloride in PBS, pH 7.4, for 5 min at RT three times. Cells were permeabilized in 0.1% Triton X-100 in PBS, pH 7.4, and blocked in 1% BSA/22.5 mg/ml glycine in PBS, pH 7.4. Clathrin heavy chain antibody X22 (ab21679, mouse; Abcam) was incubated at 1:1,000 in PBS, pH 7.4, with 1% BSA for 1 h at RT in a humidity chamber, followed by three washes in PBS, pH 7.4, and secondary incubation with Alexa Fluor 647 anti-mouse secondary antibody from goat (A32728; Invitrogen) at 1:1,000 for 1 h at RT in a humidity chamber in PBS, pH 7.4, with 1% BSA. Cells were washed 3× in PBS, pH 7.4, and imaged immediately by confocal microscopy.
Osmotic shock and CK666 treatments
Cells were plated at 70% confluence 18 h before experiments. Cells were imaged in isotonic media with 1:1,000 DMSO before hypotonic shock; cells were then exposed to 150 mOsmol hypotonic solution comprising a 1:1 mixture of (a) DMEM f12 with 10% FBS and penicillin/streptomycin and (b) inorganic salt solution (10 mM CaCl2, 0.3 mM MgCl2, and 0.1 mM MgSO4), with 1:1,000 DMSO. Cells were imaged within 10 min of exposure to hypotonic media. CK666 (SML0006-5MG; Sigma-Aldrich) was reconstituted to 50 mM in DMSO, frozen, and thawed only once before use. For CK666 treatment alone, cells were incubated with 1:1,000 dilution of CK666 for 20 min before imaging. For combination CK666/hypotonic solution, cells were incubated for 18 min in CK666, exposed to fresh hypotonic shock solution as described above except with 1:1,000 CK666 rather than DMSO, and imaged 2 or 8 min after exposure to hypotonic solution.
Microscopy
TIRF microscopy was carried out using a Nikon Eclipse Ti2 TIRF microscope with Nikon 60× Plan Apochromat TIRF objective (NA 1.49) and captured on a Hamamatsu Orca 4.0 sCMOS camera operated by Nikon Elements software, in a temperature-controlled chamber set to 37°C. The TIRF angle was adjusted to pseudo-TIRF to create an evanescent field of ∼300 nm, extending above the bottom of the pillars to ensure illumination of the membrane on the top of the pillars. The best illumination of the membrane and endocytic fluorophores was generated by aligning the illumination angle parallel to the direction of the nanoridges, as determined empirically. Cells were imaged in DMEM/f12 with 10 mM Hepes supplemented for ≤1 h. Microtubule calibration was performed exactly as described in Gell et al. (2009), with the only modification that Alexa Fluor 488 tubulin and Rhodamine tubulin were incubated 1:1:4 with nonfluorescent tubulin. Alexa Fluor 488 tubulin was a generous gift of the Ahmet Yildiz lab of University of California Berkeley. Briefly, tubulin was incubated at 37°C for 2 h in BRB80 (80 mM Pipes, 1 mM MgCl2, and 1 mM EGTA, pH 6.8), followed by ultracentrifugation at 278K g for 30 min and suspension in ∼40 μl of 1% agarose in BRB80 with glucose, glucose oxidase, and catalase. Microtubules were imaged immediately. Laser lines were 405 nm for BFP; 488 nm for GFP, AlexaFluor488, and Vybrant DiO; and 561 nm for RFP, Rhodamine, and CellMask Orange.
Z-sections of the ventral surface of cells and control/clathrin siRNA transferrin uptake assays were done on a Zeiss LSM 900 with Airyscan 2.0 detection, using a Zeiss 60× objective (NA 1.4) in 4Y multiplex mode, operated by Zen Blue software. Entire cell volumes or ventral surfaces were collected at Nyquist sampling frequency (140 nm per Z-section), and maximum-intensity projections were created in ImageJ for analysis. Images were batch-processed by Zen Blue software for Airyscan reconstructions using filter strength setting of 6. Immunofluorescence of control or clathrin heavy chain siRNA-treated cells was performed identically, except in full Airyscan superresolution mode, by imaging the ventral 3 μm of the cell, and images were batch-processed by Zen Blue software with filter strength setting of 8.4. Laser lines were 405 nm for DAPI or BFP, 488 nm for GFP, 561 nm for RFP, and 647 nm for Alexa Fluor 647. Live cells were imaged in DMEMf12/10 mM Hepes at 37°C using a temperature-controlled chamber for ≤1 h; fixed cells were imaged at RT in PBS, pH 7.4, or fluorescence mounting medium.
Confocal microscopy for AP2 knockdown cells and for no-treatment transferrin uptake assays was done on a Nikon Eclipse Ti microscope with Yokogawa spinning disk and Andor EMCCD, operated by Nikon Elements software, using a Nikon 60× Plan Apochromat objective (NA = 1.45). Entire cell volumes were collected at Nyquist sampling frequency (200 nm per Z-section), and maximum-intensity projections were created in ImageJ for analysis. Laser lines were 405 nm for DAPI and 647 nm for Alexa Fluor 647. Cells were imaged at RT in fluorescence mounting medium.
Computational analysis
Puncta of endocytic proteins were detected using Trackmate 6.0.3 in differences-of-Gaussians mode. Nanoridges were detected using custom Python scripts built on the Hough transform in Python package cv2. TIRF videos were analyzed using the Matlab cmeAnalysis package. Standard settings for model-based detection, Gaussian fitting, radius of detection, and gap closing were selected. Further postprocessing was completed using custom Python scripts, available at https://github.com/DrubinBarnes/Cail_Shirazinejad_Drubin_2022. Valid endocytic sites were selected based on lifetime limits of 18–180 s, mean squared displacement (MSD) measurement <0.02 μm2, and at least four consecutive seconds of dynamin2 detection, as previously reported for valid CCPs (Pascolutti et al., 2019). Immunofluorescence colocalization was measured with the Coloc2 plugin in Fiji; fluorescence intensity of clathrin heavy chain at AP2 sites was measured by creating masks of AP2 puncta in CellProfiler 4.
Statistical analyses were conducted either with Python packages NumPy, Pandas, SciPy, and Seaborn or with Prism 9. Graphs were produced with Prism 9. t tests and ANOVA were performed in Prism 9; all t tests were two-tailed. Data distribution was assumed to be normal but was not formally tested. Table S1 contains a full explanation of statistical tests and their computed P values. Python code is available at https://github.com/DrubinBarnes/Cail_Shirazinejad_Drubin_2022.
Online supplemental material
Fig. S1 demonstrates nanofabrication method and validation of TIRF microscopy/membrane area correction, as well as sample images of cell membranes on nanoridges imaged through TEM. Fig. S2 provides validation of valid CCP characteristics on nanoridge substrates as well as demonstrating the shape of 1,000-nm nanoridges. Fig. S3 provides validation of AP2 and FCHo1/2 knockdown as well as measurement of membrane diameter through TEM after siRNA treatment. Fig. S4 provides validation of clathrin knockdown, including quantification of clathrin heavy chain IF. Fig. S5 provides validation of osmotic shock/CK666 treatments. Table S1 summarizes statistical tests used in this study.
Supplementary Material
summarizes statistical tests used in this study.
Acknowledgments
We gratefully acknowledge Danielle Jorgens, Reena Zalpuri, and Guangwei Min of the University of California Berkeley Electron Microscopy Lab for assistance in TEM and scanning EM imaging. We also thank Stefano Cabrini, Scott Dhuey, Giuessepe Calafiore, and Stefano Dallorto of the Lawrence Berkeley Lab Molecular Foundry for assistance in silicon mold EBL/etching and Ormocomp substrate manufacturing, and Paul Lum of the UC Berkeley Biomolecular Nanotechnology Center for assistance in Ormocomp lithography. We thank James Hurley and Leanna Owen of UC Berkeley and Ross Pedersen of the Carnegie Institute for comments on the manuscript. We thank Yale Goldman for advice on how to assess the effect of nanoridges on the evanescent TIRF field. We thank Paul Marchando for assistance in cell line maintenance and substrate manufacturing.
Spinning-disk confocal imaging was conducted at the CRL Molecular Imaging Center, supported by the Gordon and Betty Moore Foundation. Work at the Molecular Foundry was supported by the Office of Science, Office of Basic Energy Sciences, of the U.S. Department of Energy under contract no. DE-AC02-05CH11231. The study was also supported by National Institutes of Health grant R35GM118149 (D.G. Drubin).
The authors declare no competing financial interests.
Author contributions: Experiments were conceptualized by R.C. Cail and D.G. Drubin, and investigation was carried out by R.C. Cail in the lab of D.G. Drubin. Software was developed by C.R. Shirazinejad. Data analysis and visualization were done by R.C. Cail and C.R. Shirazinejad. R.C. Cail and D.G. Drubin wrote the manuscript; all authors contributed to review and editing. Funding acquisition was done by D.G. Drubin.
References
- Aghamohammadzadeh, S., and Ayscough K.R.. 2009. Differential requirements for actin during yeast and mammalian endocytosis. Nat. Cell Biol. 11:1039–1042. 10.1038/ncb1918 [DOI] [PMC free article] [PubMed] [Google Scholar]
- Aguet, F., Antonescu C.N., Mettlen M., Schmid S.L., and Danuser G.. 2013. Advances in analysis of low signal-to-noise images link dynamin and AP2 to the functions of an endocytic checkpoint. Dev. Cell. 26:279–291. 10.1016/j.devcel.2013.06.019 [DOI] [PMC free article] [PubMed] [Google Scholar]
- Avinoam, O., Schorb M., Beese C.J., Briggs J.A.G., and Kaksonen M.. 2015. ENDOCYTOSIS. Endocytic sites mature by continuous bending and remodeling of the clathrin coat. Science. 348:1369–1372. 10.1126/science.aaa9555 [DOI] [PubMed] [Google Scholar]
- Bender, M., Otto M., Hadam B., Spangenberg B., and Kurz H.. 2002. Multiple imprinting in UV-based nanoimprint lithography: Related material issues. Microelectron. Eng. 61–62:407–413. 10.1016/S0167-9317(02)00470-7 [DOI] [Google Scholar]
- Boulant, S., Kural C., Zeeh J.C., Ubelmann F., and Kirchhausen T.. 2011. Actin dynamics counteract membrane tension during clathrin-mediated endocytosis. Nat. Cell Biol. 13:1124–1131. 10.1038/ncb2307 [DOI] [PMC free article] [PubMed] [Google Scholar]
- Burckhardt, C., Minna J., and Danuser G.. 2021. SH3BP4 promotes neuropilin-1 and α5-integrin endocytosis and is inhibited by Akt. Developmental Cell. 56:1164–1181. 10.1016/J.DEVCEL.2021.03.009 [DOI] [PMC free article] [PubMed] [Google Scholar]
- Busch, D.J., Houser J.R., Hayden C.C., Sherman M.B., Lafer E.M., and Stachowiak J.C.. 2015. Intrinsically disordered proteins drive membrane curvature. Nat. Commun. 6:7875. 10.1038/ncomms8875 [DOI] [PMC free article] [PubMed] [Google Scholar]
- Chen, C.S., Mrksich M., Huang S., Whitesides G.M., and Ingber D.E.. 1997. Geometric control of cell life and death. Science. 276:1425–1428. 10.1126/science.276.5317.1425 [DOI] [PubMed] [Google Scholar]
- Cocucci, E., Aguet F., Boulant S., and Kirchhausen T.. 2012. The First Five Seconds in the Life of a Clathrin-Coated Pit. Cell. 150:495–507. 10.1016/j.cell.2012.05.047 [DOI] [PMC free article] [PubMed] [Google Scholar]
- Daboussi, L., Costaguta G., and Payne G.S.. 2012. Phosphoinositide-mediated clathrin adaptor progression at the trans-Golgi network. Nat. Cell Biol. 14:239–248. 10.1038/ncb2427 [DOI] [PMC free article] [PubMed] [Google Scholar]
- Dannhauser, P., and Ungewickell E.. 2012. Reconstitution of clathrin-coated bud and vesicle formation with minimal components. Nature Cell Biology. 14:634–639. 10.1038/ncb2478 [DOI] [PubMed] [Google Scholar]
- Daste, F., Walrant A., Holst M.R., Gadsby J.R., Mason J., Lee J.E., Brook D., Mettlen M., Larsson E., Lee S.F., et al. 2017. Control of actin polymerization via the coincidence of phosphoinositides and high membrane curvature. J. Cell Biol. 216:3745–3765. 10.1083/jcb.201704061 [DOI] [PMC free article] [PubMed] [Google Scholar]
- Doyon, J.B., Zeitler B., Cheng J., Cheng A.T., Cherone J.M., Santiago Y., Lee A.H., Vo T.D., Doyon Y., Miller J.C., et al. 2011. Rapid and efficient clathrin-mediated endocytosis revealed in genome-edited mammalian cells. Nat. Cell Biol. 13:331–337. 10.1038/ncb2175 [DOI] [PMC free article] [PubMed] [Google Scholar]
- Ehrlich, M., Boll W., Van Oijen A., Hariharan R., Chandran K., Nibert M.L., and Kirchhausen T.. 2004. Endocytosis by random initiation and stabilization of clathrin-coated pits. Cell. 118:591–605. 10.1016/j.cell.2004.08.017 [DOI] [PubMed] [Google Scholar]
- Elkhatib, N., Bresteau E., Baschieri F., Rioja A.L., Van Niel G., Vassilopoulos S., and Montagnac G.. 2017. Tubular clathrin/AP-2 lattices pinch collagen fibers to support 3D cell migration. Science. 356:eaal4713. 10.1126/science.aal4713 [DOI] [PubMed] [Google Scholar]
- Engqvist-Goldstein, A.E., Warren R.A., Kessels M.M., Keen J.H., Heuser J., and Drubin D.G.. 2001. The actin-binding protein Hip1R associates with clathrin during early stages of endocytosis and promotes clathrin assembly in vitro. J. Cell Biol. 154:1209–1223. 10.1083/jcb.200106089 [DOI] [PMC free article] [PubMed] [Google Scholar]
- Ezratty, E.J., Bertaux C., Marcantonio E.E., and Gundersen G.G.. 2009. Clathrin mediates integrin endocytosis for focal adhesion disassembly in migrating cells. J. Cell Biol. 187:733–747. 10.1083/jcb.200904054 [DOI] [PMC free article] [PubMed] [Google Scholar]
- Fischer, P.B., and Chou S.Y.. 1992. Sub-50 nm high aspect-ratio silicon pillars, ridges and trenches fabricated using ultra-high E-beam lithography and RIE. International Conference on Solid State Devices and Materials. 443–445 pp. 10.7567/ssdm.1992.pd3-8 [DOI] [Google Scholar]
- Ford, M.G.J., Mills I.G., Peter B.J., Vallis Y., Praefcke G.J.K., Evans P.R., and McMahon H.T.. 2002. Curvature of clathrin-coated pits driven by epsin. Nature. 419:361–366. 10.1038/nature01020 [DOI] [PubMed] [Google Scholar]
- Grassart, A., Cheng A.T., Hong S.H., Zhang F., Zenzer N., Feng Y., Briner D.M., Davis G.D., Malkov D., and Drubin D.G.. 2014. Actin and dynamin2 dynamics and interplay during clathrin-mediated endocytosis. J. Cell Biol. 205:721–735. 10.1083/jcb.201403041 [DOI] [PMC free article] [PubMed] [Google Scholar]
- Gissibl, T., Wagner S., Sykora J., Schmid M., and Giessen H.. 2017. Refractive index measurements of photo-resists for three-dimensional direct laser writing. Opt. Mater. Express. 7:2293. 10.1364/ome.7.002293 [DOI] [Google Scholar]
- Gell, C., Berndt M., Enderlein J., and Diez S.. 2009. TIRF microscopy evanescent field calibration using tilted fluorescent microtubules. J. Microsc. 234:38–46. 10.1111/J.1365-2818.2009.03147.X [DOI] [PubMed] [Google Scholar]
- Grove, J., Metcalf D.J., Knight A.E., Wavre-Shapton S.T., Sun T., Protonotarios E.D., Griffin L.D., Lippincott-Schwartz J., and Marsh M.. 2014. Flat clathrin lattices: Stable features of the plasma membrane. Mol. Biol. Cell. 25:3581–3594. 10.1091/mbc.E14-06-1154 [DOI] [PMC free article] [PubMed] [Google Scholar]
- Hassinger, J.E., Oster G., Drubin D.G., and Rangamani P.. 2017. Design principles for robust vesiculation in clathrin-mediated endocytosis. Proc. Natl. Acad. Sci. USA. 114:E1118–E1127. 10.1073/pnas.1617705114 [DOI] [PMC free article] [PubMed] [Google Scholar]
- Henley, J.R., Krueger E.W., Oswald B.J., and McNiven M.A.. 1998. Dynamin-mediated internalization of caveolae. J. Cell Biol. 141:85–99. 10.1083/jcb.141.1.85 [DOI] [PMC free article] [PubMed] [Google Scholar]
- Heuser, J., and Evans L.. 1980. Three-dimensional visualization of coated vesicle formation in fibroblasts. J. Cell Biol. 84:560–583. 10.1083/jcb.84.3.560 [DOI] [PMC free article] [PubMed] [Google Scholar]
- Hinrichsen, L., Harborth J., Andrees L., Weber K., and Ungewickell E.J.. 2003. Effect of clathrin heavy chain- and alpha-adaptin-specific small inhibitory RNAs on endocytic accessory proteins and receptor trafficking in HeLa cells. J. Biol. Chem. 278:45160–45170. 10.1074/jbc.M307290200 [DOI] [PubMed] [Google Scholar]
- Hinrichsen, L., Meyerholz A., Groos S., and Ungewickell E.J.. 2006. Bending a membrane: How clathrin affects budding. Proc. Natl. Acad. Sci. USA. 103:8715–8720. 10.1073/pnas.0600312103 [DOI] [PMC free article] [PubMed] [Google Scholar]
- Hong, S.H., Cortesio C.L., and Drubin D.G.. 2015. Machine-learning-based analysis in genome-edited cells reveals the efficiency of clathrin-mediated endocytosis. Cell Rep. 12:2121–2130. 10.1016/j.celrep.2015.08.048 [DOI] [PMC free article] [PubMed] [Google Scholar]
- Jackson, L.P., Kelly B.T., McCoy A.J., Gaffry T., James L.C., Collins B.M., Höning S., Evans P.R., and Owen D.J.. 2010. A large-scale conformational change couples membrane recruitment to cargo binding in the AP2 clathrin adaptor complex. Cell. 141:1220–1229. 10.1016/j.cell.2010.05.006 [DOI] [PMC free article] [PubMed] [Google Scholar]
- Kaksonen, M., Toret C.P., and Drubin D.G.. 2006. Harnessing actin dynamics for clathrin-mediated endocytosis. Nat. Rev. Mol. Cell Biol. 7:404–414. 10.1038/nrm1940 [DOI] [PubMed] [Google Scholar]
- Kazazic, M., Bertelsen V., Pedersen K.W., Vuong T.T., Grandal M.V., Rødland M.S., Traub L.M., Stang E., and Madshus I.H.. 2009. Epsin 1 is involved in recruitment of ubiquitinated EGF receptors into clathrin-coated pits. Traffic. 10:235–245. 10.1111/j.1600-0854.2008.00858.x [DOI] [PubMed] [Google Scholar]
- Kelly, B.T., Graham S.C., Liska N., Dannhauser P.N., Höning S., Ungewickell E.J., and Owen D.J.. 2014. Clathrin adaptors. AP2 controls clathrin polymerization with a membrane-activated switch. Science. 345:459–463. 10.1126/science.1254836 [DOI] [PMC free article] [PubMed] [Google Scholar]
- Kovtun, O., Dickson V.K., Kelly B.T., Owen D.J., and Briggs J.A.G.. 2020. Architecture of the AP2/clathrin coat on the membranes of clathrin-coated vesicles. Sci. Adv. 6:8381–8403. 10.1126/sciadv.aba8381 [DOI] [PMC free article] [PubMed] [Google Scholar]
- Leyton-Puig, D., Isogai T., Argenzio E., Van Den Broek B., Klarenbeek J., Janssen H., Jalink K., and Innocenti M.. 2017. Flat clathrin lattices are dynamic actin-controlled hubs for clathrin-mediated endocytosis and signalling of specific receptors. Nat. Commun. 8:16068. 10.1038/ncomms16068 [DOI] [PMC free article] [PubMed] [Google Scholar]
- Liu, J., Sun Y., Drubin D.G., and Oster G.F.. 2009. The mechanochemistry of endocytosis. PLoS Biol. 7:e1000204. 10.1371/journal.pbio.1000204 [DOI] [PMC free article] [PubMed] [Google Scholar]
- Liu, Z., Tan J.L., Cohen D.M., Yang M.T., Sniadecki N.J., Ruiz S.A., Nelson C.M., and Chen C.S.. 2010. Mechanical tugging force regulates the size of cell-cell junctions. Proc. Natl. Acad. Sci. USA. 107:9944–9949. 10.1073/pnas.0914547107 [DOI] [PMC free article] [PubMed] [Google Scholar]
- Ma, L., Umasankar P., Wrobel A., Lymar A., McCoy A., Holkar S., Jha A., Pradhan-Sundd T., Watkins S., Owen D., et al. 2016. Transient Fcho1/2⋅Eps15/R⋅AP-2 Nanoclusters Prime the AP-2 Clathrin Adaptor for Cargo Binding. Developmental Cell. 37:428–443. 10.1016/j.devcel.2016.05.003 [DOI] [PMC free article] [PubMed] [Google Scholar]
- Mateu, M.G. 2012. Mechanical properties of viruses analyzed by atomic force microscopy: A virological perspective. Virus Res. 168:1–22. 10.1016/j.virusres.2012.06.008 [DOI] [PubMed] [Google Scholar]
- McMahon, H.T., and Boucrot E.. 2011. Molecular mechanism and physiological functions of clathrin-mediated endocytosis. Nat. Rev. Mol. Cell Biol. 12:517–533. 10.1038/nrm3151 [DOI] [PubMed] [Google Scholar]
- Merrifield, C.J., Feldman M.E., Wan L., and Almers W.. 2002. Imaging actin and dynamin recruitment during invagination of single clathrin-coated pits. Nat. Cell Biol. 4:691–698. 10.1038/ncb837 [DOI] [PubMed] [Google Scholar]
- Nolen, B.J., Tomasevic N., Russell A., Pierce D.W., Jia Z., McCormick C.D., Hartman J., Sakowicz R., and Pollard T.D.. 2009. Characterization of two classes of small molecule inhibitors of Arp2/3 complex. Nature. 460:1031–1034. 10.1038/nature08231 [DOI] [PMC free article] [PubMed] [Google Scholar]
- Pascolutti, R., Algisi V., Conte A., Raimondi A., Pasham M., Upadhyayula S., Gaudin R., Maritzen T., Barbieri E., Caldieri G., et al. 2019. Molecularly distinct clathrin-coated pits differentially impact EGFR fate and signaling. Cell Rep. 27:3049–3061.e6. 10.1016/j.celrep.2019.05.017 [DOI] [PMC free article] [PubMed] [Google Scholar]
- Paul, N.R., Jacquemet G., and Caswell P.T.. 2015. Endocytic trafficking of integrins in cell migration. Curr. Biol. 25:R1092–R1105. 10.1016/j.cub.2015.09.049 [DOI] [PubMed] [Google Scholar]
- Rothberg, K.G., Heuser J.E., Donzell W.C., Ying Y.S., Glenney J.R., and Anderson R.G.. 1992. Caveolin, a protein component of caveolae membrane coats. Cell. 68:673–682. 10.1016/0092-8674(92)90143-Z [DOI] [PubMed] [Google Scholar]
- Schafer, D.A., Weed S.A., Binns D., Karginov A.V., Parsons J.T., and Cooper J.A.. 2002. Dynamin2 and cortactin regulate actin assembly and filament organization. Curr. Biol. 12:1852–1857. 10.1016/S0960-9822(02)01228-9 [DOI] [PMC free article] [PubMed] [Google Scholar]
- Schmid, H., and Michel B.. 2000. Siloxane polymers for high-resolution, high-accuracy soft lithography. Macromolecules. 33:3042–3049. 10.1021/ma982034l [DOI] [Google Scholar]
- Sochacki, K.A., and Taraska J.W.. 2019. From flat to curved clathrin: Controlling a plastic ratchet. Trends Cell Biol. 29:241–256. 10.1016/j.tcb.2018.12.002 [DOI] [PubMed] [Google Scholar]
- Sochacki, K., Heine B., Haber G., Jimah J., Prasai B., Alfonzo-Mendez M., Roberts A., Somasundaram A., Hinshaw J., and Taraska J.. 2021. The structure and spontaneous curvature of clathrin lattices at the plasma membrane. Developmental Cell. 56:1131–1146. 10.1016/j.devcel.2021.03.017 [DOI] [PMC free article] [PubMed] [Google Scholar]
- Sokac, A.M., Co C., Taunton J., and Bement W.. 2003. Cdc42-dependent actin polymerization during compensatory endocytosis in Xenopus eggs. Nat. Cell Biol. 5:727–732. 10.1038/ncb1025 [DOI] [PubMed] [Google Scholar]
- Stachowiak, J.C., Hayden C.C., and Sasaki D.Y.. 2010. Steric confinement of proteins on lipid membranes can drive curvature and tubulation. Proc. Natl. Acad. Sci. USA. 107:7781–7786. 10.1073/pnas.0913306107 [DOI] [PMC free article] [PubMed] [Google Scholar]
- Stoorvogel, W., Oorschot V., and Geuze H.J.. 1996. A novel class of clathrin-coated vesicles budding from endosomes. J. Cell Biol. 132:21–33. 10.1083/jcb.132.1.21 [DOI] [PMC free article] [PubMed] [Google Scholar]
- Suleiman, H., Zhang L., Roth R., Heuser J.E., Miner J.H., Shaw A.S., and Dani A.. 2013. Nanoscale protein architecture of the kidney glomerular basement membrane. Elife. 2:e01149. 10.7554/eLife.01149 [DOI] [PMC free article] [PubMed] [Google Scholar]
- Tan, X., Luo M., and Liu A.P.. 2018. Clathrin-mediated endocytosis regulates fMLP-mediated neutrophil polarization. Heliyon. 4:e00819. 10.1016/j.heliyon.2018.e00819 [DOI] [PMC free article] [PubMed] [Google Scholar]
- Taylor, M.J., Perrais D., and Merrifield C.J.. 2011. A high precision survey of the molecular dynamics of mammalian clathrin-mediated endocytosis. PLoS Biol. 9:e1000604. 10.1371/journal.pbio.1000604 [DOI] [PMC free article] [PubMed] [Google Scholar]
- Tinevez, J.Y., Perry N., Schindelin J., Hoopes G.M., Reynolds G.D., Laplantine E., Bednarek S.Y., Shorte S.L., and Eliceiri K.W.. 2017. TrackMate: An open and extensible platform for single-particle tracking. Methods. 115:80–90. 10.1016/j.ymeth.2016.09.016 [DOI] [PubMed] [Google Scholar]
- Yarar, D., Waterman-Storer C., and Schmid S.. 2005. A Dynamic Actin Cytoskeleton Functions at Multiple Stages of Clathrin-mediated Endocytosis. Molecular Biology of the Cell. 16. 10.1091/mbc.e04-09-0774 [DOI] [PMC free article] [PubMed] [Google Scholar]
- Zeno, W.F., Baul U., Snead W.T., Degroot A.C.M., Wang L., Lafer E.M., Thirumalai D., and Stachowiak J.C.. 2018. Synergy between intrinsically disordered domains and structured proteins amplifies membrane curvature sensing. Nat. Commun. 9:4152. 10.1038/s41467-018-06532-3 [DOI] [PMC free article] [PubMed] [Google Scholar]
- Zeno, W.F., Hochfelder J.B., Thatte A.S., Wang L., Gadok A.K., Hayden C.C., Lafer E.M., and Stachowiak J.C.. 2021. Clathrin senses membrane curvature. Biophys. J. 120:818–828. 10.1016/J.BPJ.2020.12.035 [DOI] [PMC free article] [PubMed] [Google Scholar]
- Zhao, W., Hanson L., Lou H.Y., Akamatsu M., Chowdary P.D., Santoro F., Marks J.R., Grassart A., Drubin D.G., Cui Y., and Cui B.. 2017. Nanoscale manipulation of membrane curvature for probing endocytosis in live cells. Nat. Nanotechnol. 12:750–756. 10.1038/nnano.2017.98 [DOI] [PMC free article] [PubMed] [Google Scholar]
Associated Data
This section collects any data citations, data availability statements, or supplementary materials included in this article.
Supplementary Materials
summarizes statistical tests used in this study.


