

Abstract
Background:
The available evidence for positive associations between urban trees and human health is mixed, partly because the assessment of exposure to trees is often imprecise because of, for instance, exclusion of trees in private areas and the lack of three-dimensional (3D) exposure indicators (e.g., crown volume).
Objectives:
We aimed to quantify all trees and relevant 3D structural traits in Brussels (Belgium) and to investigate associations between the number of trees, tree traits, and sales of medication commonly prescribed for mood disorders and cardiovascular disease.
Methods:
We developed a workflow to automatically isolate all individual trees from airborne light detection and ranging (LiDAR) data collected in 2012. Trait data were subsequently extracted for 309,757 trees in 604 census tracts. We used the average annual age-standardized rate of medication sales in Brussels for the period 2006 to 2014, calculated from reimbursement information on medication prescribed to adults (19–64 years of age). The medication sales data were provided by sex at the census tract level. Generalized log-linear models were used to investigate associations between the number of trees, the crown volume, tree structural variation, and medication sales. Models were run separately for mood disorder and cardiovascular medication and for men and women. All models were adjusted for indicators of area-level socioeconomic status.
Results:
Single-factor models showed that higher stem densities and higher crown volumes are both associated with lower medication sales, but opposing associations emerged in multifactor models. Higher crown volume [an increase by one ] was associated with 34% lower mood disorder medication sales [women, (95% CI: , ); men, (95% CI: , )] and with 21–25% lower cardiovascular medication sales [women, (95% CI: , ); men, (95% CI: , )]. Conversely, a higher stem density (an increase by one ) was associated with 28–32% higher mood disorder medication sales [women, (95% CI: 0.284, 0.361); men, (95% CI: 0.243, 0.319)] and with 20–24% higher cardiovascular medication sales [women, (95% CI: 0.169, 0.236); men, (95% CI: 0.206, 0.273)].
Discussion:
We found a trade-off between the number of trees and the crown volumes of those trees for human health benefits in an urban environment. Our results demonstrate that conserving large trees in urban environments may not only support conservation of biodiversity but also human health. https://doi.org/10.1289/EHP9924
Introduction
Urban green spaces, and especially urban trees, have been associated with numerous human health benefits through a number of regulating and cultural ecosystem services (Aerts et al. 2021; Chen et al. 2019). Exposure to trees has been associated with better mental health (Marselle et al. 2020), improved respiratory health (Rao et al. 2014), lower rates of cardiovascular disease (Donovan et al. 2015; Knobel et al. 2021), lower odds of diabetes and hypertension (Astell-Burt and Feng 2019), lower odds of sleep disorders (Astell-Burt and Feng 2020a), improved health via improved physical activity (Ulmer et al. 2016), and decreased mortality (Barboza et al. 2021).
A recent scoping review of 18 studies on green space interventions and cortisol outcomes demonstrated the potential for a positive association between active and passive exposure to green space and stress reduction (Jones et al. 2021). For instance, in a study in 1,027 children included in the Dutch Prevention and Incidence of Asthma and Mite Allergy (PIAMA) birth cohort, residential exposure to green space in a buffer of 3,000 m, measured as average normalized difference vegetation index (NDVI; an indicator of greenness, computed as the difference between near-infrared and red reflectance divided by their sum) and total relative cover of green space, was associated with lower stress levels as indicated by larger diurnal decreases in saliva cortisol levels (Bloemsma et al. 2021). Psychological, physiological, and environmental stress relief may be the common mechanism behind the beneficial effects of trees and urban green space on various aspects of human health, in particular, stress-mediated conditions, such as cardiovascular disease and mental disorders (Honold et al. 2016; Lanki et al. 2017; Markevych et al. 2017; Nieuwenhuijsen et al. 2017; Zhang et al. 2021).
Trees may reduce heat stress, relieving the urban heat island effect, through leaf evapotranspiration and shading (Speak et al. 2020), and tree crowns may help to reduce stress caused by noise from traffic and other urban activities (Tashakor and Chamani 2021). Some reports suggest that trees with some species-specific traits may help to reduce air pollution by uptake and capture of air pollutants, thus helping reduce oxidative stress (Grote et al. 2016; Roy et al. 2012; Salmond et al. 2016). Therefore, tree crown volume can play a large role in the magnitude of stress relief, given that it indicates the area of ground that can be shaded and the total leaf area that determines the magnitude of leaf evaporation, transpiration, and interception (Kong et al. 2016; Lin and Lin 2010; Pretzsch et al. 2015; Rafiee et al. 2016; Shahidan et al. 2010; Speak et al. 2020; Yin et al. 2011).
Previous studies on the impacts of urban trees on human health have used satellite imagery derived greenness (NDVI), satellite imagery derived land use and land cover (LULC) maps (Aerts et al. 2020; Browning and Rigolon 2018; Dzhambov et al. 2018), inventories of street trees and trees in parks and other public spaces (Kardan et al. 2015; Marselle et al. 2020; Rugel et al. 2017; Taylor et al. 2015), or street photography (Helbich et al. 2019; Li and Ghosh 2018; Liu et al. 2020; Nguyen et al. 2018; Villeneuve et al. 2018) to quantify residential exposure to urban trees. These studies have found mixed effects of urban trees on human health, and this may be related to the varying quality of the exposure assessment. NDVI is not optimal to quantify exposure to trees because it does not differentiate trees from other vegetation efficiently. LULC maps such as the CLC (CORINE Land Cover) (EEA 2019) data set may have been too coarse (1:100,000), with small green spaces and individual trees masked in mixed or nongreen land use pixels (Aerts et al. 2020; Labib et al. 2020). Nevertheless, small green spaces and trees have been demonstrated to have significant associations with human health improvement (Wood et al. 2017), and therefore their omission may affect exposure–health outcome studies. Although more detailed LULC data (e.g., 1:2,000; Hooper et al. 2018) could be used to identify smaller greenspaces, some individual trees might still not be registered. Studies based on inventories of street trees and trees in other public spaces have excluded trees in private spaces (Marselle et al. 2020), and seasonality may have had a substantial impact on greenness derived from street photographs (Pelgrims et al. 2021). As a consequence, exposure to urban trees may have been underestimated or biased (e.g., misclassification between trees and other vegetation types) in these studies. In addition, most of the exposure indicators derived from different data sources were two-dimensional (2D) in their representations (e.g., tree canopy cover), whereas 3D representations (e.g., tree crown volume) remain less explored, possibly leading to inaccurate indication of associations between urban trees and human health (Jiang et al. 2017).
Airborne light detection and ranging (LiDAR) imagery, comprising a dense 3D point cloud with precise height information of the targets, has enabled more accurate isolation of urban trees from grass, shrubs, and other vegetation types and has been used in studies on the impacts of urban trees on human health (Jarvis et al. 2020; Reid et al. 2017; Ulmer et al. 2016). LiDAR also facilitates individual tree crown delineation by using existing segmentation algorithms, something that is critical for automatic inventory of tree density in all public and private areas (Alonzo et al. 2014; Kwong and Fung 2020). Individual tree crown delineation is also the basis for estimation of 3D tree traits such as height, crown base height, and crown volume using remote sensing. These tree traits, together with tree density, can provide a more comprehensive and reliable quantification of exposure to urban trees compared with 2D tree cover data (Zhao et al. 2021), but they have not been explored in previous studies on the impact of urban trees on human health.
Therefore, the first aim of this study was to use high-resolution airborne LiDAR data to improve the assessment of exposure to urban trees and a number of 3D traits related to their potential health effects. Second, we aimed to investigate the associations between reliable residential urban tree exposure and indicators of stress-related disease by analyzing sales data of medication commonly prescribed for cardiovascular disease and mood disorders.
Methods
Study Design and Population
The present study is part of the GRESP-HEALTH (Impact of green/blue spaces on specific morbidity and cause-specific mortality in Belgium) project (Casas et al. 2015), which is a nationwide ecological study on the association between residential exposure to green spaces and specific morbidity in Belgium. The present study focusses on the Brussels Capital Region (161 km2), the administrative region and urban agglomeration encompassing 19 municipalities, including the capital of Belgium, the City of Brussels (hereafter Brussels). Data in this study were analyzed at the census tract level. Census tracts are the official and the smallest administrative spatial units for statistical purposes at higher resolution than the municipality (“statistical sectors”), defined by the Belgian Statistical Office (Statbel). The total number of census tracts in Brussels is 722, with an average census tract surface area of 22.5 ha (; range: 1.4–754.6 ha) and an average of (; range: ) (Statbel 2021).
Medication Sales Data
This study used health care data from the Belgian social security agency InterMutualistisch Agentschap-L’Agence InterMutualiste (IMA-AIM). The IMA-AIM manages health care data collected by the seven Belgian health insurance funds. In Belgium, health insurance is mandatory and the population in the IMA-AIM database corresponds to about 98% of the Belgian population (as registered in the national register). The IMA-AIM provided data on reimbursed medication sales delivered by pharmacies for cardiovascular disease and mood disorders, both yearly, from 2006 to 2014. The data represented the number of adults (19–64 years of age) per census tract and per year for whom at least one refundable medication was prescribed at least once during the study period (“prescription–patients”). The data were provided by sex. General cardiovascular medication was defined as all reimbursed drugs included in the Anatomical Therapeutic Chemical (ATC; https://www.whocc.no/atc) codes B01A (antithrombotic agents), C01 (cardiac therapy, including cardiac glycosides, antiarrhythmics, cardiac stimulants, and vasodilators), C02 (antihypertensives), C03 (diuretics), C07 (beta blocking agents), C08 (calcium channel blockers), and C09 (agents acting on the renin–angiotensin system) (see also Aerts et al. 2020). Medication for mood disorders was defined as all reimbursed drugs included in the ATC codes N05 (psycholectics) and N06 (psychoanaleptics) (see also Aerts et al. 2022). The aggregated data did not contain information on the frequency of use. Census tracts with no more than five reimbursed persons or registered inhabitants in at least 1 y during the study period were excluded by the IMA-AIM because of privacy reasons (Figure 1). All health data were used under the license of the IMA-AIM. The protocol for this study did not require ethics approval or consent to participate.
Figure 1.

Flow diagram of the census tracts in Brussels, Belgium, included and excluded in the study. Note: ASMR, age-standardized medication sales ratio; , number of census tracts; , minimum number of reimbursements between 2006 and 2014 (at the level of the census tract, unstandardized); POP, population (number of inhabitants).
Exposure to Urban Trees
Lidar data collection and preprocessing.
Airborne LiDAR data, with an average point density of , were acquired in winter 2012 and provided by the Brussels Regional Informatics Center (CIRB; Degerickx et al. 2018). After removing noise points (i.e., isolated points) using LAStools (version 171215; Rapidlasso GmbH) software, a digital surface model (DSM) with a spatial resolution of was derived from the highest LiDAR point in each pixel. A canopy height model (CHM), further used for individual tree delineation, was generated using the difference between DSM and a digital terrain model (DTM; provided by the CIRB). The CHM was further smoothed (i.e., median filtering) to fill in small gaps. A normalized LiDAR point cloud, further used for estimation of tree structural traits, was obtained by calculating the height difference between the LiDAR point cloud and the DTM. The processing of the LiDAR data was conducted in OPALS software (version 2.4.0; Otepka et al. 2012).
Tree crown identification and delineation.
A workflow that included object-based classification, individual tree delineation, and screening incorrect trees was adapted from Degerickx et al. (2018) and Chi et al. (2020) to obtain individual tree crown polygons in the study area. In the object-based classification, a tree index image with a spatial resolution of was generated from the normalized LiDAR point cloud by calculating the height difference between the first and last return in each pixel (O’Neil-Dunne et al. 2014). This index is based on the fact that LiDAR pulses can penetrate tree crowns but not buildings, enabling the differentiation of tree objects from building objects. Objects with a tree index and a height (identified from the CHM) were initially labeled as trees. Individual tree delineation was then conducted on large tree objects using a watershed segmentation algorithm (Wang et al. 2004). The object-based classification and individual tree delineation was performed in eCognition (version 9.4; http://www.ecognition.com/).
The resulting tree crown polygons contained misclassified trees, such as building edges, that could have a high tree index value. Degerickx et al. (2018) used an NDVI image with a spatial resolution of to remove misclassified trees. However, because of a slight geometric mismatch between their NDVI image and LiDAR data, quite a number of nontree objects were still retained in the resulting individual tree crown data set. In addition to height information, LiDAR also provides intensity information that reflects the material characteristics of objects and which has been used for urban land cover classification (Zhou 2013). To find the threshold for the intensity that can differentiate trees from building edges, we randomly selected 2,000 tree crown polygons and 2,000 building edge polygons based on the CHM and calculated the average intensity value for the LiDAR points within each polygon. We found that 98% of selected tree crowns were retained and 84% of the selected building edges were removed when using an intensity threshold value of 250 digital numbers (DNs). By applying this threshold to all delineated trees in the 722 census tracts, 616,379 (76% of all the delineated trees) correctly delineated trees were identified and used for further analysis. The screening of incorrect trees was conducted in Python (version 3.8.5; Python).
A field-measured tree database, including street trees and trees in parks with the coordinates of tree stems, was used to assess the tree delineation accuracy. We randomly selected 2,000 trees from the database and the proportion of field-measured tree stems contained exactly in one delineated tree crown polygon was calculated.
Derivation of indicators of exposure to trees.
Tree height, crown base height, and crown volume were derived from the normalized LiDAR point cloud for each tree. Tree height (H) was defined as the height of the highest point in the tree point cloud. We developed an index () to estimate crown base height and extract crown points. The index was based on the fact that when a tree point cloud is sliced into bins with a same height (e.g., ) along the z-axis, bins from tree crowns contain more points than those from tree trunks. The index was thereby calculated as a quotient of the number of LiDAR points in a bin and the number of all points from the tree. We again relied on the 2,000 correctly delineated trees (see the section “Tree crown identification and delineation”) to determine the threshold for that separates crown points and noncrown points. First, LiDAR points with a height were extracted for the 2,000 trees. We assumed that these extracted points were from tree crowns. Next, for each of the 2,000 trees, the average for the extracted crown points () was calculated using . was the number of LiDAR points with a height and was the number of all LiDAR points. The threshold for that separates crown points and noncrown points was finally set as the mean for the 2,000 trees (mean ) and applied to all the 616,379 correctly delineated trees. Briefly, starting with the bin with the height of (excluding the lowest bin containing ground points), the height of the first bin with a was regarded as crown base height (). LiDAR points with a were labeled as crown points and used to calculate crown volume using a 3D convex hull algorithm in package scipy in Python (Figure 2). For each tree point cloud, the algorithm identifies the outmost points, which are then triangulated with Delaunay triangulation and meshed for surface generation. The LiDAR data used in the present study had a high point density and were able to record detailed crown structure in winter. Standard deviations (SDs) of H and , indicating the variation in tree structure, were also calculated because recent studies have suggested that human health may be associated with tree (structural) diversity (Aerts et al. 2018; Marselle et al. 2021).
Figure 2.

Estimation of tree crown volume using LiDAR data and 3D convex hull algorithm: (A) LiDAR points for a delineated tree and (B) the reconstructed tree crown surface. 3D convex hull algorithm identifies the outmost points (in black), which are triangulated with Delaunay triangulation and meshed for surface generation. Note: 3D, three dimensional; LiDAR, airborne light detection and ranging.
Potential Confounders
An earlier study in Belgium found that socioeconomic deprivation is a strong predictor for cardiovascular medication sales (Aerts et al. 2020), which was consistent with other studies that have reported that socioeconomic confounders may have a higher impact on (cardiovascular) health than exposure to urban green space (Kabisch 2019). Therefore, we included sociodemographic characteristics as potential confounders in the analyses. Sociodemographic data were provided by Statbel. Data were derived from the 2001 census. We included three indicators of socioeconomic status (SES) that are related to socioeconomic deprivation (as in Aerts et al. 2020): the percentage of foreign-born inhabitants from lower- and mid-income countries (LMICs; defined as those countries that did not belong to the World Bank classification of “high-income economies” in 2000), the percentage of unemployed inhabitants (employment deprivation), and the percentage of primary educated or lower among the 25- to 64-year-old inhabitants (education skills and training deprivation). Census tracts with missing SES data (i.e., not provided by Statbel) were not included in the analyses (91 census tracts) (Figure 1).
Statistical Analyses
Age-standardization of the medication sales data was essential to produce comparable measures of prescription behavior because the number of prescriptions in a given area depends on the age structure of the area (Aerts et al. 2020, 2022). The number of observed prescription–patients in an area was divided by the expected number of prescription–patients in that area if the prescription behavior were the same as that of the overall Belgian population, taking into account the age- and sex-specific structure of the area. This standard medication sales ratio was then adjusted with the crude rate of prescriptions (Aerts et al. 2020, 2022). The age-standardized medication sales were expressed as the number of reimbursed prescription–patients per 1,000 inhabitants (as a positive integer). We used the mean annual rate of medication sales for the period 2006 to 2014 as the outcome variable (the overall mean for exploratory analyses, and for women and men and for both medication types separately for our detailed analyses).
Preliminary analyses demonstrated that the privacy-restricted census tracts ( reimbursed persons in at least 1 y) had considerably higher tree crown volumes () than the initially included census tracts (included tracts: vs. privacy-restricted tracts: ; independent samples -test , ). To avoid the introduction of sampling bias by excluding census tracts with few medication sales and high exposure to urban trees, we assigned 40 prescriptions/1,000 inhabitants per year to privacy-restricted census tracts with inhabitants (120 census tracts with a total of inhabitants). Census tracts without inhabitants (among others, forests, parks, railway infrastructure, cemeteries, and industrial areas without inhabitants) were excluded from the analysis (27 census tracts) (Figure 1). The value assigned to restricted tracts with inhabitants was close to the threshold value for privacy restriction given that the lowest age-standardized medication sales ratio (ASMR) reported in the IMA data of medication for cardiovascular disease and mood disorders was 42 prescriptions/1,000 inhabitants per year. If the true rate of prescriptions would have been higher, these census tracts would not have been privacy restricted. The assigned value was thus an estimation of the maximum rate that could have been observed in the restricted tracts, and this approach is therefore conservative.
Generalized linear models based on the Poisson distribution with a log-link function were used to investigate the associations between exposure to urban trees and medication sales. First, we explored single-factor models with the overall average medication sales (both medication types for men and women pooled) as dependent data and stem density and crown volume separately as independent variables. Then we obtained estimates for a two-factor model (crown volume and tree density in the same model) and for a SES-adjusted model for the overall average medication sales. In our main models, all tree exposure variables (i.e., stem density, crown volume, and structural variation) were included in the same model along with the SES factors, but separately for men and women and medication types. Models were fit for men and women independently because medication sales for men and women at the level of the census tract were separate response variables (see also Aerts et al. 2022). Because the medication sales data were aggregated at the census tract level and there was no information on subject-level medication use, we were not able to study combined medication sales. The number of included census tracts was 604 (Figure 1). Because SES variables have consistently been found to be significant in explaining associations between green space and human health in our study area (Aerts et al. 2020; Pelgrims et al. 2021; Trabelsi et al. 2019), only fully adjusted models (i.e., all SES variables included in the same model) were evaluated for our main models. Tree density and tree crown volume were entered as increments in interquartile ranges (IQRs) to obtain comparable parameter estimates. In addition to the main models, we also calculated estimates stratified by population density and SES factors, using for each stratification variable the median as the threshold for creating the strata. Statistical analyses were performed with IBM SPSS Statistics Subscription (version 11-2018) software.
Results
Census Tract Characteristics
The characteristics of the census tracts that were included in the study are presented in Table 1. Average percentages of foreign-born inhabitants from LMICs (%LMIC), unemployed inhabitants (%Unemployed), and primary-educated-or-lower inhabitants (%Low education) were 16.3, 19.7, and 16.5, respectively.
Table 1.
Characteristics of the census tracts in Brussels, Belgium, included in the study () stratified by quartiles of crown volume ().
| Categories | Characteristics | All census tracts | Tree crown volume quartile () | ||||
|---|---|---|---|---|---|---|---|
| Range | (Q1: 0–0.47) | (Q2: 0.48–0.89) | (Q3: 0.90–1.63) | (Q4: 1.64–5.65) | |||
| SES | %LMIC | 2.4–48.9 | |||||
| %Unemployed | 4.4–56.3 | ||||||
| %Low education | 1.0–48.9 | ||||||
| Treesa | Trees | 5–14,227 | |||||
| Trees | 0–91 | ||||||
| Crown volume () | 0–5.6 | ||||||
| Height variation (SD) | 1.4–10.7 | ||||||
| Crown base height variation (SD) | 0.6–10.2 | ||||||
| ASMRb | Mood disorders, women | 40–221 | |||||
| Mood disorders, men | 40–241 | ||||||
| Cardiovascular disease, women | 40–349 | ||||||
| Cardiovascular disease, men | 40–334 | ||||||
Note: %LMIC, percentage foreign-born inhabitants from low- and middle-income countries; %Low education, percentage primary-educated-or-lower inhabitants; %Unemployed, percentage unemployed inhabitants; ASMR, age-standardized medication sales rate (prescriptions per 1,000 inhabitants); LiDAR, airborne light detection and ranging; Q, quartile; SD, standard deviation; SES, socioeconomic status.
The tree characteristics were derived from the 2012 winter airborne LiDAR data.
The ASMR data were collected between 2006 and 2014.
The accuracy of individual crown delineation was high: 91% of the delineated tree crown polygons contained a single tree stem, indicating a good agreement (Figure 3). In the 604 census tracts, 309,757 trees were included for the analysis. The average number of trees was 513 in total and 24/ha (IQR: 21.8) and the average crown volume was /ha (IQR: 1.4). Variation for tree height (expressed by SD) averaged and for crown base height . The geographical distribution of the number of trees and crown volume are presented in Figures S1 and S2, with the lowest numbers and the smallest volumes (lower 10 percentile values being 8 trees and /ha, respectively) found in the city center and along the canal and railway zone that bisects the city from northeast to southwest. The highest densities (85–142/ha) and crown volumes (/ha) were recorded in Sonien Forest along the southern edge of the region, but these census tracts are uninhabited and did not contribute to our models. The highest densities and crown volumes of inhabited census tracts were found along the perimeter of the study area (upper 10 percentile values being 50 trees and /ha, respectively).
Figure 3.
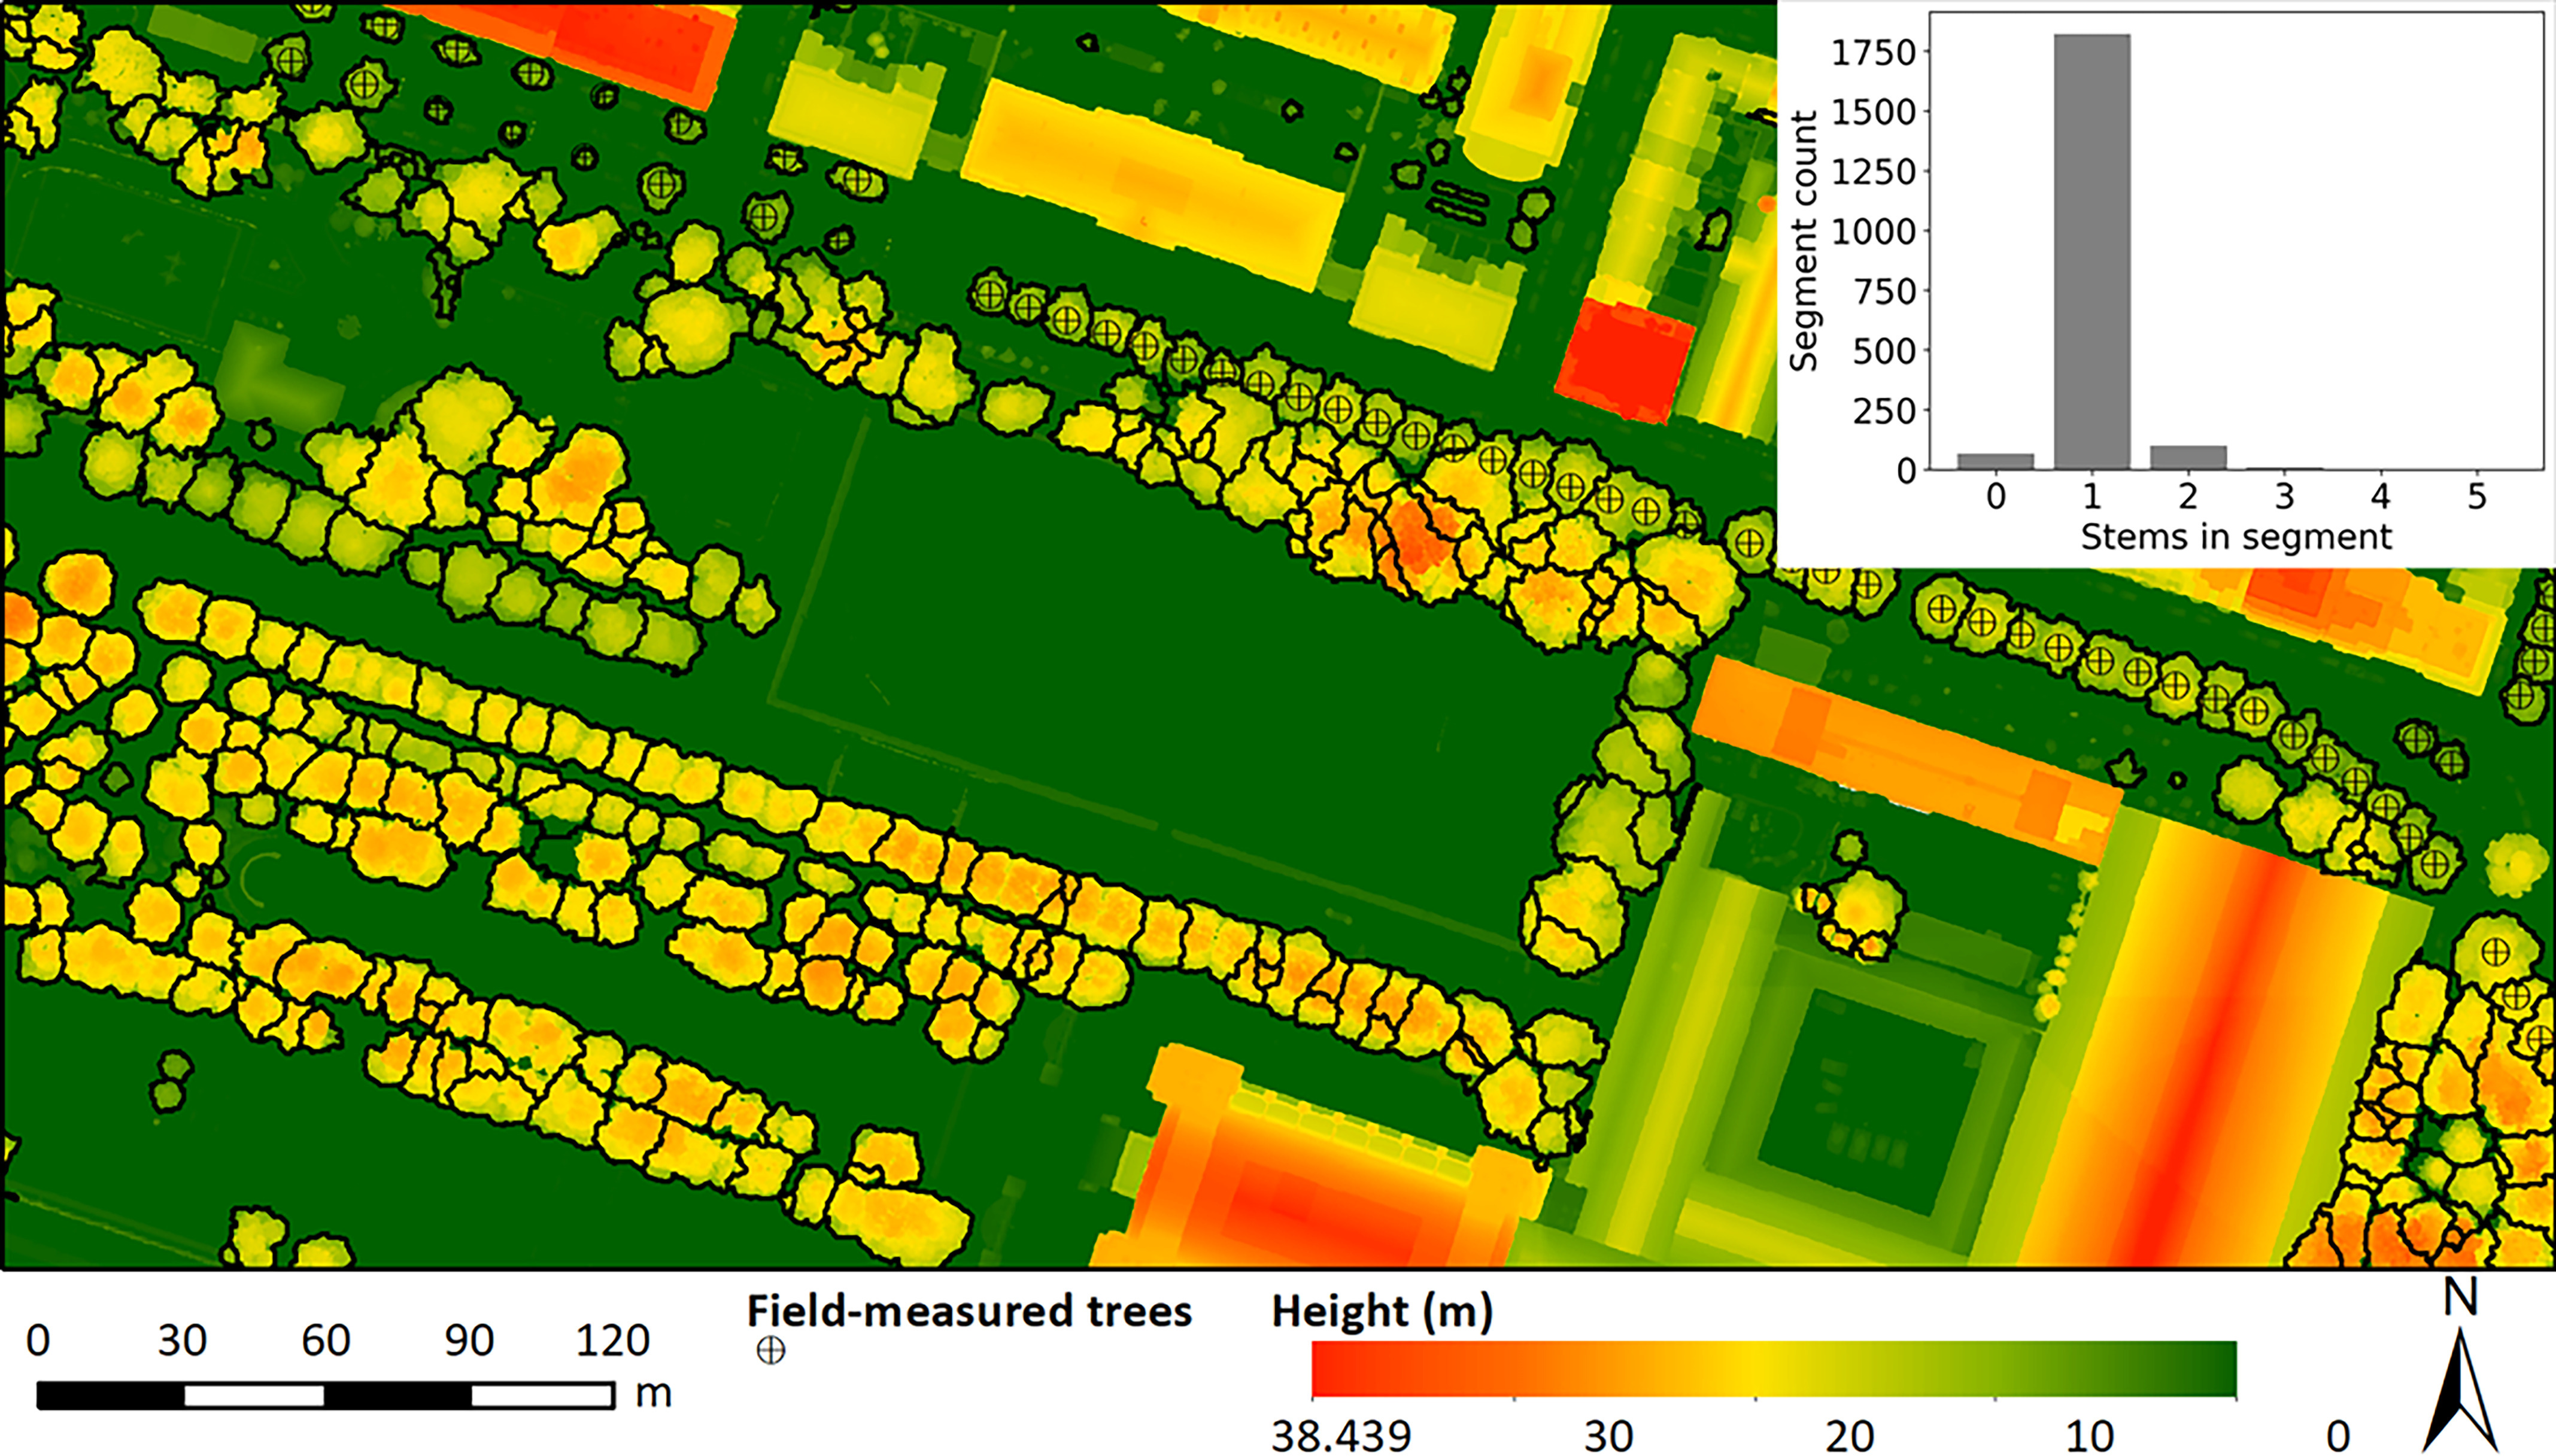
Subset of individual tree delineation results and LiDAR canopy height model and accuracy of individual tree segmentation. Note: LiDAR, airborne light detection and ranging.
Average medication sales for mood disorders were 118 sales/1,000 inhabitants for women and 122 for men. For cardiovascular medication, average sales were 160 /1,000 inhabitants for women and 151 for men. The geographical distribution of the medication sales for mood disorders and cardiovascular disease are presented in Figures S3–S6.
Associations between Urban Trees and Health
In unadjusted, single-factor models, both tree density and crown volume were associated with lower overall average medication sales. Higher tree density (an increase by one IQR of 21.8 trees/ha) was associated with 12.9% lower overall average medication sales [() and 95% confidence interval (CI): , )] and higher canopy volume (an increase by one ) with 16.3% lower overall average medication sales [ (95% CI: , )]. Higher tree densities were strongly correlated to higher crown volumes (Pearson , ). In a two-factor model for overall mean medication sales, higher crown volume was associated with lower medication sales [ (95% CI: , )] and higher tree density with higher medication sales [ (95% CI: 0.351, 0.408)]. These contrasting associations were conserved after adjusting for SES: higher crown volume (an increase by one ) was associated with 27.7% lower medication sales [ (95% CI: , )] and higher tree density (an increase by one ) with 26.3% higher medication sales [ (95% CI: 0.228, 0.298)].
The results of the detailed models for both medication types and sex groups separately are presented in Figure 4, and the parameter estimates for these associations are presented in Table S1 for mood disorder medication and in Table S2 for cardiovascular medication. Higher canopy volume (an increase by one ) was associated with 34% lower mood disorder medication sales [women, (95% CI: , ); men, (95% CI: , )] and with 21–25% lower cardiovascular medication sales [women, (95% CI: , ); men, (, )]. Conversely, higher stem density (an increase by one ) was associated with 28–32% higher mood disorder medication sales [women, (95% CI: 0.284, 0.361); men, (95% CI: 0.243, 0.319)] and with 20–24% higher cardiovascular medication sales [women, (95% CI: 0.169, 0.236); men, (0.206, 0.274)]. In addition, we found consistent but weak associations of crown structural variation (SD of crown base height) with medication sales for both medication and sex groups. For tree height variation, the associations were inverse but weak for all groups except for mood disorder medication sales among women, where no association was detected. Apart from minor variations in the magnitudes of the associations, no differences between men and women were found in the associations between tree exposure and medication sales.
Figure 4.
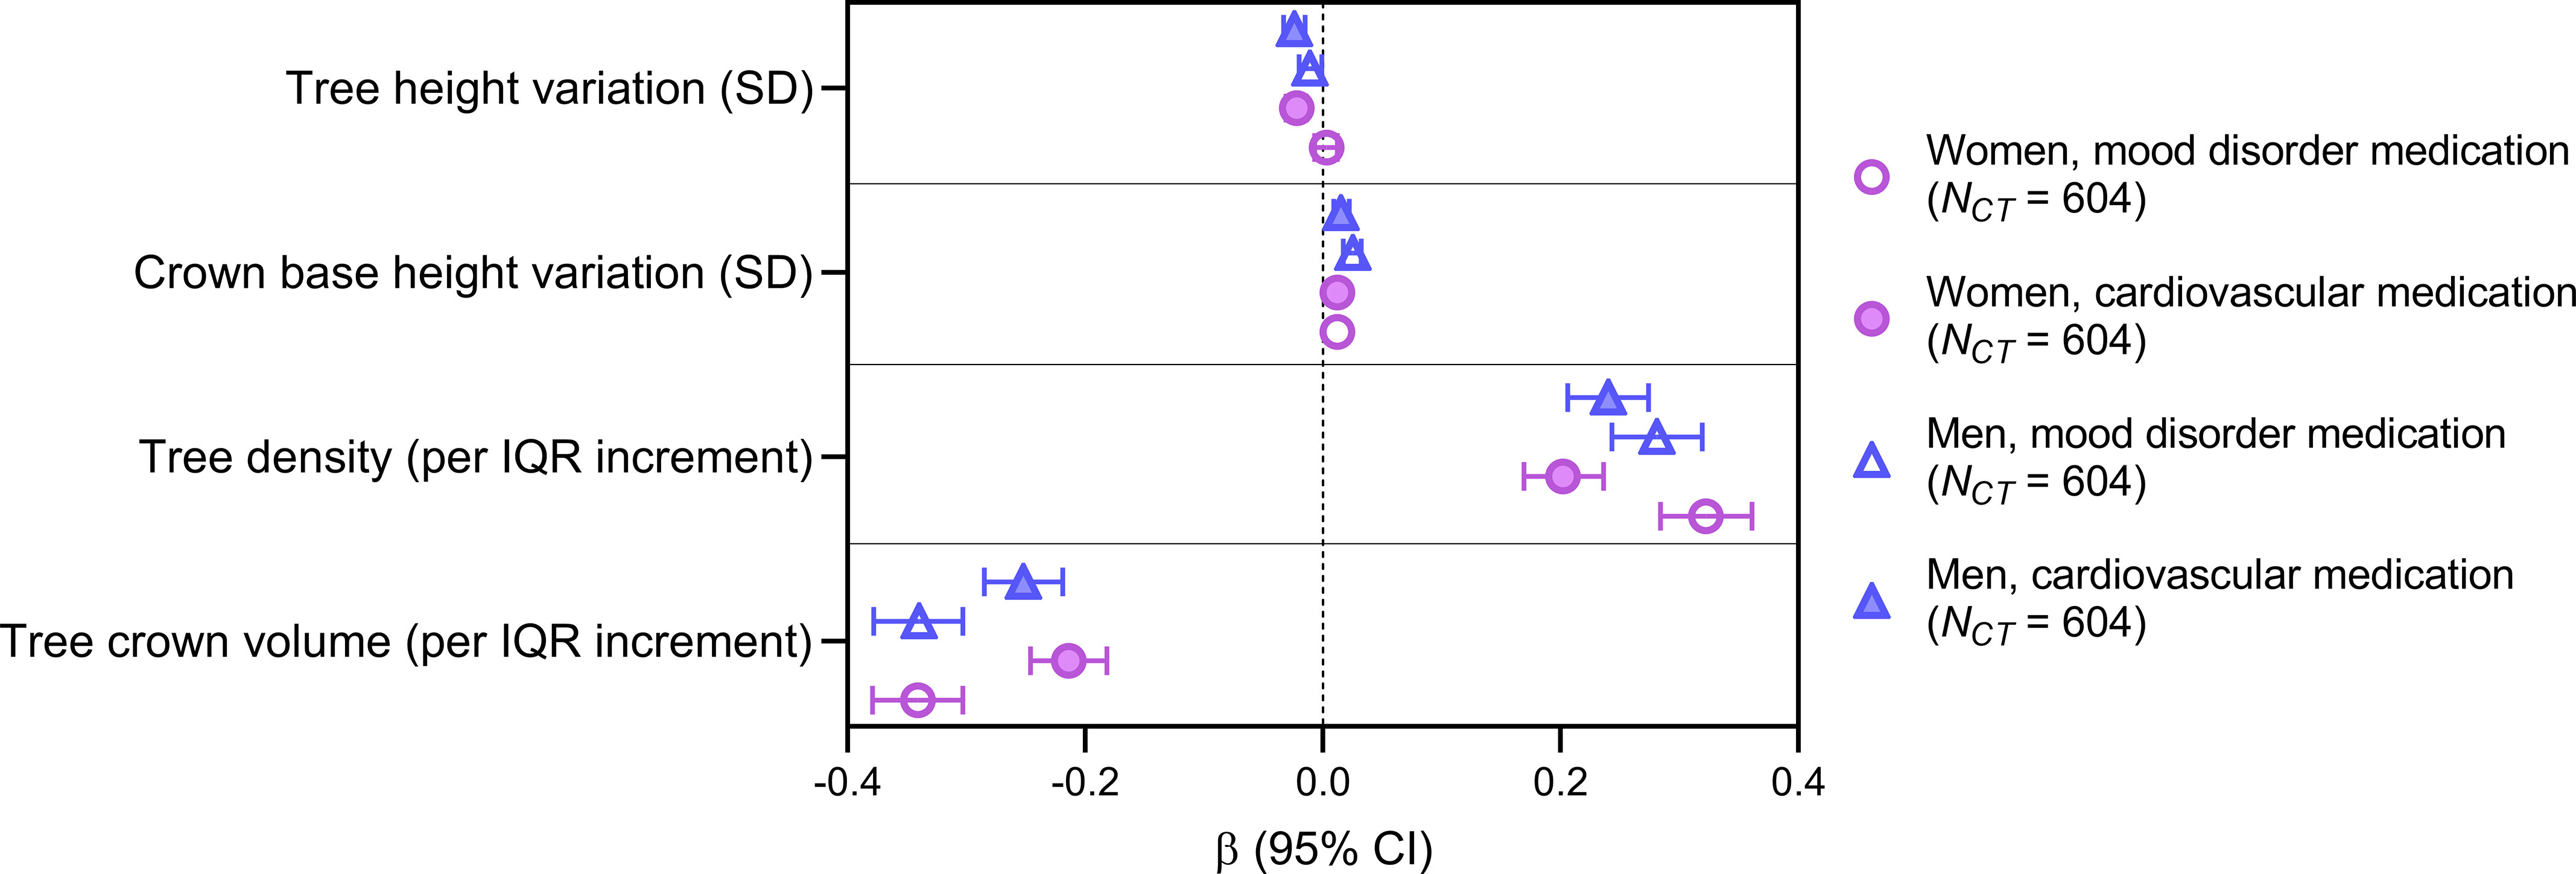
Associations between the number of trees, tree traits, and annual sales of medication commonly prescribed for cardiovascular disease and mood disorders in adults 19–64 years of age in Brussels, Belgium, at the level of census tracts (CTs, ). Parameter estimates and 95% confidence intervals (CIs) are from generalized log-linear models for age-standardized rates of medication sales in Brussels for the years 2006 to 2014. Models were adjusted for socioeconomic status at census tract level (percentage immigrants from low- and middle-income countries, percentage unemployed inhabitants, percentage inhabitants with only primary education).
In all stratified models, the associations of tree density and crown volume with medication sales were conserved (Tables S3–S6). In the analyses stratified by population density, the positive associations with stem density and the negative associations with crown volumes were stronger in less densely populated census tracts (), both for mood disorder and cardiovascular medication sales (Table S3). In the analyses stratified by unemployment and low education, associations were stronger in census tracts with low SES (, ) for mood disorder medication; for cardiovascular medication, associations were stronger in census tracts with high SES (, ) (Tables S4 and S5). In the analyses stratified by the proportion of inhabitants from LMIC, the estimates were comparable to those of the main models (Table S6).
Discussion
Main Findings
We investigated the association of sales of medication commonly prescribed for cardiovascular disease and mood disorders in Brussels, Belgium, with residential exposure to urban trees, adjusting for SES. Single-factor models using aggregated medication sales and exposure data showed that higher stem densities and higher crown volumes are both associated with lower medication sales. However, results from models that simultaneously included crown volume and tree density suggest that living in areas with high crown volumes and low stem densities may be more beneficial to adult cardiovascular health and mood disorders than living in areas with a higher amount of trees with smaller crowns.
Comparison with Other Studies
Previous studies using LULC data or street photography-derived tree canopy cover or inventory of street trees have found associations between urban trees and better cardiovascular and mental health (Akpinar et al. 2016; Astell-Burt and Feng 2019, 2020b; Donovan et al. 2013; Dzhambov et al. 2019; Egorov et al. 2020; Wang et al. 2020). Our findings that larger crown volumes were associated with lower mood disorder and cardiovascular medication sales are consistent with these earlier studies. Other studies, however, did not report such associations (Browning and Rigolon 2018; Jarvis et al. 2020). In addition, two earlier studies conducted in Brussels did not observe the expected benefits of tree/green space exposure on cardiovascular and mental health. Using the CORINE Land Cover data set and medication sales data, Aerts et al. (2020) observed an inverse association between reimbursed cardiovascular medication sales and tree/forest cover at the levels of census tracts in the entire country ( census tracts) but not in a separate model for Brussels ( census tracts), most likely because the resolution of the land cover data set was too coarse to adequately capture green space exposure in the heavily urbanized region of Brussels. In their study on the impacts of urban greenness on self-reported mental health ( participants) in Brussels, Pelgrims et al. (2021) quantified three more detailed indicators of urban greenness exposure: a) vegetation coverage derived from Google Street View panorama at the residence level; b) street tree density and vegetation cover ( on each side) from inventory data sets at the street level; and c) NDVI values at the neighborhood level. However, only street tree density was found to be inversely associated with sleeping disorders, whereas other urban green exposure indicators were not associated with any of the investigated mental health indicators. The individual trees in private areas, such as backyards and gardens, are most likely to be regularly experienced by urban residents (Cox et al. 2019) but are hard to represent in LULC maps in densely built zones where buildings still dominate the landscape as seen from 2D imagery (Becker et al. 2019). Moreover, the 2D tree cover derived from the LULC maps and street photography are less comprehensive for the actual exposure to trees than 3D indicators (Jiang et al. 2017). The lack of the associations in these two studies may thus be caused by the coarse representations of exposure to urban trees/green spaces, inadequately capturing numerous small green spaces and individual trees that are present in the study area and providing inaccurate information on tree dimensions. By identifying all trees in the study area and estimating crown volumes, our study improved the quantification of tree exposure and was able to observe health benefits of trees.
However, in two-factor models that included both crown volume and tree density, tree density was positively associated with medication sales. This is in contradiction with earlier observed associations between tree density per linear kilometer of street and antidepressant prescription rates reported by Taylor et al. (2015) and between street tree density within around the home and antidepressant prescriptions reported by Marselle et al. (2020). In addition, the indicators of structural variation in the present study show inconsistent associations with medication sales (Figure 4; Tables S1 and S2). Although the importance of tree diversity to human health is increasingly recognized, the findings on the associations between tree diversity and human health/well-being are still mixed (Aerts et al. 2018; Methorst et al. 2021; Sandifer et al. 2015). By including tree density, tree structural diversity indicators, and crown volume in the same model, our results reveal that there may be trade-offs between several tree traits with respect to their impact on human health. Our results suggest that larger crown volumes concentrated in fewer stems may be more beneficial for cardiovascular and mental health than similar crown volumes divided over more stems, despite the strong association between stem density and total crown volume. Large and well-developed crowns are one of the key attributes that distinguish large, old trees from young trees (Lindenmayer and Laurance 2017). The beneficial stress-reducing effects of large trees may be enhanced by psychological pathways toward restoration, including restoration of attention (Collins et al. 2020; Marselle et al. 2020; Taylor et al. 2015). In a study on the restorative effects of different forests, participants experienced significantly higher restorative effects when visiting old-growth and mature commercial forests than when visiting urban recreation and young commercial forests (Simkin et al. 2020). In urban environments, large trees may therefore help to reduce stress-related conditions, such as mood disorders and cardiovascular disease by, for instance, contributing more to indirect nature experiences than smaller trees (Cox et al. 2019) or by providing keystone habitat for birds (Le Roux et al. 2014; Pena et al. 2017; Stagoll et al. 2012), which in turn improve well-being via bird sightings and sounds (Buxton et al. 2021).
Strengths and Limitations
A major strength of this study is that we have retrieved 3D tree characteristics (most importantly, accurate tree crown volumes) for all the trees in the study area using very precise remote sensing–based data to determine accurate residential exposure to urban trees, which is a major improvement compared with previous research (e.g., Egorov et al. 2020; Marselle et al. 2020; Wang et al. 2020). The present study is also, to our knowledge, the first to specifically demonstrate health benefits of large trees in urban environments, indicated by the associations between crown volumes, stem densities, and medication sales data. This is of global conservation importance, because large, old trees in urban environments are expected to decline globally under current management practices (Le Roux et al. 2014). Nevertheless, our research may have a number of limitations.
The ecological study design is prone to ecological fallacy. Health effects of green space observed at the aggregated (census tract) level may not be observed at the individual level (Bixby et al. 2015; Mitchell et al. 2011; Richardson et al. 2012). Besides exposure to trees and SES (included as confounders in our models), other factors such as age, chronic conditions, and changes in prescription over time could also be strong predictors of medication sales (Webster 2007). The observed associations between exposure to trees and medication sales may be mediated by intergroup variations in age structure and incidence of chronic diseases, leading to inconsistent associations observed at the aggregated level and at the individual level. However, by using census tracts as the level of aggregation, we believe these intergroup variations have been minimized.
In addition, there may be a mismatch between the timing of exposure and medication use because of, for instance, seasonality. Seasonality of urban green has been recognized to affect participation in recreational physical activities (Villeneuve et al. 2018) and this may result in seasonal variations in associations between exposure to trees, human health, and therefore medication sales. We were not able to analyze the associations by season because information on the timing of medication use was not available in our data set and because our assessment of exposure to trees did not take into account potential seasonal variations in tree crown volumes. Future research might explore how the frequency and the timing of medication use would affect the tree–health associations.
The exposure measurements may contain uncertainties. Residential exposure to green space may differ from true exposure because it ignores dynamic time–activity patterns that include home time, school or working hours, recreation, and time in traffic and which may significantly impact health outcomes (Stas et al. 2021). The imperfect temporal match between the LiDAR data (2012) and medication sales data (2006–2014) may also lead to exposure measurement error owing to the changes in trees over time. One of the solutions to this issue is using multi-temporal LiDAR data, which is increasingly promising given that LiDAR data costs are decreasing and data processing is becoming more standardized (Zhao et al. 2018). In addition, like other tree identification and delineation algorithms, our algorithm was inevitably accompanied by issues, such as the misidentification of trees (e.g., building edges) and the over- and undersegmentation of tree crowns (Zhen et al. 2016). In addition, although the estimated crown volume using a 3D convex hull algorithm largely relies on the amount and distribution of branches that does not change much between summer and winter, for deciduous trees it may be underestimated owing to the use of winter (or leaf-off) LiDAR data (Ørka et al. 2010). We acknowledge that these issues may affect the tree characteristics aggregated at the census tract level. However, the building edge objects had a relatively small volume; the segmentation errors may slightly over- or underestimate the amount of trees (Figure 3) but did not bias the aggregated tree crown volume; and a recent study has shown that leaf-off LiDAR data were more successful in describing crown size diversity (Davison et al. 2020). Therefore, we believe these uncertainties did not meaningfully affect the tree–health associations observed in the present study. In addition, perfect identification and segmentation of individual trees in a highly heterogeneous environment with diverse tree species and local contexts (e.g., urban areas) is challenging and beyond the scope of this study. We acknowledge the fact that timing mismatch between medication sales data (2006–2014) and socioeconomic background data (2001) may have caused additional bias, but at the time of analysis this was the best possible match based on the availability of group-level socioeconomic and medication sales data sets.
Finally, it is important to note that lower medication sales may be associated with higher mortality. This may be the result of untreated cardiovascular disease and mood disorders, leading to higher mortality by cardiovascular disease and suicide. However, in a study on the associations between residential green space and mortality for residents in the five largest cities in Belgium (including Brussels), higher exposure to residential green space was associated with decreased nonaccidental mortality (Bauwelinck et al. 2021). Therefore, we argue that the lower medication sales in areas with higher exposure to green space in this study was most likely associated with the lower incidence of cardiovascular disease and mental disorders.
Conclusions
Based on aggregated health data and comprehensive 3D tree data, we found that both tree density and tree crown volume are inversely associated with medication sales for cardiovascular disease and mood disorders. However, results of models that evaluate several tree trait exposures simultaneously suggest that living in areas with large tree crown volumes divided over relatively fewer stems may be more beneficial for adult cardiovascular and mental health than living in areas with a similar crown volume divided over a higher number of trees with smaller crowns. Large tree crowns may reduce physical and mental stress more efficiently because the reduction of both heat and air pollution depend on leaf area, which is higher in large tree crowns. Psychological effects and indirect nature experiences provided by large trees, which are often old trees, may further strengthen the health impacts of these trees. Our results demonstrate that conserving large, old trees in urban environments supports not only the conservation of biodiversity but also human health.
Supplementary Material
Acknowledgments
The authors acknowledge the Intermutualistisch Agentschap–Agence Inter-Mutualiste (IMA-AIM) for providing the health data. We thank B. Nemery for his contribution to the GRESP-HEALTH (Impact of green/blue spaces on specific morbidity and cause-specific mortality in Belgium) project. We are grateful to S. De France from the Brussels Regional Information Centre for providing the 2012 airborne light detection and ranging data (LiDAR) set. We also thank M. Fontaine from the Green Management Office of the City of Brussels and M. Engelbeen from Brussels Environment for providing the tree database for the city of Brussels, and we appreciate J. Degerickx from the Flemish Institute for Technological Research (VITO NV) for contributing to the individual tree delineation algorithm.
This research has received funding from the Belgian Science Policy Office through the Belgian Research Action through Interdisciplinary Networks project GRESP-HEALTH under grant agreement BR/143/A3/GRESP-HEALTH and the Support To Exploitation and Research in Earth Observation projects UrbanEARS (SR/00/307) and Belair (SR/01/354). M.B. is recipient of a doctoral fellowship (grant 11A9718N) of the Research Foundation Flanders. D.C. acknowledges financial support from the China Scholarship Council.
The medication sales data are confidential. All health data were anonymized by aggregation to census tract level and were used under license of the IMA-AIM. The protocol for this study did not require ethics approval.
References
- Aerts R, Bruffaerts N, Somers B, Demoury C, Plusquin M, Nawrot TS, et al. 2021. Tree pollen allergy risks and changes across scenarios in urban green spaces in Brussels, Belgium. Landsc Urban Plan 207:104001, 10.1016/j.landurbplan.2020.104001. [DOI] [Google Scholar]
- Aerts R, Honnay O, Van Nieuwenhuyse A. 2018. Biodiversity and human health: mechanisms and evidence of the positive health effects of diversity in nature and green spaces. Br Med Bull 127(1):5–22, PMID: , 10.1093/bmb/ldy021. [DOI] [PubMed] [Google Scholar]
- Aerts R, Nemery B, Bauwelinck M, Trabelsi S, Deboosere P, Van Nieuwenhuyse A, et al. 2020. Residential green space, air pollution, socioeconomic deprivation and cardiovascular medication sales in Belgium: a nationwide ecological study. Sci Total Environ 712:136426, PMID: , 10.1016/j.scitotenv.2019.136426. [DOI] [PubMed] [Google Scholar]
- Aerts R, Vanlessen N, Dujardin S, Nemery B, Van Nieuwenhuyse A, Bauwelinck M, et al. 2022. Residential green space and mental health-related prescription medication sales: an ecological study in Belgium. Environ Res 211:113056, PMID: , 10.1016/j.envres.2022.113056. [DOI] [PubMed] [Google Scholar]
- Akpinar A, Barbosa-Leiker C, Brooks KR. 2016. Does green space matter? Exploring relationships between green space type and health indicators. Urban For Urban Green 20:407–418, 10.1016/j.ufug.2016.10.013. [DOI] [Google Scholar]
- Alonzo M, Bookhagen B, Roberts DA. 2014. Urban tree species mapping using hyperspectral and lidar data fusion. Remote Sens Environ 148:70–83, 10.1016/j.rse.2014.03.018. [DOI] [Google Scholar]
- Astell-Burt T, Feng X. 2019. Association of urban green space with mental health and general health among adults in Australia. JAMA Netw Open 2(7):e198209, PMID: , 10.1001/jamanetworkopen.2019.8209. [DOI] [PMC free article] [PubMed] [Google Scholar]
- Astell-Burt T, Feng X. 2020a. Does sleep grow on trees? A longitudinal study to investigate potential prevention of insufficient sleep with different types of urban green space. SSM Popul Health 10:100497, PMID: , 10.1016/j.ssmph.2019.100497. [DOI] [PMC free article] [PubMed] [Google Scholar]
- Astell-Burt T, Feng X. 2020b. Urban green space, tree canopy and prevention of cardiometabolic diseases: a multilevel longitudinal study of 46 786 Australians. Int J Epidemiol 49(3):926–933, PMID: , 10.1093/ije/dyz239. [DOI] [PMC free article] [PubMed] [Google Scholar]
- Barboza EP, Cirach M, Khomenko S, Iungman T, Mueller N, Barrera-Gómez J, et al. 2021. Green space and mortality in European cities: a health impact assessment study. Lancet Planet Health 5(10):e718–e730, PMID: , 10.1016/S2542-5196(21)00229-1. [DOI] [PubMed] [Google Scholar]
- Bauwelinck M, Casas L, Nawrot TS, Nemery B, Trabelsi S, Thomas I, et al. 2021. Residing in urban areas with higher green space is associated with lower mortality risk: a census-based cohort study with ten years of follow-up. Environ Int 148:106365, PMID: , 10.1016/j.envint.2020.106365. [DOI] [PubMed] [Google Scholar]
- Becker DA, Browning MHEM, Kuo M, Van Den Eeden SK. 2019. Is green land cover associated with less health care spending? Promising findings from county-level Medicare spending in the continental United States. Urban For Urban Green 41:39–47, 10.1016/j.ufug.2019.02.012. [DOI] [Google Scholar]
- Bixby H, Hodgson S, Fortunato L, Hansell A, Fecht D. 2015. Associations between green space and health in English cities: an ecological, cross-sectional study. PLoS One 10(3):e0119495, PMID: , 10.1371/journal.pone.0119495. [DOI] [PMC free article] [PubMed] [Google Scholar]
- Bloemsma LD, Wijga AH, Klompmaker JO, Hoek G, Janssen NAH, Oldenwening M, et al. 2021. Green space, air pollution, traffic noise and saliva cortisol in children: the PIAMA study. Environ Epidemiol 5(2):e141, PMID: , 10.1097/EE9.0000000000000141. [DOI] [PMC free article] [PubMed] [Google Scholar]
- Browning MHEM, Rigolon A. 2018. Do income, race and ethnicity, and sprawl influence the greenspace-human health link in city-level analyses? Findings from 496 cities in the United States. Int J Environ Res Public Health 15(7):1541, PMID: , 10.3390/ijerph15071541. [DOI] [PMC free article] [PubMed] [Google Scholar]
- Buxton RT, Pearson AL, Allou C, Fristrup K, Wittemyer G. 2021. A synthesis of health benefits of natural sounds and their distribution in national parks. Proc Natl Acad Sci USA 118(14):e2013097118, PMID: , 10.1073/pnas.2013097118. [DOI] [PMC free article] [PubMed] [Google Scholar]
- Casas L, Thomas I, Nawrot T, Bouland C, Deboosere P, Van Nieuwenhuyse A, et al. 2015. Impact of green/blue spaces on specific morbidity and cause-specific mortality in Belgium: the GRESP-HEALTH project protocol (2015–2019). Arch Public Health 73(suppl 1):P16, 10.1186/2049-3258-73-S1-P16. [DOI] [Google Scholar]
- Chen X, de Vries S, Assmuth T, Dick J, Hermans T, Hertel O, et al. 2019. Research challenges for cultural ecosystem services and public health in (peri-)urban environments. Sci Total Environ 651(pt 2):2118–2129, PMID: , 10.1016/j.scitotenv.2018.09.030. [DOI] [PubMed] [Google Scholar]
- Chi DK, Degerickx J, Yu K, Somers B. 2020. Urban tree health classification across tree species by combining airborne laser scanning and imaging spectroscopy. Remote Sens [Basel] 12(15):2435, 10.3390/rs12152435. [DOI] [Google Scholar]
- Collins RM, Spake R, Brown KA, Ogutu BO, Smith D, Eigenbrod F. 2020. A systematic map of research exploring the effect of greenspace on mental health. Landsc Urban Plan 201:103823, 10.1016/j.landurbplan.2020.103823. [DOI] [Google Scholar]
- Cox DTC, Bennie J, Casalegno S, Hudson HL, Anderson K, Gaston KJ. 2019. Skewed contributions of individual trees to indirect nature experiences. Landsc Urban Plan 185:28–34, 10.1016/j.landurbplan.2019.01.008. [DOI] [Google Scholar]
- Davison S, Donoghue DNM, Galiatsatos N. 2020. The effect of leaf-on and leaf-off forest canopy conditions on LiDAR derived estimations of forest structural diversity. Int J Appl Earth Obs Geoinf 92:102160, 10.1016/j.jag.2020.102160. [DOI] [Google Scholar]
- Degerickx J, Roberts DA, McFadden JP, Hermy M, Somers B. 2018. Urban tree health assessment using airborne hyperspectral and LiDAR imagery. Int J Appl Earth Obs Geoinf 73:26–38, 10.1016/j.jag.2018.05.021. [DOI] [Google Scholar]
- Donovan GH, Butry DT, Michael YL, Prestemon JP, Liebhold AM, Gatziolis D, et al. 2013. The relationship between trees and human health: evidence from the spread of the emerald ash borer. Am J Prev Med 44(2):139–145, PMID: , 10.1016/j.amepre.2012.09.066. [DOI] [PubMed] [Google Scholar]
- Donovan GH, Michael YL, Gatziolis D, Prestemon JP, Whitsel EA. 2015. Is tree loss associated with cardiovascular-disease risk in the Women’s Health Initiative? A natural experiment. Health Place 36:1–7, PMID: , 10.1016/j.healthplace.2015.08.007. [DOI] [PubMed] [Google Scholar]
- Dzhambov A, Hartig T, Markevych I, Tilov B, Dimitrova D. 2018. Urban residential greenspace and mental health in youth: different approaches to testing multiple pathways yield different conclusions. Environ Res 160:47–59, PMID: , 10.1016/j.envres.2017.09.015. [DOI] [PubMed] [Google Scholar]
- Dzhambov AM, Hartig T, Tilov B, Atanasova V, Makakova DR, Dimitrova DD. 2019. Residential greenspace is associated with mental health via intertwined capacity-building and capacity-restoring pathways. Environ Res 178:108708, PMID: , 10.1016/j.envres.2019.108708. [DOI] [PubMed] [Google Scholar]
- EEA (European Environment Agency). 2019. CLC 2006. https://land.copernicus.eu/pan-european/corine-land-cover/clc-2006 [accessed 7 October 2019].
- Egorov AI, Griffin SM, Converse RR, Styles JN, Klein E, Scott J, et al. 2020. Greater tree cover near residence is associated with reduced allostatic load in residents of central North Carolina. Environ Res 186:109435, PMID: , 10.1016/j.envres.2020.109435. [DOI] [PMC free article] [PubMed] [Google Scholar]
- Grote R, Samson R, Alonso R, Amorim JH, Cariñanos P, Churkina G, et al. 2016. Functional traits of urban trees: air pollution mitigation potential. Front Ecol Environ 14(10):543–550, 10.1002/fee.1426. [DOI] [Google Scholar]
- Helbich M, Yao Y, Liu Y, Zhang J, Liu P, Wang R. 2019. Using deep learning to examine street view green and blue spaces and their associations with geriatric depression in Beijing, China. Environ Int 126:107–117, PMID: , 10.1016/j.envint.2019.02.013. [DOI] [PMC free article] [PubMed] [Google Scholar]
- Honold J, Lakes T, Beyer R, van der Meer E. 2016. Restoration in urban spaces: nature views from home, greenways, and public parks. Environ Behav 48(6):796–825, 10.1177/0013916514568556. [DOI] [Google Scholar]
- Hooper P, Boruff B, Beesley B, Badland H, Giles-Corti B. 2018. Testing spatial measures of public open space planning standards with walking and physical activity health outcomes: findings from the Australian National Liveability Study. Landsc Urban Plan 171:57–67, 10.1016/j.landurbplan.2017.12.001. [DOI] [Google Scholar]
- Jarvis I, Koehoorn M, Gergel SE, van den Bosch M. 2020. Different types of urban natural environments influence various dimensions of self-reported health. Environ Res 186:109614, PMID: , 10.1016/j.envres.2020.109614. [DOI] [PubMed] [Google Scholar]
- Jiang B, Deal B, Pan H, Larsen L, Hsieh CH, Chang CY, et al. 2017. Remotely-sensed imagery vs. eye-level photography: evaluating associations among measurements of tree cover density. Landsc Urban Plan 157:270–281, 10.1016/j.landurbplan.2016.07.010. [DOI] [Google Scholar]
- Jones R, Tarter R, Ross AM. 2021. Greenspace interventions, stress and cortisol: a scoping review. Int J Environ Res Public Health 18(6):2802, PMID: , 10.3390/ijerph18062802. [DOI] [PMC free article] [PubMed] [Google Scholar]
- Kabisch N. 2019. The influence of socio-economic and socio-demographic factors in the association between urban green space and health. In: Biodiversity and Health in the Face of Climate Change. Marselle MR, Stadler J, Korn H, Irvine KN, Bonn A, eds. Cham, Switzerland: Springer International Publishing, 91–119. [Google Scholar]
- Kardan O, Gozdyra P, Misic B, Moola F, Palmer LJ, Paus T, et al. 2015. Neighborhood greenspace and health in a large urban center. Sci Rep 5:11610, PMID: , 10.1038/srep11610. [DOI] [PMC free article] [PubMed] [Google Scholar]
- Knobel P, Kondo M, Maneja R, Zhao Y, Dadvand P, Schinasi LH. 2021. Associations of objective and perceived greenness measures with cardiovascular risk factors in Philadelphia, PA: a spatial analysis. Environ Res 197:110990, PMID: , 10.1016/j.envres.2021.110990. [DOI] [PubMed] [Google Scholar]
- Kong F, Yan W, Zheng G, Yin H, Cavan G, Zhan W, et al. 2016. Retrieval of three-dimensional tree canopy and shade using terrestrial laser scanning (TLS) data to analyze the cooling effect of vegetation. Agric for Meteorol 217:22–34, 10.1016/j.agrformet.2015.11.005. [DOI] [Google Scholar]
- Kwong IHY, Fung T. 2020. Tree height mapping and crown delineation using LiDAR, large format aerial photographs, and unmanned aerial vehicle photogrammetry in subtropical urban forest. Int J Remote Sens 41(14):5228–5256, 10.1080/01431161.2020.1731002. [DOI] [Google Scholar]
- Labib SM, Lindley S, Huck JJ. 2020. Spatial dimensions of the influence of urban green-blue spaces on human health: a systematic review. Environ Res 180:108869, PMID: , 10.1016/j.envres.2019.108869. [DOI] [PubMed] [Google Scholar]
- Lanki T, Siponen T, Ojala A, Korpela K, Pennanen A, Tiittanen P, et al. 2017. Acute effects of visits to urban green environments on cardiovascular physiology in women: a field experiment. Environ Res 159:176–185, PMID: , 10.1016/j.envres.2017.07.039. [DOI] [PubMed] [Google Scholar]
- Le Roux DS, Ikin K, Lindenmayer DB, Manning AD, Gibbons P. 2014. The future of large old trees in urban landscapes. PLoS One 9(6):e99403, PMID: , 10.1371/journal.pone.0099403. [DOI] [PMC free article] [PubMed] [Google Scholar]
- Li X, Ghosh D. 2018. Associations between body mass index and urban “green” streetscape in Cleveland, Ohio, USA. Int J Environ Res Public Health 15(10):2186, PMID: , 10.3390/ijerph15102186. [DOI] [PMC free article] [PubMed] [Google Scholar]
- Lin BS, Lin YJ. 2010. Cooling effect of shade trees with different characteristics in a subtropical urban park. HortScience 45(1):83–86, 10.21273/HORTSCI.45.1.83. [DOI] [Google Scholar]
- Lindenmayer DB, Laurance WF. 2017. The ecology, distribution, conservation and management of large old trees. Biol Rev Camb Philos Soc 92(3):1434–1458, PMID: , 10.1111/brv.12290. [DOI] [PubMed] [Google Scholar]
- Liu Y, Wang R, Lu Y, Li Z, Chen H, Cao M, et al. 2020. Natural outdoor environment, neighbourhood social cohesion and mental health: using multilevel structural equation modelling, streetscape and remote-sensing metrics. Urban For Urban Green 48:126576, 10.1016/j.ufug.2019.126576. [DOI] [Google Scholar]
- Markevych I, Schoierer J, Hartig T, Chudnovsky A, Hystad P, Dzhambov AM, et al. 2017. Exploring pathways linking greenspace to health: theoretical and methodological guidance. Environ Res 158:301–317, PMID: , 10.1016/j.envres.2017.06.028. [DOI] [PubMed] [Google Scholar]
- Marselle MR, Bowler DE, Watzema J, Eichenberg D, Kirsten T, Bonn A. 2020. Urban street tree biodiversity and antidepressant prescriptions. Sci Rep 10(1):22445, PMID: , 10.1038/s41598-020-79924-5. [DOI] [PMC free article] [PubMed] [Google Scholar]
- Marselle MR, Hartig T, Cox DTC, de Bell S, Knapp S, Lindley S, et al. 2021. Pathways linking biodiversity to human health: a conceptual framework. Environ Int 150:106420, PMID: , 10.1016/j.envint.2021.106420. [DOI] [PubMed] [Google Scholar]
- Methorst J, Rehdanz K, Mueller T, Hansjürgens B, Bonn A, Böhning-Gaese K. 2021. The importance of species diversity for human well-being in Europe. Ecol Econ 181:106917, 10.1016/j.ecolecon.2020.106917. [DOI] [Google Scholar]
- Mitchell R, Astell-Burt T, Richardson EA. 2011. A comparison of green space indicators for epidemiological research. J Epidemiol Community Health 65(10):853–858, PMID: , 10.1136/jech.2010.119172. [DOI] [PubMed] [Google Scholar]
- Nguyen QC, Sajjadi M, McCullough M, Pham M, Nguyen TT, Yu W, et al. 2018. Neighbourhood looking glass: 360° automated characterisation of the built environment for neighbourhood effects research. J Epidemiol Community Health 72(3):260–266, PMID: , 10.1136/jech-2017-209456. [DOI] [PMC free article] [PubMed] [Google Scholar]
- Nieuwenhuijsen MJ, Khreis H, Triguero-Mas M, Gascon M, Dadvand P. 2017. Fifty shades of green: pathway to healthy urban living. Epidemiology 28(1):63–71, PMID: , 10.1097/EDE.0000000000000549. [DOI] [PubMed] [Google Scholar]
- O’Neil-Dunne J, MacFaden S, Royar A. 2014. A versatile, production-oriented approach to high-resolution tree-canopy mapping in urban and suburban landscapes using GEOBIA and data fusion. Remote Sens [Basel] 6(12):12837–12865, 10.3390/rs61212837. [DOI] [Google Scholar]
- Ørka HO, Næsset E, Bollandsås OM. 2010. Effects of different sensors and leaf-on and leaf-off canopy conditions on echo distributions and individual tree properties derived from airborne laser scanning. Remote Sens Environ 114(7):1445–1461, 10.1016/j.rse.2010.01.024. [DOI] [Google Scholar]
- Otepka J, Mandlburger G, Karel W. 2012. The OPALS data manager—efficient data management for processing large airborne laser scanning projects. ISPRS Ann Photogramm Remote Sens Spatial Inf Sci I-3:153–159, 10.5194/isprsannals-I-3-153-2012. [DOI] [Google Scholar]
- Pelgrims I, Devleesschauwer B, Guyot M, Keune H, Nawrot TS, Remmen R, et al. 2021. Association between urban environment and mental health in Brussels, Belgium. BMC Public Health 21(1):635, PMID: , 10.1186/s12889-021-10557-7. [DOI] [PMC free article] [PubMed] [Google Scholar]
- Pena JC, Martello F, Ribeiro MC, Armitage RA, Young RJ, Rodrigues M. 2017. Street trees reduce the negative effects of urbanization on birds. PLoS One 12(3):e0174484, PMID: , 10.1371/journal.pone.0174484. [DOI] [PMC free article] [PubMed] [Google Scholar]
- Pretzsch H, Biber P, Uhl E, Dahlhausen J, Rötzer T, Caldentey J, et al. 2015. Crown size and growing space requirement of common tree species in urban centres, parks, and forests. Urban For Urban Green 14(3):466–479, 10.1016/j.ufug.2015.04.006. [DOI] [Google Scholar]
- Rafiee A, Dias E, Koomen E. 2016. Local impact of tree volume on nocturnal urban heat island: a case study in Amsterdam. Urban For Urban Green 16:50–61, 10.1016/j.ufug.2016.01.008. [DOI] [Google Scholar]
- Rao M, George LA, Rosenstiel TN, Shandas V, Dinno A. 2014. Assessing the relationship among urban trees, nitrogen dioxide, and respiratory health. Environ Pollut 194:96–104, PMID: , 10.1016/j.envpol.2014.07.011. [DOI] [PubMed] [Google Scholar]
- Reid CE, Clougherty JE, Shmool JLC, Kubzansky LD. 2017. Is all urban green space the same? A comparison of the health benefits of trees and grass in New York City. Int J Environ Res Public Health 14(11):1411, PMID: , 10.3390/ijerph14111411. [DOI] [PMC free article] [PubMed] [Google Scholar]
- Richardson EA, Mitchell R, Hartig T, de Vries S, Astell-Burt T, Frumkin H. 2012. Green cities and health: a question of scale? J Epidemiol Community Health 66(2):160–165, PMID: , 10.1136/jech.2011.137240. [DOI] [PubMed] [Google Scholar]
- Roy S, Byrne J, Pickering C. 2012. A systematic quantitative review of urban tree benefits, costs, and assessment methods across cities in different climatic zones. Urban for Urban Green 11(4):351–363, 10.1016/j.ufug.2012.06.006. [DOI] [Google Scholar]
- Rugel EJ, Henderson SB, Carpiano RM, Brauer M. 2017. Beyond the normalized difference vegetation index (NDVI): developing a natural space index for population-level health research. Environ Res 159:474–483, PMID: , 10.1016/j.envres.2017.08.033. [DOI] [PubMed] [Google Scholar]
- Salmond JA, Tadaki M, Vardoulakis S, Arbuthnott K, Coutts A, Demuzere M, et al. 2016. Health and climate related ecosystem services provided by street trees in the urban environment. Environ Health 15(S1):S36, PMID: , 10.1186/s12940-016-0103-6. [DOI] [PMC free article] [PubMed] [Google Scholar]
- Sandifer PA, Sutton-Grier AE, Ward BP. 2015. Exploring connections among nature, biodiversity, ecosystem services, and human health and well-being: opportunities to enhance health and biodiversity conservation. Ecosyst Serv 12:1–15, 10.1016/j.ecoser.2014.12.007. [DOI] [Google Scholar]
- Shahidan MF, Shariff MKM, Jones P, Salleh E, Abdullah AM. 2010. A comparison of Mesua ferrea L. and Hura crepitans L. for shade creation and radiation modification in improving thermal comfort. Landsc Urban Plan 97(3):168–181, 10.1016/j.landurbplan.2010.05.008. [DOI] [Google Scholar]
- Simkin J, Ojala A, Tyrväinen L. 2020. Restorative effects of mature and young commercial forests, pristine old-growth Forest and urban recreation forest—a field experiment. Urban For Urban Green 48:126567, 10.1016/j.ufug.2019.126567. [DOI] [Google Scholar]
- Speak A, Montagnani L, Wellstein C, Zerbe S. 2020. The influence of tree traits on urban ground surface shade cooling. Landsc Urban Plan 197:103748, 10.1016/j.landurbplan.2020.103748. [DOI] [Google Scholar]
- Stagoll K, Lindenmayer DB, Knight E, Fischer J, Manning AD. 2012. Large trees are keystone structures in urban parks. Conserv Lett 5(2):115–122, 10.1111/j.1755-263X.2011.00216.x. [DOI] [Google Scholar]
- Stas M, Aerts R, Hendrickx M, Delcloo A, Dendoncker N, Dujardin S, et al. 2021. Exposure to green space and pollen allergy symptom severity: a case-crossover study in Belgium. Sci Total Environ 781:146682, PMID: , 10.1016/j.scitotenv.2021.146682. [DOI] [PubMed] [Google Scholar]
- Statbel. 2021. Structure of the Population. Belgium in Figures. https://statbel.fgov.be/en/themes/population/structure-population [accessed 22 April 2022].
- Tashakor S, Chamani A. 2021. Temporal variability of noise pollution attenuation by vegetation in urban parks. Environ Sci Pollut Res Int 28(18):23143–23151, PMID: , 10.1007/s11356-021-12355-5. [DOI] [PubMed] [Google Scholar]
- Taylor MS, Wheeler BW, White MP, Economou T, Osborne NJ. 2015. Research note: urban street tree density and antidepressant prescription rates—a cross-sectional study in London, UK. Landsc Urban Plan 136:174–179, 10.1016/j.landurbplan.2014.12.005. [DOI] [Google Scholar]
- Trabelsi S, Casas L, Nemery B, Nawrot TS, Thomas I. 2019. Geographies of asthma medication purchase for pre-schoolers in Belgium. Respir Res 20(1):90, PMID: , 10.1186/s12931-019-1052-8. [DOI] [PMC free article] [PubMed] [Google Scholar]
- Ulmer JM, Wolf KL, Backman DR, Tretheway RL, Blain CJ, O’Neil-Dunne JP, et al. 2016. Multiple health benefits of urban tree canopy: the mounting evidence for a green prescription. Health Place 42:54–62, PMID: , 10.1016/j.healthplace.2016.08.011. [DOI] [PubMed] [Google Scholar]
- Villeneuve PJ, Ysseldyk RL, Root A, Ambrose S, DiMuzio J, Kumar N, et al. 2018. Comparing the Normalized Difference Vegetation Index with the Google Street View measure of vegetation to assess associations between greenness, walkability, recreational physical activity, and health in Ottawa, Canada. Int J Environ Res Public Health 15(8):1719, PMID: , 10.3390/ijerph15081719. [DOI] [PMC free article] [PubMed] [Google Scholar]
- Wang L, Gong P, Biging GS. 2004. Individual tree-crown delineation and treetop detection in high-spatial-resolution aerial imagery. Photogramm Eng Remote Sensing 70(3):351–357, 10.14358/PERS.70.3.351. [DOI] [Google Scholar]
- Wang R, Yang B, Yao Y, Bloom MS, Feng Z, Yuan Y, et al. 2020. Residential greenness, air pollution and psychological well-being among urban residents in Guangzhou, China. Sci Total Environ 711:134843, PMID: , 10.1016/j.scitotenv.2019.134843. [DOI] [PubMed] [Google Scholar]
- Webster TF. 2007. Bias magnification in ecologic studies: a methodological investigation. Environ Health 6:17, PMID: , 10.1186/1476-069X-6-17. [DOI] [PMC free article] [PubMed] [Google Scholar]
- Wood L, Hooper P, Foster S, Bull F. 2017. Public green spaces and positive mental health—investigating the relationship between access, quantity and types of parks and mental wellbeing. Health Place 48:63–71, PMID: , 10.1016/j.healthplace.2017.09.002. [DOI] [PubMed] [Google Scholar]
- Yin S, Shen Z, Zhou P, Zou X, Che S, Wang W. 2011. Quantifying air pollution attenuation within urban parks: an experimental approach in Shanghai, China. Environ Pollut 159(8–9):2155–2163, PMID: , 10.1016/j.envpol.2011.03.009. [DOI] [PubMed] [Google Scholar]
- Zhang R, Zhang CQ, Rhodes RE. 2021. The pathways linking objectively-measured greenspace exposure and mental health: a systematic review of observational studies. Environ Res 198:111233, PMID: , 10.1016/j.envres.2021.111233. [DOI] [PubMed] [Google Scholar]
- Zhao K, Suarez JC, Garcia M, Hu T, Wang C, Londo A. 2018. Utility of multitemporal lidar for forest and carbon monitoring: tree growth, biomass dynamics, and carbon flux. Remote Sens Environ 204:883–897, 10.1016/j.rse.2017.09.007. [DOI] [Google Scholar]
- Zhao N, Prieur JF, Liu Y, Kneeshaw D, Lapointe EM, Paquette A, et al. 2021. Tree characteristics and environmental noise in complex urban settings—a case study from Montreal, Canada. Environ Res 202:111887, PMID: , 10.1016/j.envres.2021.111887. [DOI] [PubMed] [Google Scholar]
- Zhen Z, Quackenbush LJ, Zhang L. 2016. Trends in automatic individual tree crown detection and delineation—evolution of LiDAR data. Remote Sens [Basel] 8(4):333, 10.3390/rs8040333. [DOI] [Google Scholar]
- Zhou W. 2013. An object-based approach for urban land cover classification: integrating LiDAR height and intensity data. IEEE Geosci Remote Sensing Lett 10(4):928–931, 10.1109/LGRS.2013.2251453. [DOI] [Google Scholar]
Associated Data
This section collects any data citations, data availability statements, or supplementary materials included in this article.