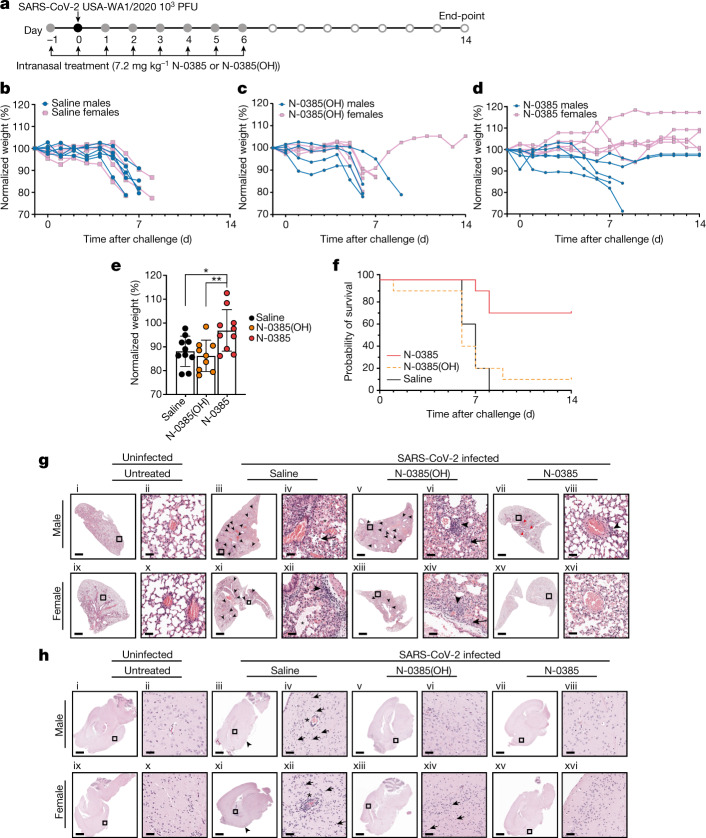
Fig. 4. N-0385 reduces morbidity and mortality in the K18-hACE2 mouse model of SARS-CoV-2.
a, Mice (n = 10 per treatment group) were treated daily on days −1 to +6 relative to infection. Surviving mice were euthanized at the study end-point. b–d, Weight change of mice treated with saline (control) (b), N-0385(OH) (c) or N-0385 (d). e, Weight loss difference at 6 dpi; *P = 0.0193, **P = 0.0083. Data are mean ± s.d., with two-tailed Student’s t-tests used to determine significance. f, Probability of survival. g, Representative haematoxylin and eosin (H&E) staining of lung histopathology (one slice analysed per mouse) at death or study end-point in untreated mice (i, ii, ix, x) or mice treated with saline (iii, iv, day 7; xi, xii, day 6), N-0385(OH) (v, vi, xiii, xiv, day 6) or N-0385 (vii, viii, xv, xvi, day 14). Uninfected mice tissues (i, ii, ix, x) were normal. Challenged mice (iii–viii, xi–xvi) developed perivascular infiltrates of inflammatory cells (arrowheads). Severe inflammatory changes including alveolar fibrin and oedema (asterisks) were found only in the saline group (iii, iv, xi, xii). Perivascular inflammatory cell infiltrates (arrowheads) were more widespread in saline (iii, xi) and control N-0385(OH) (v, xiii) compared to N-0385 mice (vii, xv). Surviving N-0385 mice (vii, viii, xv, xvi) had smaller and fewer perivascular inflammatory infiltrates (arrowheads) and occasional type II pneumocyte hyperplasia (red arrows). h, Representative H&E images of brain histopathology (one slice analysed per mouse) in untreated mice (i, ii, ix, x) or mice treated with saline (iii, iv, day 7; xi, xii, day 8), N-0385(OH) (v, vi, day 6; xiii, xiv, day 7) or N-0385 (vii, viii, xv, xvi, day 14). Saline-treated mice (i, ii, ix, x) developed perivascular cuffs of inflammatory cells (asterisks), necrotic neurons (arrows), gliosis and meningeal infiltrates (arrowheads). Brain lesions were reduced in N-0385(OH) mice (v, vi, xiii, xiv) and absent in surviving N-0385 mice (vii, viii, xv, xvi). The magnified areas were selected to best represent the presence of inflammatory cells and pathological changes. Scale bars in g, h: i, iii, v, vii, ix, xi, xiii, xv, 1 mm; ii, iv, vi, viii, x, xii, xiv, xvi, 50 µm.

