Abstract
Objective
To investigate the diagnostic values of D-dimer, plasminogen activator inhibitor-1 (PAI-1), thrombin–antithrombin (TAT), and prothrombin fragment F1 + 2 (F1 + 2) for predicting venous thromboembolism (VTE) after total knee arthroplasty (TKA).
Methods
Ultrasonography and CTPA were performed to diagnose VTE in 252 patients who underwent TKAs. Plasma D-dimer, PAI-1, TAT, and F1 + 2 levels were assessed 1–3 days prior to operation (T1), second hour (T2), first (T3), and third day (T4) after the operation. Receiver–operating characteristic curves (ROC) analysis was conducted and pairwise compared to evaluate the diagnostic value of those biomarkers.
Results
Plasma D-dimer levels differed between patients with and without VTE significantly on T4, PAI-1, TAT, and F1 + 2 levels differed on T3 and T4. The areas under ROC of D-dimer, PAI-1, TAT and F1 + 2 levels were 0.645, 0.773, 0.771 and 0.797, respectively. The most feasible cutoff values of D-dimer, PAI-1, TAT and F1 + 2 in predicting VTE after TKA were 2.24 ug/ml, 35.96 ng/ml, 13.36 ng/mg and 11.1 ng/ml, respectively. Pairwise comparison of ROC curves revealed that D-dimer level had the lowest diagnostic accuracy, whereas PAI-1, TAT and F1 + 2 level had similar diagnostic accuracy. There were significant differences in duration of tourniquet time and duration of anesthesia between patients with and without VTE.
Conclusion
After TKA, using 2.24ug/mL as the threshold value of D-dimer is more accurate than using 0.5ug/mL in the monitoring of VTE, PAI-1, TAT and F1 + 2 are more valuable than D-dimer in predicting VTE. Duration of tourniquet and duration of anesthesia are risk factors for the development of VTE.
Keywords: total knee arthroplasty, deep vein thrombosis, pulmonary embolism, thrombogenic biomarkers
Introduction
Venous thromboembolism (VTE) is a major cause of morbidity and mortality after total knee arthroplasty (TKA). As a result of increased risk of endothelial injury with tourniquet use, venous stasis with leg positioning and tourniquet use, and aberrant activation of the clotting cascade, 1 patients undergoing TKA are at high risk for venous thromboembolism (VTE) with an incidence rate of 17-53% depending on the method of prevention.2–4
Since the American Academy of Orthopedic Surgeons 2011 Guidelines recommend against routine postoperative duplex ultrasonography screening of patients who undergo elective knee arthroplasty, 4 D-dimer and clinical observation have become the most used methods to screening postoperative VTE after TKA. Many other conditions may also elevate plasma D-dimer level.5–7 However, the high sensitivity and low specificity of D-dimer level always lead to a “false positivity”” phenomenon. Plasminogen activator inhibitor-1 (PAI-1) is a fibrinolytic biomarker, the correlation between PAI-1 and postoperative VTE after TKA has been reported, 8 a meta-analysis 9 has indicated that PAI-1 rs1799889 polymorphism may serve as one of the predisposing factors of VTE in both Caucasians and East Asians. Changes in thrombin–antithrombin (TAT) complexes and prothrombin fragment F1 + 2 (F1 + 2) (markers of thrombin generation) have been studied as markers of thrombosis after TKA.10,11
In this study, we speculated that the activation of blood coagulation after TKA would elevate plasma D-dimer, PAI-1, TAT, and F1 + 2 levels in a systematic and predictable way in the absence of VTE that VTE would elevate plasma levels beyond their ranges. The aim of this study was to investigate the diagnostic value of those thrombogenic biomarkers for predicting VTE after TKA, and define an optimal threshold for each marker.
Methods
This study was conducted at General Hospital of Ningxia Medical University, Ningxia, China. After obtaining institutional review board approval (2020-505), a prospective study was carried out from April 2020 to April 2021.
Patients
All patients older than 18 years undergoing primary unilateral TKA with cemented implants in General Hospital of Ningxia Medical University were eligible for inclusion. The exclusion criteria were pregnancy or breast feeding, perioperative administration of blood products, abnormal blood coagulation, preoperative hepatic or renal dysfunction, serious cardiac or respiratory disease, including coronary artery stent placement or bypass, and preoperative diagnosis of deep vein thrombosis (DVT).
Surgeries and Interventions
All TKA procedures were performed under general anesthesia, with Zimmer Automatic Tourniquet System (A.T.S.)® 750 (Zimmer Biomet, OH, USA). All patients received 3 g of tranexamic acid (TXA) TXA (Conba Bio-pharm, Zhejiang, China) topically or intravenously (1 g of TXA in 100 mL NS was applied intravenously 10 min prior to skin incision, and 1 g of TXA in 100 mL NS was applied intravenously at 3 and 6 hours after the first intravenous application). A standard midline skin incision and medial parapatellar arthrotomy approach was performed. After femoral and tibial osteotomy and preparation, cement with gentamicin (Refobacin® Bone Cement R, Biomet France, Valence, France) was used for fixation of the prosthesis. PFC® Sigma® series of total knee prostheses (DePuy Orthopaedics Inc, Warsaw, IN, USA) was applied for all patients. After setting of cement, the tourniquet was deflated and hemostasis was achieved by electrocoagulation. In all cases, a negative pressure drainage system (Branden, Shandong, China) was inserted immediately prior to wound closure, the drain was clamped for 2 hours and was removed 24 hours after surgery.
VTE prophylaxis was standardized according to the institution with low-molecular-weight heparin (LMWH) (Chase Sun, Tianjin, China). All patients were managed with a comprehensive, multidisciplinary approach to postoperative care, including LMWH prophylaxis prior to discharge, early mobilization with physical therapy, medical optimization and adductor canal block. After discharge, all the patients received once-daily oral rivaroxaban (10 mg) for an additional 14 days.
Blood Sampling
Peripheral blood samples were drawn at the following time points: 1–3 days prior to operation (T1), second hour (T2), first (T3) and third day (T4) after the operation, respectively. All samples were placed on ice and centrifuged at 3500 rpm for 5 min. The plasma was frozen and stored at − 80 °C. Preoperative and postoperative samples were drawn to assess plasma D-dimer levels by the central laboratory of our hospital. Plasma PAI-1, TAT and F1 + 2 levels were measured by enzyme linked immunosorbent assay (ELISA) using the Human PAI1 ELISA Kit (Abcam Inc, Toronto, ON, Canada), Human Thrombin-Antithrombin Complex ELISA Kit (Abcam Inc, Toronto, ON, Canada) and Human Prothrombin Fragment 1 + 2 ELISA Kit (Novus Biologicals, CO, USA), respectively.
Diagnosis of VTE and Follow - up
All patients received ultrasound examination of the lower extremity blood vessels 3-5 days and 2 weeks after surgery by one radiologist. If an occurrence of DVT was confirmed by ultrasound examination or pulmonary embolism (PE) symptoms (including chest pain, unexplained loss of consciousness, sharp decrease of blood pressure or oxygen saturation) manifested, the patient received a CT pulmonary angiography (CTPA) to further determine the diagnosis of PE. Patients with DVT or PE were treated according to the treatment routine of our hospital, including consultation of relevant departments, antithrombin therapy and imaging reexamination. Patients were invited to the outpatient clinic 2 weeks and 1, 2 and 3 months after the operation to assess and record the complications.
Statistical Analysis
The statistical analysis was performed by using SPSS V.25.0 software and Medcalc V.15.0 software. The continuous variables were summarized using mean ± standard deviation (SD), categorical variables were summarized using frequency (percentage). Normality of data was tested by the Kolmogorov-Smirnov test. The mean values of D-dimer, PAI-1, TAT, and F1 + 2 plasma levels of time point were calculated for patients with and without VTE (VTE + group vs VTE– group). Between-group comparisons were performed using the Student t test. For dichotomous variables, the chi-square test was used. Results were deemed significant with p <0.05. For evaluation of plasma D-dimer, PAI-1, TAT, and F1 + 2 level discrimination points, a receiver–operating characteristic curve (ROC) analysis was conducted and the cutoff value was determined according to the maximization of the Youden index (J). Sensitivity, specificity, positive and negative predictive values (PPV and NPV), and positive and negative likelihood ratios (LR + and LR–) were also calculated. Pairwise comparison of ROC curves was also performed to evaluate the diagnostic value of those markers.
Results
A total of 255 consecutive patients met the primary inclusion criteria, one patient declined to participate (n = 1) and 2 patients were excluded from the study because of other reasons (n = 2). Two hundred fifty-two patients were enrolled and signed the informed consent.
A total of sixty-three (25%) patients were diagnosed with DVT, of which 59 (93.6%) were calf intermuscular venous thrombosis (CIVT). A total of three (1.2%) patients were diagnosed with PE with routine CTPA screen after the diagnosis of DVT: one patient with CIVT, 1 patient with posterior tibial vein thrombosis and CIVT and 1 patient with posterior tibial vein and popliteal vein thrombosis.
Risk Factors for VTE
Clinical variables were assessed and analyzed for their potential impact regarding the occurrence of VTE (Table 1). A significant difference (P < 0.05) was demonstrated for duration tourniquet time and duration of anesthesia. In patients with VTE, the mean duration of tourniquet was 72.56 minutes, whereas it was 66.04 minutes in patients without VTE. The mean duration of anesthesia was 127.98 minutes in patients with VTE and 120.51 minutes in patients without VTE. There was no significant difference in the other clinical variables, including age, sex, body mass index (BMI), surgical side, and duration of surgery between the patients with and without VTE (p > 0.05).
Table 1.
Clinical Parameters of the VTE + and VTE– Subgroups.
| Variable | VTE + | VTE- | p value |
|---|---|---|---|
| Number of patients | 63 | 189 | |
| Age (years) † | 67.60 ± 6.41 | 66.47 ± 6.31 | 0.218 |
| Sex | |||
| Female | 54 | 146 | |
| Male | 9 | 43 | |
| % Female | 85.71% | 77.25% | 0.15 |
| BMI† | 26.20 ± 3.67 | 25.94 ± 3.69 | 0.68 |
| Surgical side | |||
| Left | 30 | 104 | |
| Right | 33 | 85 | |
| % Left | 47.62% | 55.03% | 0.31 |
| Duration of surgery (min) † | 82.56 ± 16.83 | 85.07 ± 14.80 | 0.26 |
| Duration of tourniquet (min) † | 72.56 ± 12.42 | 66.04 ± 9.96 | < 0.001 |
| Duration of anesthesia (min) † | 127.98 ± 2.73 | 120.51 ± 18.69 | 0.01 |
VTE + , patients with venous thromboembolism; VTE–, patients without venous thromboembolism; BMI, body mass index. † The values are given as the mean and SD. * Using chi-square test for sex and surgical side, and Student t test for the others.
Comparison of Plasma D-Dimer, PAI-1, TAT, and F1 + 2 Levels
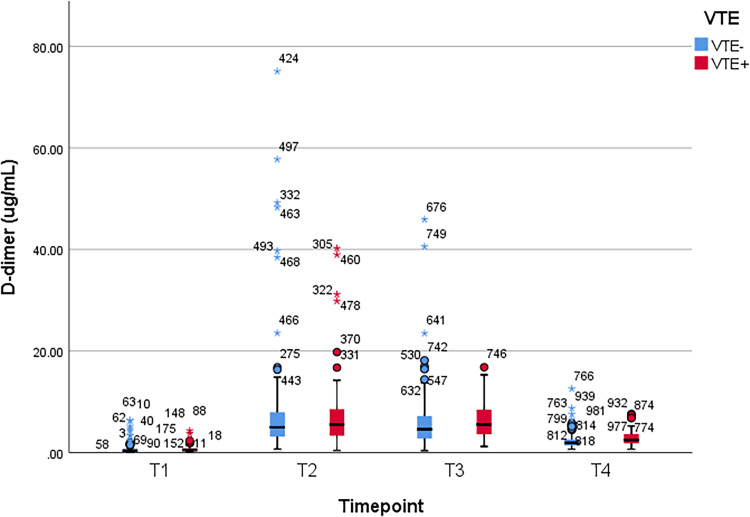
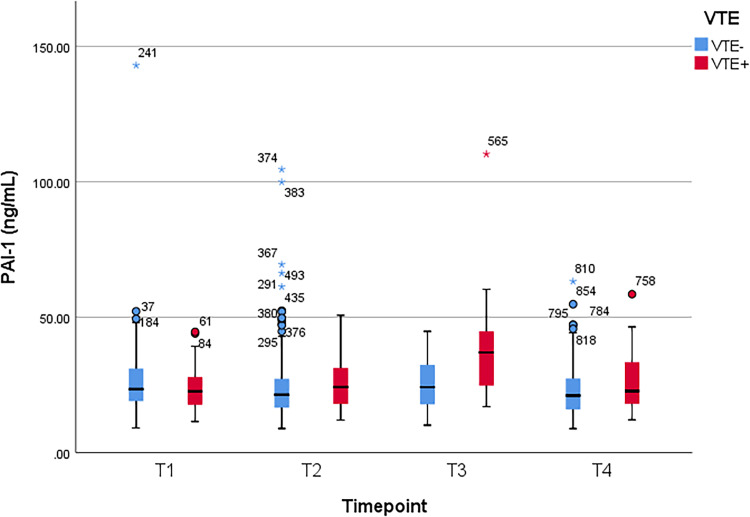
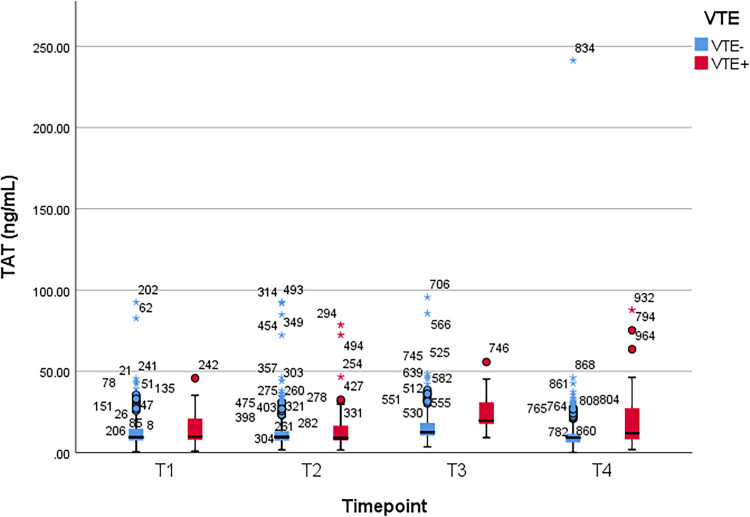
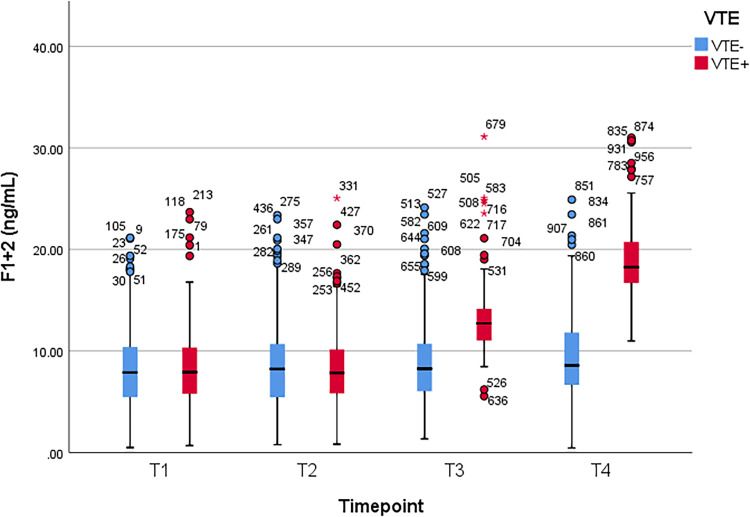
Between patients with and without VTE, Student t test was used to compare the mean values of plasma D-dimer, PAI-1, TAT, and F1 + 2 levels, which were obtained at the following time points: 1–3 days prior to operation (T1), second hour (T2), first (T3) and third day (T4) after the operation, respectively. A significant difference of D-dimer level was observed at T4 (p = 0.01). Significant differences of PAI-1, TAT, and F1 + 2 levels were observed at T3 and T4 (p < 0.001 and p = 0.04 for PAI-1, p < 0.001 and p = 0.005 for TAT, and p < 0.001 at both time points for F1 + 2). There was no significant difference at other time points (p > 0.05) (Table 2). Figure 1, Figure 2, Figure 3, and Figure 4 show the boxplots of D-dimer, PAI-1, TAT, and F1 + 2 levels over time, respectively.
Table 2.
Comparison of D-Dimer, PAI-1, TAT, and F1 + 2 Levels in the VTE + and VTE- Subgroups.
| T1 | T2 | T3 | T4 | |||||
|---|---|---|---|---|---|---|---|---|
| VTE | VTE + | VTE- | VTE + | VTE- | VTE + | VTE- | VTE + | VTE- |
| D-dimer (ug/mL) | ||||||||
| Mean (± SD) | 0.76 ± 0.78 | 0.68 ± 0.95 | 7.9 ± 8.18 | 7.16 ± 9.08 | 6.48 ± 3.66 | 5.78 ± 5.29 | 2.94 ± 1.59 | 2.37 ± 1.53 |
| P value† | 0.54 | 0.56 | 0.34 | 0.01 | ||||
| PAI-1 (ng/mL) | ||||||||
| Mean (± SD) | 23.33 ± 7.61 | 25.73 ± 12.57 | 25.44 ± 9.14 | 24.54 ± 13.15 | 37.05 ± 14.47 | 25.13 ± 8.81 | 25.56 ± 10.09 | 22.77 ± 8.87 |
| P value† | 0.15 | 0.61 | < 0.001 | 0.04 | ||||
| TAT (ng/mL) | ||||||||
| Mean (± SD) | 13.9 ± 10.13 | 13.57 ± 11.93 | 14.42 ± 14.15 | 14.09 ± 13.85 | 23.67 ± 10.33 | 16.78 ± 11.92 | 20.07 ± 17.06 | 12.55 ± 18.76 |
| P value† | 0.84 | 0.87 | < 0.001 | 0.005 | ||||
| F1 + 2 (ng/mL) | ||||||||
| Mean (± SD) | 8.93 ± 5.11 | 8.51 ± 4.52 | 8.99 ± 5.16 | 8.87 ± 4.64 | 13.75 ± 4.9 | 9.05 ± 4.54 | 19.45 ± 4.78 | 9.55 ± 4.60 |
| P value† | 0.54 | 0.86 | < 0.001 | < 0.001 | ||||
PAI-1, plasminogen activator inhibitor-1; TAT, thrombin–antithrombin; F1 + 2, prothrombin fragment F1 + 2; VTE, venous thromboembolism; T1, preoperative 1-3 days; T2, 2 hours after surgery; T3, postoperative day 1; T4, postoperative day 3. † Using Student t test.
Figure 1.
Boxplot of D-dimer levels over time. VTE, venous thromboembolism; T1, preoperative 1-3 days; T2, 2 hours after surgery; T3, postoperative day 1; T4, postoperative day 3.
Figure 2.
Boxplot of plasminogen activator inhibitor-1 (PAI-1) levels over time. VTE, venous thromboembolism; T1, preoperative 1-3 days; T2, 2 hours after surgery; T3, postoperative day 1; T4, postoperative day 3.
Figure 3.
Boxplot of thrombin–antithrombin (TAT) levels over time. VTE, venous thromboembolism; T1, preoperative 1-3 days; T2, 2 hours after surgery; T3, postoperative day 1; T4, postoperative day 3.
Figure 4.
Boxplot of prothrombin fragment F1 + 2 (F1 + 2) levels over time. VTE, venous thromboembolism; T1, preoperative 1-3 days; T2, 2 hours after surgery; T3, postoperative day 1; T4, postoperative day 3.
Determination of Cutoff Values and Comparison of Diagnostic Values
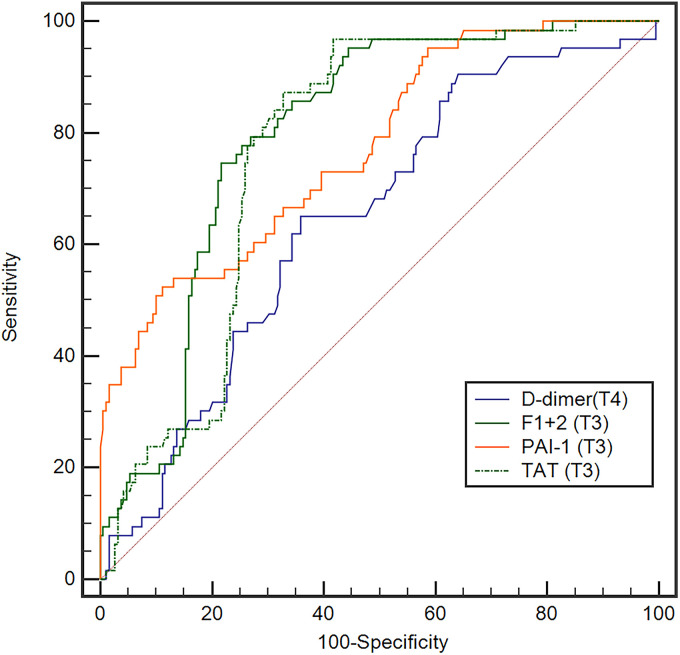
The discrimination points were evaluated for plasma D-dimer, PAI-1, TAT, and F1 + 2 levels on values with initial significant differences, they were D-dimer level at T4, PAI-1, TAT, and F1 + 2 levels at T3. A ROC analysis was used to evaluate plasma D-dimer level at T4 and PAI-1, TAT, and F1 + 2 levels at T3. The area under the curve (AUC) of those markers at the time points were 0.645, 0.773, 0.771, and 0.797, respectively (Figure 5). According to the maximization of the Youden index, the cutoff value of D-dimer level at T4, PAI-1, TAT, and F1 + 2 levels at T3 were 2.24 ug/mL, 35.96 ng/mL, 3.36 ng/mL, and 11.1 ng/mL, respectively. The sensitivity, specificity, Youden index, PPV, NPV, LR + , and LR- of the commonly used clinical thresholds of D-dimer (0.5 ug/mL) and each determined cutoff value were calculated separately (Table 3). Pairwise comparison of ROC curves showed that, compared with D-dimer on T4, there were significant differences for PAI-1, TAT and F1 + 2 levels on T3 (p < 0.05), and there was no significant difference among PAI-1, TAT and F1 + 2 levels on T3 (p > 0.05) (Table 4).
Figure 5.
The receiver operating characteristic curves for D-dimer level on postoperative day 3, PAI-1, TAT, and F1 + 2 levels on postoperative day 1.
Table 3.
The cutoff values of D-dimer, PAI-1, TAT, and F1 + 2 levels.
| Variable | AUC | Cutoff value | Se, % | Sp, % | J | PPV, % (95% CI) |
NPV, % (95% CI) |
LR + (95% CI) | LR– (95% CI) |
|---|---|---|---|---|---|---|---|---|---|
| D-dimer (ug/mL, T4) | - | 0.5 | 100 | 0.5 | 0.005 | 25.00 (20.06-30.69) |
- | 1.0 (1.0 - 1.0) |
0.5 |
| D-dimer (ug/mL, T4) | 0.645 | 2.24 | 65.08 | 64.02 | 0.291 | 37.61 (28.66 - 47.44) |
84.62 (77.42 - 89.91) |
1.81 (1.4 - 2.4) | 0.55 (0.4 - 0.8) |
| PAI-1 (ng/mL, T3) | 0.773 | 35.96 | 52.38 | 88.89 | 0.413 | 61.11 (46.87 - 73.77) |
84.85 (78.92 - 89.39) |
4.71 (3.0 - 7.5) | 0.54 (0.4 - 0.7) |
| TAT (ng/mL, T3) | 0.771 | 13.36 | 96.83 | 58.20 | 0.550 | 43.57 (35.30 - 55.20) |
98.21 (93.06 - 99.69) |
2.32 (1.9 - 2.8) | 0.055 (0.01 - 0.2) |
| F1 + 2 (ng/mL, T3) | 0.797 | 11.1 | 74.60 | 78.31 | 0.529 | 53.41 (42.51 - 64.01) |
90.24 (84.28 - 94.14) |
3.44 (2.5 - 4.7) | 0.32 (0.2 - 0.5) |
PAI-1, plasminogen activator inhibitor-1; TAT, thrombin–antithrombin; F1 + 2, prothrombin fragment F1 + 2; T3, postoperative day 1; T4, postoperative day 3; AUC, area under the curve; Se, sensitivity; Sp, specificity; J, Youden index; PPV, positive predictive value; NPV, negative predictive value; LR + , positive likelihood ratio; LR–, negative likelihood ratio; 95% CI, 95% confidence interval.
Table 4.
Pairwise comparison of receiver–operating characteristic curves.
| Variable | D-dimer (T4) | PAI-1 (T3) | TAT (T3) | F1 + 2 (T3) |
|---|---|---|---|---|
| AUC | 0.645 | 0.773 | 0.771 | 0.797 |
| p value | ||||
| PAI-1 (T3) | 0.009 | |||
| TAT (T3) | 0.015 | 0.968 | ||
| F1 + 2 (T3) | 0.004 | 0.606 | 0.359 |
PAI-1, plasminogen activator inhibitor-1; TAT, thrombin–antithrombin; F1 + 2, prothrombin fragment F1 + 2; T3, postoperative day 1; T4, postoperative day 3; AUC, area under the curve.
Discussion
VTE, including DVT and PE, is a common complication following TKA and can lead to morbidity and mortality, as well as considerable healthcare costs. 12 Therefore, it's important to investigate convenient and efficient screening markers for VTE after TKA, the present study provides several insights. First, the results of the present study confirmed that TKA procedure raises plasma D-dimer, PAI-1, TAT, and F1 + 2 levels in a predictable way, and VTE leads to higher levels. Second, plasma PAI-1, TAT and F1 + 2 levels have greater accuracy in diagnosing VTE compared with D-dimer levels.
The results of this study showed that the occurrence of VTE was associated with the duration of tourniquet and duration of anesthesia, but not with patient's age, sex, BMI, surgical side, or duration of surgery. Previous studies have described a variety of risk factors of VTE, including previous VTE, advanced age and obesity, immobility, and prolonged immobilization,13,14 however, the significance of these risk factors in patients undergoing TKA remains to be determined. 4 Recently, Alisina Shahi et al have demonstrated obesity and weight loss to be risk factors in total joint arthroplasty patients from United States. 15 The results of the present study are inconsistent with Alisina Shahi's finding. The patients’ mean BMI in this study was 26.20 (range 18.89-35.56) in the VTE + group and 25.94 (range 17.58-38.87) in the VTE- group, 5 patients in each of the two groups had a BMI below 20, and 5 patients in the VTE + group and 22 in the VTE- group had a BMI higher than 30. We consider this contradiction is caused by the low number of patients overweight and underweight. Application of tourniquet in TKA procedure may lead to venous stasis and an increased risk of endothelial injury, 1 which are two of three underlying etiologic factors of VTE, thus, longer tourniquet use may lead to a higher incidence of VTE. General anesthesia decreases the calf blood flow and venous capacity intraoperatively and for 3 hours postoperatively, 16 this may explain the association between the occurrence of VTE and duration of anesthesia.
The breaking down of an intravascular clot leads to the presence of D-dimer in the blood, 17 some other conditions, such as increased age, tissue injury and infection, also lead to the elevation in D-dimer levels.6,7,18,19 For patients undergoing TKA, in addition to thrombosis, advanced age and soft tissue injured by the procedure may elevate the plasma D-dimer level, which in turn led to a significant difference between the VTE + and VTE- groups occurring on the third postoperative day in this study. Several studies have demonstrated that postoperative levels of PAI-1, TAT and F1 + 2 were increased than preoperative values and the systemic PAI-1, TAT and F1 + 2 levels were increased after tourniquet deflation in TKA,8,11,20 implying those biomarkers are initially formatted in the surgical area rather than systemic circulation, and released into the systemic circulation after tourniquet deflation. The results of this study showed that the AUC of D-dimer level on the third postoperative day was 0.645, and the sensitivity, specificity and Youden index of clinically used cutoff value of D-dimer (0.5 ug/mL) were 100%, 0.5% and 0.005, respectively, indicating a limited value in predicting venous thromboembolism, whereas the AUCs of PAI-1, TAT and F1 + 2 levels on the first postoperative day were 0.773, 0.771 and 0.797, respectively. And pairwise comparison of ROC curves revealed that D-dimer level at T4 had the lowest diagnostic accuracy (compared with PAI-1, TAT and F1 + 2 levels), whereas PAI-1, TAT and F1 + 2 levels had similar diagnostic accuracy (p > 0.05).
Our study has several limitations. First, we diagnosed DVT or PE with ultrasound examination or CTPA, however, venography is considered as the gold standard for diagnosis of VTE. Because of the invasiveness, technical difficulties, and risks (eg, hematoma, pain, vessel damage, allergic reaction to contrast media), ultrasonography and CTPA have become the most commonly employed imaging modality for diagnosing DVT and PE, 21 thus, we believe that our results were reliable. Second, our finding partially contradicts other studies13–15 that have demonstrated a higher risk of VTE in patients with advanced age and obesity, thus further studies are needed. Third, the sample our study was rather small, especially the patients diagnosed with VTE, further studies with larger sample size are needed.
Conclusion
Using 2.24ug/mL as the threshold value of D-dimer is more accurate than using 0.5ug/mL in the monitoring of VTE after TKA. PAI-1, TAT and F1 + 2 levels are more valuable than D-dimer in predicting VTE after TKA. Duration of tourniquet and duration of anesthesia are highly significant risk factors for the development of VTE.
Footnotes
Declaration of Conflicting Interests: The author(s) declared no potential conflicts of interest with respect to the research, authorship, and/or publication of this article.
Funding: The author(s) disclosed receipt of the following financial support for the research, authorship, and/or publication of this article: This work was supported by: 1. Ningxia University Scientific Research Project (grant number NGY2020050); 2. Ningxia key R & D program key project: Basic Research and Clinical Application of Geriatric Orthopedic Diseases (grant number 2018BEG02005).
ORCID iD: Qunhua Jin https://orcid.org/0000-0003-1901-7905
References
- 1.Bawa H, Weick JW, Dirschl DR, Luu HH. Trends in deep vein thrombosis prophylaxis and deep vein thrombosis rates after total hip and knee arthroplasty. J Am Acad Orthop Surg. 2018;26(19):698‐705. [DOI] [PubMed] [Google Scholar]
- 2.Jacobs JJ, Mont MA, Bozic KJ, et al. American Academy of orthopaedic surgeons clinical practice guideline on: preventing venous thromboembolic disease in patients undergoing elective hip and knee arthroplasty. J Bone Joint Surg Am. 2012;94(8):746‐747. [DOI] [PMC free article] [PubMed] [Google Scholar]
- 3.Westrich GH, Haas SB, Mosca P, Peterson M. Meta-analysis of thromboembolic prophylaxis after total knee arthroplasty. J Bone Joint Surg Br. 2000;82(6):795‐800. [DOI] [PubMed] [Google Scholar]
- 4.Lieberman JR, Heckmann N. Venous thromboembolism prophylaxis in total hip arthroplasty and total knee arthroplasty patients: from guidelines to practice. J Am Acad Orthop Surg. 2017;25(12):789‐798. [DOI] [PubMed] [Google Scholar]
- 5.Righini M, Goehring C, Bounameaux H, Perrier A. Effects of age on the performance of common diagnostic tests for pulmonary embolism. Am J Med. 2000;109(5):357‐361. [DOI] [PubMed] [Google Scholar]
- 6.Tardy B, Tardy-Poncet B, Viallon A, et al. Evaluation of D-dimer ELISA test in elderly patients with suspected pulmonary embolism. Thromb Haemost. 1998;79(1):38‐41. [PubMed] [Google Scholar]
- 7.Johna S, Cemaj S, O’Callaghan T, Catalano R. Effect of tissue injury on D-dimer levels: a prospective study in trauma patients. Med Sci Monit. 2002;8(1):Cr5-8. [PubMed] [Google Scholar]
- 8.Watanabe H, Kikkawa I, Madoiwa S, Sekiya H, Hayasaka S, Sakata Y. Changes in blood coagulation-fibrinolysis markers by pneumatic tourniquet during total knee joint arthroplasty with venous thromboembolism. J Arthroplasty. 2014;29(3):569‐573. [DOI] [PubMed] [Google Scholar]
- 9.Geng B, Li S, Zhou J, Feng G. Correlation between PAI-1 rs1799889 polymorphism and venous thromboembolism: a meta-analysis of 48 case-control studies. Phlebology. 2020;35(7):472‐479. [DOI] [PubMed] [Google Scholar]
- 10.Aglietti P, Baldini A, Vena LM, Abbate R, Fedi S, Falciani M. Effect of tourniquet use on activation of coagulation in total knee replacement. Clin Orthop Relat Res. 2000 Feb;(371):169‐177. [DOI] [PubMed] [Google Scholar]
- 11.Sharrock NE, Go G, Sculco TP, Ranawat CS, Maynard MJ, Harpel PC. Changes in circulatory indices of thrombosis and fibrinolysis during total knee arthroplasty performed under tourniquet. J Arthroplasty. 1995;10(4):523‐528. [DOI] [PubMed] [Google Scholar]
- 12.Baser O. Prevalence and economic burden of venous thromboembolism after total hip arthroplasty or total knee arthroplasty. Am J Manag Care. 2011;17(1 Suppl):S6‐S8. [PubMed] [Google Scholar]
- 13.Anderson FA, Jr., Spencer FA. Risk factors for venous thromboembolism. Circulation. 2003;107(23 Suppl 1), I9–16. [DOI] [PubMed] [Google Scholar]
- 14.Caprini JA, Arcelus JI, Reyna JJ. Effective risk stratification of surgical and nonsurgical patients for venous thromboembolic disease. Semin Hematol. 2001;38(2 Suppl 5):12‐19. [DOI] [PubMed] [Google Scholar]
- 15.Shahi A, Bradbury TL, Guild GN, 3rd, Saleh UH, Ghanem E, Oliashirazi A. What are the incidence and risk factors of in-hospital mortality after venous thromboembolism events in total hip and knee arthroplasty patients? Arthroplast Today. 2018;4(3):343‐347. [DOI] [PMC free article] [PubMed] [Google Scholar]
- 16.Modig J, Malmberg P, Karlström G. Effect of epidural versus general anaesthesia on calf blood flow. Acta Anaesthesiol Scand. 1980;24(4):305‐309. [DOI] [PubMed] [Google Scholar]
- 17.Enderson BL, Chen JP, Robinson R, Maull KI. Fibrinolysis in multisystem trauma patients. J Trauma. 1991;31(9):1240‐1246. [DOI] [PubMed] [Google Scholar]
- 18.Pannu TS, Villa JM, Riesgo AM, Patel PD, Barsoum WK, Higuera-Rueda CA. Serum D-dimer in the diagnosis of periprosthetic knee infection: where are we today? J Knee Surg. 2020;33(2):106‐110. [DOI] [PubMed] [Google Scholar]
- 19.Lee YS, Lee YK, Han SB, Nam CH, Parvizi J, Koo KH. Natural progress of D-dimer following total joint arthroplasty: a baseline for the diagnosis of the early postoperative infection. J Orthop Surg Res. 2018;13(1):36. [DOI] [PMC free article] [PubMed] [Google Scholar]
- 20.Su EP, Mount LE, Nocon AA, Sculco TP, Go G, Sharrock NE. Changes in markers of thrombin generation and interleukin-6 during unicondylar knee and total knee arthroplasty. J Arthroplasty. 2018;33(3):684‐687. [DOI] [PMC free article] [PubMed] [Google Scholar]
- 21.Wilbur J, Shian B. Diagnosis of deep venous thrombosis and pulmonary embolism. Am Fam Physician. 2012;86(10):913‐919. [PubMed] [Google Scholar]


