

Abstract
OBJECTIVES:
Magnetic resonance elastography (MRE) is the most accurate method of liver stiffness measurement (LSM) in nonalcoholic fatty liver disease (NAFLD). We aimed to investigate the role of MRE in the prediction of hard outcomes in NAFLD.
METHODS AND RESULTS:
Adults with NAFLD who underwent MRE between 2007 and 2019 at Mayo Clinic, Rochester were identified. Cox regression analyses were used to explore the predictive role of baseline LSM for 1) development of cirrhosis in noncirrhotic NAFLD and 2) development of liver decompensation or death in those with compensated cirrhosis. A total of 829 NAFLD subjects (54% women, median age 58 years) were identified. Of 639 subjects without cirrhosis, 20 developed cirrhosis after a median follow-up of 4 years. Baseline LSM was predictive of future cirrhosis development: age-adjusted HR = 2.93 (95% CI, 1.86–4.62, p<.0001) per 1 kPa increment (C-statistic = 0.86). Baseline LSM by MRE can be used to guide timing of longitudinal noninvasive monitoring: 5, 3 and 1 years for LSM of 2, 3 and 4–5 kPa, respectively. Of 194 subjects with compensated cirrhosis, 81 developed decompensation or death after a median follow-up of 5 years. Baseline LSM was predictive of future decompensation or death: HR = 1.32 (95% CI, 1.13–1.56, p = .0007) per 1 kPa increment after adjusting for age, sex and MELD-Na. The 1-year probability of future decompensation or death in cirrhosis with baseline LSM of 5 kPa vs 8 kPa is 9% vs 20%, respectively.
CONCLUSION:
In NAFLD, LSM by MRE is a significant predictor of future development of cirrhosis. These data expand the role of MRE in clinical practice beyond the estimation of liver fibrosis and provide important evidence that improves individualized disease monitoring and patient counseling.
Keywords: NASH, Biomarkers, Outcome, Progression, Monitoring
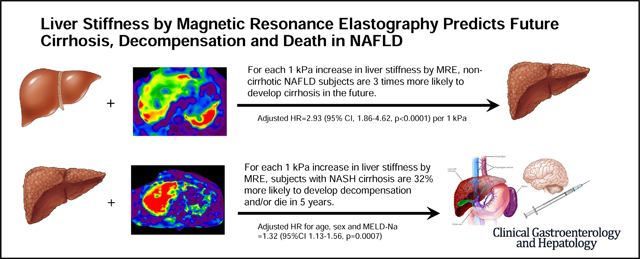
Graphical Abstract
Nonalcoholic fatty liver disease (NAFLD) affects a quarter of the population1,2 but progression to cirrhosis and liver-related complications occurs only in 15%–38% of those with nonalcoholic steatohepatitis, causing significant morbidity and increased mortality.3,4 However, there are no effective, noninvasive methods to identify individuals at high risk of progression. Such methods would have major implications in risk stratification and effective monitoring of the millions of individuals with NAFLD.
Fibrosis stage on histology has been shown to be a strong predictor of liver-associated outcomes.5 However, the liver biopsy is invasive, time-consuming, expensive, and less likely to be tolerated by patients, and has complication risks.6 Multiple studies have explored the prognostic utility of noninvasive serum and imaging (transient elastography) biomarkers of fibrosis, showing that values above specific cutoffs are at higher risk of mortality. Nevertheless, none of the studies demonstrated a direct reliable relationship between the marker and the future cirrhosis development in patients with NAFLD.7,8
Magnetic resonance elastography (MRE) emerged as the most accurate method to estimate liver fibrosis, with an area under the receiver-operating characteristic curve of 0.90 for all fibrosis stages,9 a success rate of 94.4%,10 and excellent reliability and reproducibility11 even in high body mass index,12 and thus is a safer noninvasive alternative to liver biopsy for fibrosis estimation.13 Nevertheless, it is not known whether baseline LSM by MRE is predictive of future development of cirrhosis and liver-associated outcomes. In NAFLD, the mortality risk due to cirrhosis and complication development has been estimated to be approximately 1%–2%.4 The lack of clinically available modalities to predict the risk and timing of future cirrhosis development represents a major gap in the individualized management and patient counseling.
In this study, we aimed to assess the role of LSM by MRE in (1) prediction of future cirrhosis development in noncirrhotic NAFLD and (2) prediction of development of liver-related complications and death in NAFLD cirrhosis.
Materials and Methods
Subjects and Definitions
This is a retrospective cohort study of all adults with NAFLD who underwent MRE between January 2007 and April 2019, as part of the routine clinical evaluation of NAFLD. At Mayo Clinic Rochester, MRE is the preferred method for noninvasive estimation of fibrosis since 2007, especially in patients with NAFLD, given its optimal accuracy in this etiology. MRE has been used for fibrosis estimation in NAFLD at initial assessment and in follow-up, irrespective of other biomarkers (Supplementary Methods). The study was approved by the Mayo Clinic Institutional Review Board. Among all individuals who underwent MRE, those with NAFLD were identified using a 2-step code-based algorithm (Supplementary Methods).
NAFLD etiology was validated by individual medical record review of a large sample of this cohort (detailed subsequently), using the following criteria for NAFLD definition:
Presence of steatosis on historical biopsy or imaging with coexistent metabolic comorbidities (obesity or diabetes mellitus) in the absence of competing etiologies (Supplementary Table 1) OR
Cirrhosis with current or previous evidence of steatosis on biopsy or imaging, with coexistent metabolic comorbidities (obesity or diabetes mellitus) in the absence of competing etiologies (Supplementary Table 1).
The final cohort was further divided into 2 groups, based on their status at the time of MRE: NAFLD without cirrhosis and NAFLD cirrhosis (Supplementary Figure 1). NAFLD cirrhosis was defined in 2 steps. First, we identified individuals with possible NAFLD cirrhosis if they met either 1 of the following criteria: International Classification of Diseases–Ninth Revision or –Tenth Revision codes for cirrhosis or decompensation (Supplementary Table 1) OR Fibrosis-4 (FIB-4) ≥2.67 OR LSM ≥3.6 kPa on MRE. Given that a single noninvasive and highly accurate criterion for cirrhosis definition does not exist, we used the previous set of complementary clinical criteria to capture cases that may have been missed by a single one. We used a low LSM threshold to maximize the case ascertainment despite the possibility of low specificity for cirrhosis. An LSM threshold of 3.6 kPa on MRE is the lowest threshold identified in previous studies for predicting fibrosis stage 3 of higher,14 with a 92% sensitivity and 90% specificity.15 The second step included individual chart review of all subjects with possible NAFLD cirrhosis identified per the criteria described previously. Confirmed NAFLD cirrhosis was defined by presence of at least 1 of the following criteria:
Histologic evidence of stage 4 fibrosis on biopsy (present in 62% of cases) OR
Imaging signs of portal hypertension (splenomegaly or portosystemic shunting) with or without cirrhotic morphology of the liver (surface nodularity, hypertrophy of the caudate lobe hypertrophy, right lobe atrophy) OR
Endoscopic evidence of portal hypertension (esophageal varices, portal hypertensive gastropathy)
All in the presence of the criteria used for the definition of NAFLD etiology described previously.
Decompensated cirrhosis was defined by evidence of at least 1 decompensation event of: esophageal variceal bleeding, ascites, hepatic encephalopathy or jaundice. Esophageal variceal bleeding was confirmed by upper endoscopy. and ascites was confirmed by imaging. Patients with cirrhosis and no evidence of decompensation per chart review were recorded as compensated cirrhosis. Patients without NAFLD confirmation, prior liver transplantation, or decompensation before MRE were excluded.
Participants who did not meet the previous criteria for cirrhosis or decompensation at the time of baseline MRE were classified as NAFLD without cirrhosis. The absence of cirrhosis was confirmed by individual chart review of a random sample of 30 subjects from cohort. The manual chart review confirmed noncirrhotic NAFLD in all 30 (100%) subjects. In this noncirrhotic sample, NAFLD was diagnosed based on evidence of hepatic steatosis, either by imaging (76%) or by histology (24%), in the setting of risk factors such as diabetes mellitus or high body mass index2 and in the absence of competing etiologies, including heavy alcohol use according to Centers for Disease Control and Prevention and National Institute on Alcohol Abuse and Alcoholism definition.
To assess the correlation between the LSM by MRE and histologic fibrosis stage, we identified all patients with liver biopsies obtained within 6 months of MRE. Cases with extremely discordant values such as high LSM and low fibrosis stage were re-reviewed by an experienced transplant hepatologist (A.M.A.), and other clinical surrogates of cirrhosis present within 6 months of MRE date were explored (imaging, endoscopic reports, platelet count).
Laboratory results within 30 days of MRE were extracted. Participant demographics and comorbidities at the time of MRE were recorded. NAFLD Fibrosis Score (NFS) and FIB-4 were calculated using the conventional formulas.16
Follow-up and Outcomes
Participants were followed from the date of first MRE until death, last clinical encounter, or study end (May 2019). The primary outcomes were (1) development of cirrhosis in those with noncirrhotic NAFLD at baseline MRE and (2) development of decompensation, liver transplantation or death in those with NAFLD cirrhosis at baseline MRE. All outcomes were assessed by individual chart review, using the same definitions and criteria for cirrhosis and decompensation. To avoid misclassification bias, we ascertained only outcomes that occurred at least 1 month after the baseline MRE and excluded patients with <30 days of follow-up.
Statistical Analysis
The cumulative incidence of cirrhosis and decompensation/transplantation or death was explored using Kaplan-Meier curves. Time 0 was chosen as the time of MRE. Decompensation, transplant, and death were grouped together due to their competing nature. Cox regression analysis was used to assess the predictive performance of LSM on outcomes. Penalized smoothing splines were used to explore the functional form of LSM on outcomes (Supplementary Figure 2). The hazard ratio (HR) for a 1-kPa increment for each group was calculated after adjustment for age at initial MRE for NAFLD individuals without cirrhosis; and multivariate adjustment for sex, age and Model for End-Stage Liver Disease Sodium (MELD-Na) for individuals with cirrhosis (details in Supplementary Methods).
All authors had access to the study data and reviewed and approved the final manuscript.
Results
Study Participants
Among 7672 adults who underwent MRE for evaluation of liver disease between 2007 and 2019, 6421 did not meet study inclusion criteria (Figure 1). From the remaining 1251 individuals with NAFLD, 704 had at least 1 criterion for possible cirrhosis and were individually reviewed. Subsequently, 149 were reclassified as noncirrhotic NAFLD and 361 were excluded for other reasons (prior liver transplant, decompensation at time of MRE, other etiology, or <30 days’ follow-up) (Figure 1). The final groups consisted of 639 adults with noncirrhotic NAFLD at baseline MRE (group A) analyzed for prediction of cirrhosis and 194 adults with confirmed compensated NAFLD cirrhosis (group B) analyzed for prediction of decompensation or death. Four subjects had 2 separate MREs, one in noncirrhotic stage and a second one after they developed cirrhosis, and were analyzed independently within each group, with time 0 starting at each MRE (n = 829).
Figure 1.

Flowchart of the cohort.
Baseline LSM Is Predictive of Future Cirrhosis Development in NAFLD
Group A (n = 639) had a median age of 56 (interquartile range, 46.1–63.7) years and 325 (51%) were female. The median LSM value was 2.8 (interquartile range, 2.3–3.4) kPa. Baseline characteristics are outlined in Table 1. During a median follow-up of 4 (range, 0.1–11.9) years, 20 subjects developed cirrhosis, with an overall incidence of approximately 1% per year (Figure 2A). The number of individuals within each LSM strata at baseline MRE and the corresponding number of those who developed cirrhosis subsequently are as follows: LSM <2.5 kPa (n = 220; 1 developed cirrhosis), 2.5–3.5 kPa (n = 275; 6 developed cirrhosis), 3.5–4.5 kPa (n = 113; 10 developed cirrhosis), 4.5–5.0 kPa (n = 31, 3 developed cirrhosis). It is important to note that the medical records of all patients with baseline LSM ≥3.5 kPa were reviewed in detail to determine appropriate classification at the time of MRE (absence of cirrhosis: group A; evidence of cirrhosis: group B); therefore, these data capture the true incidence of cirrhosis.
Table 1.
Baseline Characteristics of the NAFLD Cohorts at the Time of MRE
| NAFLD without cirrhosis: group A (n = 639) | NAFLD cirrhosis: group B (n = 194) | |
|---|---|---|
|
| ||
| Age, y | 56.0 (46.1 to 63.7) | 63.8 (55.7 to 69.3) |
| Sex | ||
| Female | 325 (50.9) | 123 (63.4) |
| Male | 314 (49.1) | 71 (36.6) |
| Race | ||
| White | 600 (93.9) | 186 (95.9) |
| All other races | 39 (6.1) | 8 (4.1) |
| BMI, kg/m2 | 32.8 (28.9 to 38.3) | 35.0 (31.0 to 39.6) |
| LSM, kPa | 2.8 (2.3 to 3.4) | 6.0 (4.9 to 7.4) |
| Total bilirubin, μmol/L | 0.5 (0.4 to 0.8) | 0.7 (0.4 to 1.1) |
| Albumin, g/L | 4.3 (4.0 to 4.6) | 4.0 (3.5 to 4.3) |
| AST, IU/L | 39.0 (27.0 to 61.0) | 51.0 (36.0 to 76.0) |
| ALT, IU/L | 57.0 (35.0 to 92.0) | 45.0 (29.0 to 76.0) |
| Platelets 109/L | 218.0 (174.0 to 267.0) | 144.0 (101.0 to 198.0) |
| Serum sodium, mEq/L | 141.0 (139.0 to 142.0) | 140.0 (138.0 to 142.0) |
| INR | 1.0 (1.0 to 1.1) | 1.1 (1.0 to 1.2) |
| Serum creatinine, mg/dL | 0.9 (0.7 to 1.0) | 0.8 (0.7 to 1.0) |
| FIB-4 score | 1.4 (0.9 to 2.0) | 3.4 (2.0 to 5.1) |
| NFS score | −1.1 (–2.2 to –0.0) | 1.4 (0.3 to 2.5) |
| MELD-Na | — | 8.0 (7.0 to 12.0) |
NOTE. Values are median (interquartile range) or n (%).
ALT, alanine aminotransferase; AST, aspartate aminotransferase; BMI, body mass index; FIB-4, Fibrosis-4; INR, international normalized ratio; LSM, liver stiffness measurement; MELD-Na, Model for End-Stage Liver Disease Sodium; MRE, magnetic resonance elastography; NAFLD, nonalcoholic fatty liver disease; NFS, NAFLD Fibrosis Score.
Figure 2.

Cumulative incidence of (A) cirrhosis and (B) decompensation or death.
Baseline LSM by MRE was predictive of future cirrhosis, with an HR of 2.87 (95% CI, 1.87–4.41; P < .0001) per 1 incremental kPa (Table 2), with a C-statistic of 0.83. Adjustment by age at baseline MRE did not modify the independent effect of LSM on future cirrhosis development: the adjusted HR was 2.93 (95% CI, 1.86–4.62; P < .0001) per 1-kPa difference in baseline LSM. Nevertheless, the discriminative performance of the model improved to 0.86. The predicted probabilities of future cirrhosis development by baseline LSM strata (eg, 1.51–2.5 kPa for line “kPa = 2”) adjusted for age are illustrated in Figure 3A.
Table 2.
Prediction of Future Cirrhosis Development in Noncirrhotic NAFLD and Decompensation or Death in Compensated NAFLD Cirrhosis Using LSM and Biomarkers
| Parameter | HR | 95% CI | P value | C-statistic | |
|---|---|---|---|---|---|
|
| |||||
| Unadjusted HR for 1-kPa change in LSM predicting cirrhosis | |||||
| LSM model | LSM (per 1 kPa) | 2.87 | 1.87–4.41 | <.0001 | 0.825 |
| Adjusted HR for 1-kPa change in LSM predicting cirrhosis | |||||
| LSM model | LSM (per 1 kPa) | 2.93 | 1.86–4.62 | <.0001 | 0.856 |
| Age (per decade) | 2.13 | 1.37–3.29 | .0007 | ||
| Adjusted HR for 1-kPa change in LSM predicting decompensation or death | |||||
| LSM model | LSM (per 1 kPa) | 1.32 | 1.13, 1.56 | .0007 | 0.703 |
| Age (per decade) | 1.53 | 1.16, 2.03 | .003 | ||
| Female | 0.62 | 0.38, 0.99 | .05 | ||
| MELD-Na | 1.03 | 0.98, 1.07 | .21 | ||
| NFS model | NFS | 1.31 | 1.12, 1.53 | .0007 | 0.701 |
| Age (per decade) | 1.41 | 1.07, 1.86 | .01 | ||
| Female | 0.58 | 0.36, 0.93 | .02 | ||
| MELD-Na | 1.02 | 0.97–1.07 | .43 | ||
| FIB-4 model | FIB-4 | 1.21 | 1.13–1.30 | <.0001 | 0.741 |
| Age (per decade) | 1.38 | 1.04–1.84 | .03 | ||
| Female | 0.59 | 0.37–0.95 | .03 | ||
| MELD-Na | 1.02 | 0.37–0.95 | .35 | ||
| LSM and FIB-4 model | LSM (per 1 kPa) | 1.21 | 1.02–1.43 | .03 | 0.751 |
| FIB-4 | 1.19 | 1.10–1.28 | <.0001 | ||
| Age (per decade) | 1.50 | 1.13–1.99 | .005 | ||
| Female | 0.63 | 0.39–1.02 | .06 | ||
CI, confidence interval; FIB-4, Fibrosis-4; HR, hazard ratio; LSM, liver stiffness measurement; MELD-Na, Model for End-Stage Liver Disease Sodium; MRE, magnetic resonance elastography; NAFLD, nonalcoholic fatty liver disease; NFS, NAFLD Fibrosis Score.
Figure 3.

Predicted probability of (A) cirrhosis development and (B) decompensation or death by baseline LSM strata. Each integer represents the range, ±0.5 kPa (eg, 1.51–2.5 kPa for stratum “LSM = 2 kPa”) except >8 kPa in panel B.
Baseline LSM by MRE Can Be Used to Guide Timing of Future Monitoring in NAFLD
Based on the previous predictive model, the probability of cirrhosis development in the subsequent years can be derived based on current LSM (Table 3). The >1% probability threshold of cirrhosis development is reached in 5 years by patients with LSM of 2 kPa, 3 years by patients with LSM of 3 kPa, and 1 year in those with 4 kPa and 5 kPa. These time frames inform about estimated time to progression to hard outcomes and provide guidance for subsequent noninvasive monitoring for disease progression. In the subset of patients with paired MRE and liver biopsy, LSM increased by 0.55 (95% CI, 0.27–0.84; P < .001) with each stage of fibrosis (Supplementary Material and Supplementary Table 2).
Table 3.
Age-Adjusted Probability of Future Events Based on LSM by MRE
| Years after MRE | LSM in cirrhosis development | ||||
|---|---|---|---|---|---|
|
| |||||
| 1 kPa | 2 kPa | 3 kPa | 4 kPa | 5 kPa | |
|
| |||||
| 1 | 0.08 | 0.21 | 0.60 | 1.78 | 5.26 |
| 2 | 0.13 | 0.35 | 1.00 | 2.92 | 8.39 |
| 3 | 0.22 | 0.61 | 1.71 | 4.89 | 13.45 |
| 4 | 0.32 | 0.85 | 2.38 | 6.72 | 17.81 |
| 5 | 0.39 | 1.05 | 2.93 | 8.16 | 21.07 |
| 6 | 0.53 | 1.42 | 3.93 | 10.73 | 26.46 |
| Years after MRE | LSM in decompensation or death development | |||||
|---|---|---|---|---|---|---|
|
| ||||||
| 3 kPa | 4 kPa | 5 kPa | 6 kPa | 7 kPa | ≥8 kPa | |
|
| ||||||
| 1 | 5 | 7 | 9 | 12 | 16 | 20 |
| 2 | 8 | 10 | 13 | 17 | 22 | 28 |
| 3 | 14 | 17 | 22 | 28 | 35 | 43 |
| 4 | 18 | 23 | 29 | 36 | 44 | 53 |
| 5 | 21 | 27 | 34 | 41 | 50 | 59 |
| 6 | 25 | 31 | 39 | 47 | 56 | 65 |
NOTE. Values are %.
LSM, liver stiffness measurement; MRE, magnetic resonance elastography.
The Role of LSM in the Prediction of Future Decompensation and Death in NAFLD Cirrhosis
Group B (n = 194) had median age of 64 (interquartile range, 55.7–69.3) years and 123 (63%) were female. The median LSM value at diagnosis was 6.0 (interquartile range, 4.9–7.4) kPa (Table 1). During a median follow-up of 4.4 (interquartile range, 0.1–11.9) years, 68 (35%) subjects had decompensation, 20 (10.3%) died after decompensation, and 13 (6.7%) subjects died without any decompensation event. Ascites (n = 30, 43%), variceal bleed (n = 2, 3%), hepatic encephalopathy (n = 20, 27%), and jaundice (n = 18, 26%) were the initial decompensation events. Two subjects had 2 and 1 subject had 3 different events at the time of decompensation.
The overall transition from compensated to decompensated cirrhosis or death was 7.1% per year and was highest in the first 4 years (10% per year) (Figure 2B). The number of participants and outcomes per LSM strata of 2.5–3.5 kPa, 3.5–4.5 kPa, 4.5–5.5 kPa, 5.5–6.5 kPa, 6.5–7.5 kPa, and >7.5 kPa are n = 5 (1 outcome), n = 29 (7 outcomes), n = 39 (12 outcomes), n = 42 (13 outcomes), n = 35 (20 outcomes, and n = 44 (28 outcomes), respectively.
Baseline MRE was predictive of future hepatic decompensation and death with an HR of 1.35 (95% CI, 1.15–1.59; P = .0002) per 1-kPa increment in LSM. After adjustment for age, sex, and MELD-Na at the time of MRE, LSM remained an independent predictor of decompensation and death (HR, 1.32; 95% CI, 1.13–1.56; P = .0007) (Table 2), with a C-statistic of 0.70. Among covariates, only age increased the risk of decompensation or death by 53% per each decade. The performance of other serum biomarkers such as NFS and FIB-4 in the prediction of decompensation or death was 0.70 and 0.74, respectively, when adjusted for other plausible risk factors. After adding LSM to the FIB-4 model, the predictive performance increased marginally to 0.75 (P = .03).
The predicted probabilities of decompensation or death by baseline LSM strata adjusted for age, sex, and MELD-Na are illustrated in Figure 3B. For example, the probability of decompensation or death in a patient with LSM of 5 kPa vs 8 kPa is 13% vs 28% at 2 years and 34% vs 59% at 5 years, respectively (Table 3). These data illustrate additional means of LSM use in the management of NAFLD cirrhosis, beyond the current indication of fibrosis estimation. In patients who meet the LSM threshold for noninvasive diagnosis of cirrhosis, the incremental value of LSM beyond this threshold has additional use in individualized prediction of complications and patient counseling. The concordance between LSM and histologic fibrosis stage in cirrhosis in a subset of 32 subjects with liver biopsies obtained within 6 months of MREs is shown in the Supplementary Material and Supplementary Table 3.
Discussion
This longitudinal study of a large NAFLD cohort demonstrates that the role of MRE in clinical practice can be expanded beyond accurate noninvasive estimation of liver fibrosis. In patients without cirrhosis, the liver stiffness value is an independent predictor of future cirrhosis development (C-statistic = 0.83), with an age-adjusted HR of 2.93 per each incremental kPa. In patients with compensated cirrhosis, the liver stiffness value is an independent predictor of decompensation, or death, with an HR of 1.35 for each incremental kPa. The liver stiffness measurement by MRE can be used to estimate disease severity, stratify the risk of cirrhosis development or decompensation events, and guide the management of patients who will need high vigilance to capture these outcomes and potentially prevent complications.
A few studies have examined the association between LSM and future events in patients with chronic liver disease, reporting HRs between 1.07 and 1.6517–21 and an LSM cutoff of 5.8 kPa associated with higher risk of decompensation. However, several limitations impact applicability of the results in NAFLD management in the clinic: heterogeneity of etiology with a small number of NAFLD patients, short follow-up time, limited number of events, and exclusion of patients without cirrhosis. Moreover, using a single LSM cutoff to risk stratify into “low” or “high” categories could represent a missed opportunity for individualized risk prediction at each stratum of baseline liver stiffness.
In patients without cirrhosis, baseline LSM can be used to guide disease surveillance and the timing of subsequent follow-up. In this cohort of 639 adults with NAFLD, patients with a baseline LSM of 1 or 2 kPa had ≤1% risk to develop cirrhosis in the following 5 years, and thus repeat elastography in a shorter time frame will not have a high yield. Those with LSM of 3 kPa should be considered for repeat elastography in 3 years, when the risk to develop cirrhosis was 1.71%. In contrast, patient with a baseline LSM of 4–5 kPa had a risk of progression to cirrhosis between 1.78% and 5.26% in 1 year, suggesting that surveillance elastography should be considered within this time frame in this stratum.
The subset of paired biopsies and MREs supported the effectiveness of MRE as a diagnostic tool with good correlation. Although outside of the limits of a clinical trial, the number of patients with liver biopsy obtained within 6 months of MRE was small (n = 64), and the findings are similar to previous studies and provide a validation of its correlation in the real world of clinical practice until large prospective studies with protocoled paired biopsies and MREs offer sufficient longitudinal follow-up to detect hard outcomes in NAFLD. Notably, among the 32 patients with cirrhosis defined by a combination of conventional methods (histologic or imaging), the liver biopsy underestimated cirrhosis in 7 of them, despite clear evidence of nodular liver and portal hypertension by cross-sectional imaging. In all these patients, the LSM was above 5 kPa. This underscores that relying on histology as the only objective criterion to establish disease severity with which other noninvasive methods of fibrosis estimation should be compared is limited and has to be cautiously explored beyond classic statistical parameters of concordance.
Liver stiffness corresponds to an intrinsic physical property of liver parenchyma, which correlates with fibrosis, the major driver for long-term outcome and mortality,5,22 but can provide a more granular risk stratification on a scale that is not confined to 4 histological stages of fibrosis or the dichotomized stratification of high vs low risk based on predetermined cutoffs of noninvasive serum biomarkers such as FIB-4 or NFS. Although the overall discriminative performance of LSM to predict future decompensation in NAFLD cirrhosis was not superior to the serum-based biomarkers in this dataset, MRE allows the unique individualized prediction of hard outcomes for each patient with cirrhosis, based on the current LSM. Expanding the use of LSM to a predictive parameter of future decompensation and death adds value in patient education and counseling, disease monitoring, and clinical trial design for upcoming therapies in nonalcoholic steatohepatitis cirrhosis. Two patients of similar age and sex, one with LSM of 5 kPa in the other with LSM of 8 kPa, should perhaps be managed differently. Although both have cirrhosis, their risk of decompensation or death in the following years differs considerably (9% vs 20% at 1 year); therefore, counseling therapeutic and preventative interventions should be tailored accordingly. Development of hepatocellular carcinoma is an important outcome in NAFLD with advanced fibrosis. However, this cohort had a low number of incident hepatocellular carcinoma cases after MRE: 1 subject in group A (4.1 kPa) and 10 subjects in group B (mean 7.8 kPa). These numbers are insufficient for a regression model that would allow adjustment for other key confounders (eg, age, sex) to confidently draw a conclusion on the predictive performance of MRE as an independent factor of hepatocellular carcinoma development.
This is the largest study to assess the predictive performance of MRE in NAFLD progression with the longest possible follow-up of clinical outcomes thus far. The Mayo Clinic was the first center to implement MRE as a clinical tool for noninvasive estimation of fibrosis in 2007, and since then, MRE was used as the preferred noninvasive method to estimate fibrosis in the routine clinical evaluation of patients with NAFLD. Additional strengths include ascertainment of cirrhosis and clinical outcomes by detailed review of each medical record of patients with high likelihood for cirrhosis, without reliance on a code based algorithm only; we expanded the analysis beyond cirrhosis to those with early disease, to assess the predictive performance of LSM for cirrhosis development, which was not previously described and is important in guiding surveillance timelines. Limitations include the retrospective design of the study, which may have led to missing outcomes in patients who have not returned for follow-up at our institution. However, this selection bias is unlikely to have a high impact on the main results because the progression rates from early disease to cirrhosis, as well as the rates decompensation are similar to those known from the literature. Although lack of paired liver biopsies can be considered a limitation in NAFLD research, they would not be possible in large databases of NAFLD individuals with long-term follow-up in a real-world scenario. Moreover, histologic interpretation is limited by interrater variability and spectrum bias within clinical trials and registries. Another limitation is the cost and the lack of availability of MRE, but we think that this will be less of an issue in near future as due to cheaper cost of technology and increasing magnetic resonance imaging capabilities. Standalone MRE exams are reimbursed under Medicare Category I Current Procedural Terminology code 76391 since January 2019, with a global cost of $240.02. Hence, the lower cost and shorter time (10 minutes) than a full abdominal MRI (30–45 minutes) makes the standalone MRE an increasingly accessible option.
These data expand the role of MRE from an accurate diagnostic method to a prognostic noninvasive imaging biomarker that can risk-stratify patients with NAFLD and guide the timing of surveillance and further refine their clinical management.
Supplementary Material
What You Need to Know?
Background
Liver stiffness measurement (LSM) by magnetic resonance elastography (MRE) is a noninvasive method with a very high accuracy in estimating liver fibrosis. It is not known whether LSM by MRE is predictive of future liver outcomes.
Findings
In patients without cirrhosis, MRE-based LSM is an independent predictor of cirrhosis development with high accuracy (C-statistic = 0.86). In patients with cirrhosis, LSM is an independent predictor of decompensation and death (C-statistic = 0.70) with a 32% higher risk of poor outcomes for each incremental unit of kPa.
Implications for patient care
These data expand the role of MRE beyond liver fibrosis estimation by adding a predictive feature to improve individualized disease monitoring and patient counseling. In patients without cirrhosis, LSM can guide disease surveillance and timing of longitudinal noninvasive monitoring in NAFLD.
Acknowledgments
Funding
Alina M. Allen is supported by the National Institute of Diabetes and Digestive and Kidney Diseases (K23DK115594) and a Junior Faculty Development Grant from the American College of Gastroenterology. Meng Yin is supported by the National Institutes of Health (EB017197, AA026887) and U.S. Department of Defense (W81XWH-19-1-0583-01). Richard L. Ehman is supported by the National Institutes of Health (EB001981).
Abbreviations used in this paper:
- CI
confidence interval
- FIB-4
Fibrosis-4
- HR
hazard ratio
- LSM
liver stiffness measurement
- MELD-Na
Model for End-Stage Liver Disease Sodium
- MRE
magnetic resonance elastog
- NAFLD
nonalcoholic fatty liver disease
- NASH
nonalcoholic steatohepatitis
- NFS
NAFLD Fibrosis Score
Footnotes
Conflicts of Interest
These authors disclose the following: The Mayo Clinic and Drs. Ehman and Yin have intellectual property and a financial interest related to this research. This research has been reviewed by the Mayo Clinic Conflict of Interest Review Board as is being conducted in compliance with Mayo Clinic Conflict of Interest policies. The remaining authors disclose no conflicts.
Supplementary Material
Note: To access the supplementary material accompanying this article, visit the online version of Clinical Gastroenterology and Hepatology at www.cghjournal.org, and at https://doi.org/10.1016/j.cgh.2020.09.044.
References
- 1.Fleming KM, Aithal GP, Card TR, et al. All-cause mortality in people with cirrhosis compared with the general population: a population-based cohort study. Liver Int 2012;32:79–84. [DOI] [PubMed] [Google Scholar]
- 2.Younossi ZM, Koenig AB, Abdelatif D, et al. Global epidemiology of nonalcoholic fatty liver disease: meta-analytic assessment of prevalence, incidence, and outcomes. Hepatology 2016;64:73–84. [DOI] [PubMed] [Google Scholar]
- 3.Calzadilla Bertot L, Adams LA. The natural course of non-alcoholic fatty liver disease. Int J Mol Sci 2016;17:774. [DOI] [PMC free article] [PubMed] [Google Scholar]
- 4.Adams LA, Lymp JF, St Sauver J, et al. The natural history of nonalcoholic fatty liver disease: a population-based cohort study. Gastroenterology 2005;129:113–121. [DOI] [PubMed] [Google Scholar]
- 5.Ekstedt M, Hagstrom H, Nasr P, et al. Fibrosis stage is the strongest predictor for disease-specific mortality in NAFLD after up to 33 years of follow-up. Hepatology 2015;61:1547–1554. [DOI] [PubMed] [Google Scholar]
- 6.Tapper EB, Lok AS-F. Use of liver imaging and biopsy in clinical practice. N Engl J Med 2017;377:756–768. [DOI] [PubMed] [Google Scholar]
- 7.Kang W, Kim SU, Ahn SH. Non-invasive prediction of forthcoming cirrhosis-related complications. World J Gastroenterol 2014;20:2613–2623. [DOI] [PMC free article] [PubMed] [Google Scholar]
- 8.Gawrieh S, Chalasani N. NAFLD fibrosis score: is it ready for wider use in clinical practice and for clinical trials? Gastroenterology 2013;145:717–719. [DOI] [PMC free article] [PubMed] [Google Scholar]
- 9.Loomba R, Wolfson T, Ang B, et al. Magnetic resonance elastography predicts advanced fibrosis in patients with nonalcoholic fatty liver disease: a prospective study. Hepatology 2014; 60:1920–1928. [DOI] [PMC free article] [PubMed] [Google Scholar]
- 10.Yin M, Glaser KJ, Talwalkar JA, et al. Hepatic MR elastography: clinical performance in a series of 1377 consecutive examinations. Radiology 2016;278:114–124. [DOI] [PMC free article] [PubMed] [Google Scholar]
- 11.Hines CD, Bley TA, Lindstrom MJ, et al. Repeatability of magnetic resonance elastography for quantification of hepatic stiffness. J Magn Reson Imaging 2010;31:725–731. [DOI] [PMC free article] [PubMed] [Google Scholar]
- 12.Hsu C, Caussy C, Imajo K, et al. Magnetic resonance vs transient elastography analysis of patients with nonalcoholic fatty liver disease: a systematic review and pooled analysis of individual participants. Clin Gastroenterol Hepatol 2019; 17:630–637.e8. [DOI] [PMC free article] [PubMed] [Google Scholar]
- 13.Venkatesh SK, Yin M, Ehman RL. Magnetic resonance elastography of liver: technique, analysis, and clinical applications. J Magn Reson Imaging 2013;37:544–555. [DOI] [PMC free article] [PubMed] [Google Scholar]
- 14.Dulai PS, Sirlin CB, Loomba R. MRI and MRE for non-invasive quantitative assessment of hepatic steatosis and fibrosis in NAFLD and NASH: clinical trials to clinical practice. J Hepatol 2016;65:1006–1016. [DOI] [PMC free article] [PubMed] [Google Scholar]
- 15.Cui J, Ang B, Haufe W, et al. Comparative diagnostic accuracy of magnetic resonance elastography vs. eight clinical prediction rules for non-invasive diagnosis of advanced fibrosis in biopsyproven non-alcoholic fatty liver disease: a prospective study.Aliment Pharmacol Ther 2015;41:1271–1280. [DOI] [PMC free article] [PubMed] [Google Scholar]
- 16.Sterling RK, Lissen E, Clumeck N, et al. Development of a simple noninvasive index to predict significant fibrosis in patients with HIV/HCV coinfection. Hepatology 2006;43:1317–1325. [DOI] [PubMed] [Google Scholar]
- 17.Singh S, Venkatesh SK, Wang Z, et al. Diagnostic performance of magnetic resonance elastography in staging liver fibrosis: a systematic review and meta-analysis of individual participant data. Clin Gastroenterol Hepatol 2015;13:440–451.e6. [DOI] [PMC free article] [PubMed] [Google Scholar]
- 18.Chen J, Talwalkar JA, Yin M, et al. Early detection of nonalcoholic steatohepatitis in patients with nonalcoholic fatty liver disease by using MR elastography. Radiology 2011; 259:749–756. [DOI] [PMC free article] [PubMed] [Google Scholar]
- 19.Rustogi R, Horowitz J, Harmath C, et al. Accuracy of MR elastography and anatomic MR imaging features in the diagnosis of severe hepatic fibrosis and cirrhosis. J Magn Reson Imaging 2012;35:1356–1364. [DOI] [PMC free article] [PubMed] [Google Scholar]
- 20.Godfrey EM, Patterson AJ, Priest AN, et al. A comparison of MR elastography and 31P MR spectroscopy with histological staging of liver fibrosis. Eur Radiol 2012;22:2790–2897. [DOI] [PubMed] [Google Scholar]
- 21.Asrani SK, Talwalkar JA, Kamath PS, et al. Role of magnetic resonance elastography in compensated and decompensated liver disease. J Hepatol 2014;60:934–939. [DOI] [PMC free article] [PubMed] [Google Scholar]
- 22.Angulo P, Kleiner DE, Dam-Larsen S, et al. Liver fibrosis, but no other histologic features, is associated with long-term outcomes of patients with nonalcoholic fatty liver disease. Gastroenterology 2015;149:389–397.e10. [DOI] [PMC free article] [PubMed] [Google Scholar]
Associated Data
This section collects any data citations, data availability statements, or supplementary materials included in this article.