

Abstract
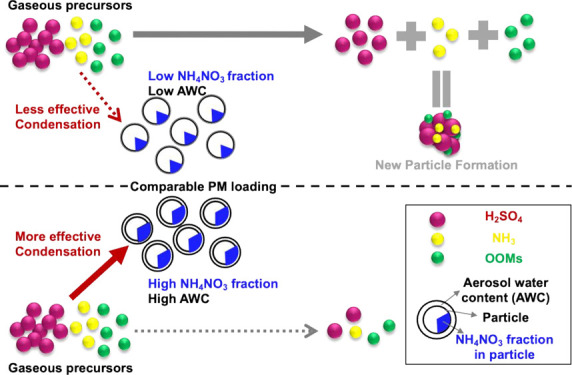
Relatively high concentrations of preexisting particles, acting as a condensation sink (CS) of gaseous precursors, have been thought to suppress the occurrence of new particle formation (NPF) in urban environments, yet NPF still occurs frequently. Here, we aim to understand the factors promoting and inhibiting NPF events in urban Beijing by combining one-year-long measurements of particle number size distributions and PM2.5 chemical composition. Our results show that indeed the CS is an important factor controlling the occurrence of NPF events, with its chemical composition affecting the efficiency of the background particles in removing gaseous H2SO4 (effectiveness of the CS) driving NPF. During our observation period, the CS was found to be more effective for ammonium nitrate-rich (NH4NO3-rich) fine particles. On non-NPF event days, particles acting as CS contained a larger fraction of NH4NO3 compared to NPF event days under comparable CS levels. In particular, in the CS range from 0.02 to 0.03 s–1, the nitrate fraction was 17% on NPF event days and 26% on non-NPF event days. Overall, our results highlight the importance of considering the chemical composition of preexisting particles when estimating the CS and their role in inhibiting NPF events, especially in urban environments.
Keywords: new particle formation, condensation sink, particles’ chemical composition, ammonium nitrate, urban environments
Introduction
Aerosol particles have significant effects on human health and climate.1−4 New particle formation (NPF), resulting from gas-to-particle conversion, has gained wide attention as it is one of the most important sources of atmospheric particles on a global scale.5−9 In the atmosphere, the major sink for gaseous precursors is their loss to the preexisting particle population, especially to particles in the accumulation mode size range.10,11 In practice, condensation sink (CS) describes how rapidly gaseous molecules are scavenged by preexisting aerosols.12,13
Previous studies have reported NPF events in both low-CS environments6 and rather polluted megacities in China and India.14−23 Although NPF is more likely to occur during clean episodes in these highly polluted megacities, the observed CS was still too high for NPF to occur according to theoretical calculations.9,10,24 A possible explanation could be that the scavenging of vapors responsible for the cluster formation and initial growth by available preexisting particles is less efficient than estimated.10,24 In general, the loss of a certain vapor could be affected by the characteristics of the preexisting particles. However, when the CS is calculated, traditionally, only the particle number size distribution (PNSD) is considered.25 This assumes that other factors such as the particles’ morphology, physical state, and chemical composition do not affect the CS. However, Tuovinen et al.26 showed theoretically that a larger contact angle leads to a possibly less efficient heterogeneous nucleation of a vapor consisting of sulfuric acid (H2SO4) and dimethylamine, resulting in a substantially reduced effective CS. Although the direct links between particle characteristics and the CS are still unknown, the contact angle of the heterogeneous nucleation, which is the initial step of condensation, is thought to strongly depend on the chemical composition of the preexisting particles.27
Thus, our aim is to identify the connection among the chemical composition of particles, CS effectiveness, and the occurrence of NPF events in Beijing, a polluted megacity. This is the first study that provides a plausible explanation for the influence of chemical composition on CS effectiveness using one-year-long urban environment ambient measurements.
Materials and Methods
Here, we combined measurements of PNSDs, chemical composition of PM2.5, gaseous precursors, and meteorological parameters in urban Beijing, China, from March 1, 2018, to March 1, 2019 (Table S1). The sampling site is located on the west campus of Beijing University of Chemical Technology (39°56′31″ N, 116°17′50″ E). A scanning mobility particle sizer (SMPS, model 3936, TSI), a differential mobility particle sizer (DMPS, custom built), and a neutral cluster and air ion spectrometer (NAIS, model 4-11, Airel) were deployed to measure the PNSDs (Text S1).28 Black carbon (BC) was measured using a seven-wavelength aethalometer (AE33, Magee Scientific Corp.), and the nonrefractory chemical compositions of fine particles (NR-PM2.5), including organics (Org), sulfate (SO4), nitrate (NO3), ammonium (NH4), and chloride (Chl), were measured using a time-of-flight aerosol chemical speciation monitor (ToF-ACSM, Aerodyne Research Inc.)29 (Text S2). Diffusion dryers were set up in front of these instruments to ensure dry sampling of the aerosol particles. Measured PM2.5 (NR-PM2.5 + BC) agreed well with mass concentrations converted from PNSDs, indicating that those instruments performed steadily and in parallel (Text S3).
In addition, a chemical ionization atmospheric pressure interface time-of-flight mass spectrometer (CI-APi-ToF, Aerodyne Research, Inc.) was used to measure H2SO4 (H2SO4meas) from December 26, 2018, to March 1, 2019 (Text S4).30 Alkenes were measured using a single-photon ionization time-of-flight mass spectrometer (SPI-MS 3000R, Hexin Mass Spectrometry) (Text S5). The concentrations of sulfur dioxide (SO2) and ozone (O3) were also monitored (model 43i and model 49i, respectively, Thermo). The global radiation (GlobRad) intensity was measured at the rooftop of the five-floor building using a CMP11 pyranometer.31 Detailed information about the sampling site and instruments’ operation is available in previous studies.11,18,32,33
Chemical-dependent hygroscopicity parameters (κ) were estimated following a simple mixing rule combining hygroscopicity of the individual dry particles’ components with their particle volume fraction (Text S6).34 Although the calculation of κ had uncertainties by assuming a constant κ for organics,35 our sensitivity tests suggested that this minor difference in κ caused by the secondary organic aerosols (SOA) can be neglected during our observation period (Texts S2 and S6). To calculate the mass concentration of the aerosol water content (AWC), a thermodynamic model, ISORROPIA version 2.1, based on inorganic aerosol components was used (Text S6).36
The CS is calculated from the PNSD as25
| 1 |
where D is the diffusion coefficient of the condensing vapor, in our case H2SO4.37,38Dp and N are the particle diameter and its corresponding number concentration, respectively. βM is the transitional regime correction factor.
NPF events were classified on the basis of the PNSD in which the appearance of fresh particles in the cluster and nucleation mode size ranges (<25 nm) showing signs of growth independent of the meteorological conditions during that day (Text S7).32,39,40
In addition, we estimated H2SO4 concentrations (H2SO4proxy) derived for Beijing by Dada et al.11 (Text S8). By assuming a steady state between H2SO4 production and loss, we can estimate H2SO4proxy:
| 2 |
where k1–k3 represent the coefficient of H2SO4 production term associated with daytime SO2–OH reaction, the coefficient of H2SO4 production via stabilized Criegee intermediates produced by the ozonolysis of alkenes mostly during nighttime, and the clustering coefficient, respectively. In this study, we used the values for k1–k3 previously determined for Beijing (2.0 × 10⁻⁸, 1.5 × 10⁻²⁹, and 7.0 × 10⁻⁹, respectively).11
Results and Discussion
CS and New Particle Formation Events
During our one -year observation period, the hourly averaged PM2.5 varied dramatically from 1 to 445 μg m–3 with a median concentration of 33 μg m–3 (Figure S2). Consistently, the hourly averaged CS varied from 0.0011 to 0.14 s–1 with a median value of 0.026 s–1. As expected, the CS was high concurrent with a high PM2.5 (Figure 1a). Although the high CS levels in Beijing were traditionally thought to suppress NPF, NPF events were observed on 122 of 306 days (40%), ranking Beijing among locations with the highest NPF frequency around the world.10,41 NPF in Beijing occurred during a daytime (from 10:00 to 15:00) average CS (CSdaytime-avg) between 0.002 and 0.06 s–1 with >98% of the events occurring when the CSdaytime-avg was <0.047 s–1 (corresponding to PM2.5 < 75 μg m–3). The variability in CSdaytime-avg was an important factor determining the occurrence of NPF events. When CSdaytime-avg was <0.008 s–1, the probability of NPF was >90%. The probability of NPF gradually decreased with an increase in CSdaytime-avg, to become 0% when CSdaytime-avg was >0.06 s–1 (Figure 1b). Thus, a CS of ∼0.06 s–1 appears to be the threshold for the NPF to occur in Beijing within our observation period. Fifty percent of the NPF events were observed when CSdaytime-avg was >0.01 s–1 in Beijing, and even 20% of the NPF events occurred when CSdaytime-avg was >0.02 s–1.
Figure 1.

Atmospheric aerosols, gaseous precursors, and the occurrence of new particle formation events. (a) Daytime average (from 10:00 to 15:00) PM2.5 concentration vs daytime average (from 10:00 to 15:00) condensation sink (CS). (b) Distribution of NPF event probability (red triangles, left axis) and accumulated NPF probability (dotted line, left axis), and the number of NPF event days (gray bars, right axis) as a function of daytime average (from 10:00 to 15:00) condensation sink (CS). (c) Concentration of SO2 as a function of CS during NPF (red) and non-NPF (black) days. Only daytime data (from 10:00 to 15:00) are considered. Within each box, which corresponds to a logarithmic CS bin, the median (middle horizontal line), mean (solid triangles), 25th and 75th percentiles (bottom and top ends of the box, respectively), and 10th and 90th percentiles (bottom and top whiskers, respectively) are shown. (d) Fraction of particle chemical composition and hygroscopicity parameter (triangle) as a function of condensation sink (CS). The gray dashed line refers to the 50% mass fraction.
The occurrence of NPF depends on the competition between vapor sources and their sinks.42 As shown in Figure 1c, the SO2 concentration increased with CSdaytime-avg, which is explained by similar sources of accumulation mode particles and SO2 : regional transport.32 A high level of SO2 has the potential to produce a higher level of H2SO4, which is the most important gaseous precursor driving the nucleation process.18,19,37 However, a high CS (CSdaytime-avg > 0.06 s–1) together with a low level of radiation (UVB < 0.3 W m–2) resulted in a decrease in H2SO4meas, shutting off NPF completely (Figures S5 and S6). Interestingly, both NPF event and non-NPF event days were observed under the same CSdaytime-avg levels in the range of 0.01–0.06 s–1, with varying NPF frequencies (from 60% to 10%). Within this moderate CSdaytime-avg, although non-NPF event days showed lower levels of UVB associated with low levels of solar radiation in winter, H2SO4meas was only slightly lower than or comparable to H2SO4meas on NPF event days. A comparable H2SO4 under lower UVB levels can be explained by the formation of H2SO4 from alkene and ozone reactions and the associated stabilized Criegee intermediate pathway, an important formation pathway in the winter in Beijing.11 Hence, H2SO4 can behave differently under similar CSs, resulting in NPF event and non-NPF event days.
Influence of the Chemical Composition on CS Effectiveness
In Beijing, the chemical composition of aerosol particles varied among different CSs, although all components increased with CS (Figure 1d and Figure S7). When the CS was <0.01 s–1, the fraction of organic and inorganic aerosols remained relatively stable: the organic fraction typically constituted 50–60% of the total particle mass. However, when the CS was >0.01 s–1, the mass fraction of secondary inorganic aerosols (SIA) increased significantly from ∼34% (CS = 0.01 s–1) to ∼61% (CS = 0.08 s–1) (Figure 1d). Accounting for ≤35% of the total mass, NO3 was the main contributor to the increasing SIA when the CS was >0.01 s–1, while the fraction of SO4 remained relatively stable. Such drastic changes in chemical compositions can affect the properties of the particles, e.g., hygroscopicity.34 While the particles’ hygroscopicity remained low at CSs of <0.01 s–1 (κ < 0.2), the particles became substantially more hygroscopic (κ increased from 0.18 to 0.33) with an increase in CS (Figure 1d). The increased hygroscopicity is driven by the increased ammonium nitrate (NH4NO3) fraction at an enhanced CS (Figure S8a). As a consequence, particles are more likely to absorb water and swell to larger sizes,43,44 which can further promote the uptake of gaseous vapors altering the effectiveness of CS (Text S9 and Figure S8). These observations suggest that the particles’ chemical composition affects the efficiency of the CS for both condensable and reactive uptake of vapor molecules.
To confirm this hypothesis and given that there is no direct way to measure the effectiveness of the CS for H2SO4 in the atmosphere, we estimate CS effectiveness by comparing H2SO4proxy to H2SO4meas. The ratio between H2SO4proxy and H2SO4meas (H2SO4proxy/H2SO4meas) during the daytime is a function of CS (Figure S9), which suggests that the effectiveness of the CS increases with the calculated CS. This observation implies that accounting for the effectiveness of CS by introducing an additional coefficient (αeff) is needed when estimating H2SO4proxy. Thus, H2SO4proxy/H2SO4meas can be expressed as (based on eq 2)
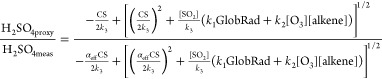 |
3 |
Equation 3 can be simplified to
| 4 |
where b is
| 5 |
Further, αeff can be calculated from eq 6:
| 6 |
The connection between factor αeff and H2SO4proxy/H2SO4meas is nonlinear but depends on the relative magnitudes of the H2SO4 sources and sinks in its budget equation (summarized in eq 5 as b). In theory, the CS is more effective at a higher H2SO4proxy/H2SO4meas under the condition that b remains constant as illustrated by Figure 2a. It should be noted that αeff, indicating the efficiency of the particles in removing vapors, is not the simple effectiveness of the CS, which represents the sticking probability, always <1.10,26 Because the CS was calculated from the dry PNSD rather than the wet PNSD in the atmosphere and αeff was estimated from H2SO4proxy/H2SO4meas, αeff could be >1 (Text S10).
Figure 2.

Effectiveness of a condensation sink (CS) under varying conditions. (a) Evolution of the ratio between the estimated H2SO4 (H2SO4proxy) and measured H2SO4 (H2SO4meas) concentration as a function of parameter αeff in theory. (b and c) Evolution of the ratio between the estimated H2SO4 (H2SO4proxy) and measured H2SO4 (H2SO4meas) concentration as a function of the CS and mass fraction of ammonium nitrate during our observation, respectively. (d) Connection between parameter αeff and the fraction of ammonium nitrate. αeff, indicating the efficiency of the particles in removing vapors, is estimated from eq 6 by comparing H2SO4proxy to H2SO4meas. The color changed from purple to red with b in eq 5 increasing from 0.01 to 100. Within each box, the mean (middle horizontal line), median (filled circles), 25th and 75th percentiles (bottom and top ends of the box, respectively), and 10th and 90th percentiles (bottom and top whiskers, respectively) are shown. Values with b ranging from 100.5 to 101.5 and an aerosol water content (AWC) of <1 are marked with crosses in panel c. The yellow lines in panels c and d are linear fittings of values with b ranging from 100.5 to 101.5.
Figure 2b shows the observed dependency of H2SO4proxy/H2SO4meas on CS. The H2SO4proxy/H2SO4meas and CS seem to be not correlated overall, while positive correlations were observed within constant b values. Considering a b value of 10 as a typical value during the whole period, when the CS was <0.01, H2SO4proxy/H2SO4meas was relatively stable (median value of ∼0.7) but increased to ∼4.0 when the CS increased to 0.06 s–1. In particular, this variation in H2SO4proxy/H2SO4meas appears to be associated with an increase in the NH4NO3 mass fraction, and a high positive correlation between log(H2SO4proxy/H2SO4meas) and the NH4NO3 fraction was observed [r2 = 0.9 (Figure 2c)]. Relying on H2SO4proxy/H2SO4meas, we could obtain the relationship between αeff and the NH4NO3 fraction (Figure 2d). Although the exact relationship depends on the varying b, all of them indicated that the effectiveness of CS increased with an increase in the NH4NO3 fraction. Here, we need to state that although other chemical compounds, e.g., SO4 and SOA, could also affect CS effectiveness, NH4NO3 plays a more dominant role in defining CS effectiveness during our observation period (Figure S10).
An increase in the NH4NO3 fraction results in a higher κ and hence an increased AWC. However, while H2SO4proxy/H2SO4meas overall increases at an enhanced AWC/PM2.5 ratio, the increase in hygroscopicity and AWC in the particles does not fully explain the increase in CS effectiveness (Figure S11). Under very low AWC (<1 μg m–3) and low-RH (<20%) conditions, the relation between H2SO4proxy/H2SO4meas and the NH4NO3 fraction remained consistent at a b value of 10 (Figure 2 and Figure S11). This implies that additional characteristics related to NH4NO3 (other than hygroscopicity) allow particles with a high NH4NO3 mass fraction to act as a more efficient sink for gaseous H2SO4. A possible explanation is that the surface of particles could become sticky due to a higher fraction of NH4NO3, which is a metastable liquid in the atmosphere.45,46
Influence of Chemical Composition and CS Effectiveness on NPF Occurrence
Because H2SO4 is the main driver of NPF in Beijing,18 the varying effectiveness of particles acting as CS for H2SO4 could be the determining factor for the occurrence of NPF events. When comparing NPF event and non-NPF event days within a comparable CSdaytime-avg range, we found that the nitrate mass fraction was generally higher on non-NPF event days than on NPF event days (Figure 3a,b). This difference in the nitrate fraction was particularly large in the CSdaytime-avg range from 0.02 to 0.03 s–1, in which the nitrate fraction was 17% on NPF event days and 26% on non-NPF event days. Driven by the higher nitrate fraction, κ was higher during non-NPF event days for the same CSdaytime-avg (Figure 3c), suggesting particles on non-NPF event days are more effective in taking up water vapors. Consistently, assuming that log(αeff) is a linear function of the NH4NO3 fraction during the daytime (Figure S9c), we found αeff was 7–18% higher during non-NPF event days than during NPF event days, and thus more effective removal of gaseous H2SO4 needed for NPF (Figure 3d). Although an AWC is not the driver behind the effectiveness of a CS, a higher AWC associated with a higher κ and a higher RH could also play a role in affecting CS effectiveness by providing a larger surface area and promoting heterogeneous reactions (Text S9). In summary, the NH4NO3 fraction in the background particles controls CS effectiveness, which in turn influences NPF in Beijing.
Figure 3.

Link among particles’ chemical composition, CS effectiveness, and the impact on NPF. (a) Chemical composition of preexisting particles during the daytime (from 10:00 to 15:00) and (b) difference in the chemical mass fraction of particles between NPF and non-NPF days under different condensation sinks (CSs) during the daytime (from 10:00 to 15:00). (c) Evolution of hygroscopicity (κ) on NPF and non-NPF days (left axis) and ratio of hygroscopicity parameter between non-NPF and NPF days (κnon-NPF/κNPF, right axis) as a function of CS during the daytime (from 10:00 to 15:00). (d) Evolution of αeff in NPF and non-NPF days (left axis) and ratio of parameter αeff between non-NPF and NPF days (αeffnon-NPF/αeffNPF, right axis) as a function of CS during the daytime (from 10:00 to 15:00).
Acknowledgments
The authors acknowledge the support of the Beijing University of Chemical Technology. This work was supported by ACCC Flagship funded by the Academy of Finland (337549), Wihuri Foundation, and the Jane and Aatos Erkko Foundation. This work was also supported by the Academy of Finland (1251427, 1139656, 296628, 306853, 316114, and 311932), Finnish centre of excellence Grants 1141135 and 307331, the EC Seventh Framework Program, and the European Union’s Horizon 2020 program (ERC, Project 742206 “ATM-GTP”, Project 850614 “CHAPAs”). K.R.D. received support from the Swiss National Science Foundation (P2EZP2_18159 and PZPGP2_201992). J.K. received funding from a UHEL three-year grant (75284132) and Finnish Academy of Science Project 1325656. S.H. acknowledges the doctoral program in atmospheric sciences (ATM-DP) of the University of Helsinki.
Supporting Information Available
The Supporting Information is available free of charge at https://pubs.acs.org/doi/10.1021/acs.estlett.2c00159.
Detailed sampling information and calculation methods that were applied in this study (Texts S1–S9), information about the instruments (Table S1), calculations of densities and hygroscopicity parameters used in this study (Table S2), parallel comparison of particle number size distribution measurements (Figure S1), time series of the condensation sink and particle mass (Figure S2), comparison between secondary organic aerosol concentrations from different methods (Figure S3), sensitive tests of hygroscopicity parameters (Figure S4), global radiation as a function of condensation sink (Figure S5), measured sulfuric acid as a function of condensation sink (Figure S6), chemical compositions of PM2.5 as a function of condensation sink (Figure S7), variations of aerosol water content, sulfur oxidation ratios, and condensation sink (Figure S8), effectiveness of the condensation sink during the daytime (Figure S9), influence of chemical compositions on condensation sink (Figure S10), aerosol water content and effectiveness of the condensation sink (Figure S11), and relative humidity, aerosol water content, and sulfur oxidation ratios as a function of condensation sink (Figure S12) (PDF)
Author Contributions
W.D. and J.C. contributed equally to this work. W.D. and L.D. designed the research. W.D., J.C., and K.R.D. analyzed the data. W.D., J.C., K.R.D., and L.D. wrote the manuscript. K.R.D., J.C., C.Y., Y.L., B.C., Y.Z., L.Y., F.Z., Y.G., L.M.H., X.F., Y.W., and T.C. performed the measurements for this study. W.D., J.C., K.R.D., C.Y., B.C., L.Y., R.C., S.H., J.K., S.T., T.P., J.K., F.B., P.P., Y.S., V.-M.K., and M.K. interpreted the results and revised the manuscript. M.K. supported and supervised this research. All authors have given approval to the final version of the manuscript.
The authors declare no competing financial interest.
Supplementary Material
References
- von Schneidemesser E.; Monks P. S.; Allan J. D.; Bruhwiler L.; Forster P.; Fowler D.; Lauer A.; Morgan W. T.; Paasonen P.; Righi M.; Sindelarova K.; Sutton M. A. Chemistry and the Linkages between Air Quality and Climate Change. Chem. Rev. 2015, 115 (10), 3856–97. 10.1021/acs.chemrev.5b00089. [DOI] [PubMed] [Google Scholar]
- Shiraiwa M.; Ueda K.; Pozzer A.; Lammel G.; Kampf C. J.; Fushimi A.; Enami S.; Arangio A. M.; Frohlich-Nowoisky J.; Fujitani Y.; Furuyama A.; Lakey P. S. J.; Lelieveld J.; Lucas K.; Morino Y.; Poschl U.; Takahama S.; Takami A.; Tong H.; Weber B.; Yoshino A.; Sato K. Aerosol Health Effects from Molecular to Global Scales. Environ. Sci. Technol. 2017, 51 (23), 13545–13567. 10.1021/acs.est.7b04417. [DOI] [PubMed] [Google Scholar]
- Daellenbach K. R.; Uzu G.; Jiang J.; Cassagnes L. E.; Leni Z.; Vlachou A.; Stefenelli G.; Canonaco F.; Weber S.; Segers A.; Kuenen J. J. P.; Schaap M.; Favez O.; Albinet A.; Aksoyoglu S.; Dommen J.; Baltensperger U.; Geiser M.; El Haddad I.; Jaffrezo J. L.; Prevot A. S. H. Sources of particulate-matter air pollution and its oxidative potential in Europe. Nature 2020, 587 (7834), 414–419. 10.1038/s41586-020-2902-8. [DOI] [PubMed] [Google Scholar]
- Du W.; Chen D.; Petäjä T.; Kulmala M. Air pollution: a more serious health problem than COVID-19 in 2020. Boreal Environ. Res. 2021, 26, 105–116. [Google Scholar]
- Chu B.; Kerminen V.-M.; Bianchi F.; Yan C.; Petäjä T.; Kulmala M. Atmospheric new particle formation in China. Atmospheric Chemistry and Physics 2019, 19 (1), 115–138. 10.5194/acp-19-115-2019. [DOI] [Google Scholar]
- Kulmala M.; Vehkamäki H.; Petäjä T.; Dal Maso M.; Lauri A.; Kerminen V. M.; Birmili W.; McMurry P. H. Formation and growth rates of ultrafine atmospheric particles: a review of observations. J. Aerosol Sci. 2004, 35 (2), 143–176. 10.1016/j.jaerosci.2003.10.003. [DOI] [Google Scholar]
- Kerminen V.-M.; Chen X.; Vakkari V.; Petäjä T.; Kulmala M.; Bianchi F. Atmospheric new particle formation and growth: review of field observations. Environ. Res. Lett. 2018, 13 (10), 103003. 10.1088/1748-9326/aadf3c. [DOI] [Google Scholar]
- Zhang R.; Khalizov A.; Wang L.; Hu M.; Xu W. Nucleation and growth of nanoparticles in the atmosphere. Chem. Rev. 2012, 112 (3), 1957–2011. 10.1021/cr2001756. [DOI] [PubMed] [Google Scholar]
- Kulmala M.; Petäjä T.; Kerminen V.-M.; Kujansuu J.; Ruuskanen T.; Ding A.; Nie W.; Hu M.; Wang Z.; Wu Z.; Wang L.; Worsnop D. R. On secondary new particle formation in China. Front. Environ. Sci. Eng. 2016, 10 (5), 8. 10.1007/s11783-016-0850-1. [DOI] [Google Scholar]
- Kulmala M.; Kerminen V. M.; Petaja T.; Ding A. J.; Wang L. Atmospheric gas-to-particle conversion: why NPF events are observed in megacities?. Faraday Discuss. 2017, 200, 271–288. 10.1039/C6FD00257A. [DOI] [PubMed] [Google Scholar]
- Dada L.; Ylivinkka I.; Baalbaki R.; Li C.; Guo Y.; Yan C.; Yao L.; Sarnela N.; Jokinen T.; Daellenbach K. R.; Yin R.; Deng C.; Chu B.; Nieminen T.; Wang Y.; Lin Z.; Thakur R. C.; Kontkanen J.; Stolzenburg D.; Sipilä M.; Hussein T.; Paasonen P.; Bianchi F.; Salma I.; Weidinger T.; Pikridas M.; Sciare J.; Jiang J.; Liu Y.; Petäjä T.; Kerminen V.-M.; Kulmala M. Sources and sinks driving sulfuric acid concentrations in contrasting environments: implications on proxy calculations. Atmospheric Chemistry and Physics 2020, 20 (20), 11747–11766. 10.5194/acp-20-11747-2020. [DOI] [Google Scholar]
- Kulmala M.; Dal Maso M.; Makela J. M.; Pirjola L.; Vakeva M.; Aalto P.; Miikkulainen P.; Hameri K.; O’Dowd C. D. On the formation, growth and composition of nucleation mode particles. Tellus B 2001, 53 (4), 479–490. 10.3402/tellusb.v53i4.16622. [DOI] [Google Scholar]
- Kerminen V. M.; Kulmala M. Analytical formulae connecting the “real” and the “apparent” nucleation rate and the nuclei number concentration for atmospheric nucleation events. J. Aerosol Sci. 2002, 33 (4), 609–622. 10.1016/S0021-8502(01)00194-X. [DOI] [Google Scholar]
- Du W.; Zhao J.; Wang Y.; Zhang Y.; Wang Q.; Xu W.; Chen C.; Han T.; Zhang F.; Li Z.; Fu P.; Li J.; Wang Z.; Sun Y. Simultaneous measurements of particle number size distributions at ground level and 260 m on a meteorological tower in urban Beijing, China. Atmospheric Chemistry and Physics 2017, 17 (11), 6797–6811. 10.5194/acp-17-6797-2017. [DOI] [Google Scholar]
- Wu Z.; Hu M.; Liu S.; Wehner B.; Bauer S.; Ma ßling A.; Wiedensohler A.; Petäjä T.; Dal Maso M.; Kulmala M. New particle formation in Beijing, China: Statistical analysis of a 1-year data set. J. Geophys. Res. 2007, 112 (D9), 797–806. 10.1029/2006JD007406. [DOI] [Google Scholar]
- Du W.; Dada L.; Zhao J.; Chen X.; Daellenbach K. R.; Xie C.; Wang W.; He Y.; Cai J.; Yao L.; Zhang Y.; Wang Q.; Xu W.; Wang Y.; Tang G.; Cheng X.; Kokkonen T. V.; Zhou W.; Yan C.; Chu B.; Zha Q.; Hakala S.; Kurppa M.; Järvi L.; Liu Y.; Li Z.; Ge M.; Fu P.; Nie W.; Bianchi F.; Petäjä T.; Paasonen P.; Wang Z.; Worsnop D. R.; Kerminen V.-M.; Kulmala M.; Sun Y. A 3D study on the amplification of regional haze and particle growth by local emissions. npj Clim. Atmos. Sci. 2021, 4 (1), 4. 10.1038/s41612-020-00156-5. [DOI] [Google Scholar]
- Kulmala M.; Dada L.; Daellenbach K. R.; Yan C.; Stolzenburg D.; Kontkanen J.; Ezhova E.; Hakala S.; Tuovinen S.; Kokkonen T. V.; et al. Is reducing new particle formation a plausible solution to mitigate particulate air pollution in Beijing and other Chinese megacities?. Faraday Discuss. 2021, 226, 334. 10.1039/D0FD00078G. [DOI] [PubMed] [Google Scholar]
- Yan C.; Yin R.; Lu Y.; Dada L.; Yang D.; Fu Y.; Kontkanen J.; Deng C.; Garmash O.; Ruan J.; Baalbaki R.; Schervish M.; Cai R.; Bloss M.; Chan T.; Chen T.; Chen Q.; Chen X.; Chen Y.; Chu B.; Dällenbach K.; Foreback B.; He X.; Heikkinen L.; Jokinen T.; Junninen H.; Kangasluoma J.; Kokkonen T.; Kurppa M.; Lehtipalo K.; Li H.; Li H.; Li X.; Liu Y.; Ma Q.; Paasonen P.; Rantala P.; Pileci R. E.; Rusanen A.; Sarnela N.; Simonen P.; Wang S.; Wang W.; Wang Y.; Xue M.; Yang G.; Yao L.; Zhou Y.; Kujansuu J.; Petäjä T.; Nie W.; Ma Y.; Ge M.; He H.; Donahue N. M.; Worsnop D. R.; Veli-Matti K.; Wang L.; Liu Y.; Zheng J.; Kulmala M.; Jiang J.; Bianchi F. The Synergistic Role of Sulfuric Acid, Bases, and Oxidized Organics Governing New-Particle Formation in Beijing. Geophys. Res. Lett. 2021, 48 (7), e2020GL091944. 10.1029/2020GL091944. [DOI] [Google Scholar]
- Yao L.; Garmash O.; Bianchi F.; Zheng J.; Yan C.; Kontkanen J.; Junninen H.; Mazon S. B.; Ehn M.; Paasonen P.; Sipila M.; Wang M. Y.; Wang X. K.; Xiao S.; Chen H. F.; Lu Y. Q.; Zhang B. W.; Wang D. F.; Fu Q. Y.; Geng F. H.; Li L.; Wang H. L.; Qiao L. P.; Yang X.; Chen J. M.; Kerminen V. M.; Petaja T.; Worsnop D. R.; Kulmala M.; Wang L. Atmospheric new particle formation from sulfuric acid and amines in a Chinese megacity. Science 2018, 361 (6399), 278–281. 10.1126/science.aao4839. [DOI] [PubMed] [Google Scholar]
- Xiao S.; Wang M. Y.; Yao L.; Kulmala M.; Zhou B.; Yang X.; Chen J. M.; Wang D. F.; Fu Q. Y.; Worsnop D. R.; Wang L. Strong atmospheric new particle formation in winter in urban Shanghai, China. Atmospheric Chemistry and Physics 2015, 15 (4), 1769–1781. 10.5194/acp-15-1769-2015. [DOI] [Google Scholar]
- Yue D. L.; Hu M.; Wang Z. B.; Wen M. T.; Guo S.; Zhong L. J.; Wiedensohler A.; Zhang Y. H. Comparison of particle number size distributions and new particle formation between the urban and rural sites in the PRD region, China. Atmos. Environ. 2013, 76, 181–188. 10.1016/j.atmosenv.2012.11.018. [DOI] [Google Scholar]
- Kanawade V. P.; Tripathi S. N.; Siingh D.; Gautam A. S.; Srivastava A. K.; Kamra A. K.; Soni V. K.; Sethi V. Observations of new particle formation at two distinct Indian subcontinental urban locations. Atmos. Environ. 2014, 96, 370–379. 10.1016/j.atmosenv.2014.08.001. [DOI] [Google Scholar]
- Gani S.; Bhandari S.; Patel K.; Seraj S.; Soni P.; Arub Z.; Habib G.; Hildebrandt Ruiz L.; Apte J. S. Particle number concentrations and size distribution in a polluted megacity: the Delhi Aerosol Supersite study. Atmospheric Chemistry and Physics 2020, 20 (14), 8533–8549. 10.5194/acp-20-8533-2020. [DOI] [Google Scholar]
- Yu H.; Ren L.; Kanawade V. P. New Particle Formation and Growth Mechanisms in Highly Polluted Environments. Current Pollution Reports 2017, 3 (4), 245–253. 10.1007/s40726-017-0067-3. [DOI] [Google Scholar]
- Kulmala M.; Petaja T.; Nieminen T.; Sipila M.; Manninen H. E.; Lehtipalo K.; Dal Maso M.; Aalto P. P.; Junninen H.; Paasonen P.; Riipinen I.; Lehtinen K. E.; Laaksonen A.; Kerminen V. M. Measurement of the nucleation of atmospheric aerosol particles. Nat. Protoc. 2012, 7 (9), 1651–67. 10.1038/nprot.2012.091. [DOI] [PubMed] [Google Scholar]
- Tuovinen S.; Kontkanen J.; Jiang J.; Kulmala M. Investigating the effectiveness of condensation sink based on heterogeneous nucleation theory. J. Aerosol Sci. 2020, 149, 105613. 10.1016/j.jaerosci.2020.105613. [DOI] [Google Scholar]
- Butt H.-J.; Graf K.; Kappl M.. Physics and chemistry of interfaces; John Wiley & Sons, 2013. [Google Scholar]
- Mirme S.; Mirme A. The mathematical principles and design of the NAIS - a spectrometer for the measurement of cluster ion and nanometer aerosol size distributions. Atmospheric Measurement Techniques 2013, 6 (4), 1061–1071. 10.5194/amt-6-1061-2013. [DOI] [Google Scholar]
- Fröhlich R.; Cubison M. J.; Slowik J. G.; Bukowiecki N.; Prévôt A. S. H.; Baltensperger U.; Schneider J.; Kimmel J. R.; Gonin M.; Rohner U.; Worsnop D. R.; Jayne J. T. The ToF-ACSM: a portable aerosol chemical speciation monitor with TOFMS detection. Atmospheric Measurement Techniques 2013, 6 (11), 3225–3241. 10.5194/amt-6-3225-2013. [DOI] [Google Scholar]
- Jokinen T.; Sipilä M.; Junninen H.; Ehn M.; Lönn G.; Hakala J.; Petäjä T.; Mauldin R. L.; Kulmala M.; Worsnop D. R. Atmospheric sulphuric acid and neutral cluster measurements using CI-APi-TOF. Atmospheric Chemistry and Physics 2012, 12 (9), 4117–4125. 10.5194/acp-12-4117-2012. [DOI] [Google Scholar]
- Gao W.; Tan G.; Hong Y.; Li M.; Nian H.; Guo C.; Huang Z.; Fu Z.; Dong J.; Xu X.; Cheng P.; Zhou Z. Development of portable single photon ionization time-of-flight mass spectrometer combined with membrane inlet. Int. J. Mass Spectrom. 2013, 334, 8–12. 10.1016/j.ijms.2012.09.003. [DOI] [Google Scholar]
- Zhou Y.; Dada L.; Liu Y.; Fu Y.; Kangasluoma J.; Chan T.; Yan C.; Chu B.; Daellenbach K. R.; Bianchi F.; Kokkonen T. V.; Liu Y.; Kujansuu J.; Kerminen V.-M.; Petäjä T.; Wang L.; Jiang J.; Kulmala M. Variation of size-segregated particle number concentrations in wintertime Beijing. Atmospheric Chemistry and Physics 2020, 20 (2), 1201–1216. 10.5194/acp-20-1201-2020. [DOI] [Google Scholar]
- Cai J.; Chu B.; Yao L.; Yan C.; Heikkinen L. M.; Zheng F.; Li C.; Fan X.; Zhang S.; Yang D.; Wang Y.; Kokkonen T. V.; Chan T.; Zhou Y.; Dada L.; Liu Y.; He H.; Paasonen P.; Kujansuu J. T.; Petäjä T.; Mohr C.; Kangasluoma J.; Bianchi F.; Sun Y.; Croteau P. L.; Worsnop D. R.; Kerminen V.-M.; Du W.; Kulmala M.; Daellenbach K. R. Size-segregated particle number and mass concentrations from different emission sources in urban Beijing. Atmospheric Chemistry and Physics 2020, 20 (21), 12721–12740. 10.5194/acp-20-12721-2020. [DOI] [Google Scholar]
- Wu Z. J.; Zheng J.; Shang D. J.; Du Z. F.; Wu Y. S.; Zeng L. M.; Wiedensohler A.; Hu M. Particle hygroscopicity and its link to chemical composition in the urban atmosphere of Beijing, China, during summertime. Atmospheric Chemistry and Physics 2016, 16 (2), 1123–1138. 10.5194/acp-16-1123-2016. [DOI] [Google Scholar]
- Zhao D. F.; Buchholz A.; Kortner B.; Schlag P.; Rubach F.; Kiendler-Scharr A.; Tillmann R.; Wahner A.; Flores J. M.; Rudich Y.; Watne Å. K.; Hallquist M.; Wildt J.; Mentel T. F. Size-dependent hygroscopicity parameter (κ) and chemical composition of secondary organic cloud condensation nuclei. Geophys. Res. Lett. 2015, 42 (24), 10920. 10.1002/2015GL066497. [DOI] [Google Scholar]
- Fountoukis C.; Nenes A. ISORROPIA II: a computationally efficient thermodynamic equilibrium model for K+-Ca2+-Mg2+-NH4+-Na+-SO42--NO3–-Cl–-H2O aerosols. Atmospheric Chemistry and Physics 2007, 7 (17), 4639–4659. 10.5194/acp-7-4639-2007. [DOI] [Google Scholar]
- Sipila M.; Berndt T.; Petaja T.; Brus D.; Vanhanen J.; Stratmann F.; Patokoski J.; Mauldin R. L.; Hyvarinen A. P.; Lihavainen H.; Kulmala M. The Role of Sulfuric Acid in Atmospheric Nucleation. Science 2010, 327 (5970), 1243–1246. 10.1126/science.1180315. [DOI] [PubMed] [Google Scholar]
- Berndt T.; Boge O.; Stratmann F.; Heintzenberg J.; Kulmala M. Rapid formation of sulfuric acid particles at near-atmospheric conditions. Science 2005, 307 (5710), 698–700. 10.1126/science.1104054. [DOI] [PubMed] [Google Scholar]
- Chu B.; Dada L.; Liu Y.; Yao L.; Wang Y.; Du W.; Cai J.; Dallenbach K. R.; Chen X.; Simonen P.; Zhou Y.; Deng C.; Fu Y.; Yin R.; Li H.; He X. C.; Feng Z.; Yan C.; Kangasluoma J.; Bianchi F.; Jiang J.; Kujansuu J.; Kerminen V. M.; Petaja T.; He H.; Kulmala M. Particle growth with photochemical age from new particle formation to haze in the winter of Beijing, China. Sci. Total Environ. 2021, 753, 142207. 10.1016/j.scitotenv.2020.142207. [DOI] [PubMed] [Google Scholar]
- Dada L.; Chellapermal R.; Buenrostro Mazon S.; Paasonen P.; Lampilahti J.; Manninen H. E.; Junninen H.; Petäjä T.; Kerminen V.-M.; Kulmala M. Refined classification and characterization of atmospheric new-particle formation events using air ions. Atmospheric Chemistry and Physics 2018, 18 (24), 17883–17893. 10.5194/acp-18-17883-2018. [DOI] [Google Scholar]
- Nieminen T.; Kerminen V.-M.; Petäjä T.; Aalto P. P.; Arshinov M.; Asmi E.; Baltensperger U.; Beddows D. C. S.; Beukes J. P.; Collins D.; Ding A.; Harrison R. M.; Henzing B.; Hooda R.; Hu M.; Hõrrak U.; Kivekäs N.; Komsaare K.; Krejci R.; Kristensson A.; Laakso L.; Laaksonen A.; Leaitch W. R.; Lihavainen H.; Mihalopoulos N.; Németh Z.; Nie W.; O’Dowd C.; Salma I.; Sellegri K.; Svenningsson B.; Swietlicki E.; Tunved P.; Ulevicius V.; Vakkari V.; Vana M.; Wiedensohler A.; Wu Z.; Virtanen A.; Kulmala M. Global analysis of continental boundary layer new particle formation based on long-term measurements. Atmospheric Chemistry and Physics 2018, 18 (19), 14737–14756. 10.5194/acp-18-14737-2018. [DOI] [Google Scholar]
- Kulmala M.; Kontkanen J.; Junninen H.; Lehtipalo K.; Manninen H. E.; Nieminen T.; Petaja T.; Sipila M.; Schobesberger S.; Rantala P.; Franchin A.; Jokinen T.; Jarvinen E.; Aijala M.; Kangasluoma J.; Hakala J.; Aalto P. P.; Paasonen P.; Mikkila J.; Vanhanen J.; Aalto J.; Hakola H.; Makkonen U.; Ruuskanen T.; Mauldin R. L.; Duplissy J.; Vehkamaki H.; Back J.; Kortelainen A.; Riipinen I.; Kurten T.; Johnston M. V.; Smith J. N.; Ehn M.; Mentel T. F.; Lehtinen K. E. J.; Laaksonen A.; Kerminen V. M.; Worsnop D. R. Direct Observations of Atmospheric Aerosol Nucleation. Science 2013, 339 (6122), 943–946. 10.1126/science.1227385. [DOI] [PubMed] [Google Scholar]
- Sun J.; Liu L.; Xu L.; Wang Y.; Wu Z.; Hu M.; Shi Z.; Li Y.; Zhang X.; Chen J.; Li W. Key Role of Nitrate in Phase Transitions of Urban Particles: Implications of Important Reactive Surfaces for Secondary Aerosol Formation. Journal of Geophysical Research: Atmospheres 2018, 123 (2), 1234–1243. 10.1002/2017JD027264. [DOI] [Google Scholar]
- Jing B.; Wang Z.; Tan F.; Guo Y.; Tong S.; Wang W.; Zhang Y.; Ge M. Hygroscopic behavior of atmospheric aerosols containing nitrate salts and water-soluble organic acids. Atmospheric Chemistry and Physics 2018, 18 (7), 5115–5127. 10.5194/acp-18-5115-2018. [DOI] [Google Scholar]
- Middlebrook A. M.; Bahreini R.; Jimenez J. L.; Canagaratna M. R. Evaluation of Composition-Dependent Collection Efficiencies for the Aerodyne Aerosol Mass Spectrometer using Field Data. Aerosol Sci. Technol. 2012, 46 (3), 258–271. 10.1080/02786826.2011.620041. [DOI] [Google Scholar]
- Yang X.; Ingham D.; Ma L.; Troiano M.; Pourkashanian M. Prediction of particle sticking efficiency for fly ash deposition at high temperatures. Proceedings of the Combustion Institute 2019, 37 (3), 2995–3003. 10.1016/j.proci.2018.06.038. [DOI] [Google Scholar]
Associated Data
This section collects any data citations, data availability statements, or supplementary materials included in this article.