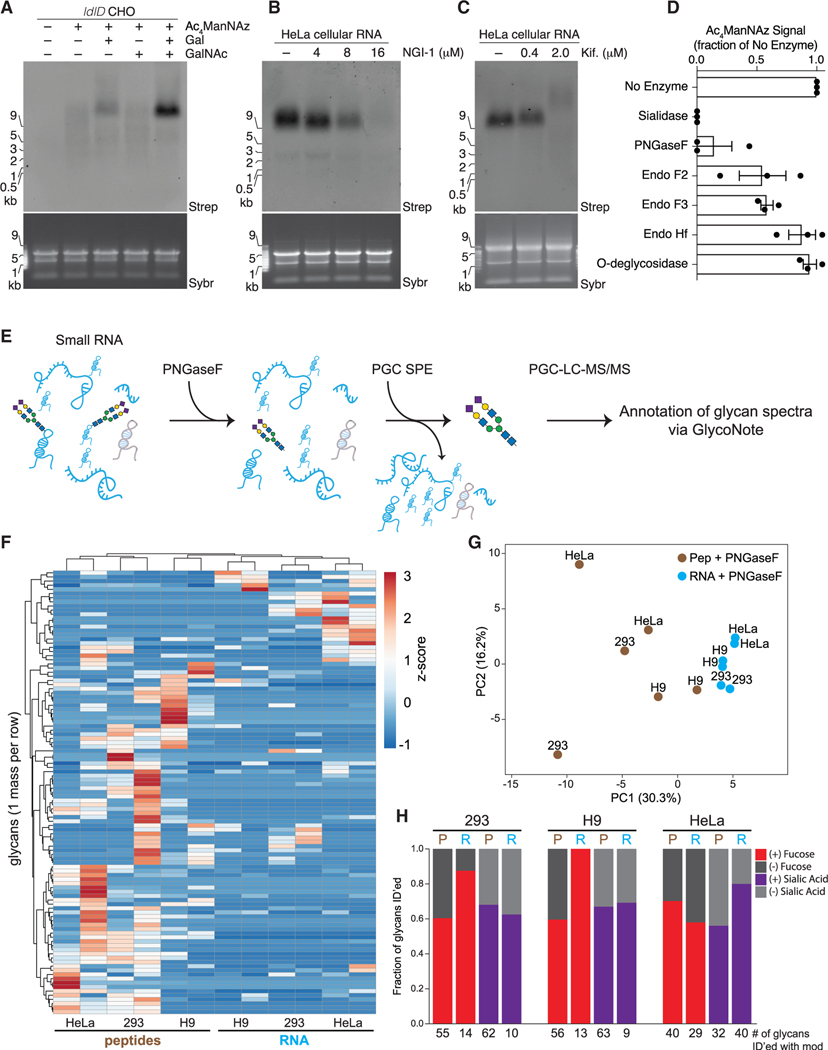
Figure 4. A distinct set of N-glycans are enriched with glycoRNAs.
(A) Blotting of RNA from ldlD CHO cells labeled with Ac4ManNAz, Galactose (Gal, 10 μM), N-acetylgalactosamine (GalNAc, 100 μM), or all for 24 h.
(B) Blotting of RNA from HeLa cells treated with Ac4ManNAz and indicated concentrations of NGI-1, an inhibitor of OST, for 24 h.
(C) Blotting as in (B) but with the indicated concentrations of kifunensine.
(D) Quantification of Ac4ManNAz signal after treatment of Ac4ManNAz-labeled HeLa cell RNA with the indicated enzymes in vitro each for 1 h at 37°C in biological triplicate.
(E) Schematic of the method used to release glycans from RNA samples and subsequently purify free glycans for mass spectrometry analysis.
(F) Unsupervised clustering analysis of glycans (rows) released from peptide and RNA fractions (columns) of 293, H9, or HeLa cells via PNGaseF cleavage. Glycans had to be found biological replicates of at least one of the six samples to be included.
(G) Principal component analysis of peptide- and RNA PNGaseF-release glycans.
(H) Bar plots of the fraction of glycans containing fucose (red) or sialic acid (purple) modifications that were released from peptides or RNA samples. Numbers below are the absolute numbers of glycans found with each of the modifications from a given dataset.

