Abstract
During laparoscopic surgery, the Veress needle is commonly used in pneumoperitoneum establishment. Precise placement of the Veress needle is still a challenge for the surgeon. In this study, a computer-aided endoscopic optical coherence tomography (OCT) system was developed to effectively and safely guide Veress needle insertion. This endoscopic system was tested by imaging subcutaneous fat, muscle, abdominal space, and the small intestine from swine samples to simulate the surgical process, including the situation with small intestine injury. Each tissue layer was visualized in OCT images with unique features and subsequently used to develop a system for automatic localization of the Veress needle tip by identifying tissue layers (or spaces) and estimating the needle-to-tissue distance. We used convolutional neural networks (CNNs) in automatic tissue classification and distance estimation. The average testing accuracy in tissue classification was 98.53±0.39%, and the average testing relative error in distance estimation reached 4.42±0.56% (36.09±4.92 μm).
Keywords: Optical coherence tomography, endoscope, Veress needle guidance, deep-learning
Graphical Abstract
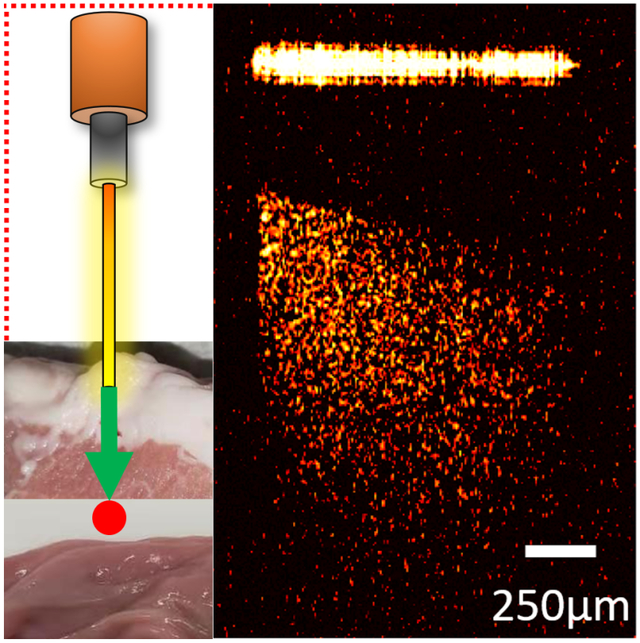
Veress needle is used in pneumoperitoneum establishment during laparoscopic surgery. Precise placement of the Veress needle is still a challenge. In this study, a computer-aided endoscopic optical coherence tomography (OCT) system was developed to guide Veress needle insertion. Different tissue types can be distinguished and recognized from the OCT images. Additionally, convolutional neural networks (CNNs) were utilized in automatic tissue classification and estimating the distance between needle tip and tissue.
1. Introduction
Laparoscopy is a modern and minimally invasive surgical technique used in the diagnosis and therapeutic purposes [1–3]. With the development of video camera and other medical auxiliary instruments, laparoscopy has become a procedure widely used in various surgeries such as cholecystectomy [4], appendectomy [5], herniotomy [6], gastric banding [7] or colon resection [8]. In the first step of the laparoscopic procedure, a trocar/Veress needle is inserted into the patient’s abdominal cavity through a small skin incision [9]. The Veress needle penetrates subcutaneous fat and muscle before reaching the abdominal cavity [10]. Once entry to the peritoneal cavity has been achieved, gas insufflation is used to establish pneumoperitoneum for the next surgical process [11, 12]. The pneumoperitoneum establishment step does not take a long time; however, more than 50% of all laparoscopic procedure complications occur during this step [13, 14]. In most of the current practices, the Veress needle is blindly inserted, and appropriate needle positioning is largely dependent on prior experience from the surgeon. Complications such as subcutaneous emphysema and gas embolism, or injury to internal organs during abdominal entry could happen when the Veress needle is not appropriately inserted [15]. While the average incidence rate of severe needle injury is below 0.05%, there are more than 13 million laparoscopic procedures performed annually worldwide. Thousands of patients suffer from needle insertion injuries each year [16–18]. The most common injuries are lesions of abdominal organs, especially small intestine injuries[19].
Imaging methods have been proposed in guiding the Veress needle insertion. For instance, ultrasound has been used to visualize the different layers of abdominal wall in guiding the Veress needle insertion [20, 21]. Magnetic resonance (MRI) imaging has been utilized to assist accurately measure the Veress needle insertion depth [22]. In addition, virtual reality technique has been proved to be a useful tool for Veress needle insertion [23]. Nevertheless, these techniques cannot accurately locate the needle tip because of the limited resolution and tissue deformation during needle insertion [24, 25]. Therefore, new techniques that can better guide the Veress needle is critically needed.
Optical coherence tomography (OCT) is an established biomedical imaging technique that can visualize subsurface tissue [26]. OCT provides high axial resolution at ~10 μm and several millimeters’ imaging depth [27], thus OCT has the potential for providing better imaging quality in Veress needle guidance. However, benchtop OCT cannot be directly used for Veress needle guidance due to the limited penetration depth. Endoscopic OCT systems has been applied in many surgical guidance procedures such as the investigation of colon cancer [28], vitreoretinal surgery [29] and nasal tissue detection [30]. In our previous work, we developed OCT endoscope based on gradient-index (GRIN) rod lens and demonstrated its feasibility in real-time percutaneous nephrostomy (PCN) guidance [31] and epidural anesthesia guidance [32].
In this study, we adapted the OCT endoscope for Veress needle guidance. To simulate the laparoscopy procedure, the endoscopic OCT system was used to image different tissue layers including subcutaneous fat, muscle, abdominal space, and small intestine from swine abdominal tissue. These tissues can be recognized based on their distinct OCT imaging features. To assist doctors, convolutional neural networks (CNNs) [33, 34] were developed for recognizing the different types of tissues and estimating the exact distance between needle tip and the small intestine from OCT images. OCT images were taken from four tissue layers (Subcutaneous fat, muscle, abdominal space, and small intestine) along the path of the Veress needle. These images were then used to train and test a classification model for tissue layer recognition and a regression model for estimation of the distance from the tip of the needle to the small intestine. The CNN architectures used for the classification and regression tasks included ResNet50 [35], InceptionV3 [36], and Xception [37]. Results from these three architectures were analyzed and benchmarked [38–40]. To the best of our knowledge, this is the first report to combine endoscopic OCT system with CNN as a novel imaging platform for guiding the Veress needle procedure and these preliminary results demonstrated the feasibility of this novel imaging strategy.
2. Methods
2.1. Experimental setup
The endoscopic OCT system was established on a swept-source OCT (SS-OCT) system which applied the laser source with 1300nm-center wavelength and 100nm-bandwidth [31]. Its schematic was shown in Figure 1. The laser source provided output power of around 25 mW. The system had the axial scanning (A-scan) rate of up to 200 kHz. The light was initially split by a coupler into two different parts, one of which accounted for 97% of the total power and the other one took the rest 3%. A Mach-Zehnder interferometer (MZI) received the rest 3% power and generated a frequency-clock signal to trigger the imaging sampling process. The 97%-light was further transmitted to an optical circulator. When the light exited from port 2, it was split evenly into the sample arm and reference arm of the OCT system. Polarization controllers were assembled in each coherence arm to control the noise levels. The interference signal of the backscattered light from sample arm and the reflected beam from reference arm was sent to the balanced detector (BD) for further noise reduction, and then to the data acquisition (DAQ) board and computer for post processing. Cross-sectional OCT images from different imaging depths of the sample can be provided through Fourier transform.
Fig. 1.
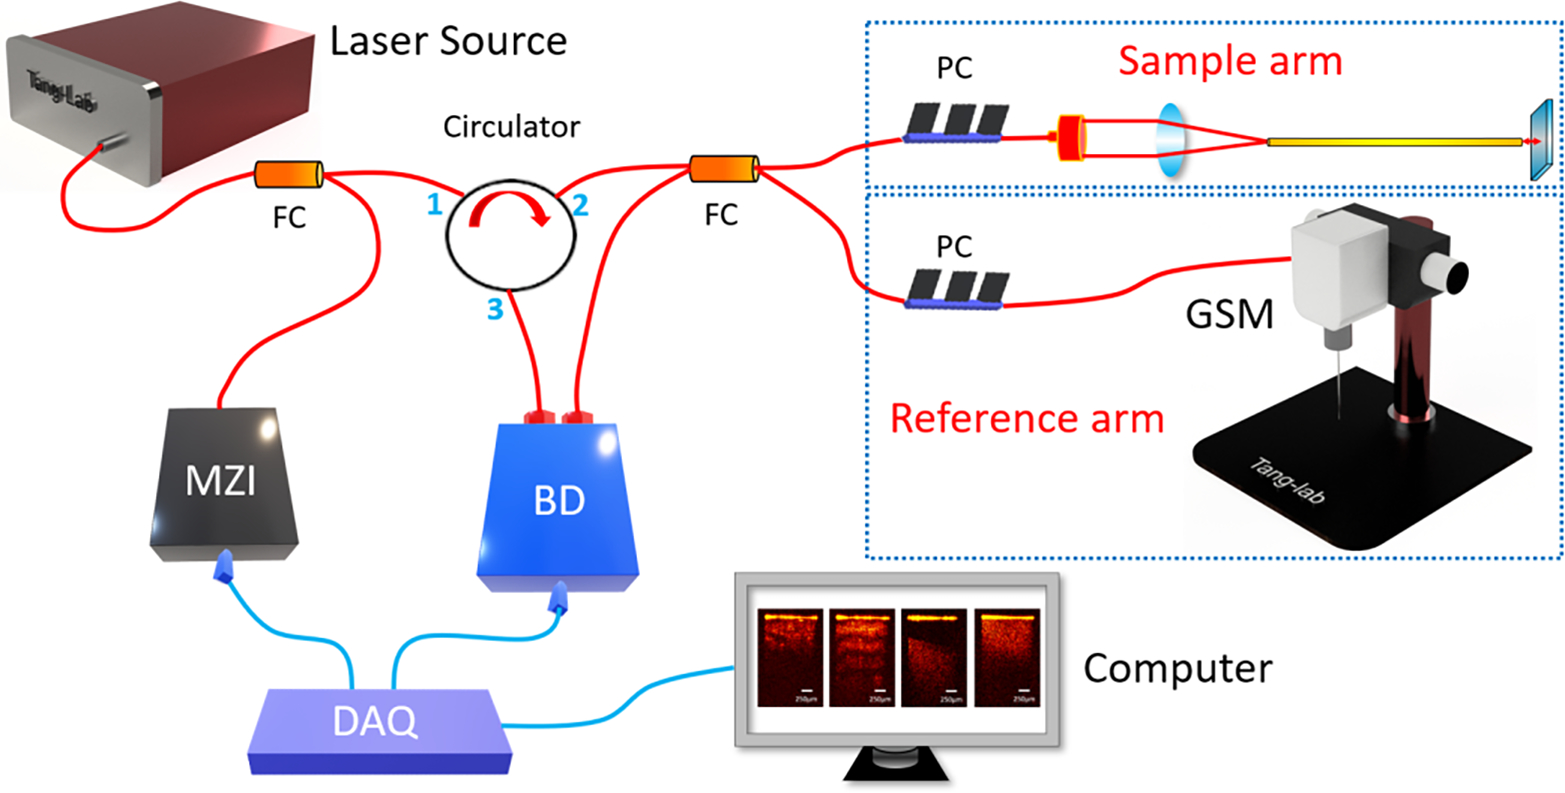
Schematic of endoscopic OCT system for Veress needle guidance. MZI: Mach-Zehnder interferometer, BD: Balanced detector, DAQ: Data acquisition, GSM: Galvanometer scanning mirror, FC: Fiber coupler, PC: Polarization controller.
To build the endoscopic system, we used gradient-index (GRIN) rod lens as endoscopes. One GRIN lens was stabilized in front of the galvanometer scanner as demonstrated in Figure 1. The GRIN lens transmitted the imaging information from the distal end to the proximal end with the spatial resolution remained constant. We placed the proximal surface of the GRIN lens at the focal point of the OCT scanner to acquire the tissue images in front of the GRIN lens. To compensate for light dispersion, we placed another identical GRIN lens into the light path of the reference arm. The GRIN lenses in our experiment had the length of 138 mm and diameter ~1.30 mm. Stainless steel tubes were assembled to protect them. Lateral field-of-view (FOV) of our system reached ~1.25 mm, and the sensitivity was calibrated to be ~92 dB. The endoscopic OCT achieved ~11 μm-axial resolution and 20 μm-transverse resolution.
2.2. Data acquisition
The OCT images of subcutaneous fat, muscle, abdominal space, and small intestine were taken from eight pigs. For each sample, 1,000 2D OCT cross-sections were selected. A total 32,000 images were utilized for CNN tissue classification model development. For the distance estimation task, there were a total of 8,000 OCT images of abdominal space used, and distance between the GRIN lens end and the small intestine varied in these images. The flow diagram of data acquisition and process was demonstrated in Figure 2.
Fig. 2.

Process of the data acquisition.
The original size of each image was 320 (transverse/X axis) × 480 (longitudinal axis/depth/Z direction). The pixel size on both axes were 6.25μm. To decrease the computation burden, the size of the 2D images was reduced by cropping the unnecessary part of the images’ edges. They were cropped to 216×316 (X by Z) for tissue classification and 180×401(X by Z) for distance estimation.
2.3. CNN method for tissue classification
CNNs were used to accomplish the task of identifying the layer of tissues in which an image was taken. The four layers analyzed for classification include fat, muscle, abdominal space, and intestine. For each subject, there were 1,000 images taken from each tissue layer, and the layer in which the image was taken was manually annotated and represented the ground truth label for the classification task. The CNN model architectures used for model development included ResNet50 [35], InceptionV3 [36] and Xception [37], which contained 25.6 million, 23.9 million and 22.9 million parameters, respectively. Training took place over 20 epochs with a batch size of 32. The cross-entropy optimizer was used with Nesterov momentum, a learning rate of 0.9, and a decay rate of 0.01. The loss function was sparse categorical cross-entropy and accuracy was used as the primary evaluation metric for the tissue classification task. ResNet50, Xception, and InceptionV3 were used because of their demonstrated performance on similar image prediction tasks and relatively comparable network depths [35–37]. Initially, a wide range of architectures were selected and tested, including EfficientNet (B3, B4, and B5), InceptionV3, NasNetLarge, NasNetMobile, ResNet50, ResNet101, and Xception. On average, the ResNet50, Xception, and InceptionV3 architectures supported the best performing models in regard to accuracy and efficiency.
The accuracy was calculated as:
| (1) |
where TP: true positive; TN: true negative; FP: false positive; FN: false negative.
Nested cross-validation and cross-testing were used to select an optimal model and evaluate the performance [31]. For nested cross-validation and testing, images were separated into eight folds based on the subject in which the images were taken. With nested cross-validation, the performance of the three model architectures were compared, and the architecture with the highest accuracy was selected for the corresponding testing phase. Once the optimal model architecture was determined for a given nested cross-validation fold, the cross-testing phase required training a new model with all images except those from the corresponding testing fold, and the new model’s accuracy on the unseen testing images was recorded. This process was illustrated in Figure 3. Training and testing took place on ten compute nodes containing GPUs on the Summit supercomputer at Oak Ridge National Laboratory.
Fig. 3.
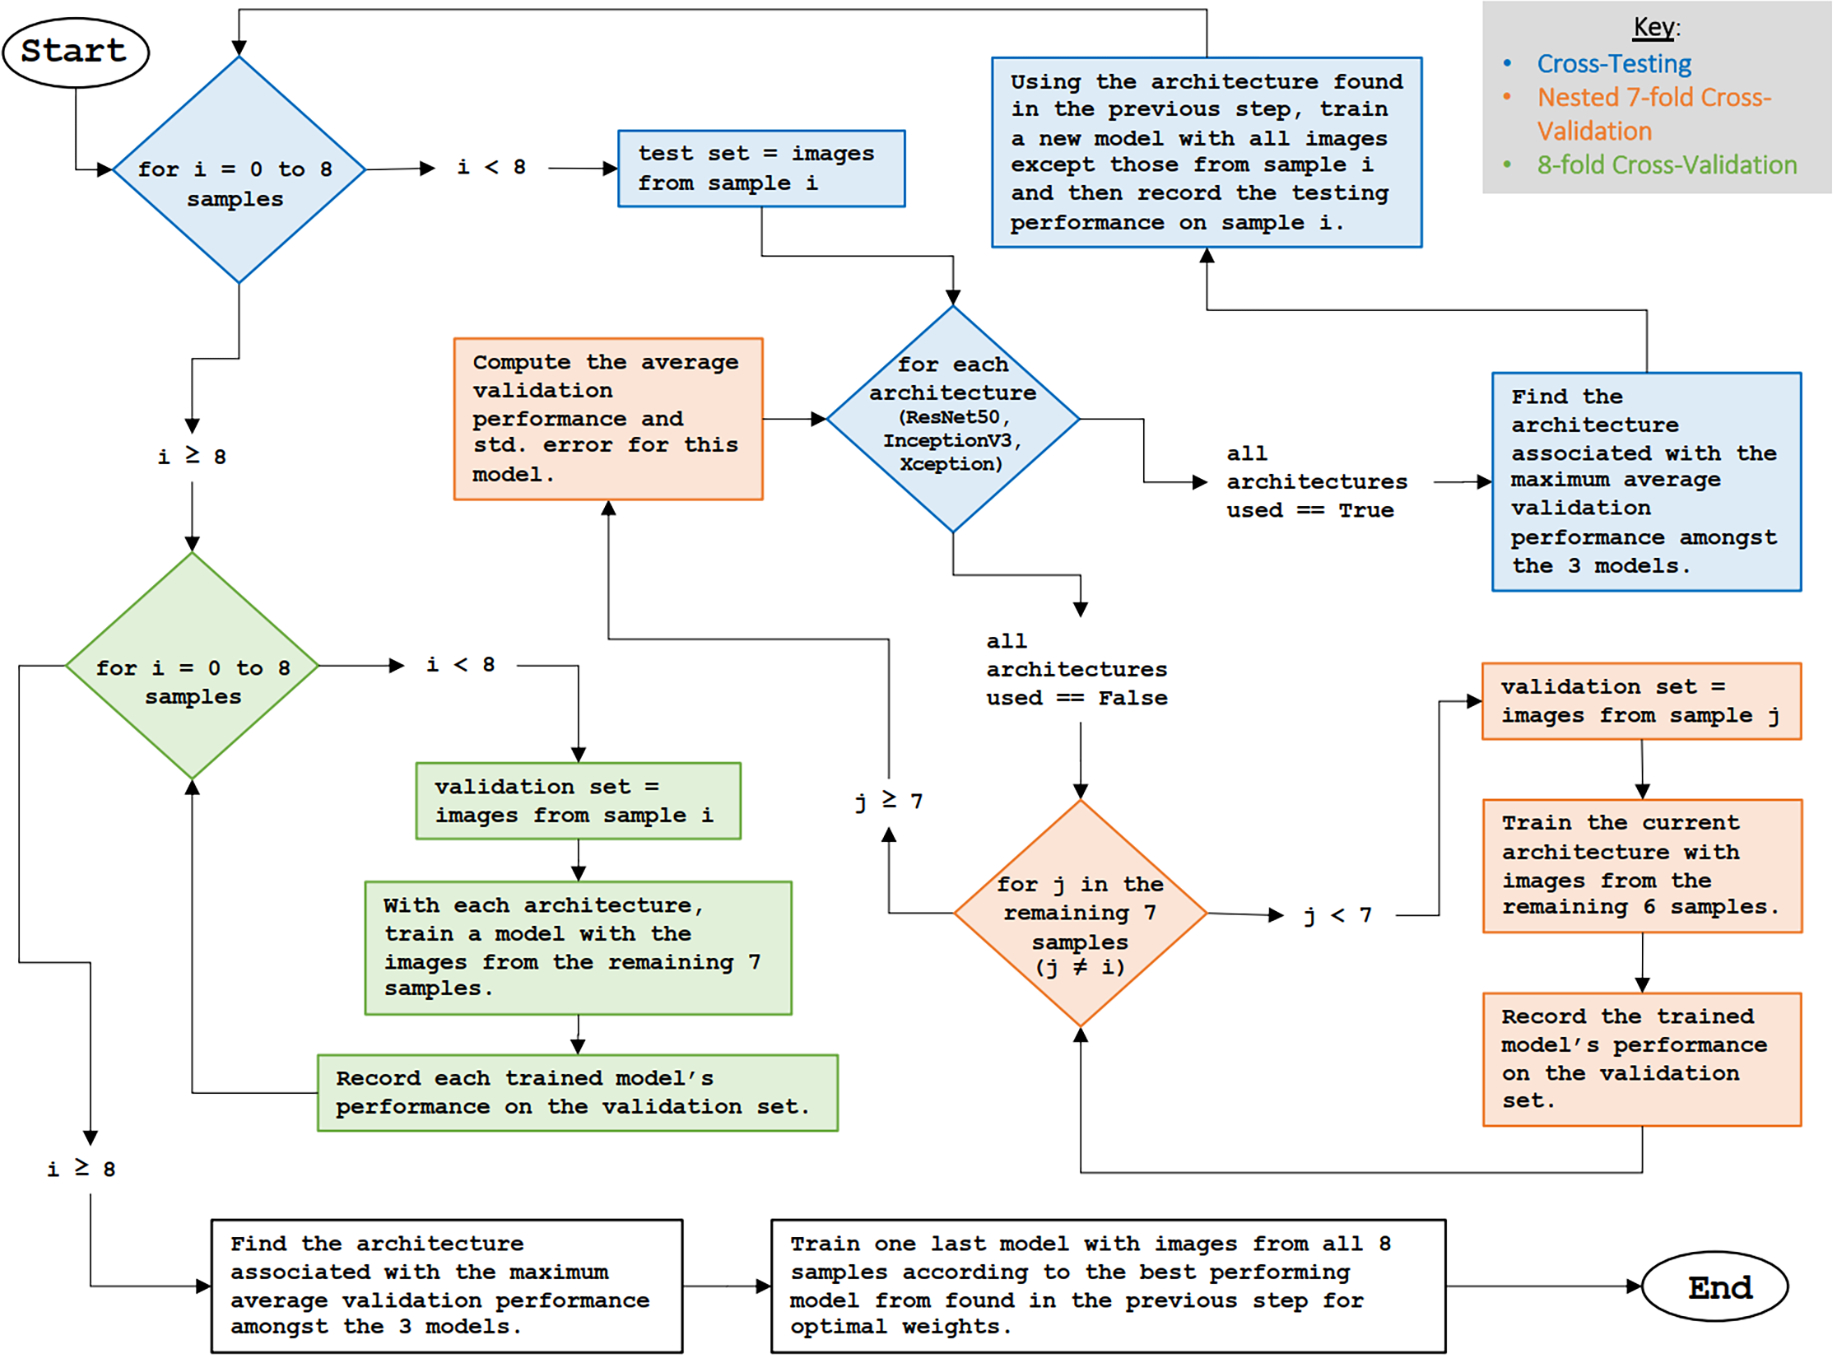
Introduction of the nested cross-validation, cross-testing, and 8-fold cross-validation process.
2.4. CNN regression for distance measurement
Regression CNNs were used to estimate the distance from the Veress needle lens to the intestine. The distance from the needle tip to the intestine represented the ground truth label and was manually annotated.
CNN regression models were constructed with the same three architectures used for classification, which includes ResNet50, InceptionV3, and Xception, and the same nested cross-validation and cross-testing approach was used for training and performance evaluation. For the regression model architecture, the final output layer was changed to a single neuron with an identity activation function. Training involved using the SGD optimization algorithm, a learning rate of 0.01, decay rate of 0.09, and Nesterov momentum. Training took place over 20 epochs with a batch size of 32. The loss function was the mean absolute percentage error (MAPE). Regression model development was accomplished on a private workstation containing two NVIDIA RTX 3090 GPUs. Here, MAPE and mean absolute error (MAE) were utilized to evaluate the estimation accuracy of the distance. They can be described as:
| (2) |
| (3) |
Where Xi was the estimated value, Yi was the ground truth value (manually labeled), and n was the number of the images.
3. Results
3.1. Imaging results of endoscopic OCT system
We used the subcutaneous fat, muscle, abdominal space, and small intestine tissues from eight different swine samples to mimic the practical tissue layers that the Veress needle traverses. Fat and muscle were both taken from the abdominal areas. In the experiment, the GRIN lens in the sample arm was inserted into the three different tissues for imaging. Moreover, to replicate the condition when the needle tip was in the abdominal cavity, we kept the needle tip at different distances in front of the small intestine and took the OCT images as the abdominal space layer.
Figure 4 showed the examples of 2D OCT results of the three different tissues and abdominal space. The 2D results demonstrated clear differences between each other: Abdominal space could be easily recognized from the gap between the tip of the GRIN lens and the small intestine tissue on the bottom. Among the three tissues, muscle had clear transverse fiber structures which was shown as different light and dark layers on the OCT image and had the largest penetration depth. The imaging result of small intestine showed homogeneous tissue density and brightness. Regarding the subcutaneous fat images, some granular structures occurred because of the existence of adipocytes. The corresponding histology results were also included. Different tissues presented distinct cellular structures and distributions and correlated well with their OCT images. These results proved the potential of using OCT to distinguish different tissue layers.
Fig. 4.
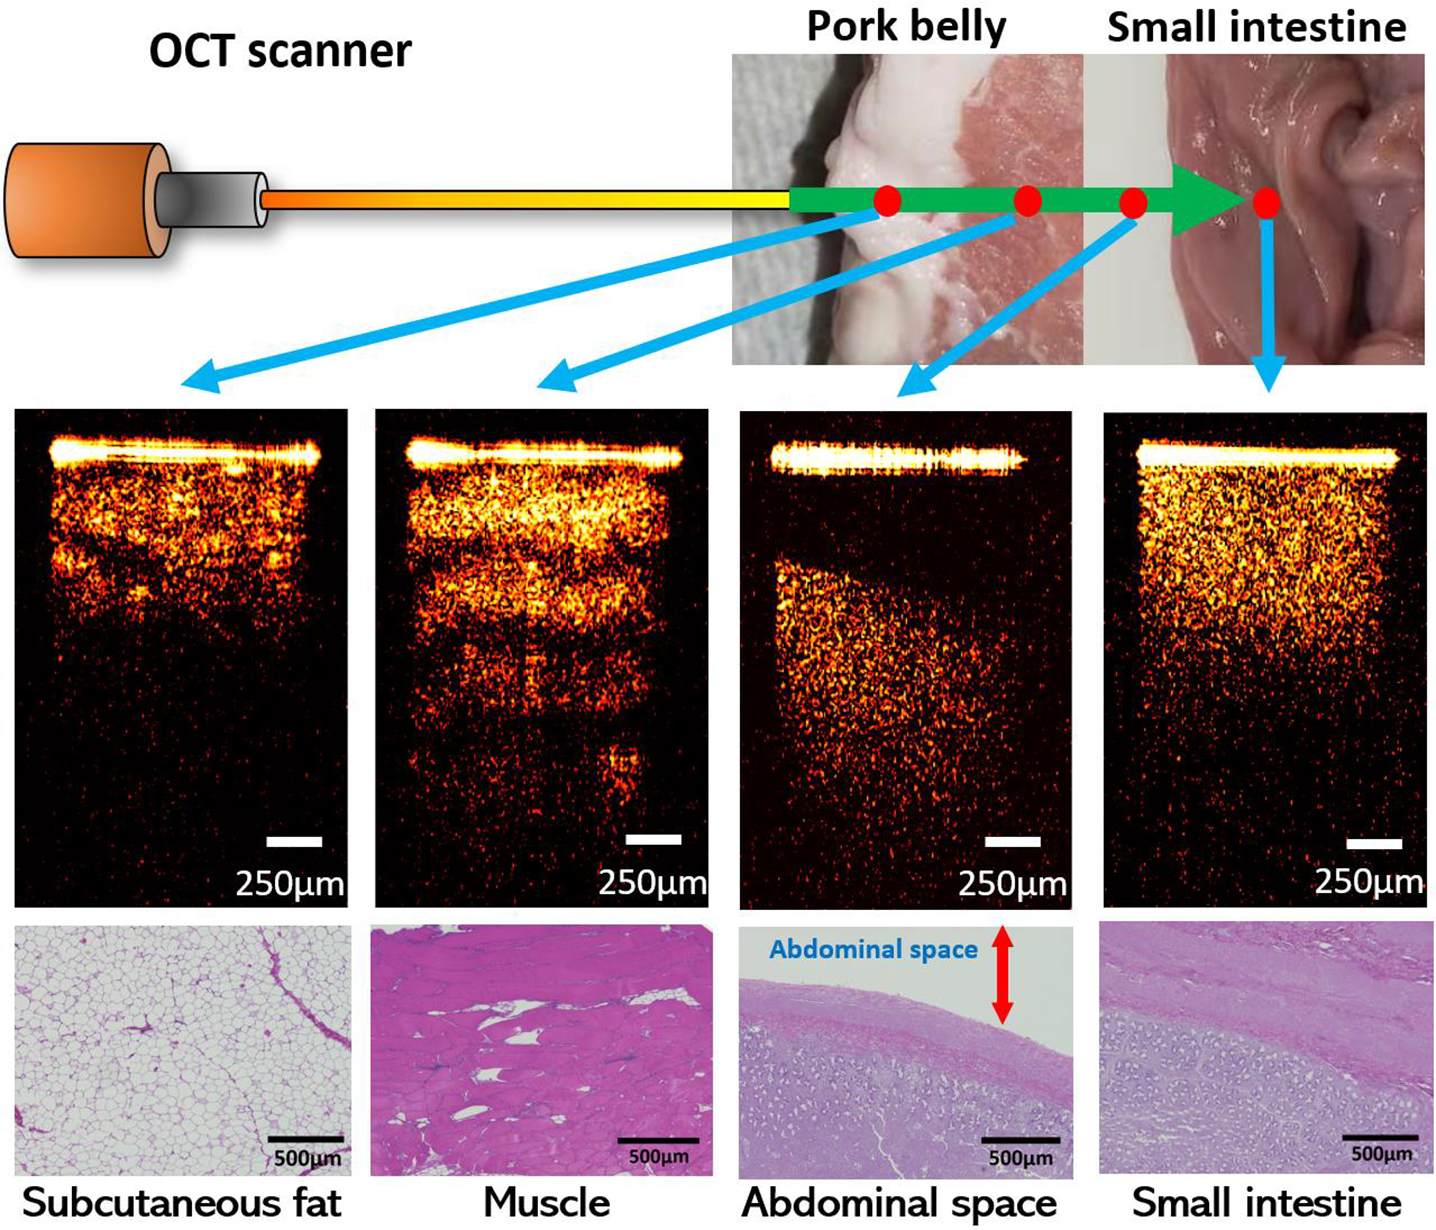
Examples of OCT images of different tissue types.
3.2. Multi-class classification
There were 32,000 total images with the size of 216×316 (X by Z) pixels taken from eight subjects used for training and testing the tissue classification model. Three CNN models: ResNet50 [35], InceptionV3 [41] and Xception [42] were applied. The average nested 7-fold cross-validation accuracies for tissue-layer classification were shown in Table 1. All models achieved 90% accuracy or higher on the validation set. For InceptionV3 and Xception models, the average accuracies were both higher than 97%.
Table 1:
The average nested 7-fold cross-validation accuracies and standard errors
| Fold | ResNet50 | InceptionV3 | Xception | |||
|---|---|---|---|---|---|---|
|
| ||||||
| Accuracy | SE* | Accuracy | SE* | Accuracy | SE* | |
|
| ||||||
| S1 | 92.69% | 2.11% | 98.31% | 0.58% | 98.93% | 0.40% |
| S2 | 97.41% | 0.94% | 98.45% | 0.47% | 98.86% | 0.38% |
| S3 | 94.63% | 1.67% | 98.15% | 0.58% | 98.44% | 0.73% |
| S4 | 96.93% | 0.54% | 98.54% | 0.38% | 98.49% | 0.40% |
| S5 | 91.94% | 1.72% | 97.84% | 0.60% | 99.02% | 0.33% |
| S6 | 95.88% | 0.97% | 97.07% | 1.15% | 98.56% | 0.51% |
| S7 | 90.75% | 2.60% | 98.01% | 0.55% | 98.60% | 0.46% |
| S8 | 96.90% | 1.14% | 97.95% | 0.56% | 98.55% | 0.38% |
SE is the standard error of the average accuracy.
Cross-testing was further performed to provide an unbiased evaluation of the classification performance on the set of test images (i.e., images that were not used during nested cross-validation). The architecture associated with the highest nested cross-validation accuracy in each cross-validation fold was used to train a new model for the corresponding cross-testing fold. During cross-testing, a new model was trained with images from seven subjects (7,000 images) in both the training and validation folds and tested with images from one subject (1,000 images) in the test fold. The testing results along with inferencing times were shown in Table 2. The best testing accuracy on the testing images was 99.825% in the S6 testing fold. There was a tie for the lowest testing accuracy (97.200%) in the S2 and S3 testing fold. The classification inferencing time is the amount of time it took for the classification model to predict the tissue layer on a single image. The inferencing time for Xception was slightly greater than that of InceptionV3.
Table 2:
The 8-fold cross-testing accuracies on the testing set in each testing fold
| Fold | Architecture | Inferencing time (ms) | Testing accuracy |
|---|---|---|---|
|
| |||
| S1 | Xception | 1.765 | 97.95% |
| S2 | Xception | 1.743 | 97.20% |
| S3 | Xception | 1.738 | 97.20% |
| S4 | InceptionV3 | 1.262 | 97.98% |
| S5 | Xception | 1.758 | 98.80% |
| S6 | Xception | 1.765 | 99.83% |
| S7 | Xception | 1.740 | 99.80% |
| S8 | Xception | 1.745 | 99.50% |
|
| |||
| Average | 98.53 ± 0.39% | ||
From the classification cross-testing benchmarking results, the Xception architecture was used in 7 out of the 8 cross-testing folds, and the InceptionV3 architecture was used once (selected via cross-validation). The aggregated ROC curve across all eight testing folds (i.e., 32,000 images) was shown in Figure 5, and the ROC curves for each of the eight subjects developed during cross-testing were included in Figure 1 of supplementary document. The ROC curve showed that the models were able to classify the images pertaining to each tissue-layer with high accuracy. The average ROC AUC score was 0.998967 and the r2 value was 0.9839.
Fig. 5.
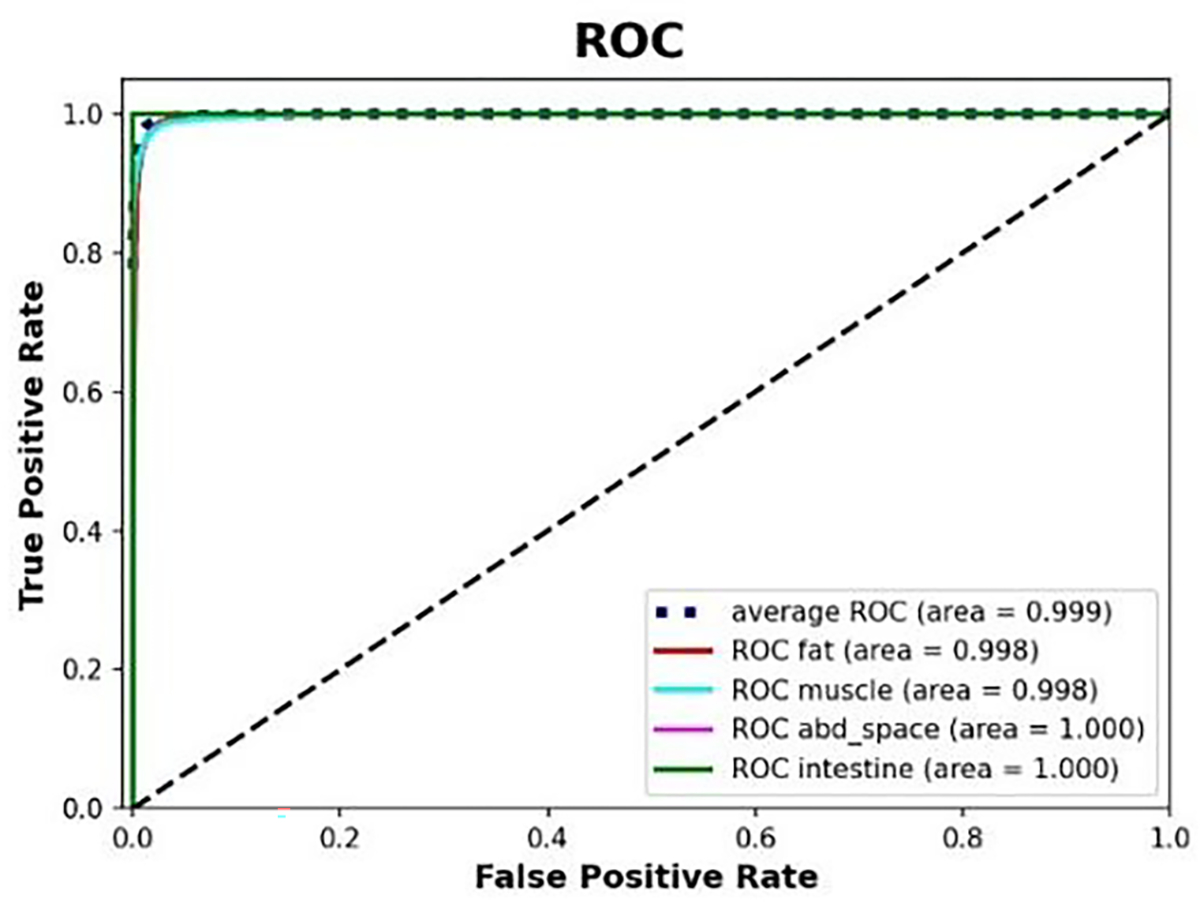
Aggregated ROC across all 8 testing folds using Xception model.
To visually explain the model predictions of the different tissue layers, a tissue classification activation heatmap from sample 1 based on Xception was illustrated in Figure 6. The activation distributions differed in position and size among the four tissue layer types. In subcutaneous fat and small intestine, the activation was mainly concentrated in the bottom of the images. However, the size of the activated area on the image of subcutaneous fat was larger than the activated area on the image of the small intestine, and there was also increased attention given to the area right below the needle tip. For muscle and abdominal space, the activated areas on the image were near the top, but there was greater focus given to the area just under the needle tip in muscle images. In contrast to the muscle images, the activated areas of the abdominal space images were more concentrated over the needle tip.
Fig. 6.
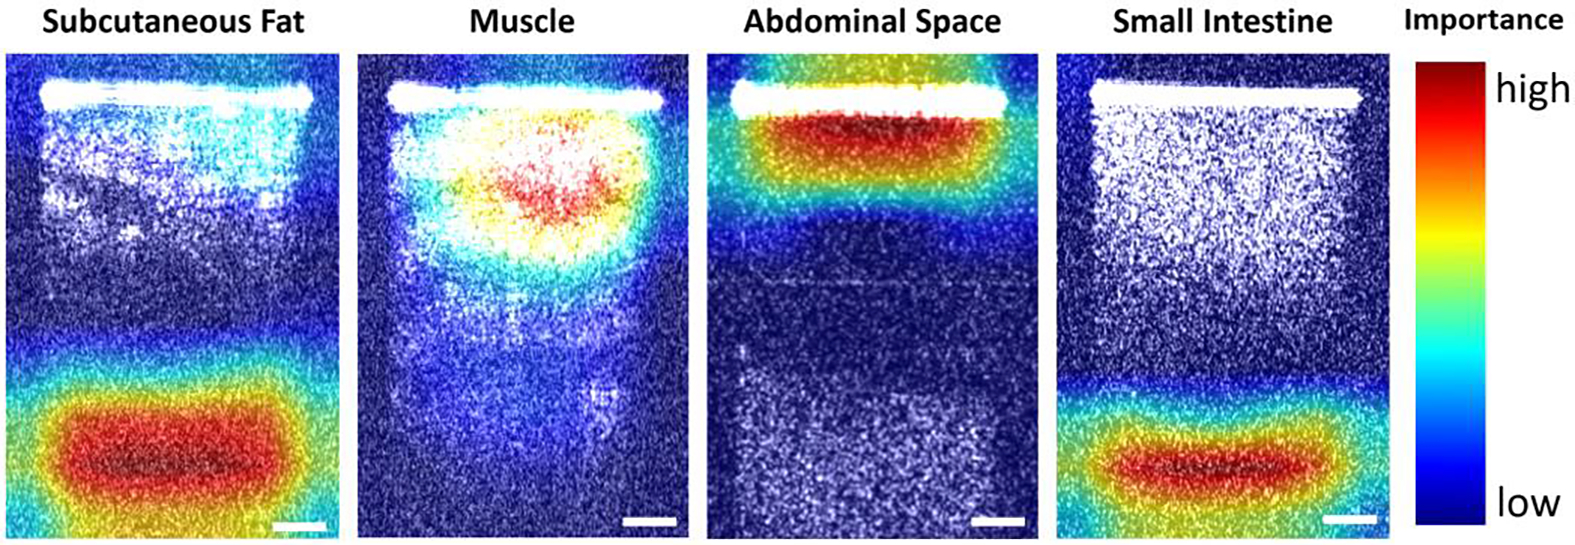
Tissue classification activation heatmap obtained from sample 1. Scale bar: 250μm.
After the performance of our model development procedure was benchmarked by the cross-testing, a final model was generated using this procedure in two steps. First, an architecture was selected using 8-fold cross-validation. As expected, the Xception architecture provided higher accuracy on average (98.37±0.59%) than ResNet50 (95.92±1.40%) and InceptionV3 (97.46±0.75%). Results of 8-fold cross-validation for architecture selection were shown in Supplement Table 1. Then, a final model was trained using all 8 folds with the Xception architecture.
3.3. Distance estimation
There were 8000 images in total used for the regression task (1000 images per subject). The images of the abdominal space were taken at a range of distances between approximately 0.2 mm and 1.5 mm from the needle tip to the intestine. To estimate the distance values between the needle tip and the surface of small intestine, the same three architectures (ResNet50, InceptionV3, and Xception) were also utilized for the regression task. The MAPE was used to evaluate the distance estimation error. Nested cross-validation and cross-testing were performed in the same fashion as done the tissue-layer classification task. Table 3 showed the average nested cross-validation MAPE with standard error in each nested cross-validation fold. The distance estimation nested cross-validation results indicated that the InceptionV3 achieved the lowest average error in six out of eight folds, and Xception achieved the lowest average error in the other two folds.
Table 3.
Average nested 7-fold cross-validation MAPE with standard error
| Fold | ResNet50 | InceptionV3 | Xception | |||
|---|---|---|---|---|---|---|
|
| ||||||
| MAPE | SE* | MAPE | SE* | MAPE | SE* | |
|
| ||||||
| S1 | 5.25% | 0.78% | 4.47% | 0.79% | 5.06% | 0.89% |
| S2 | 5.01% | 0.40% | 3.79% | 0.39% | 4.24% | 0.44% |
| S3 | 5.43% | 0.74% | 4.74% | 0.65% | 5.06% | 0.76% |
| S4 | 5.42% | 0.53% | 5.16% | 0.76% | 5.05% | 0.54% |
| S5 | 5.47% | 0.82% | 4.43% | 0.44% | 4.92% | 0.47% |
| S6 | 5.62% | 0.72% | 5.03% | 0.60% | 5.42% | 0.63% |
| S7 | 5.89% | 0.64% | 4.74% | 0.60% | 5.39% | 0.75% |
| S8 | 4.91% | 0.53% | 4.90% | 0.64% | 4.35% | 0.40% |
SE is the standard error of the mean MAPE.
Similar to tissue classification, cross-testing was used to get an unbiased evaluation of the performance on the distance estimation task, and results were shown in Table 4. InceptionV3 provided the highest MAPE of 6.66% with MAE of 56.1 μm in fold S2, and the lowest MAPE of 2.07% with MAE of 16.7 μm in fold S7. Overall, the MAPEs were all under 7% and the MAEs never exceeded 60 μm. Examples of comparisons between the manually labeled results (ground truth value) and predicted results were shown in Figure 7(a). Violin plots from sample one was shown in Figure 7(b) to show the error distribution based on distance; violin plots for the other seven samples were included the Figure 2 of the supplementary document.
Table 4.
MAPE with Standard Error and MAE with Standard Error during 8-fold cross-testing
| Testing fold | Architecture | MAPE | MAE (µm) | Inference time (ms) |
|---|---|---|---|---|
|
| ||||
| S1 | InceptionV3 | 6.45% | 52.9 | 1.395 |
| S2 | InceptionV3 | 6.66% | 56.1 | 1.392 |
| S3 | InceptionV3 | 5.09% | 45.6 | 1.380 |
| S4 | Xception | 3.38% | 31.7 | 1.669 |
| S5 | InceptionV3 | 3.78% | 26.2 | 1.395 |
| S6 | InceptionV3 | 3.43% | 31.6 | 1.415 |
| S7 | InceptionV3 | 2.07% | 16.7 | 1.394 |
| S8 | Xception | 4.46% | 27.9 | 2.044 |
|
| ||||
| Average | 4.42% ± 0.56% | 36.09 ± 4.92 | ||
Fig. 7.
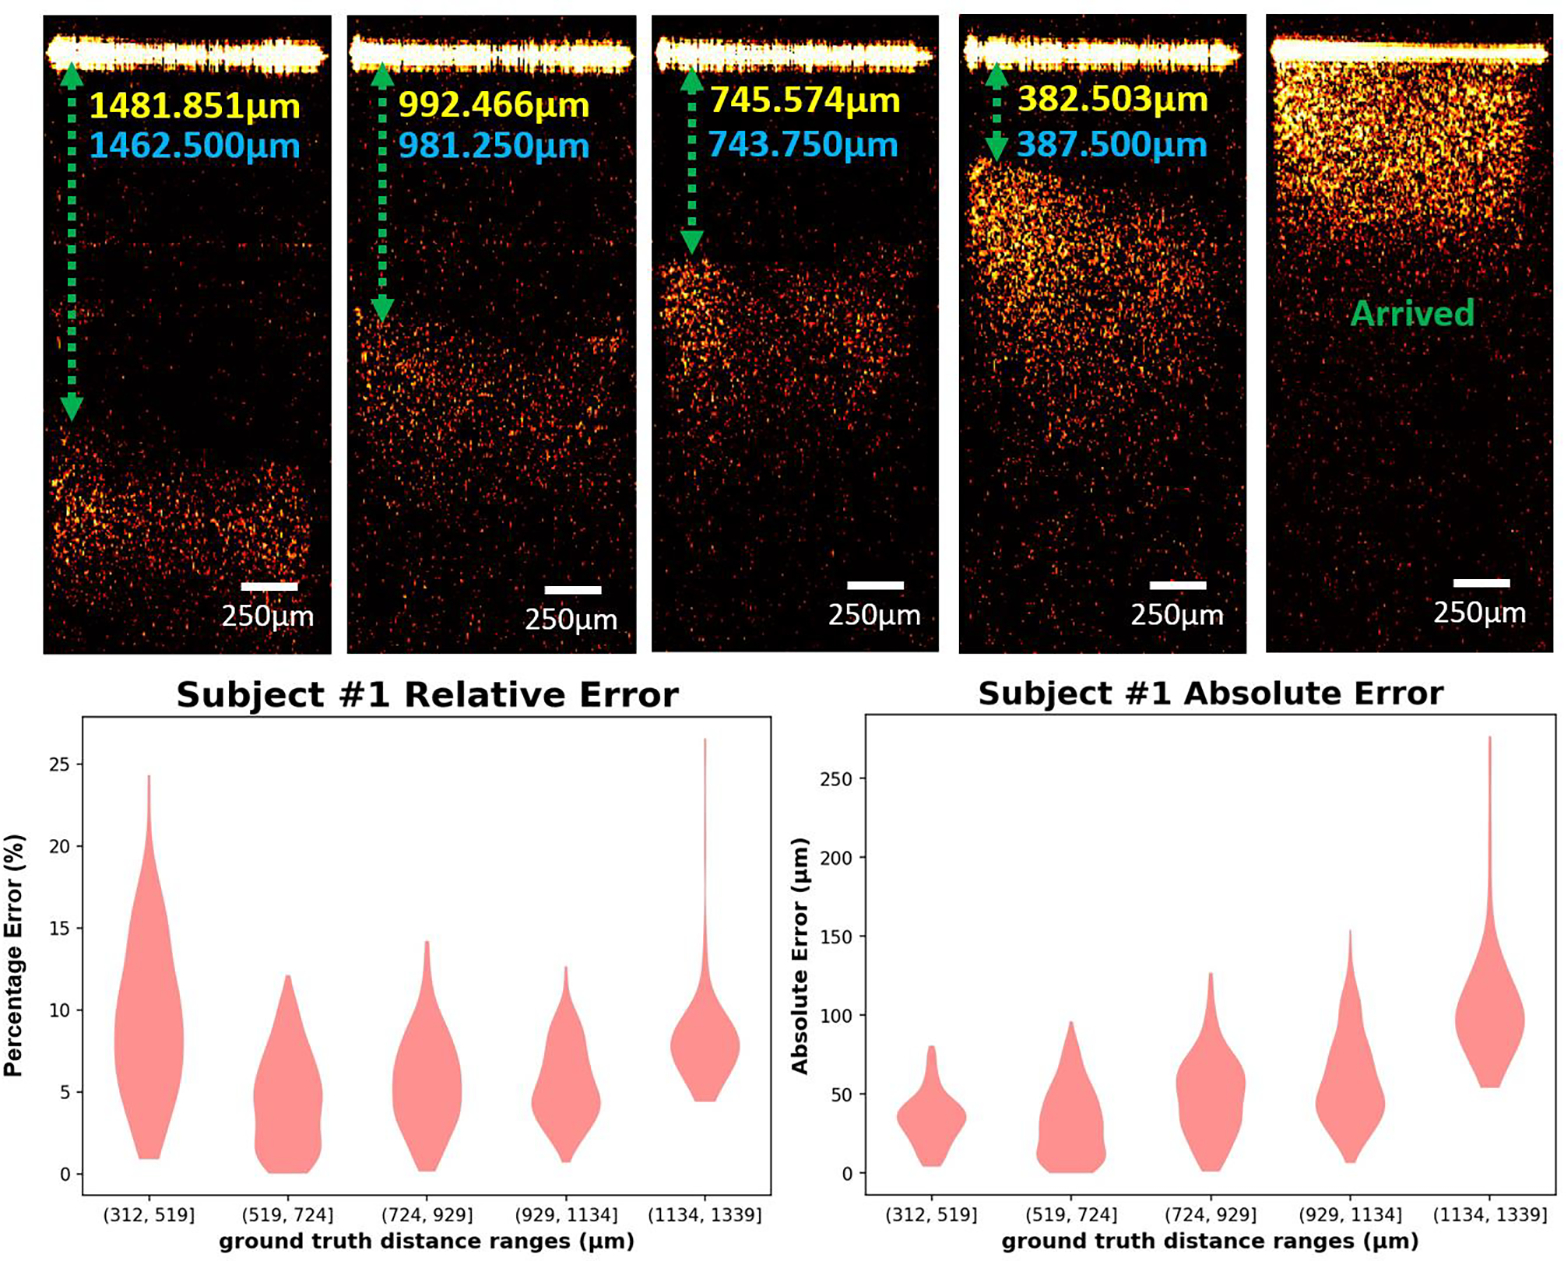
(A) Examples of abdominal space images with different distances between small intestine and needle tip. Yellow value: estimated distance; Blue value: Manually calculated distance. (B) Violin plots showing the absolute error and relative error on the testing set for subject 1.
After the regression model development procedure was benchmarked by cross-testing, this procedure was repeated to produce a final model. Because no data needed to be held back for testing, all 8 folds were used in the cross validation for final architecture selection. The models trained with the InceptionV3 architecture provided lower error on average (4.44±0.43%) than ResNet50 (5.29±0.56%) and Xception (4.77±0.58%) (Supplement Table 2). After the architecture was selected, because no data needed to be held back for validation or testing, all 8 folds were used to train the final model.
4. Discussion
In this study, we demonstrated the feasibility of our forward-view endoscopic OCT system for Veress needle guidance. Compared to conventional imaging methods, OCT can provide more structural details of the subsurface tissues to help recognize the tissue type in front of the needle tip. Four tissue layers following the sequence of the tissues that Veress needle passing through during the surgery were imaged by our endoscopic OCT system, including subcutaneous fat, muscle, abdominal space, and small intestine. The OCT images of these four layers could be distinguished by their unique imaging features. By fitting the rigid OCT endoscope inside the hollow bore of the Veress needle, no additional invasiveness will be introduced from the OCT endoscope. The OCT endoscope will provide the images of the tissues in front of the Veress needle during insertion, thus indicating the needle tip location in real time and facilitating the precise placement of the Veress needle.
Deep learning was used to automate the OCT imaging data processing. Three CNN architectures, including ResNet50, InceptionV3 and Xception, were cross-validated for both tasks. These three architectures were used because of their demonstrated performance on similar image prediction tasks and relatively comparable network depths [35–37]. Initially, a wide range of architectures were selected and tested, including EfficientNet (B3, B4, and B5), InceptionV3, NasNetLarge, NasNetMobile, ResNet50, ResNet101, and Xception. On average, the ResNet50, Xception, and InceptionV3 architectures supported the best performing models in regard to accuracy and efficiency. Among these three architectures, the best architecture was found to be Xception for tissue layer classification and InceptionV3 for estimating the distance from needle tip to small intestine surface. However, all three architectures provided very high prediction performance and had only insignificant performance differentials among them. We used a nested cross-validation and cross-testing to provide an unbiased performance benchmarking of our model development procedure from architecture selection to model training. The average testing accuracy of our procedure was 98.53 ± 0.39% for tissue layer classification. The average MAPE of our procedure was 4.42% ± 0.56% for the distance estimation.
For the classification task, the training time per fold over 28,000 images was ~98 minutes on average for the Xception architecture and ~32 minutes for the InceptionV3 architecture during cross testing. The average inferencing time (i.e., the time it took for a trained model to make a prediction on a single image) for the Xception models during cross-testing was 1.75 milliseconds, while the InceptionV3 model had an interpretation time of 1.26 milliseconds. The classifiers were trained and tested using NVIDIA Volta GPUs. For the regression task, the average training time for the InceptionV3 model during cross-testing was ~367 minutes, which took place over 7,000 images. The average training time for the Xception model was ~1,244 minutes. The average interpretation time for the InceptionV3 models was 1.30 milliseconds. And the average interpretation time for the Xception model was ~1.86 milliseconds. Regression model training and testing took place on NVIDIA RTX 3090 GPUs.
Our current study has shown the feasibility of using endoscopic OCT and deep learning methods in Veress needle guidance. Next, we will apply our system in the in-vivo swine experiments. It is worth mentioning that blood flows exist during in-vivo experiments. Except for the lesions of abdominal organs, injury to the blood vessels is also a major complication in the Veress needle insertion [43]. Major vascular injuries, especially to aorta, vena cava or iliac vessels, are risky to patients’ lives [44]. The mortality rate can reach up to 17% when injury to large vessels happen [45]. Doppler OCT is an extension of our current OCT endoscope that can help detect the flows [46, 47]. Doppler OCT endoscope has been used for detecting the at-risk blood vessels within sheep brain in real time [48], in colorectal cancer (CRC) diagnosis [49], management of pulmonary nodules [50], and human GI tract imaging and treatment [51]. Therefore, the proposed OCT endoscope has potential to solve the problem of blood vessel injury during Veress needle insertion. As to hardware, we will redesign the OCT scanner to make it easier for surgeons to operate. We will continue to accelerate the models through knowledge distillation and weight pruning. Furthermore, Since the proposed OCT endoscope system can distinguish different tissue types in front of needle tip, it also has potential for guiding other needle-based interventions such as percutaneous nephrostomy (PCN) needle guidance in kidney surgery [52], epidural anesthesia imaging guidance in painless delivery [32], the tumor tissue detection in cancer diagnosis [53], and a variety of needle biopsy procedures.
Supplementary Material
Acknowledgement
Qinggong Tang would like to acknowledge the support from Faculty Investment Program and the Junior Faculty Fellowship of University of Oklahoma; Oklahoma Health Research Program (HR19-062) from Oklahoma Center for the Advancement of Science and Technology. This research used resources of the Oak Ridge Leadership Computing Facility at the Oak Ridge National Laboratory, which is supported by the Office of Science of the U.S. Department of Energy under Contract No. DE-AC05-00OR22725. The general methodology development of biomedical deep learning with high-performance computing was supported in part by National Center for Complementary & Integrative Health and National Institute of General Medical Sciences (R01AT011618). Histology service provided by the Tissue Pathology Shared Resource was supported in part by the National Institute of General Medical Sciences Grant P20GM103639 and National Cancer Institute Grant P30CA225520 of the National Institutes of Health.
Funding
Oklahoma Center for the Advancement of Science and Technology (Grant No. HR19-062); 2020 Faculty Investment Program from University of Oklahoma; 2020 Junior Faculty; Fellowship from University of Oklahoma; National Institute of General Medical Sciences (P20GM103639, R01AT011618); National Center for Complementary & Integrative Health (R01AT011618); National Cancer Institute (P30CA225520).
Footnotes
Disclosure
The authors declare no conflicts of interest related to this article.
Reference
- 1.Hasson HM, et al. , Open laparoscopy: 29-year experience. Obstet Gynecol, 2000. 96(5 Pt 1): p. 763–6. [DOI] [PubMed] [Google Scholar]
- 2.McKernan JB and Champion JK, Access techniques: Veress needle--initial blind trocar insertion versus open laparoscopy with the Hasson trocar. Endosc Surg Allied Technol, 1995. 3(1): p. 35–8. [PubMed] [Google Scholar]
- 3.Vilos GA, et al. , Laparoscopic entry: a review of techniques, technologies, and complications. J Obstet Gynaecol Can, 2007. 29(5): p. 433–447. [DOI] [PubMed] [Google Scholar]
- 4.Reynolds W Jr., The first laparoscopic cholecystectomy. JSLS, 2001. 5(1): p. 89–94. [PMC free article] [PubMed] [Google Scholar]
- 5.Frazee RC, et al. , A prospective randomized trial comparing open versus laparoscopic appendectomy. Ann Surg, 1994. 219(6): p. 725–8; discussion 728–31. [DOI] [PMC free article] [PubMed] [Google Scholar]
- 6.Giseke S, et al. , A true laparoscopic herniotomy in children: evaluation of long-term outcome. J Laparoendosc Adv Surg Tech A, 2010. 20(2): p. 191–4. [DOI] [PubMed] [Google Scholar]
- 7.Belachew M, et al. , Laparoscopic adjustable gastric banding. World J Surg, 1998. 22(9): p. 955–63. [DOI] [PubMed] [Google Scholar]
- 8.Jacobs M, Verdeja JC, and Goldstein HS, Minimally invasive colon resection (laparoscopic colectomy). Surg Laparosc Endosc, 1991. 1(3): p. 144–50. [PubMed] [Google Scholar]
- 9.Srivastava A and Niranjan A, Secrets of safe laparoscopic surgery: Anaesthetic and surgical considerations. J Minim Access Surg, 2010. 6(4): p. 91–4. [DOI] [PMC free article] [PubMed] [Google Scholar]
- 10.Netter FH, Atlas of human anatomy, in Netter Basic Science. 2019, Saunders/Elsevier,: Philadelphia, PA. p. 1 online resource. [Google Scholar]
- 11.Volz J, et al. , Pathophysiologic features of a pneumoperitoneum at laparoscopy: a swine model. Am J Obstet Gynecol, 1996. 174(1 Pt 1): p. 132–40. [DOI] [PubMed] [Google Scholar]
- 12.Tanaka C, et al. , Optical trocar access for initial trocar placement in laparoscopic gastrointestinal surgery: A propensity score-matching analysis. Asian J Endosc Surg, 2019. 12(1): p. 37–42. [DOI] [PubMed] [Google Scholar]
- 13.Vilos GA, Litigation of laparoscopic major vessel injuries in Canada. J Am Assoc Gynecol Laparosc, 2000. 7(4): p. 503–9. [DOI] [PubMed] [Google Scholar]
- 14.Vilos GA, Laparoscopic bowel injuries: forty litigated gynaecological cases in Canada. J Obstet Gynaecol Can, 2002. 24(3): p. 224–30. [DOI] [PubMed] [Google Scholar]
- 15.Azevedo JL, et al. , Injuries caused by Veress needle insertion for creation of pneumoperitoneum: a systematic literature review. Surg Endosc, 2009. 23(7): p. 1428–32. [DOI] [PubMed] [Google Scholar]
- 16.Jansen FW, et al. , Complications of laparoscopy: an inquiry about closed- versus open-entry technique. Am J Obstet Gynecol, 2004. 190(3): p. 634–8. [DOI] [PubMed] [Google Scholar]
- 17.Magrina JF, Complications of laparoscopic surgery. Clin Obstet Gynecol, 2002. 45(2): p. 469–80. [DOI] [PubMed] [Google Scholar]
- 18.iDataResearch. Over 13 Million Laparoscopic Procedures are Performed Globally Every Year https://idataresearch.com/over-13-million-laparoscopic-procedures-are-performed-globally-every-year/. 2020.
- 19.Schafer M, Lauper M, and Krahenbuhl L, Trocar and Veress needle injuries during laparoscopy. Surg Endosc, 2001. 15(3): p. 275–80. [DOI] [PubMed] [Google Scholar]
- 20.Ra YS, et al. , The analgesic effect of the ultrasound-guided transverse abdominis plane block after laparoscopic cholecystectomy. Korean J Anesthesiol, 2010. 58(4): p. 362–8. [DOI] [PMC free article] [PubMed] [Google Scholar]
- 21.Pratap A, Oleynikov D, and Kothari V, Real time ultrasound guided insertion of Veress needle in obese patients. Ann R Coll Surg Engl, 2018. 100(2): p. 158–159. [DOI] [PMC free article] [PubMed] [Google Scholar]
- 22.Afifi Y, et al. , New nomogram for safe laparoscopic entry to reduce vascular injury. J Obstet Gynaecol, 2011. 31(1): p. 69–72. [DOI] [PubMed] [Google Scholar]
- 23.Okrainec A, et al. Development of a virtual reality haptic Veress needle insertion simulator for surgical skills training. in MMVR. 2009. [PubMed] [Google Scholar]
- 24.Beregi JP and Greffier J, Low and ultra-low dose radiation in CT: Opportunities and limitations. Diagn Interv Imaging, 2019. 100(2): p. 63–64. [DOI] [PubMed] [Google Scholar]
- 25.Carvalho JC, Ultrasound-facilitated epidurals and spinals in obstetrics. Anesthesiol Clin, 2008. 26(1): p. 145–58, vii-viii. [DOI] [PubMed] [Google Scholar]
- 26.Huang D, et al. , Optical coherence tomography. Science, 1991. 254(5035): p. 1178–81. [DOI] [PMC free article] [PubMed] [Google Scholar]
- 27.Fujimoto J and Swanson E, The Development, Commercialization, and Impact of Optical Coherence Tomography. Invest Ophthalmol Vis Sci, 2016. 57(9): p. OCT1–OCT13. [DOI] [PMC free article] [PubMed] [Google Scholar]
- 28.Tumlinson AR, et al. , Miniature endoscope for simultaneous optical coherence tomography and laser-induced fluorescence measurement. Appl Opt, 2004. 43(1): p. 113–21. [DOI] [PubMed] [Google Scholar]
- 29.Han S, et al. , Handheld forward-imaging needle endoscope for ophthalmic optical coherence tomography inspection. J Biomed Opt, 2008. 13(2): p. 020505. [DOI] [PubMed] [Google Scholar]
- 30.Schulz-Hildebrandt H, et al. , Novel endoscope with increased depth of field for imaging human nasal tissue by microscopic optical coherence tomography. Biomed Opt Express, 2018. 9(2): p. 636–647. [DOI] [PMC free article] [PubMed] [Google Scholar]
- 31.Wang C, et al. , Deep-learning-aided forward optical coherence tomography endoscope for percutaneous nephrostomy guidance. Biomed Opt Express, 2021. 12(4): p. 2404–2418. [DOI] [PMC free article] [PubMed] [Google Scholar]
- 32.Tang QG, et al. , Real-time epidural anesthesia guidance using optical coherence tomography needle probe. Quantitative Imaging in Medicine and Surgery, 2015. 5(1): p. 118–124. [DOI] [PMC free article] [PubMed] [Google Scholar]
- 33.Litjens G, et al. , A survey on deep learning in medical image analysis. Medical Image Analysis, 2017. 42: p. 60–88. [DOI] [PubMed] [Google Scholar]
- 34.Shen D, Wu G, and Suk H-I, Deep Learning in Medical Image Analysis. Annual Review of Biomedical Engineering, 2017. 19(1): p. 221–248. [DOI] [PMC free article] [PubMed] [Google Scholar]
- 35.He K, et al. Deep residual learning for image recognition. in Proceedings of the IEEE conference on computer vision and pattern recognition. 2016. [Google Scholar]
- 36.Szegedy C, et al. Rethinking the inception architecture for computer vision. in Proceedings of the IEEE conference on computer vision and pattern recognition. 2016. [Google Scholar]
- 37.Chollet F Xception: Deep learning with depthwise separable convolutions. in Proceedings of the IEEE conference on computer vision and pattern recognition. 2017. [Google Scholar]
- 38.Raschka S, Model evaluation, model selection, and algorithm selection in machine learning. arXiv preprint arXiv:1811.12808, 2018. [Google Scholar]
- 39.Varma S and Simon R, Bias in error estimation when using cross-validation for model selection. BMC Bioinformatics, 2006. 7(1): p. 91. [DOI] [PMC free article] [PubMed] [Google Scholar]
- 40.Iizuka N, et al. , Oligonucleotide microarray for prediction of early intrahepatic recurrence of hepatocellular carcinoma after curative resection. The Lancet, 2003. 361(9361): p. 923–929. [DOI] [PubMed] [Google Scholar]
- 41.Xia X, Xu C, and Nan B Inception-v3 for flower classification. in 2017 2nd International Conference on Image, Vision and Computing (ICIVC). 2017. IEEE. [Google Scholar]
- 42.Kassani SH, et al. Diabetic retinopathy classification using a modified xception architecture. in 2019 IEEE International Symposium on Signal Processing and Information Technology (ISSPIT). 2019. IEEE. [Google Scholar]
- 43.Schafer M, Lauper M, and Krahenbuhl L, Trocar and Veress needle injuries during laparoscopy. Surgical Endoscopy-Ultrasound and Interventional Techniques, 2001. 15(3): p. 275–280. [DOI] [PubMed] [Google Scholar]
- 44.Azevedo JLMC, et al. , Injuries caused by Veress needle insertion for creation of pneumoperitoneum: a systematic literature review. Surgical Endoscopy and Other Interventional Techniques, 2009. 23(7): p. 1428–1432. [DOI] [PubMed] [Google Scholar]
- 45.Olsen DO, Laparoscopic Cholecystectomy. American Journal of Surgery, 1991. 161(3): p. 339–344. [DOI] [PubMed] [Google Scholar]
- 46.Izatt JA, et al. , In vivo bidirectional color Doppler flow imaging of picoliter blood volumes using optical coherence tomograghy. Optics Letters, 1997. 22(18): p. 1439–1441. [DOI] [PubMed] [Google Scholar]
- 47.Chen Z, et al. , Optical Doppler tomographic imaging of fluid flow velocity in highly scattering media. Optics Letters, 1997. 22(1): p. 64–66. [DOI] [PubMed] [Google Scholar]
- 48.Liang CP, et al. , A forward-imaging needle-type OCT probe for image guided stereotactic procedures. Opt Express, 2011. 19(27): p. 26283–94. [DOI] [PMC free article] [PubMed] [Google Scholar]
- 49.Welge WA and Barton JK, In vivo endoscopic Doppler optical coherence tomography imaging of the colon. Lasers in Surgery and Medicine, 2017. 49(3): p. 249–257. [DOI] [PMC free article] [PubMed] [Google Scholar]
- 50.Pahlevaninezhad H, et al. , Endoscopic Doppler optical coherence tomography and autofluorescence imaging of peripheral pulmonary nodules and vasculature. Biomedical Optics Express, 2015. 6(10): p. 4191–4199. [DOI] [PMC free article] [PubMed] [Google Scholar]
- 51.Yang VXD, et al. , Endoscopic Doppler optical coherence tomography in the human GI tract: initial experience. Gastrointestinal Endoscopy, 2005. 61(7): p. 879–890. [DOI] [PubMed] [Google Scholar]
- 52.Wang C, et al. , Deep-learning-aided forward optical coherence tomography endoscope for percutaneous nephrostomy guidance. Biomedical Optics Express, 2021. 12(4): p. 2404–2418. [DOI] [PMC free article] [PubMed] [Google Scholar]
- 53.Wang C, et al. , Laparoscopic optical coherence tomography system for 3D bladder tumor detection. SPIE BiOS. Vol. 11619. 2021: SPIE. [Google Scholar]
Associated Data
This section collects any data citations, data availability statements, or supplementary materials included in this article.


