Abstract
Chronic obstructive pulmonary disease (COPD) is a chronic inflammatory lung disease and a major cause of death and disability worldwide. Quantitative CT is a powerful tool to better understand the heterogeneity and severity of this disease. Quantitative CT is being increasingly used in COPD research, and the recent advancements in CT technology have made it even more encouraging. One recent advancement has been the development of photon-counting detectors, offering higher spatial resolution, higher image contrast, and lower noise levels in the images. However, the quantification performance of this new technology compared to conventional scanners remains unknown. Additionally, different protocol settings (e.g., different dose levels, slice thicknesses, reconstruction kernels and algorithms) affect quantifications in an unsimilar fashion. This study investigates the potential advantages of photon-counting CT (PCCT) against conventional energy-integrating detector (EID) CT and explores the effects of protocol settings on lung density quantifications in COPD patients. This study was made possible using a virtual imaging platform, taking advantage of anthropomorphic phantoms with COPD (COPD-XCAT) and a scanner-specific CT simulator (DukeSim). Having the physical and geometrical properties of three Siemens commercial scanners (Flash, Force for EID and NAEOTOM Alpha for PCCT) modeled, we simulated CT images of ten COPD-XCAT phantoms at 0.63 and 3.17 mGy dose levels and reconstructed at three levels of kernel sharpness. The simulated CT images were quantified in terms of “Lung mean absolute error (MAE),” “LAA −950,” “Perc 15,” “Lung mass” imaging biomarkers and compared against the ground truth values of the phantoms. The intra-scanner assessment demonstrated the superior qualitative and quantitative performance of the PCCT scanner over the conventional scanners (21.01% and 22.74% mean lung MAE improvement, and 53.97% and 68.13% mean LAA −950 error improvement compared to Flash and Force). The results also showed that higher mAs, thinner slices, smoother kernels, and iterative reconstruction could lead to more accurate and precise quantification scores. This study underscored the qualitative and quantitative benefits of PCCT against conventional EID scanners as well as the importance of optimal protocol choice within scanners for more accurate quantifications.
1. Introduction
Chronic obstructive pulmonary disease (COPD) is the fourth leading cause of death in the United States [1], and its prevalence is expected to increase with population aging [2]. COPD is a heterogeneous condition and is characterized by chronic airflow obstruction in the lungs. A better understanding of the severity and heterogeneity of this disease would lead to better management and treatment of patients [3]. Manual inspection of CT images for pathology is time-consuming and also affected by observer variability. Quantitative computed tomography (CT) has proved to be a promising technique in detecting pathologies in a non-invasive, objective, and quick manner [4]–[6].
During the past decades, advancements in CT technology have created more opportunities for quantitative imaging. One recent advancement has been the development of photon-counting detectors, which can resolve energy information for incident x-ray photons. With PCCT systems emerging in clinical use, they need comparisons against conventional scanners and optimization for their specific clinical applications, taking into consideration various parameters that can affect the acquired CT scan (such as dose levels, slice thicknesses, and reconstruction algorithms and kernels). Such studies could be performed using physical phantoms, but they undermine the complexity of the human population. It would be also infeasible to use actual patient images mainly due to ethical limitations in repetitive studies and absence of ground truth.
Through the use of computational phantoms and imaging simulators, virtual imaging trials (VITs) can overcome the mentioned challenges providing an efficient alternative for enabling a fast and inexpensive trial by conducting experiments entirely on the computer [7]. Having access to the anatomical and physiological ground truth data provided by the computational phantoms is also advantageous to optimize CT protocols by providing a means for quantitative comparisons. The purpose of this study was to investigate the potential benefits of PCCT versus conventional CT and optimize its protocols for COPD quantifications using a virtual imaging platform.
2. Materials and Methods
The virtual imaging platform consisted of three main components: 1) computational COPD phantoms, 2) a realistic CT simulator that accounts for the physics and geometry of standard and photon-counting scanners, and 3) biomarker assessment for the simulated images.
2.1. Computational COPD models
The study used ten COPD-XCAT phantoms (five male, five female) with different body mass indices (BMI). Each COPD phantom consisted of a model for the body habitus as well as a model for emphysema including the material information [8].
For the body habitus, the base phantoms were selected from the 4D extended cardiac-torso (XCAT) phantom series developed at Duke University. The XCAT series includes over 150 full-body adult models of both sexes with varying BMIs. These phantoms contain thousands of anatomical structures [9], [10] with parametrized models of the cardiac and respiratory motions, as well as intra-organ structures, such as the lungs [11] and bones [12]. For modeling the abnormality morphological features, we randomly selected ten clinical cases from the COPDGene Phase 1 dataset, representing various sizes and distributions of emphysema [1]. The emphysematous regions were manually segmented for each COPD case and inserted into the closest phantom from the XCAT library based on features such as body diameter, sex, and age. Linear attenuation coefficients of different materials in each phantom were estimated using their corresponding elemental composition and density [8].
2.2. CT simulator
We used a validated and scanner-specific CT simulation platform (DukeSim) to generate projection images from the COPD-XCAT phantoms [13], [14]. DukeSim takes a computational phantom and a parameter file as its input and uses ray-tracing and Monte Carlo (MC) techniques to estimate primary and scatter photons that hit detector elements, respectively. Taking into account the physics of x-ray source and detectors, DukeSim then combines these two signals, computes projection images, and pre-processes them.
In this study, DukeSim was used to model the physical and geometrical properties of two EID commercial scanners (SOMATOM Definition Flash, SOMATOM Force, Siemens) and one PCCT commercial scanner (NAEOTOM Alpha, Siemens). Virtual acquisitions were performed at 2 dose levels (CTDIvol of 0.63 and 3.17 mGy) with scanner-specific x-ray spectra (120 kV) and bowtie filters, a pitch of 1.0, and tube current modulation (TCM) with “average” modulation strength and a reference diameter of 31.4 cm [15], [16].
The projection images were reconstructed using a vendor-specific reconstruction toolbox (ReconCT, Siemens). The simulation and reconstruction protocol settings are summarized in Table 1.
Table 1.
A summary of CT protocols evaluated in this study
| Scanner Type | Definition Flash | SOMATOM Force | NAEOTOM Alpha | |||
|---|---|---|---|---|---|---|
| Dose - CTDIvol | 0.63 and 3.17 mGy | |||||
| Pixel Size | 0.98 mm (512 × 512 image with a FOV of 500 mm) | |||||
| Slice Thickness | 0.75 and 1.5 mm | 0.40 and 1.5 mm | ||||
| Recon. Type | wFBP and SAFIRE | wFBP and ADMIRE | Standard-PNR | |||
| Recon. Kernel | Br32f, Br49f, Br62f | Br32f, Br49f, Br64f | Br36f, Br48f, Br64f | |||
2.3. Biomarker assessment
Three density-based image biomarkers were used: “LAA −950,” which is the percentage of lung voxels in an inspiratory CT scan having a CT attenuation of −950 HU or less, “Perc 15” which is the CT attenuation value at the 15th percentile of the lung CT histogram, and “Lung mass” which is defined . Each image biomarker was measured for both the reconstructed CT and ground truth phantom volume. Ground truth was established based on the mono-energetic representation of the phantoms at effective energy (67 keV) of the acquisition. Finally, the error for each biomarker (LAA −950, Perc 15, Lung mass) was measured as the difference of measured biomarker in ground truth volume from the one in reconstructed CT volume. The CT images and ground truth were also compared in terms of mean absolute error (MAE). The mean and standard deviation of error values were reported for each protocol (Table 1) across all COPD cases.
3. Results
Figures 1 and 2 present the qualitative comparison of the three scanners at the two different dose levels (Figure 1: low-dose and Figure 2: normal-dose) and two kernels (smooth and medium). CT images were reconstructed with weighted filtered back projection (wFBP) for the Flash and Force scanners and the prior-based noise reduction (PNR) method for the NAEOTOM Alpha PCCT scanner using a vendor-specific reconstruction toolbox (ReconCT, Siemens Healthineers). The qualitative comparisons suggest the closer resemblance of images acquired by the PCCT scanner to the ground truth. Figure 3 shows the MAE results across all patients for different protocol settings. Figures 4 to 6 show the accuracy of imaging biomarkers across all three scanners and protocol settings. The data suggest that the PCCT scanner was more accurate and less variable across tested protocols. Comparing the mean results of lung MAE for different scanners across tested protocol settings demonstrates a 16.15% and 25.69% improvement for the PCCT NAEOTOM Alpha scanner compared to Flash and Force, respectively. Likewise, the LAA −950 mean error comparison within scanners shows a similar trend with 59.49% and 63.19% improvement in the same order. Table 2 provides the error percent relative change for each biomarker across all protocol settings when switching from conventional scanners (Flash, Force) to the PCCT NAEOTOM Alpha scanner. The averaged imaging biomarker values are written inside the parentheses for each switching condition and imaging biomarker. For calculating percent relative change, the measurements in the Flash and Force scanners were considered as the reference and compared against the PCCT NAEOTOM Alpha scanner.
Figure 1.
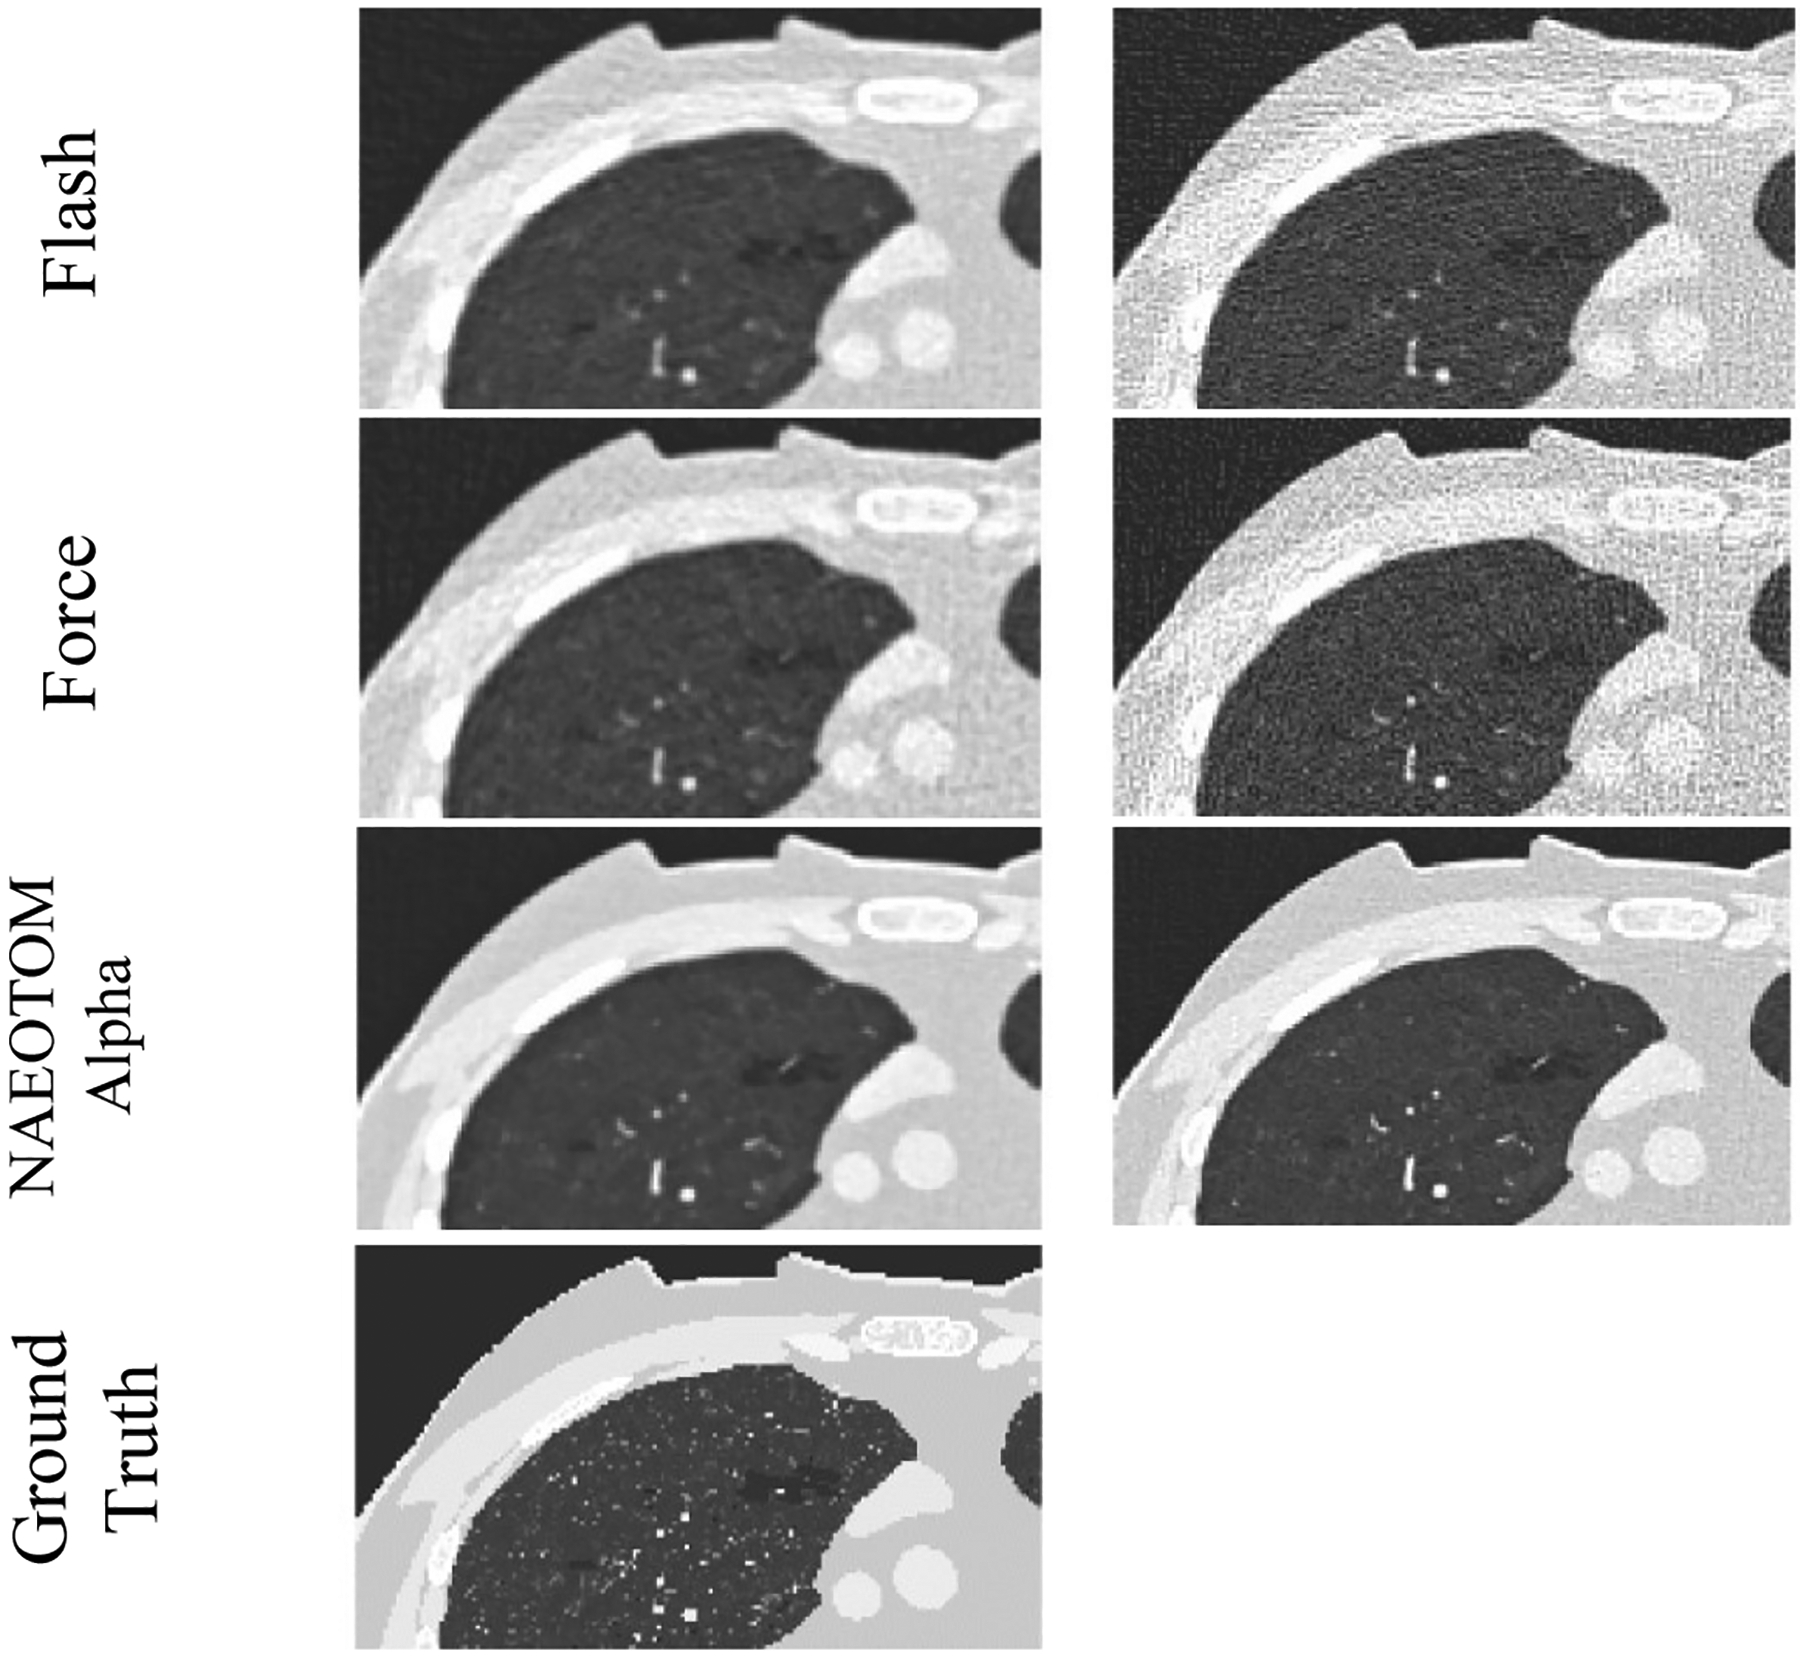
Magnified simulated images of three commercial scanners (Flash, Force, and NAEOTOM Alpha, Siemens) at fixed protocol settings (120 kV, pitch of 1, CTDIvol of 0.63 mGy, with TCM)
Figure 2.
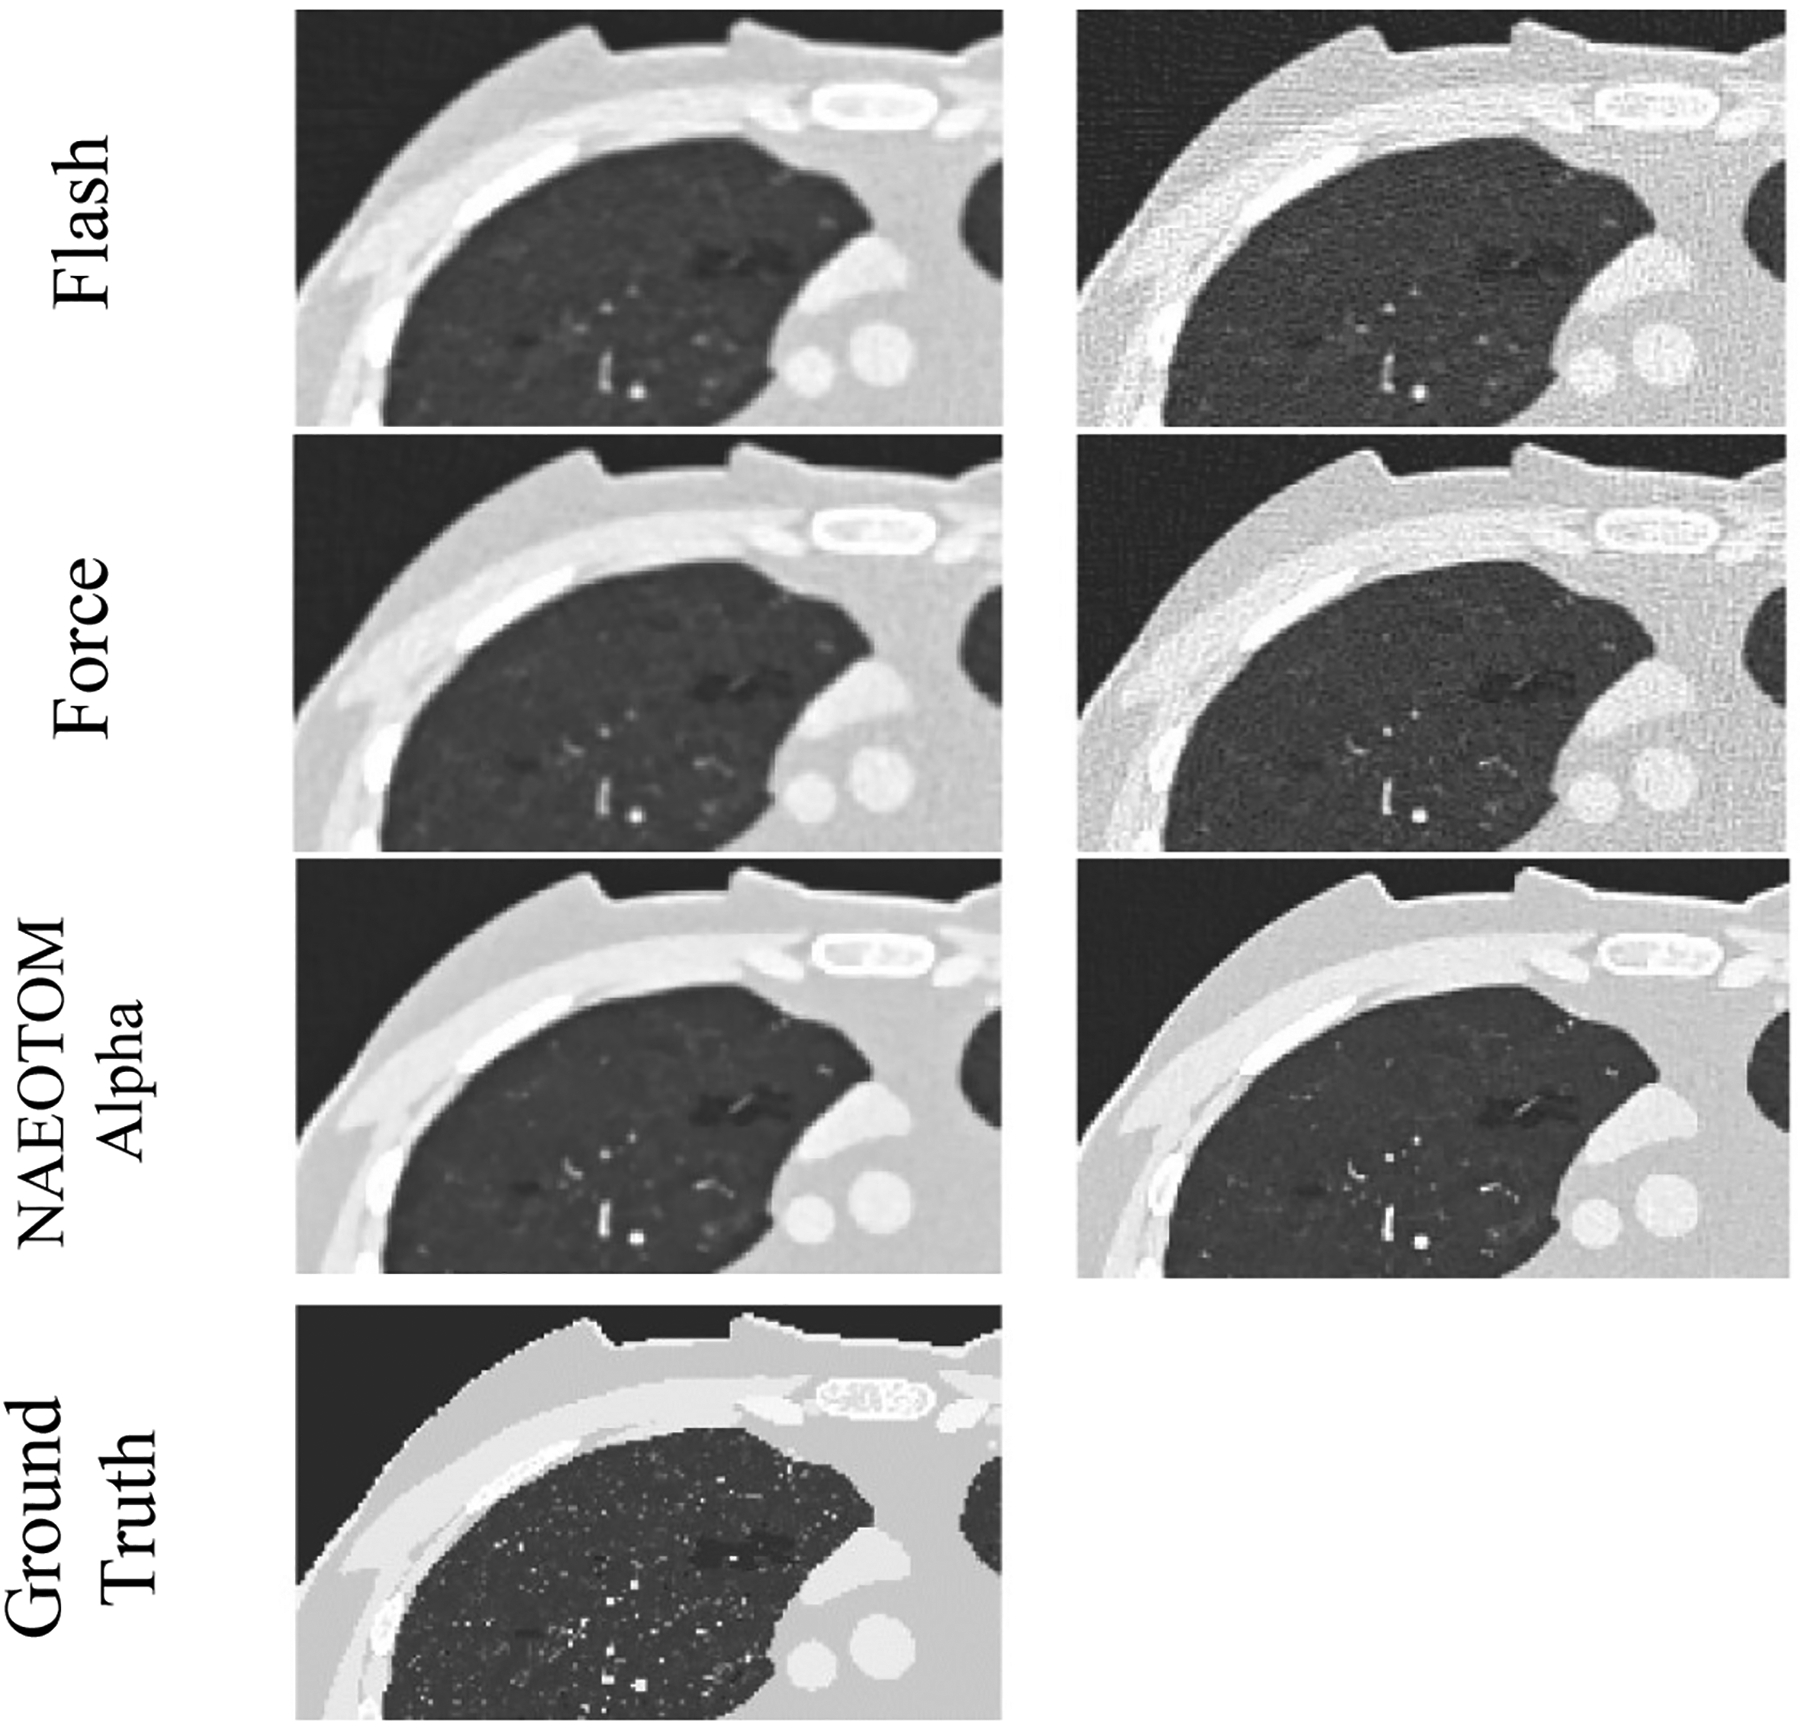
Magnified simulated images of three commercial scanners (Flash, Force, and NAEOTOM Alpha, Siemens) at fixed protocol settings (120 kVp, pitch of 1, CTDIvol of 3.15 mGy, with TCM)
Figure 3.
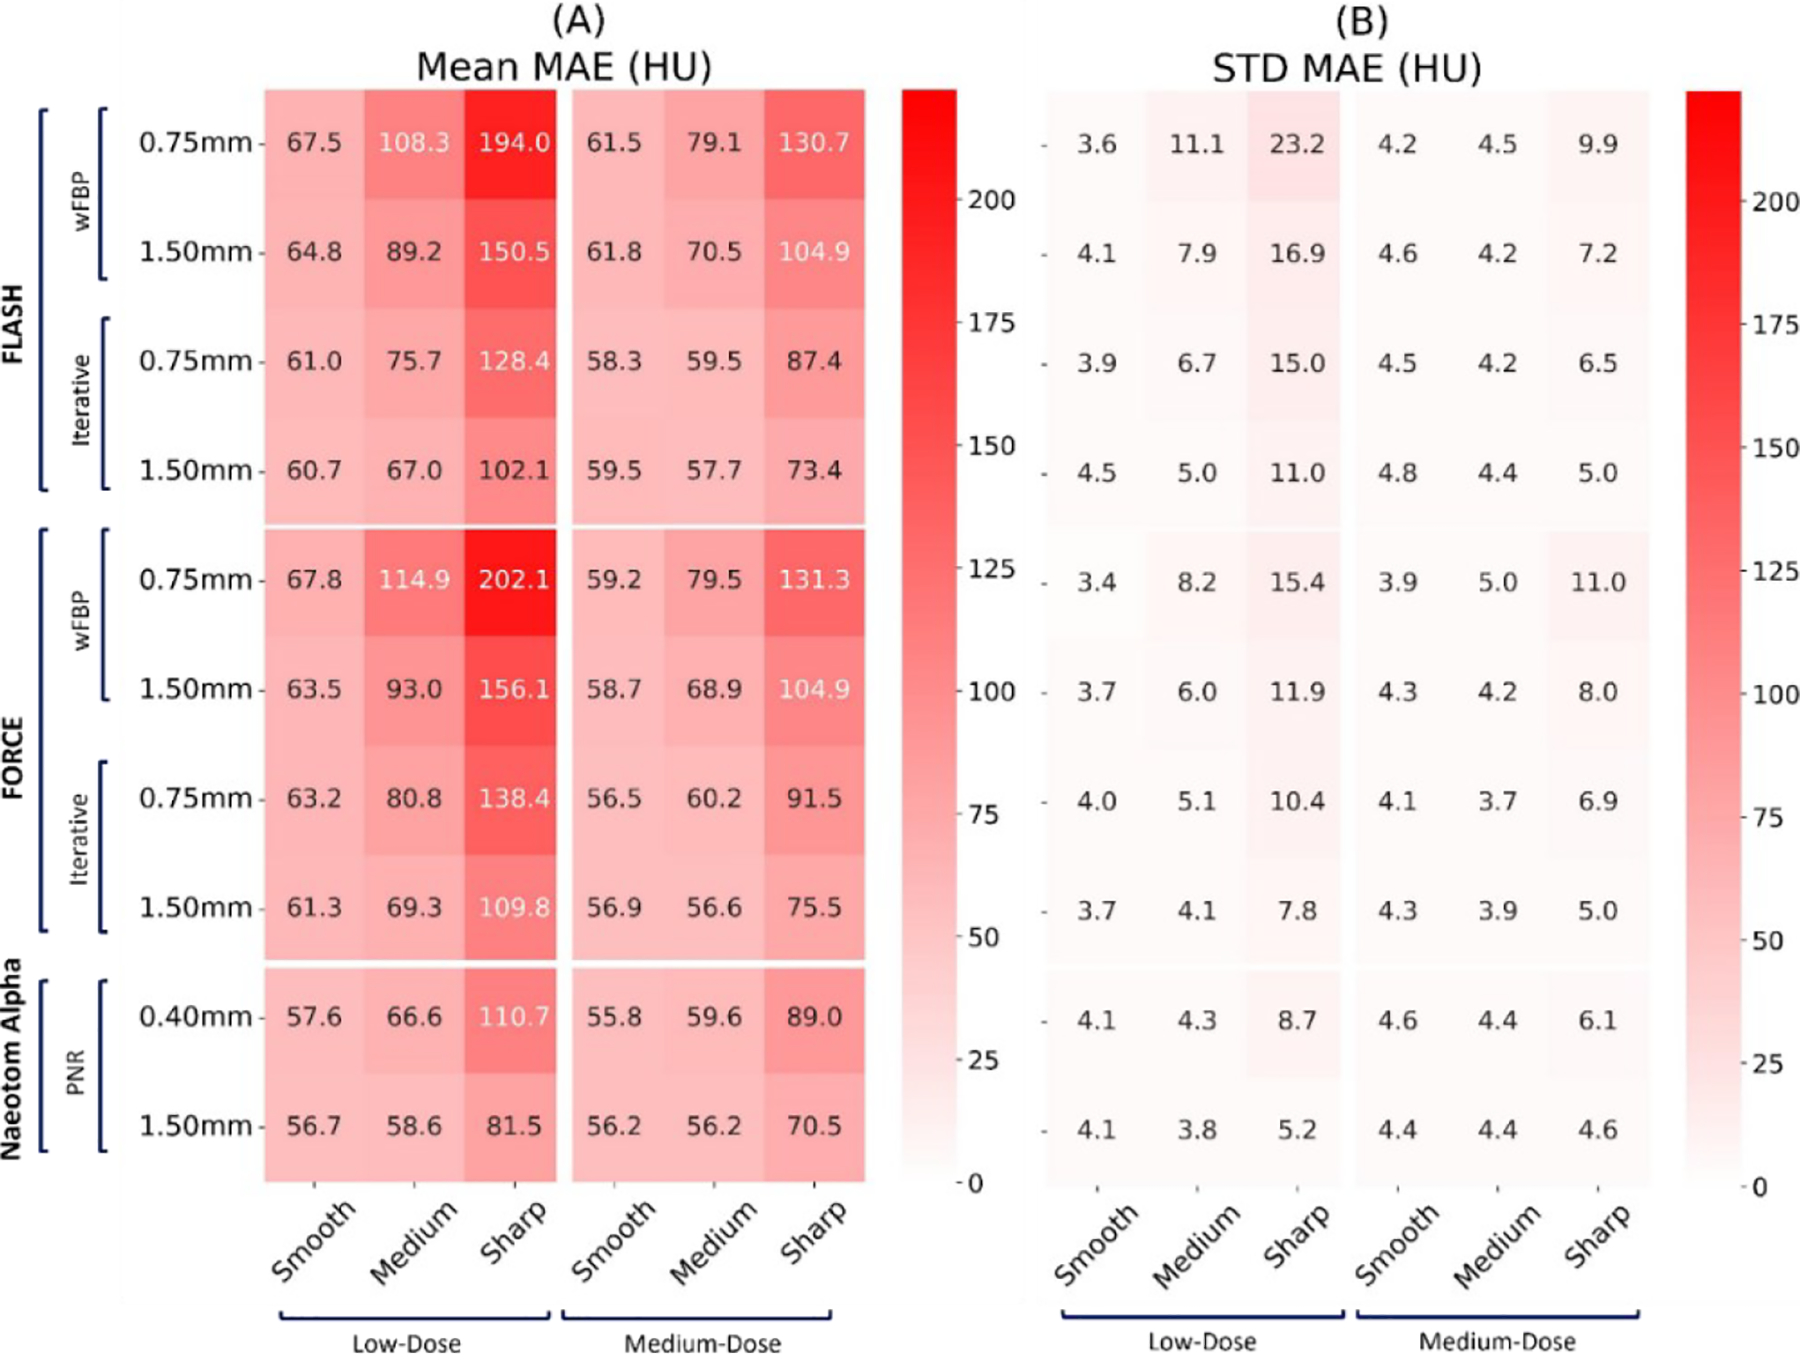
Mean and standard deviation of the lung mean absolute error (MAE) on three commercial scanners (Flash, Force, NAEOTOM Alpha, Siemens) across all protocol settings. The values reported at each row report slice thickness values.
Figure 4.
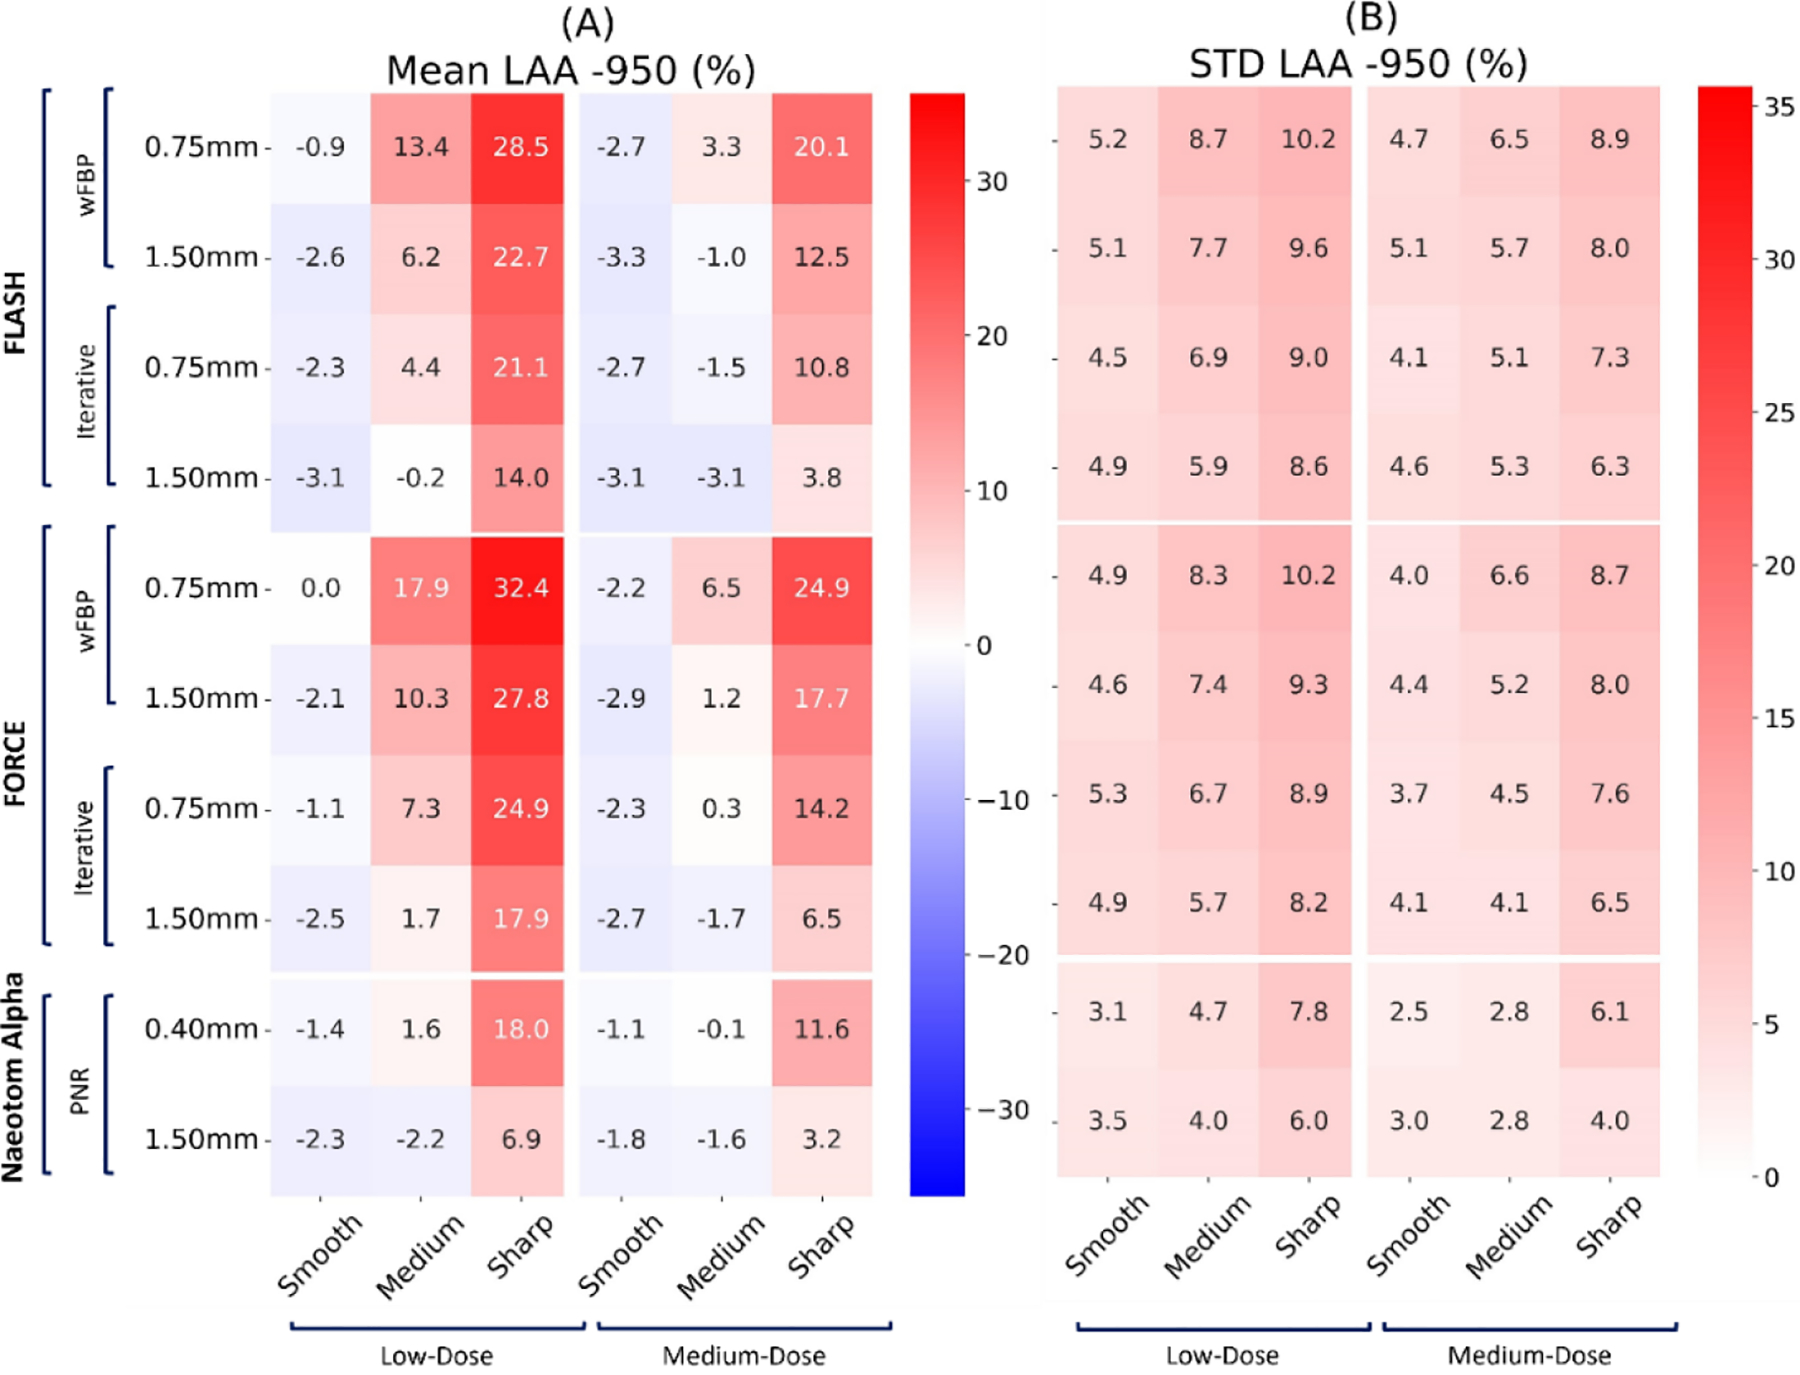
Mean and standard deviation of the “LAA −950” biomarker error on three commercial scanners (Flash, Force, NAEOTOM Alpha, Siemens) across all protocol settings. The values reported at each row report slice thickness values.
Figure 6.
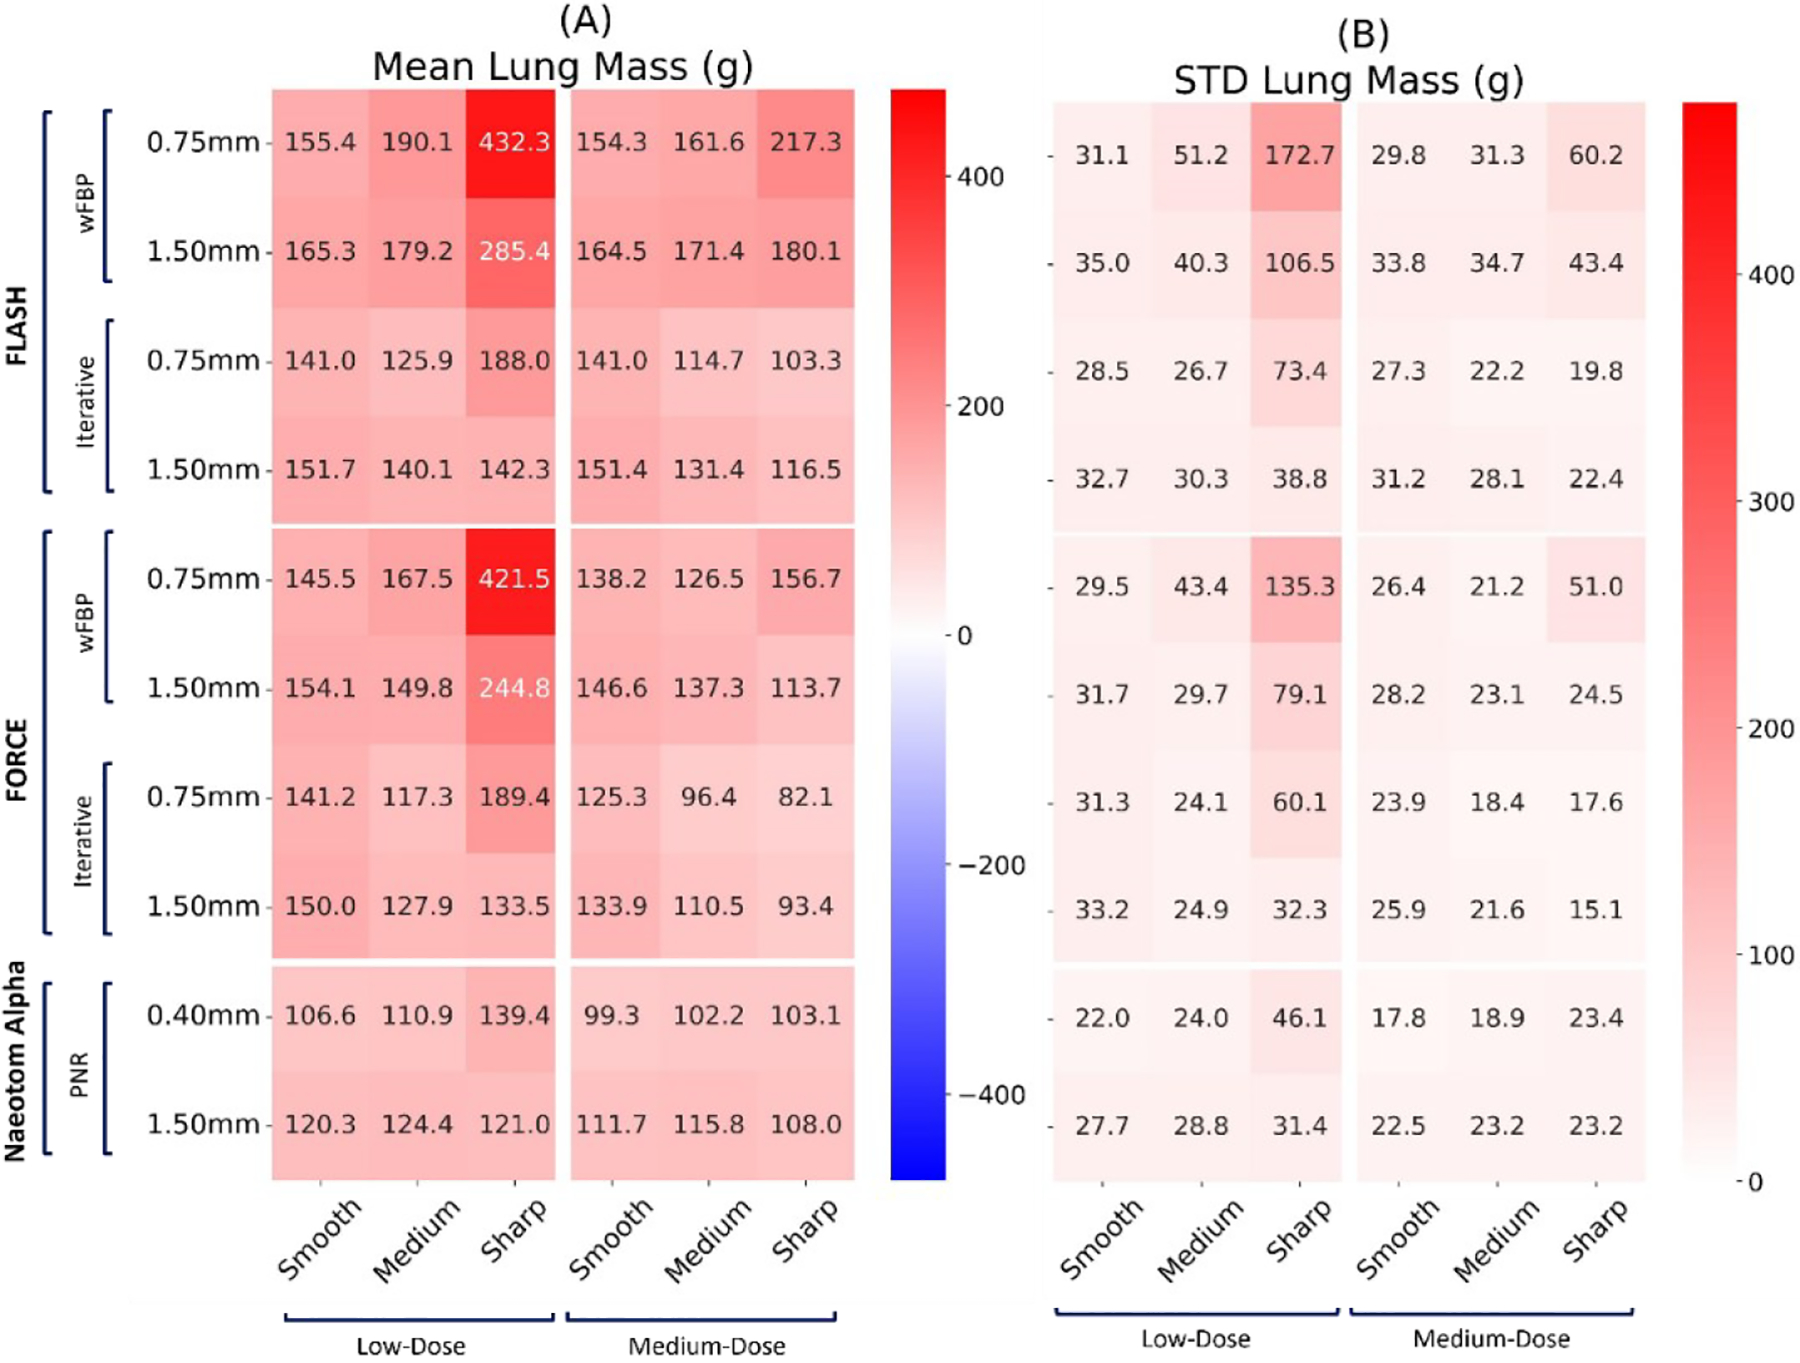
Mean and standard deviation of the “Lung mass” biomarker error on three commercial scanners (Flash, Force, NAEOTOM Alpha, Siemens) across all protocol settings. The values reported at each row report slice thickness values.
Table 2.
Error percent relative change for each biomarker across all protocol settings
| Error % Relative Change╲Biomarkers | Lung MAE | LAA −950 | Perc 15 | Lung mass |
|---|---|---|---|---|
| Flash > NAEOTOM Alpha (Reference > New) | −21.01% (86.39 to 68.24) | −53.97% (5.59 to 2.58) | −52.11% (−25.28 to −12.11) | −33.59% (171.01 to 113.58) |
| Force > NAEOTOM Alpha (Reference > New) | −22.74% (88.33 to 68.24) | −68.13% (8.08 to 2.58) | −64.35% (−33.96 to −12.11) | −24.35% (150.13 to 113.58) |
4. Conclusion
We investigated the potential benefits of a PCCT scanner against two conventional scanners and explored the effects of protocols on quantification performance within the context of COPD imaging, through a virtual imaging trial platform. In the inter-scanner assessment, the results demonstrated the superior performance of the PCCT scanner over the two conventional scanners both qualitatively and quantitatively. The intra-scanner optimization of protocols showed that using higher mAs, thinner slices, and smoother kernels could lead to better quantification performance of the scanners. Further, the iterative reconstruction algorithms led to more accurate quantifications. This study underscored the importance of protocol choice in achieving optimal CT quantification performance and also demonstrated the capability of PCCT scanners in acquiring more accurate and consistent COPD quantifications, making this new technology a promising technique in better management of COPD patients.
Figure 5.
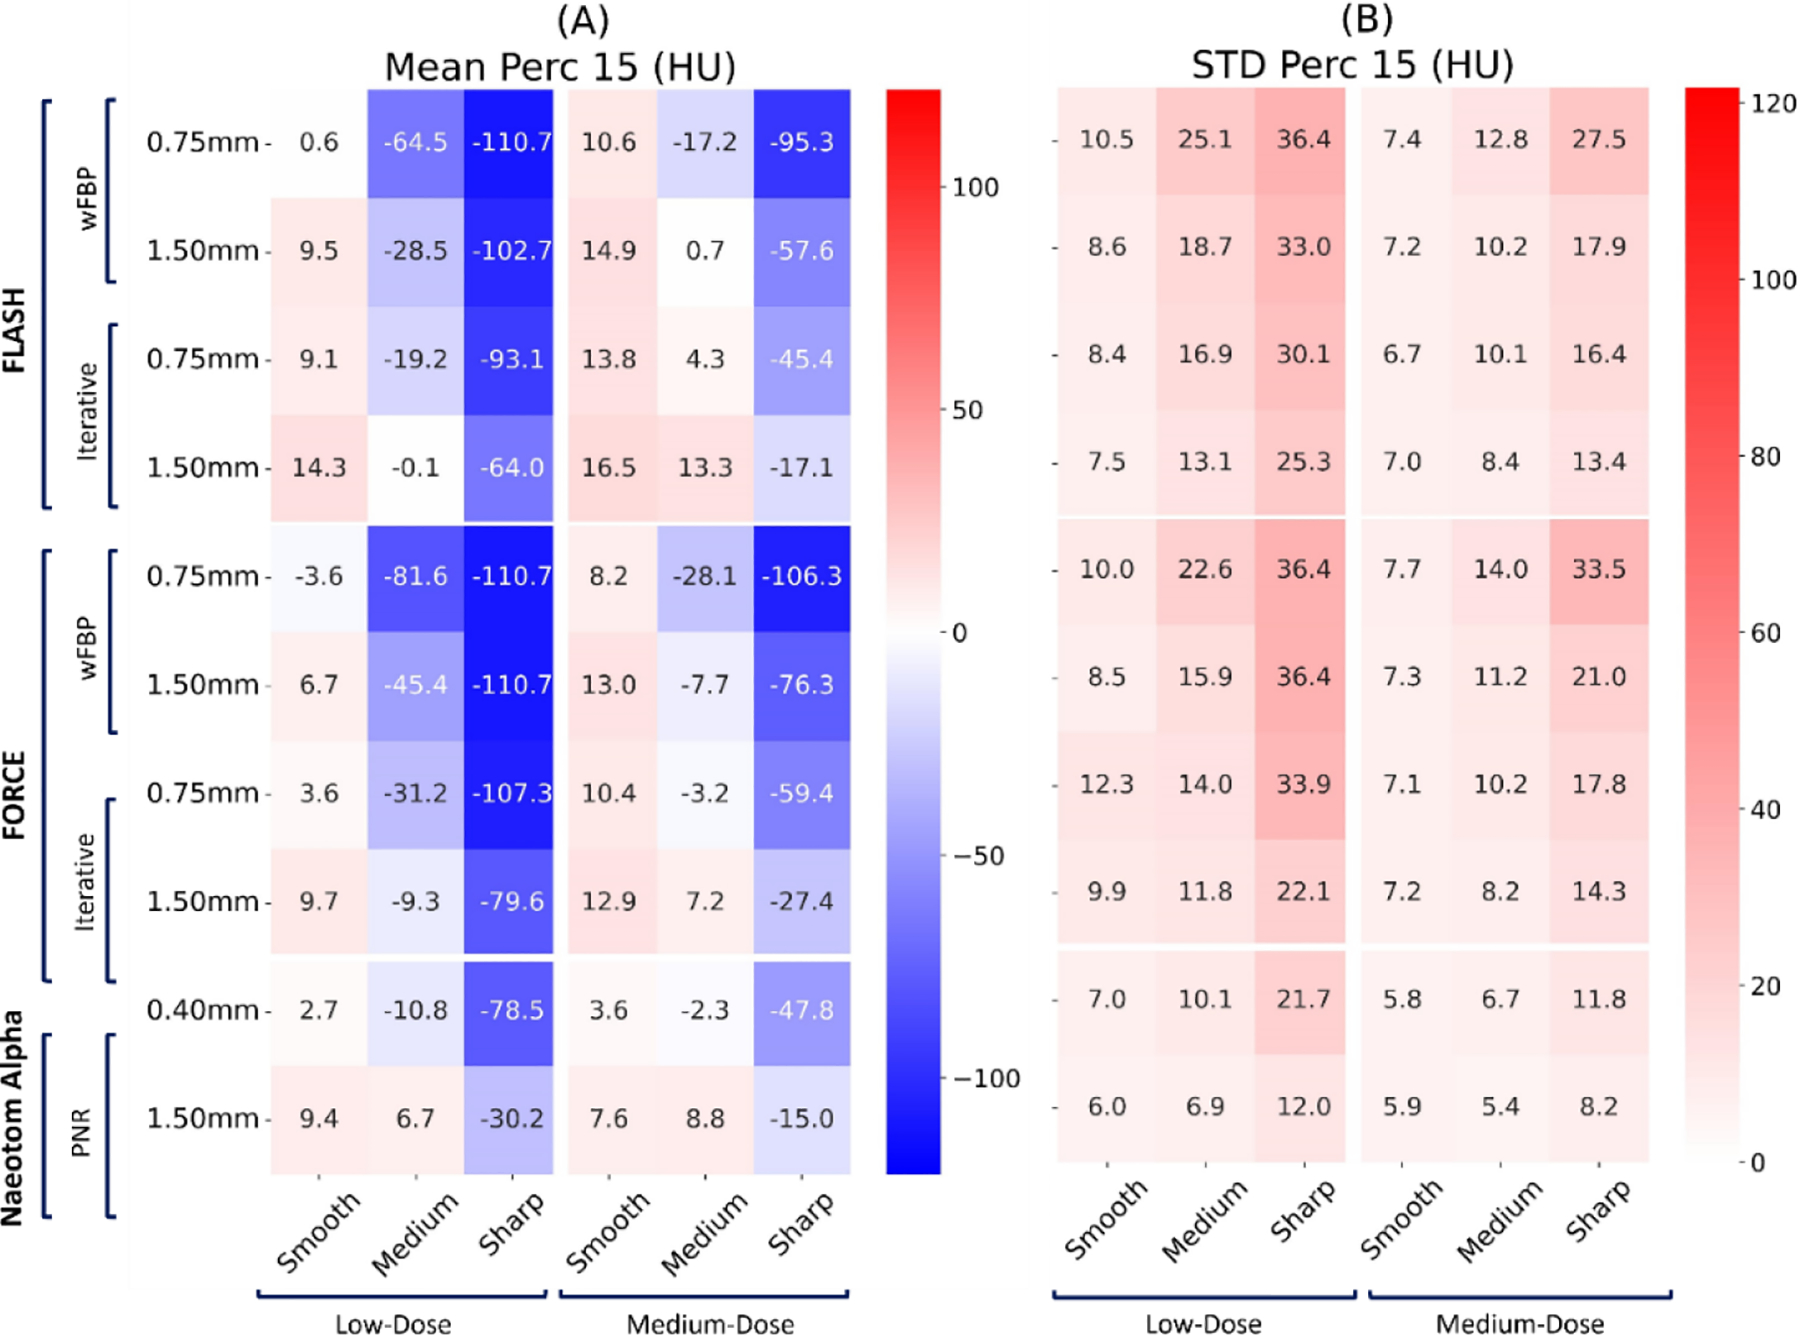
Mean and standard deviation of the “Perc 15” biomarker error on three commercial scanners (Flash, Force, NAEOTOM Alpha, Siemens) across all protocol settings. The values reported at each row report slice thickness values.
Acknowledgments
The study was supported in part by the National Institutes of Health (R01HL155293 & P41EB028744).
References
- [1].Regan EA, Hokanson JE, Murphy JR, Make B, Lynch DA, Beaty TH, Curran-Everett D, Silverman EK, and Crapo JD, “Genetic Epidemiology of COPD (COPDGene) Study Design,” J. Chronic Obstr. Pulm. Dis, vol. 7, no. 1, pp. 32–43, 2010, doi: 10.3109/15412550903499522. [DOI] [PMC free article] [PubMed] [Google Scholar]
- [2].Adeloye D, Chua S, Lee C, Basquill C, Papana A, Theodoratou E, Nair H, Gasevic D, Sridhar D, Campbell H, et al. , “Global and regional estimates of COPD prevalence: Systematic review and metaanalysis,” J. Glob. Health, vol. 5, no. 2, 2015, doi: 10.7189/jogh.05.020415. [DOI] [PMC free article] [PubMed] [Google Scholar]
- [3].Mets OM, De Jong PA, Van Ginneken B, Gietema HA, and Lammers JWJ, “Quantitative computed tomography in COPD: Possibilities and limitations,” Lung, vol. 190, no. 2, pp. 133–145, 2012, doi: 10.1007/s00408-011-9353-9. [DOI] [PMC free article] [PubMed] [Google Scholar]
- [4].Lowe KE, Regan EA, Anzueto A, Austin E, Austin JHM, Beaty TH, Benos PV, Benway CJ, Bhatt SP, Bleecker ER, et al. , “COPDGene® 2019: Redefining the diagnosis of chronic obstructive pulmonary disease,” Chronic Obstr. Pulm. Dis, vol. 6, no. 5, pp. 384–399, 2019, doi: 10.15326/jcopdf.6.5.2019.0149. [DOI] [PMC free article] [PubMed] [Google Scholar]
- [5].Hoffman EA, Lynch DA, Barr RG, Van Beek EJR, and Parraga G, “Pulmonary CT and MRI phenotypes that help explain chronic pulmonary obstruction disease pathophysiology and outcomes,” J. Magn. Reson. Imaging, vol. 43, no. 3, pp. 544–557, 2016, doi: 10.1002/jmri.25010. [DOI] [PMC free article] [PubMed] [Google Scholar]
- [6].Bhatt SP, Washko GR, Hoffman EA, Newell JD, Bodduluri S, Diaz AA, Galban CJ, Silverman EK, José Estépar RS, and Lynch DA, “Imaging advances in chronic obstructive pulmonary disease insights from the genetic epidemiology of chronic obstructive pulmonary disease (COPDGene) study,” Am. J. Respir. Crit. Care Med, vol. 199, no. 3, pp. 286–301, 2019, doi: 10.1164/rccm.2018071351SO. [DOI] [PMC free article] [PubMed] [Google Scholar]
- [7].Abadi E, Segars WP, Tsui BMW, Kinahan PE, Bottenus N, Frangi AF, Maidment A, Lo J, and Samei E, “Virtual clinical trials in medical imaging: a review,” J. Med. Imaging, vol. 7, no. 4, p. 042805, 2020, doi: 10.1117/1. [DOI] [PMC free article] [PubMed] [Google Scholar]
- [8].Abadi E, Jadick G, Hoffman EA, Lynch D, Segars WP, and Samei E, “COPD quantifications via CT imaging: ascertaining the effects of acquisition protocol using virtual imaging trial,” no. February, p. 15, 2021, doi: 10.1117/12.2581965. [DOI] [Google Scholar]
- [9].Segars WP, Sturgeon G, Mendonca S, Grimes J, and Tsui BMW, “4D XCAT phantom for multimodality imaging research,” Med. Phys, vol. 37, no. 9, pp. 4902–4915, 2010, doi: 10.1118/1.3480985. [DOI] [PMC free article] [PubMed] [Google Scholar]
- [10].Segars WP, Bond J, Frush J, Hon S, Eckersley C, Williams CH, Feng J, Tward DJ, Ratnanather JT, Miller MI, et al. , “Population of anatomically variable 4D XCAT adult phantoms for imaging research and optimization,” Med. Phys, vol. 40, no. 4, pp. 1–11, 2013, doi: 10.1118/1.4794178. [DOI] [PMC free article] [PubMed] [Google Scholar]
- [11].Abadi E, Segars WP, Sturgeon GM, Roos JE, Ravin CE, and Samei E, “Modeling Lung Architecture in the XCAT Series of Phantoms: Physiologically Based Airways, Arteries and Veins,” IEEE Trans. Med. Imaging, vol. 37, no. 3, pp. 693–702, 2018, doi: 10.1109/TMI.2017.2769640. [DOI] [PMC free article] [PubMed] [Google Scholar]
- [12].Abadi E, Segars WP, Sturgeon GM, Harrawood B, Kapadia A, and Samei E, “Modeling ‘Textured’ Bones in Virtual Human Phantoms,” IEEE Trans. Radiat. Plasma Med. Sci, vol. 3, no. 1, pp. 47–53, 2018, doi: 10.1109/trpms.2018.2828083. [DOI] [PMC free article] [PubMed] [Google Scholar]
- [13].Abadi E, Harrawood B, Sharma S, Kapadia A, Segars WP, and Samei E, “DukeSim A Realistic, Rapid, and Scanner-Specific Simulation Framework in Computed Tomography,” IEEE Trans. Med. Imaging, vol. 38, no. 6, pp. 1457–1465, 2019, doi: 10.1109/TMI.2018.2886530. [DOI] [PMC free article] [PubMed] [Google Scholar]
- [14].Abadi E, Harrawood B, Rajagopal JR, Sharma S, Kapadia A, Segars WP, Stierstorfer K, Sedlmair M, Jones E, and Samei E, “Development of a scanner-specific simulation framework for photon-counting computed tomography,” Biomed. Phys. Eng. Express, vol. 5, no. 5, 2019, doi: 10.1088/2057-1976/ab37e9. [DOI] [PMC free article] [PubMed] [Google Scholar]
- [15].Jadick G, Abadi E, Harrawood B, Sharma S, and Segars WP, “A scanner-specific framework for simulating CT images with tube current modulation,” Phys. Med. Biol, vol. 66, no. 18, 2021, doi: 10.1088/1361-6560/ac2269. [DOI] [PMC free article] [PubMed] [Google Scholar]
- [16].Jadick GL, Abadi E, Harrawood B, Sharma S, Segars WP, and Samei E, “A framework to simulate CT images with tube current modulation,” in SPIE Medical Imaging, 2021, 2021, vol. 1159506, no. February. doi: 10.1117/12.2580983. [DOI] [PMC free article] [PubMed] [Google Scholar]


