

SUMMARY
Interest in harnessing natural killer (NK) cells for cancer immunotherapy is rapidly growing. However, efficacy of NK cell-based immunotherapy remains limited in most trials. Strategies to augment the killing efficacy of NK cells are thus much needed. In the current study, we found that mitochondrial apoptosis (mtApoptosis) pathway is essential for efficient NK killing, especially at physiologically relevant effector-to-target ratios. Furthermore, NK cells can prime cancer cells for mtApoptosis and mitochondrial priming status affects cancer cell susceptibility to NK-mediated killing. Interestingly, pre-activating NK cells confers on them resistance to BH3 mimetics. Combining BH3 mimetics with NK cells synergistically kill cancer cells in vitro and suppress tumor growth in vivo. The ideal BH3 mimetic to use in such an approach can be predicted by BH3 profiling. We herein report a rational and precision strategy to augment NK-based immunotherapy, which may be adaptable to T cell-based immunotherapies as well.
Keywords: Natural Killer, Immunotherapy, Mitochondrial Apoptosis, BH3 Mimetics, BH3 Profiling, Synergy, Venetoclax, BCL-2, MCL-1, T cells
Graphical Abstract
In Brief
NK cells are an attractive option for cell-based therapy but require optimization. BH3 mimetics chosen by BH3 profiling synergized with NK cell therapy to enhance cancer cell killing by NK cells in an approach that could also be used for other cell therapy platforms.
INTRODUCTION
In the past decade, therapeutic advances in immunotherapy have revolutionized the treatment of multiple cancers. T cells have been at the forefront of immunotherapy research. Despite the successful application of T cell-based immunotherapies to a broad range of cancers, overall, only a fraction of patients experience a life-changing durable response (June et al., 2018; Ribas and Wolchok, 2018; Sharma and Allison, 2020). NK cells are cytotoxic lymphocytes of the innate immune system distinguished by their ability to spontaneously detect and kill infected or malignant cells. NK cells use an array of activating receptors to recognize germline-encoded ligands upregulated on stressed cancer cells without requiring tumor neoantigen presentation by MHC molecules as T cells do (Crinier et al., 2020; Lanier, 2008; Raulet and Guerra, 2009). Thus, NK cells can kill cancer cells with low mutational burden or those lacking neoantigen presentation. Therefore, theoretically a broader spectrum of cancers might respond to NK cellular therapy and NK cells could potentially combat resistance to T cell-based therapies (Bald et al., 2020; Freeman et al., 2019; Huntington et al., 2020; Myers and Miller, 2021). Currently, the leading approach of NK-based therapy is the adoptive transfer of allogeneic NK cells. While adoptive T cell therapy may cause severe side effects, adoptive NK cell transfer is comparatively safe, with low risk of graft-versus-host disease or cytokine release syndrome (Miller et al., 2005; Rubnitz et al., 2010; Ruggeri et al., 2002). The safety profile also makes NK cells highly feasible for ‘off-the-shelf’ manufacturing. These promising features have led to rapidly increasing laboratory and clinical efforts dedicated to advancing NK-based immunotherapies.
Preclinical evidence and early clinical successes have established NK immunotherapy as a safe, feasible, and promising therapeutic strategy. For example, human NK cell adoptive transfer has been shown to suppress primary tumor growth and secondary metastases in mice (Huntington et al., 2020; Lopez-Soto et al., 2017; Myers and Miller, 2021). Clinical studies, particularly those in patients with blood cancers and neuroblastoma have shown encouraging results. Some clinical trials have reported responses in 1/3 to 1/2 of the patients. Nonetheless, the efficacy of adoptive NK transfer remains unsatisfying and limited in most trials (Childs and Carlsten, 2015; Myers and Miller, 2021; Shimasaki et al., 2020).
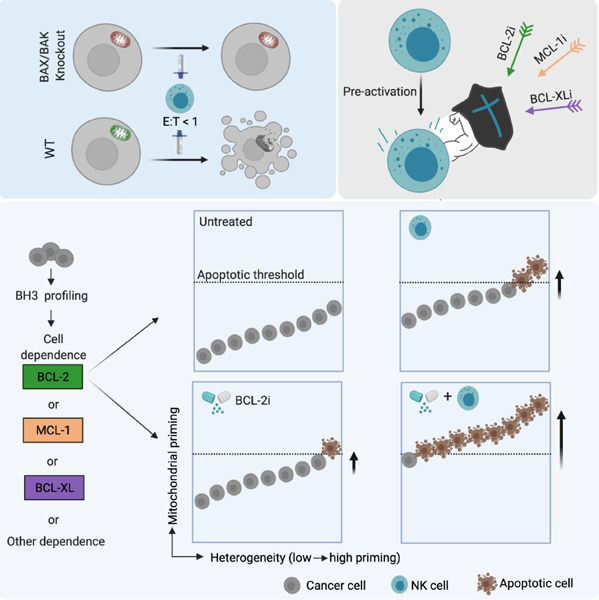
To augment the therapeutic efficacy of NK cells, most current studies revolve around two focal points: optimizing the source of NK cells and improving their functionality and persistence in vivo (Kundu et al., 2021; Myers and Miller, 2021; Shimasaki et al., 2020). In the current study, we took a different approach by studying how to make cancer cells more vulnerable to NK killing. We found that mitochondrial apoptosis (mtApoptosis), but not other types of programmed cell death, played an essential role in NK-mediated killing. Modulating mtApoptosis priming status (mitochondrial readiness for apoptosis) affected cancer cell susceptibility to NK cells. Additionally, NK treatment drove surviving cancer cells closer to mtApoptosis thresholds. We therefore hypothesized that increasing mtApoptosis priming with BH3 mimetics would synergize with NK cells in pushing cancer cells across apoptotic thresholds, thus augmenting NK-mediated killing. We also hypothesized that BH3 profiling (Letai, 2017; Montero et al., 2015) could predict which BH3 mimetic would best synergize with NK cells on different cancer cells. In the present study, in vitro and in vivo models with different anti-apoptotic dependencies were utilized to examine our hypotheses.
RESULTS
NK cells induce mtApoptosis of cancer cells
NK cells and T cells can deliver granzymes or utilize death ligands to trigger apoptosis of cancer cells (Guillerey et al., 2016; Morvan and Lanier, 2016). It has been reported that recombinant granzyme B induced cytochrome c release from mitochondria of Jurkat cells (Goping et al., 2003; Pinkoski et al., 2001; Sutton et al., 2003). However, it remains unclear to what extent mtApoptosis machinery is required for NK cell-mediated killing, especially at relatively low effector-to-target (E:T) ratios. Indeed, many studies use high E:T ratios (e.g., 3:1, 10:1, or higher) in cytotoxic cell killing assays. However, in tumor stroma, cytotoxic cells are almost always outnumbered by cancer cells (Galon and Bruni, 2019; Shimasaki et al., 2020). Such high E:T ratios may not reflect how cancer cells are killed in vivo.
In the present study, we first investigated if primary NK cells induce mtApoptosis or other forms of programmed cell death at relatively low E:T ratios. OCI-AML3 was chosen to represent blood cancers because it is a widely used refractory leukemia cell line and many NK therapy trials focus on leukemias (Myers and Miller, 2021; Shimasaki et al., 2020). Meanwhile, the widely used HeLa cervical cancer cell line was selected to represent solid cancers. For effector cells, we isolated primary NK cells from leukapheresis samples of healthy donors and named them as “NK#n” with “n” as the order they were used in this study. Since NK cells in peripheral blood of healthy individuals are typically in a resting state, isolated NK cells were pre-activated and expanded with 100 IU/mL IL-2, a common method for NK pre-activation (Fujisaki et al., 2009; James et al., 2013; Nayyar et al., 2019). Pre-activated NK cells were used between day 3 and day 14 post-isolation. Next, we co-cultured CFSE-labeled cancer cells with pre-activated NK cells at different E:T ratios and time points.
Pre-activated NK cells induced loss of mitochondrial outer membrane potential (Figures 1A, 1M, and S1C) as determined by CMXRos staining and rapidly triggered cytochrome c release from mitochondria (Figures 1B, 1N, and S1D), events required for mtApoptosis. NK treatment also quickly activated caspase-3 (Figures 1C, 1O, and S1E) and triggered phosphatidylserine externalization (Figures 1D, 1P, and S1F). NK treatment induced cleavage of BID, caspase-9, −8, −3, and PARP-1 (Figures 1E and 1Q) and led to target cells blebbing and formation of apoptotic bodies, typical morphological features of apoptosis (Figures 1G and 1T). These hallmarks collectively indicate that primary NK cells induced mtApoptosis. NK treatment also readily induced cytochrome c release in all tested blood and solid cancer cell lines (Figure S1G), suggesting that induction of mtApoptosis may be a general mechanism for NK-mediated killing. Of note, NK cells induced cancer cell mtApoptosis very quickly, detectable after a few hours using different methods in different cell lines (Figures 1F, 1R,1S and S1H).
Figure 1. Pre-activated NK cells induce mtApoptosis, but not necroptosis, ferroptosis, or pyroptosis of cancer cells.
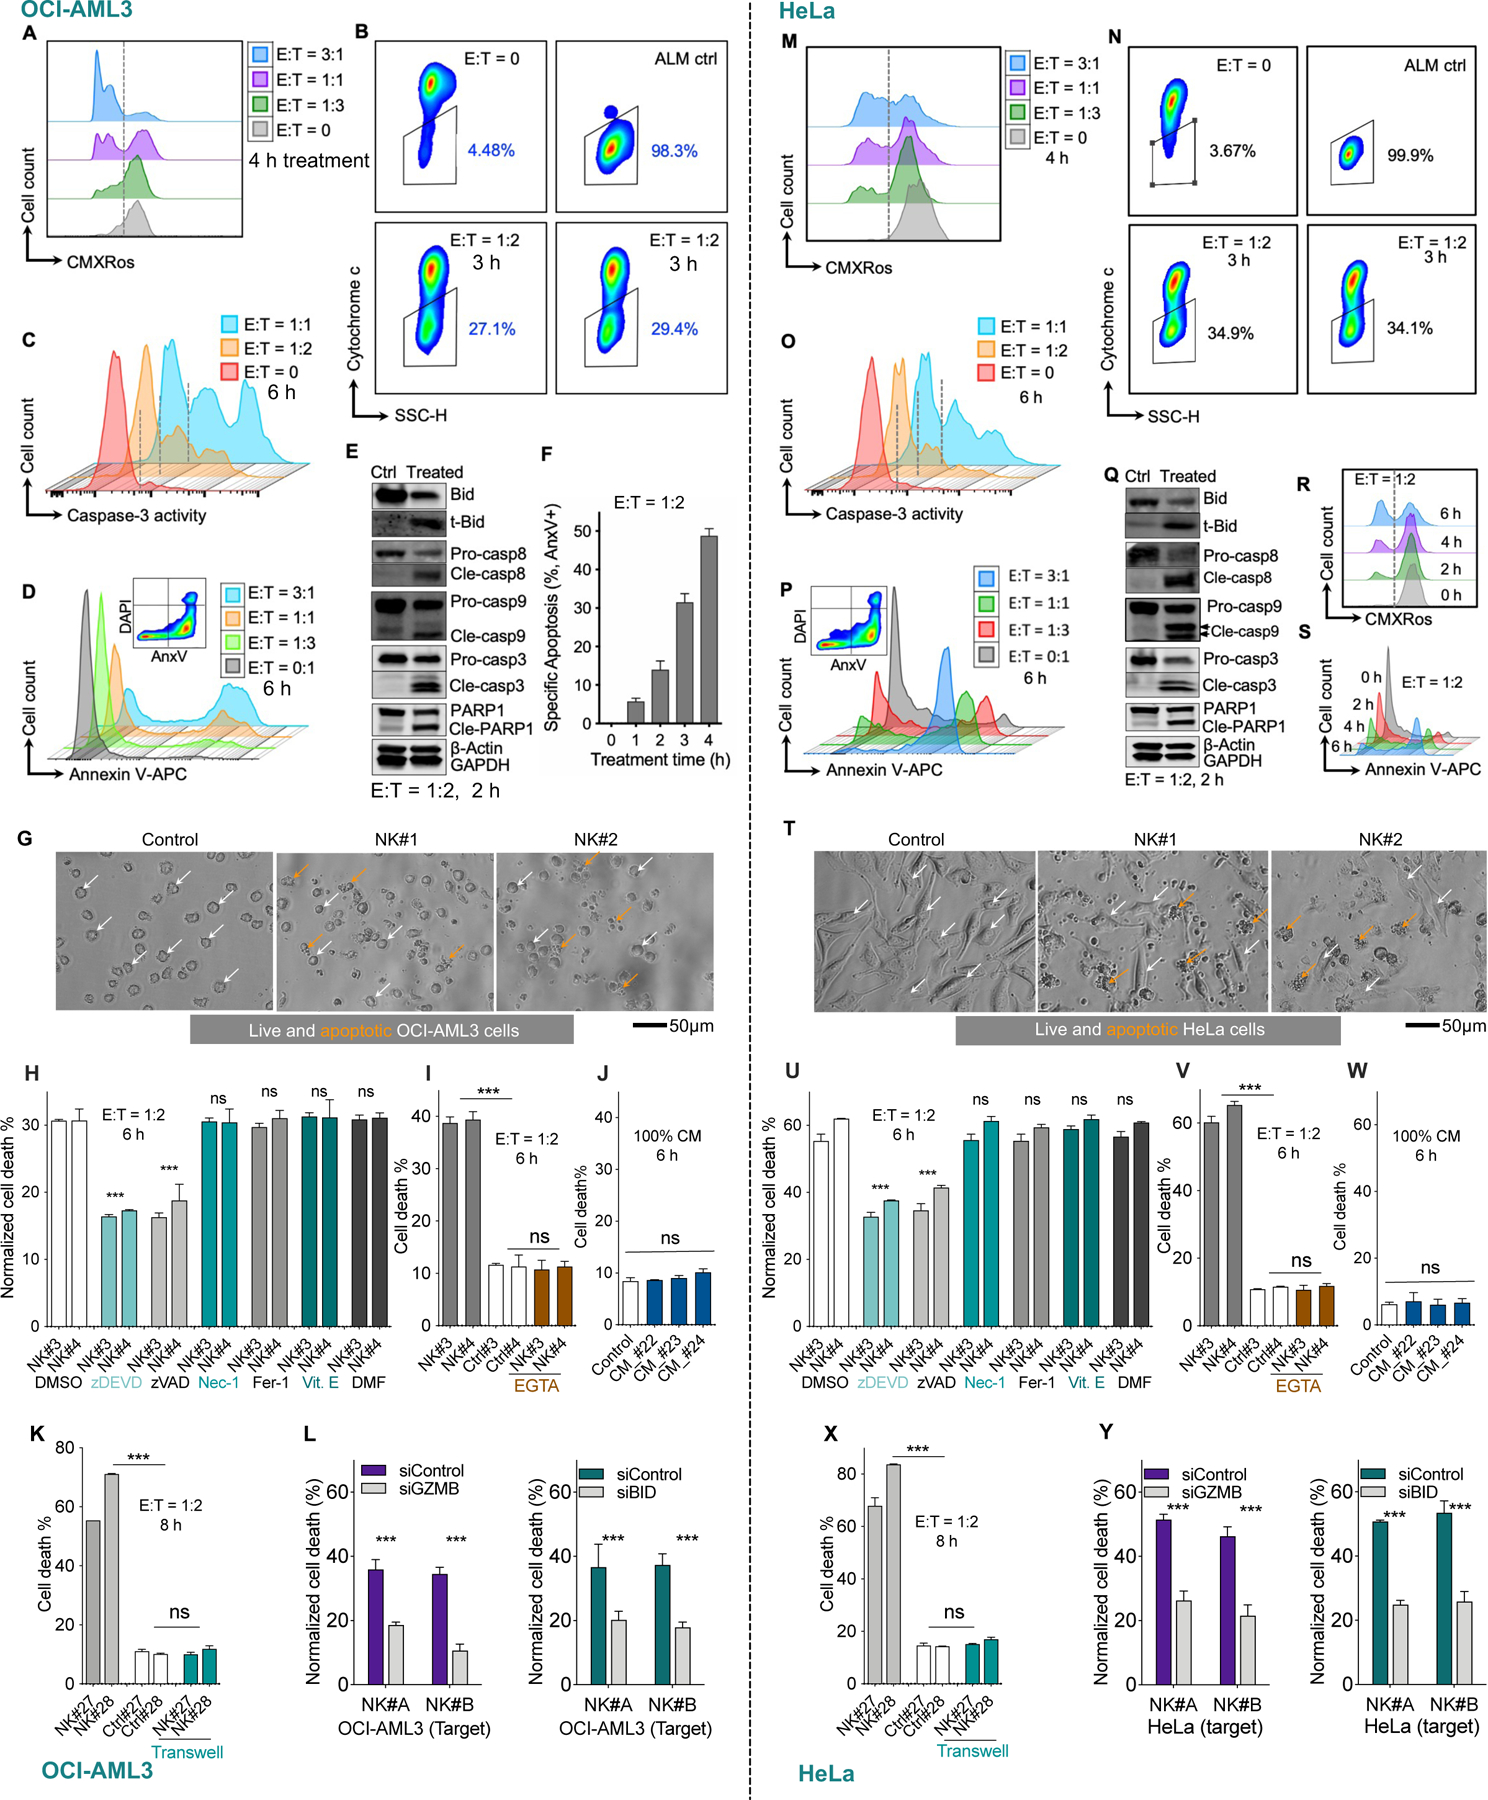
Two representative cell lines OCI-AML3 (left panels) and HeLa (right panels) were tested in parallel. After CFSE labeling, they were co-cultured with pre-activated human NK cells at indicated E:T ratios and time points (see Methods for details).
(A, M) Loss of mitochondrial membrane potential in cancer cells after NK treatment, as measured by CMXRos staining followed by flow cytometry analysis (See also Figure S1C for quantitative data at multiple time points and different E:T ratios).
(B, N) Release of cytochrome c from cancer cell mitochondria after NK treatment, measured by BH3 profiling procedure but using DMSO instead of BH3 peptides (see Methods). See also Figure S1D.
(C, O) NK cells induced activation of caspase-3 in target cells, as determined using NucView® 405 Blue Caspase-3 Dye. See also Figure S1E.
(D, P) Exposure of phosphatidylserine after NK treatment at various E:T ratios, measured by annexin V staining. See also Figure S1F.
(E, Q) Immunoblots showing cleavage of BID and caspases in target cells 2 h after NK treatment at E:T of 1:2. Immunoblotting was performed using cell lysis from FACS sorted CFSE+CD56- cancer cells. β-Actin and GAPDH served as loading control.
(F, R, and S) NK induced time-dependent apoptosis in OCI-AML3 cells and HeLa cells measured by annexin V staining via flow cytometry.
(G and T) NK treatment induced membrane blebbing and formation of apoptotic bodies in cancer cells. E:T = 1:2, 6 h.
(H and U) Effects of zDEVD-fmk (30 μM), zVAD-fmk (30 μM), necrostatin-1 (Nec-1, 20 μM), ferrostatin-1 (Fer-1, 2 μM) and α-tocopherol (Vit. E, 100 μM), and dimethyl fumarate (DMF, 25 μM) on NK-induced cell death. Data was normalized to control (without NK treatment). Statistical significance was calculated versus DMSO group.
(I and V) Effects of EGTA (2 mM) on NK induced cell death. White bars: control, no NK cells added.
(J and W) Effects of NK conditioned medium (CM, from three NK samples) on treated cancer cells. See methods for generation of conditioned medium.
(K and X) Transwell assays. Gray bars: NK cells were added in direct contact with cancer cells growing on bottom of the wells as described in Methods. White bars: no NK cells were added. Cyan bars: NK cells were added into transwell inserts (0.4 μM pores). After 8 h, cell death of cancer cells was measured by flow cytometry (E:T = 1:2).
(L and Y) Left panel: NK cells were incubated with non-targeting control or GZMB-targeting siRNA for 72 h before they were used for cytotoxicity assays. OCI-AML3 and HeLa cancer cells were then treated with the two NK samples for 5 h at E:T = 1:2, followed by flow cytometry analysis.
Right panel: OCI-AML3 and HeLa cells were incubated with non-targeting control or BID-targeting siRNA for 72 h. Then the control and BID knockdown cells were treated with two primary NK samples for 5 h at E:T = 1:2, followed by flow cytometry analysis.
Cell death % by flow cytometry was calculated as 100% − %AnxV−DAPI− (H-L, and U-Y). Data were presented as mean ± SEM of triplicate experiments (F, H-L, and U-Y). Statistical significance was assessed by student’s t test. *p < 0.05, **p < 0.01, ***p < 0.001, ns, nonsignificant. See also Figure S1.
Several other forms of programmed cell death have been established in the past decade, including necroptosis, ferroptosis, and pyroptosis (Shi et al., 2017; Stockwell et al., 2017; Weinlich et al., 2017). To determine whether these types of cell death also contribute to NK-mediated killing, we pre-treated cancer cells with established inhibitors and then added NK cells. Consistent with an apoptotic form of cell death, the caspase-3 inhibitor zDEVD-fmk or the pan-caspase inhibitor zVAD-fmk significantly reduced NK killing. In contrast, none of the necroptosis inhibitor necrostatin-1s, the pyroptosis inhibitor dimethyl fumarate (Humphries et al., 2020), or the ferroptosis inhibitors ferrostatin-1 and α-tocopherol suppressed NK killing (Figures 1H and 1U), suggesting that necroptotic, pyroptotic, and ferroptotic forms of cell death were not involved here. Consistently, most annexin V positive cells retained plasma membrane integrity (AnxV+DAPI−, Figures 1D and 1M for representative plots), which is lost in necroptotic, pyroptotic, and ferroptotic cells but retained in early apoptotic cells (Aglietti and Dueber, 2017; Riegman et al., 2020; Weinlich et al., 2017).
We also studied if cell-cell contact is dispensable for NK-mediated killing. The Ca2+ chelator EGTA, which interferes with cytotoxic cell-target cell contact, completely abrogated NK-induced cell death (Figures 1I and 1V). Meanwhile, NK conditioned medium (CM) or NK cells in transwell inserts (Figures 1J-K and 1W-X) did not induce cancer cell death, suggesting that cell-cell contact is required for NK killing. NK cells can deliver granzymes or use death ligands to engage target cells and initiate mtApoptosis. We found that neutralizing antibodies targeting death ligands TNFα, Trail, and FasL, by itself or in double combinations, did not significantly reduce NK killing. Interestingly, the triple combination slightly but significantly reduced NK killing (Figure S1J), suggesting death ligands contribute to NK killing, but to a limited extent. Caspase-8 is a major effector protein downstream of the death ligand signaling. We next used HeLa-caspase-8 knockout cells to further evaluate the contribution of death ligand signaling. Knockout of caspase-8 slightly reduced NK killing, but the reduction is not statistically significant (Figure S1K). Taken together, these assays suggest death ligands did not play a major role. NK treatment robustly induced BID cleavage (Figure 1E and 1Q) and cytochrome c release (Figure 1B and 1N) in target cells. These observations fit the established paradigm that granzyme B directly cleaves BID (Lord et al., 2003; Waterhouse et al., 2005) and that cleaved BID can initiate mtApoptosis (Letai, 2008; Wei et al., 2000). In further support, granzyme B knockdown in NK cells (Figure S1L) markedly reduced their cytotoxicity on OCI-AML3 and HeLa cells (Figures 1L and 1Y). Furthermore, BID knockdown in target cancer cells (Figure S1M) made them significantly less sensitive to NK killing (Figures 1L and 1Y).
mtApoptosis machinery is essential for efficient NK killing at E:T ratios ≤ 1
Next, we asked if the mtApoptosis machinery is dispensable for efficient NK killing. To this end, we first used BAX/BAK double knockout (DKO) cells. BAX and BAK are required for the mitochondrial outer membrane permeabilization (MOMP) that is necessary for mtApoptosis (Wei et al., 2001). We first validated that the HeLa DKO cells are indeed mtApoptosis deficient. While BIM peptide (which inhibits all anti-apoptotic proteins) readily induced cytochrome c release from control (WT) mitochondria, the DKO mitochondria did not respond to BIM peptide (Figures S2A-B). Next, HeLa WT or DKO cells were seeded and NK cells were then added at a relatively low E:T ratio of 1:2. Of note, throughout the paper, particular caution was taken to ensure even distribution of both NK and target cells so that at E:T ≤ 1, a single cancer cell was, generally, not engaged simultaneously by two or more NK cells. We found that NK cells induced a time-dependent increase of apoptosis in WT control cells, whereas only a minimal level of apoptosis was seen in DKO ones (Figures 2A-B). Correspondingly, significantly more DKO cells survived 10 h NK treatment than their WT counterparts (Figure 2C).
Figure 2. Mitochondrial apoptosis machinery is essential for efficient NK killing, especially at E:T ratios ≤ 1.
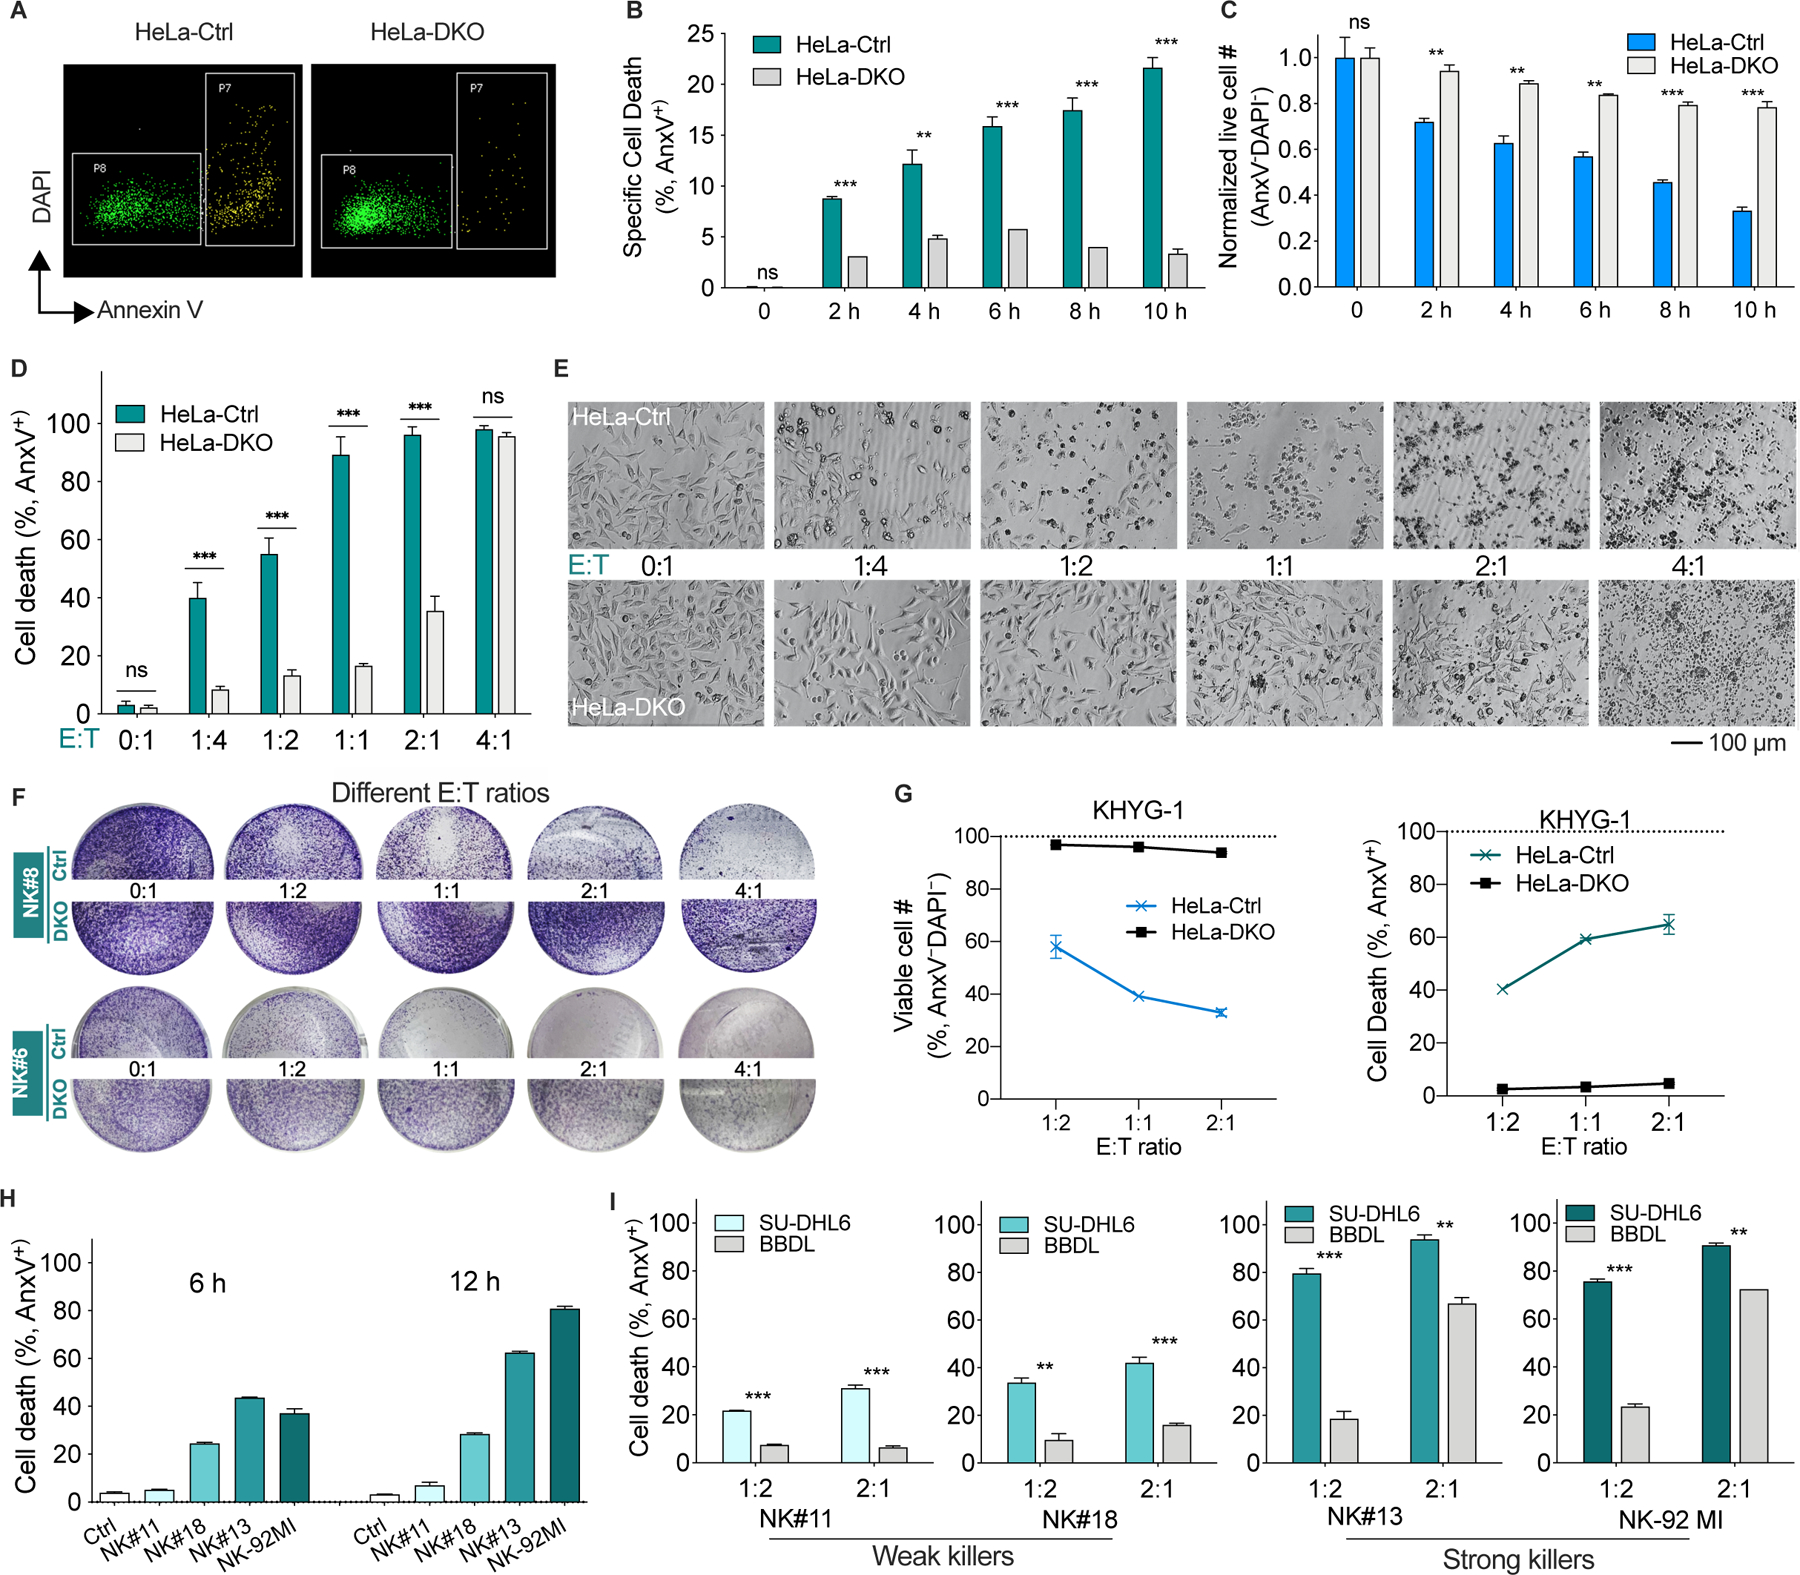
(A) Representative flow plots of HeLa control (Ctrl) and BAX−/−BAK−/− (DKO) cells treated with primary human NK cells (E:T = 1:2, 8 h). Dead cells are in the P7 gate and live cells are in the P8 gate.
(B and C) Percentage of apoptotic cells (B) and normalized live cell number (C) of HeLa control and DKO cells after NK treatment (E:T = 1:2). Cell number was enumerated by flow cytometry using absolute counting beads as described in Methods.
(D and E) Apoptotic percentage (D) and morphology (E) of HeLa control and DKO cells after treatment with NK cells at different E:T ratios for 16 h.
(F) Crystal violet staining of attached HeLa control and DKO cells after co-culture with two different NK samples for 16 h.
(G) Normalized cell number and apoptotic percentage of HeLa control and DKO cells after treatment with human NK cell line KHYG-1 for 16 h, determined by flow cytometry as in A-C.
(H) Induction of cell death of HeLa cells by NK samples with different capacity for killing (E:T = 1:2). These four samples were selected for killing assays in Figure 2I.
(I) Percentage of dead SU-DHL6 (BAXWTBAKWT) and BBDL (BAX/BAK deficient) cells after treatment with different NK samples (6 h).
Data in bar and line graphs were presented as mean ± SEM of triplicate experiments. Statistical significance by student’s t test. *p < 0.05, **p < 0.01, ***p < 0.001, ns, nonsignificant.
See also Figure S2.
Next, we examined the effects of E:T ratios on NK-mediated killing. At low E:T ratios such as 1:4 and 1:2, NK cells readily induced apoptosis in WT cells but only minimal cell death was seen in DKO cells (Figures 2D-E), suggesting that at low E:T ratios, mtApoptosis machinery is essential for NK killing. However, at E:T = 2:1, while ~95% WT cells were apoptotic, a substantial fraction (36%) of DKO cells were also apoptotic. Furthermore, at E:T = 4:1, almost all DKO cells were dead (Figures 2D-E), implying that at high E:T ratios, mtApoptosis may be dispensable for NK killing. Crystal violet staining assays also indicated that at E:T ≤ 1, WT cells were sensitive to both NK samples, whereas DKO cells were resistant (Figure 2F). At E:T = 4:1, NK#6, but not NK#8, efficiently killed DKO cells (Figure 2F), implying that high E:T ratios were not always capable of overcoming resistance conferred by deficient mtApoptosis machinery. Consistent with the killing data of primary NK cells, two tested NK cell lines KHYG-1 and NK-92MI, at E:T = 1:2, efficiently killed WT control cells, while both of them only marginally killed DKO cells. It is known that NK-92MI has stronger cytotoxicity than KHYG-1 cells. At E:T = 2:1, NK-92MI induced substantial apoptosis of DKO cells while the weaker KHYG-1 cells were largely ineffective (Figures 2G and S2E).
We next chose a pair of B cell lymphoma cell lines as target cells and several NK samples selected for different killing ability to study if mtApoptosis is essential for efficient killing by both strong and weak killers. SU-DHL6 has intact mtApoptosis machinery while BBDL does not express BAX and BAX and is thus unable to undergo MOMP and mtApoptosis (Figures S2C-D). NK#11 and NK#18 were defined as “weak” killers here based on observation of their relatively weak killing ability while NK#13 and NK-92MI were defined as “strong” killers (Figure 2H). At E:T =1:2, neither the weak nor the strong killers could efficiently kill BBDL cells like they killed the paired SU-DHL6 cells (Figure 2I). At E:T = 2:1, the strong killers, but not the weak ones, were able to circumvent the mitochondrial deficiency and effectively killed BBDL cells (Figure 2I).
Our results using NK cells from eight different donors and two NK cell lines and both blood and solid cancer cells suggest that mtApoptosis pathway is essential for efficient NK killing, especially when NK cells were employed at E:T ratios ≤ 1. At high E:T ratios like 2:1 or 4:1, the “strong” killers, to different extents, circumvented the resistance conferred by mtApoptosis deficiency. However, as aforementioned, such high E:T ratios are probably not physiologically relevant as the endogenous or adoptively transferred NK cells are usually, if not always, outnumbered by cancer cells (Galon and Bruni, 2019; Shimasaki et al., 2020).
NK cells effectively prime cancer cells for mtApoptosis
We have shown that mtApoptosis is essential for efficient NK killing using binary live/dead assays. It has been postulated that effector-target cell contacts are mostly sublethal, rather than “live/death” binary events and the sublethal damage can accumulate by subsequent contacts to eventually kill cancers (Beck et al., 2020; Halle et al., 2016; Weigelin et al., 2021). If true, we reasoned that the sublethal contacts might push cancer cells towards apoptotic threshold (i.e., prime cancer cells for mtApoptosis) before killing them by subsequent contacts. We investigated this question using BH3 profiling (Figures 3A-C). BH3 profiling was developed as a tool to integrate the interactions among 21 known BCL-2 family proteins (Montero et al., 2015; Ryan et al., 2010; Vo et al., 2012). There are two types of synthetic 20-mer BH3 peptides used in BH3 profiling. Promiscuous peptides like BIM peptide measure overall “priming” (cell proximity to its apoptotic threshold), whereas selective BH3 peptides can determine selective dependence on anti-apoptotic proteins like BCL-2, BCL-XL, MCL-1, or BFL-1 for survival. The more sensitive mitochondria are to BH3 peptides, the more “primed” or “dependent” they are. Specifically, the 20-mer BH3 peptides are derived and modified from the BH3 domains of BH3 only proteins, which can dock into the hydrophobic grooves of anti-apoptotic proteins. The BIM-derived peptide binds to all antiapoptotic proteins; therefore, it measures overall “mitochondrial priming”. The other used BH3 peptides have a more selective binding pattern (Figure 3A, (Certo et al., 2006)). For example, MS-1 peptide only binds to MCL-1, and thus a response from MS-1 peptide indicates a dependence on MCL-1. Similarly, the HRK peptide only binds BCL-XL, and FS-1 peptide only binds BFL-1. BAD peptide binds BCL-2 and BCL-XL; when it is used in parallel with BCL-XL selective HRK peptide and BCL-2 selective compound ABT-199, the specific anti-apoptotic dependence can be elucidated. Therefore, selective BH3 peptides determine on which anti-apoptotic proteins cells depend for survival.
Figure 3. NK cells effectively prime cancer cells for mtApoptosis.
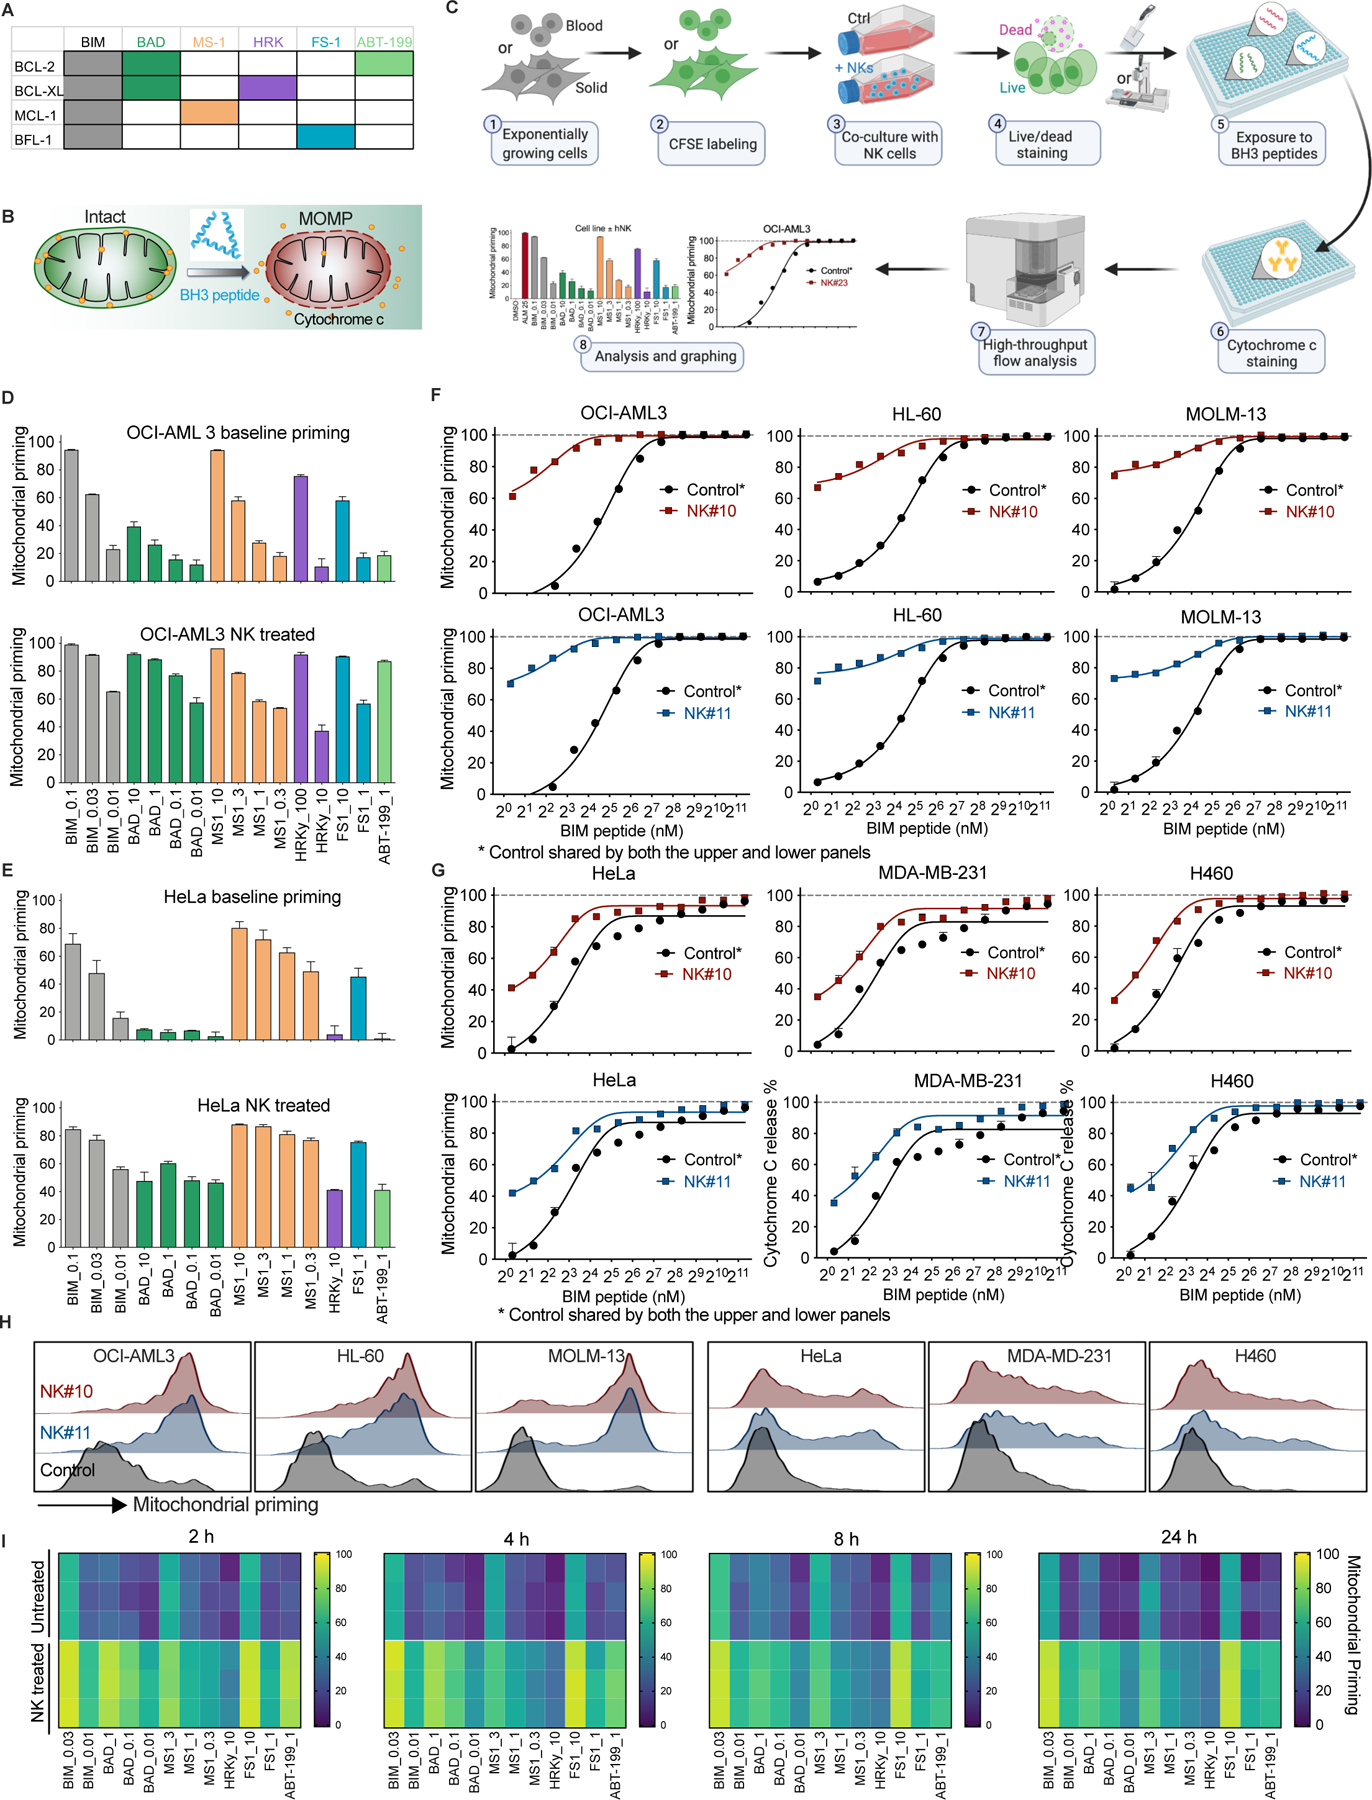
(A) Selectivity, specificity, and color code of synthetic BH3 peptides and ABT-199 used in BH3 profiling assays in this study.
(B) Schematic showing cytochrome c release from a mitochondrion induced by BH3 peptides during BH3 profiling.
(C) Workflow of BH3 profiling of cancer cells with or without NK treatment. See Methods for detailed BH3 profiling procedures.
(D and E) Mitochondrial priming status of OCI-AML3 cells (D) and HeLa cells (E) before and after treatment with NK cells (2 h, E:T = 1:2 ). Values following peptide names are concentrations (µM). Mitochondrial priming is defined as a range from 0 – 100% cytochrome c release induced by BH3 peptides (see Methods for details).
(F and G) NK treatment (2 h, E:T = 1:2) increased mitochondrial priming of 3/3 blood and 3/3 solid cancer cell lines, as determined using BIM peptide.
(H) Representative histograms showing mitochondrial priming status of different cancer cells (determined using 2 nM BIM peptide) after NK treatment (E:T = 1:2, 2 h). BH3 profiling performed as in 3C.
(I) Heatmap of mitochondrial priming of HeLa cells with or without NK treatment at multiple time points (E:T = 1:2). Each tile represents one of three experimental replicates of a certain treatment.
Data in bar graphs and line graphs were presented as mean ± SEM of triplicate experiments.
See also Figure S3.
We co-cultured NK cells with cancer cells at an E:T ratio of 1:2 for 2 h, a pre-determined condition where 80–90% cancer cells were alive and performed BH3 profiling on gated viable cells. As shown in Figures 3D and 3E, NK treatment markedly increased the overall mitochondrial priming and anti-apoptotic dependence of surviving cells, as measured by the promiscuous and selective peptides. Next, we focused on BH3 profiling with only BIM peptide to examine the changes of overall priming using more cell lines. Both NK samples effectively increased overall priming of 3/3 blood cancer cell lines (Figure 3F). Similarly, the two NK samples also effectively primed 3/3 solid cancer cell lines (Figure 3G). Of note, the blood cancer cells appeared to be more easily primed by NK cells than the solid ones (Figures 3F-H), consistent with the observation that NK therapies are generally more efficacious in blood malignancies. We also examined the priming status of co-cultured cancer cells over time. At all tested time points, surviving cancer cells as a population were more primed for mtApoptosis than untreated controls (Figure 3I). Interestingly, NK induced priming is lower at later time points than at 2 h. This may be explained by the fast-killing dynamics of NK cells. Killed cancer cells have been lost to assay at later timepoints. The profiled membrane-intact remaining cells have thus been selected for relative resistance to being primed by NK cells. Note that direct cell-cell contact appeared to be required for NK-mediated priming as NK-conditioned medium (CM) did not prime cancer cells (Figure S3). Also, in the presence of EGTA, which impairs NK-target cell contacts, NK-induced priming was abrogated (Figure S3).
Recently, several publications suggested that multiple contacts were needed for majority of killing by cytotoxic cells (Beck et al., 2020; Halle et al., 2016; Weigelin et al., 2020). Our results that NK treatment could prime cancer cells for mtApoptosis in a graded fashion provide an explanation for the additive cytotoxicity of serial cytotoxic cell contacts. We consequently postulated that additional agents that prime cancer cells (e.g., BH3 mimetics) might complement NK-induced priming to synergistically push cancer cells across apoptosis threshold and augment NK-mediated killing (investigated in the coming results).
Reduced mitochondrial priming makes cancer cells less susceptible to NK-mediated killing
Upregulation of anti-apoptotic proteins, especially BCL-2, BCL-XL, and MCL-1, has been widely implicated in drug resistance to chemo- and targeted therapies (Ashkenazi et al., 2017; Pan et al., 2017; Singh et al., 2019). Next, we investigated how overexpression of BCL-2, BCL-XL, and MCL-1 affects cancer cell priming status and their susceptibility to NK cells.
BH3 profiling with the BIM peptide indicated that BCL-2 overexpression (Figure 4D) considerably reduced the overall priming status of HL-60 cells (Figure 4A, black bars). Next, we co-cultured the BCL-2 overexpressors with both the relatively weak NK#10 and relatively strong NK#11 at two E:T ratios and two time points. Unexceptionally, the BCL-2 overexpressors became less susceptible to NK-mediated killing (Figure 4F). Overexpression of BCL-XL also significantly decreased overall mitochondrial priming (Figure 4B, black bars). As expected, NK cells were less efficacious against BCL-XL overexpressors (Figure 4G). Similarly, MCL-1 overexpression significantly diminished mitochondrial priming (Figure 4C, black bars) and reduced killing by both the weak and strong killers at all tested conditions (Figure 4H). These results suggest that reduced priming makes cancer cells less susceptible to NK killing.
Figure 4. Reduced mitochondrial priming makes cancer cells less susceptible to NK-mediated killing.
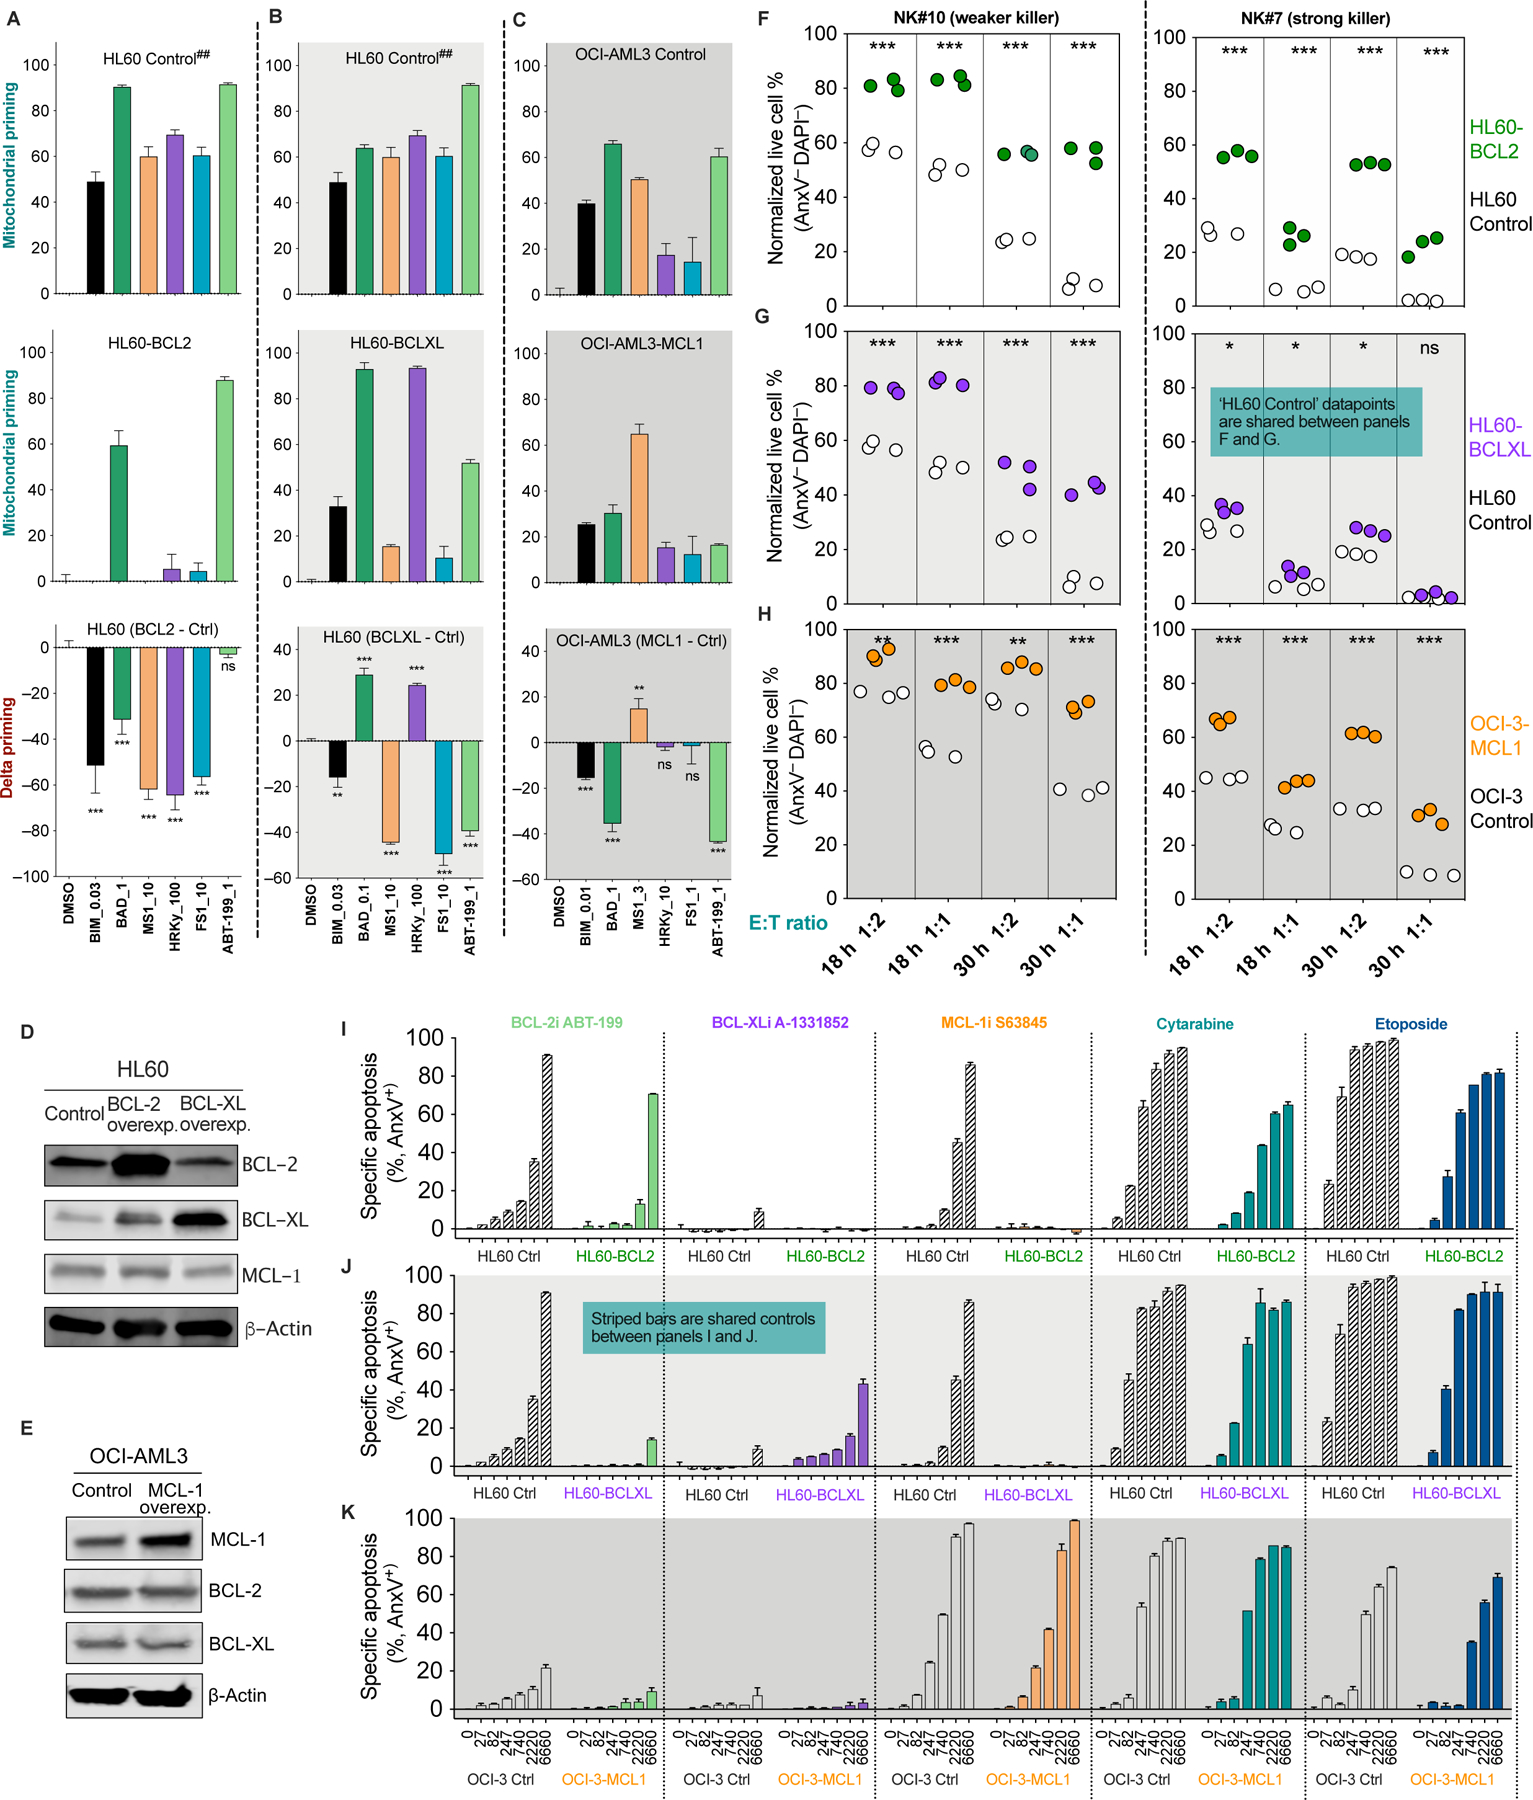
(A-C) Mitochondrial priming status of the paired control and BCL-2, BCL-XL or MCL-1 overexpressing cells as determined by BH3 profiling. Delta priming is the arithmetic difference between the control and overexpressing cells. Negative values measured by the BIM peptide indicate reduced overall priming in overexpressing cells (black bars in bottom panels). Statistics were calculated versus DMSO control. ## denotes shared control between panels A and B except for the BAD peptide datapoints because BAD at 1 μM or 0.1μM are most sensitive in determining delta priming for BCL-2 OE or BCL-XL OE cells respectfully.
(D and E) Immunoblots of BCL-2, BCL-XL, and MCL-1 in paired control and overexpressing cancer cells. (F-H) Sensitivity of control and overexpressing cells to NK-mediated killing. Controls and overexpressors were treated with two NK samples at indicated E:T ratios and time points. Each dot is one of three technical replicates of a particular treatment.
(I-K) Overexpression of BCL-2, BCL-XL, and MCL-1 altered the sensitivity of cancer cells to BH3 mimetics and to genotoxic cytarabine and etoposide (48 h treatment).
Data were presented as mean ± SEM of triplicate experiments (A-C and I-K). Statistical significance by student’s t test. *p < 0.05, **p < 0.01, ***p < 0.001, ns, nonsignificant.
We also used selective BH3 peptides to determine the changes in anti-apoptotic dependence (Figures 3A-C). We speculated that changes of dependence on individual anti-apoptotic proteins affect cell sensitivity to corresponding BH3 mimetics, but only the overall priming status matters when it comes to cancer susceptibility to NK cells. Note that the BH3 mimetics used throughout the paper are BCL-2 inhibitor ABT-199 (venetoclax, BCL-2i), MCL-1 inhibitor S63845 (MCL-1i), and BCL-XL inhibitor A-1331852 (BCL-XLi), all of which have been further validated by us as highly specific bona fide BH3 mimetics (Villalobos-Ortiz et al., 2019). As determined by BH3 profiling, BCL-2 overexpression rendered the cells solely dependent on BCL-2 (Figure 4A, middle panel). Consistently, BCL-2 overexpressors only responded to BCL-2i, but not to MCL-1i as the control cells did (Figure 4I). BCL-XL overexpressors became more dependent on BCL-XL and less dependent on BCL-2 and MCL-1 (Figure 4B). Consequently, the BCL-XL overexpressors gained sensitivity to BCL-XLi and acquired resistance to BCL-2i or MCL-1i (Figure 4J). Similarly, MCL-1 overexpressors became more dependent on MCL-1 (Figure 4C) and thus less sensitive to BCL2i but retaining sensitivity to MCL-1i (Figure 4K).
Indeed, shifts of anti-apoptotic dependence could serve as good indicators of changes of cell sensitivity to selective BH3 mimetics. Nonetheless, it did not imply changes of cell sensitivity to NK cells. Instead, decreased overall mitochondrial priming consistently accompanied reduced sensitivity to NK cells. This also stayed true for cytarabine and etoposide (Figures 4I-K), two widely used genotoxic therapeutics known to induce mtApoptosis. Though the initial targets of NK cells and genotoxic reagents are quite different, it appears mitochondrial priming status affects their efficacy in a similar fashion.
Pre-activating NK cells reduces their mitochondrial priming and confers them resistance to BH3 mimetics
BH3 mimetics are arguably the most direct and efficient compounds for priming cancer cells for mtApoptosis. We postulated that BH3 mimetics might significantly synergize with NK cells in pushing cancer cells across apoptotic thresholds, but on the premise that NK cells could tolerate combined BH3 mimetics. Unfortunately, the gated CD3−CD56+ NK population in four PBMC samples were sensitive to BCL-2i/BCL-XLi/MCL-1i (Figures 5A, S4A-B). Of note, NK cells in peripheral blood of healthy donors are typically in a resting state. For adoptive transfer, NK cells are generally pre-activated with interleukin-2 (IL-2) to enhance their functionality (Fujisaki et al., 2009; James et al., 2013; Shimasaki et al., 2020). We next pre-activated isolated NK cells and found that all tested NK samples markedly increased their expression of BCL-2, BCL-XL, and MCL-1 after pre-activation (Figure 5B). But interestingly, the pro-apoptotic proteins such as BIM, BAX, and BAK were upregulated as well. In addition, caspase-9 expression was elevated in 3/3 samples, while caspase-3 level was reduced in 2/3 samples and increased in 1/3 sample (Figure 5B). The increase of both anti- and pro-apoptotic proteins made it difficult to infer whether the pre-activated cells were more or less primed for mtApoptosis based on protein expression alone.
Figure 5. Pre-activated NK cells are less primed for mtApoptosis and acquire resistance to BCL-2, MCL-1, and BCL-XL inhibitors.
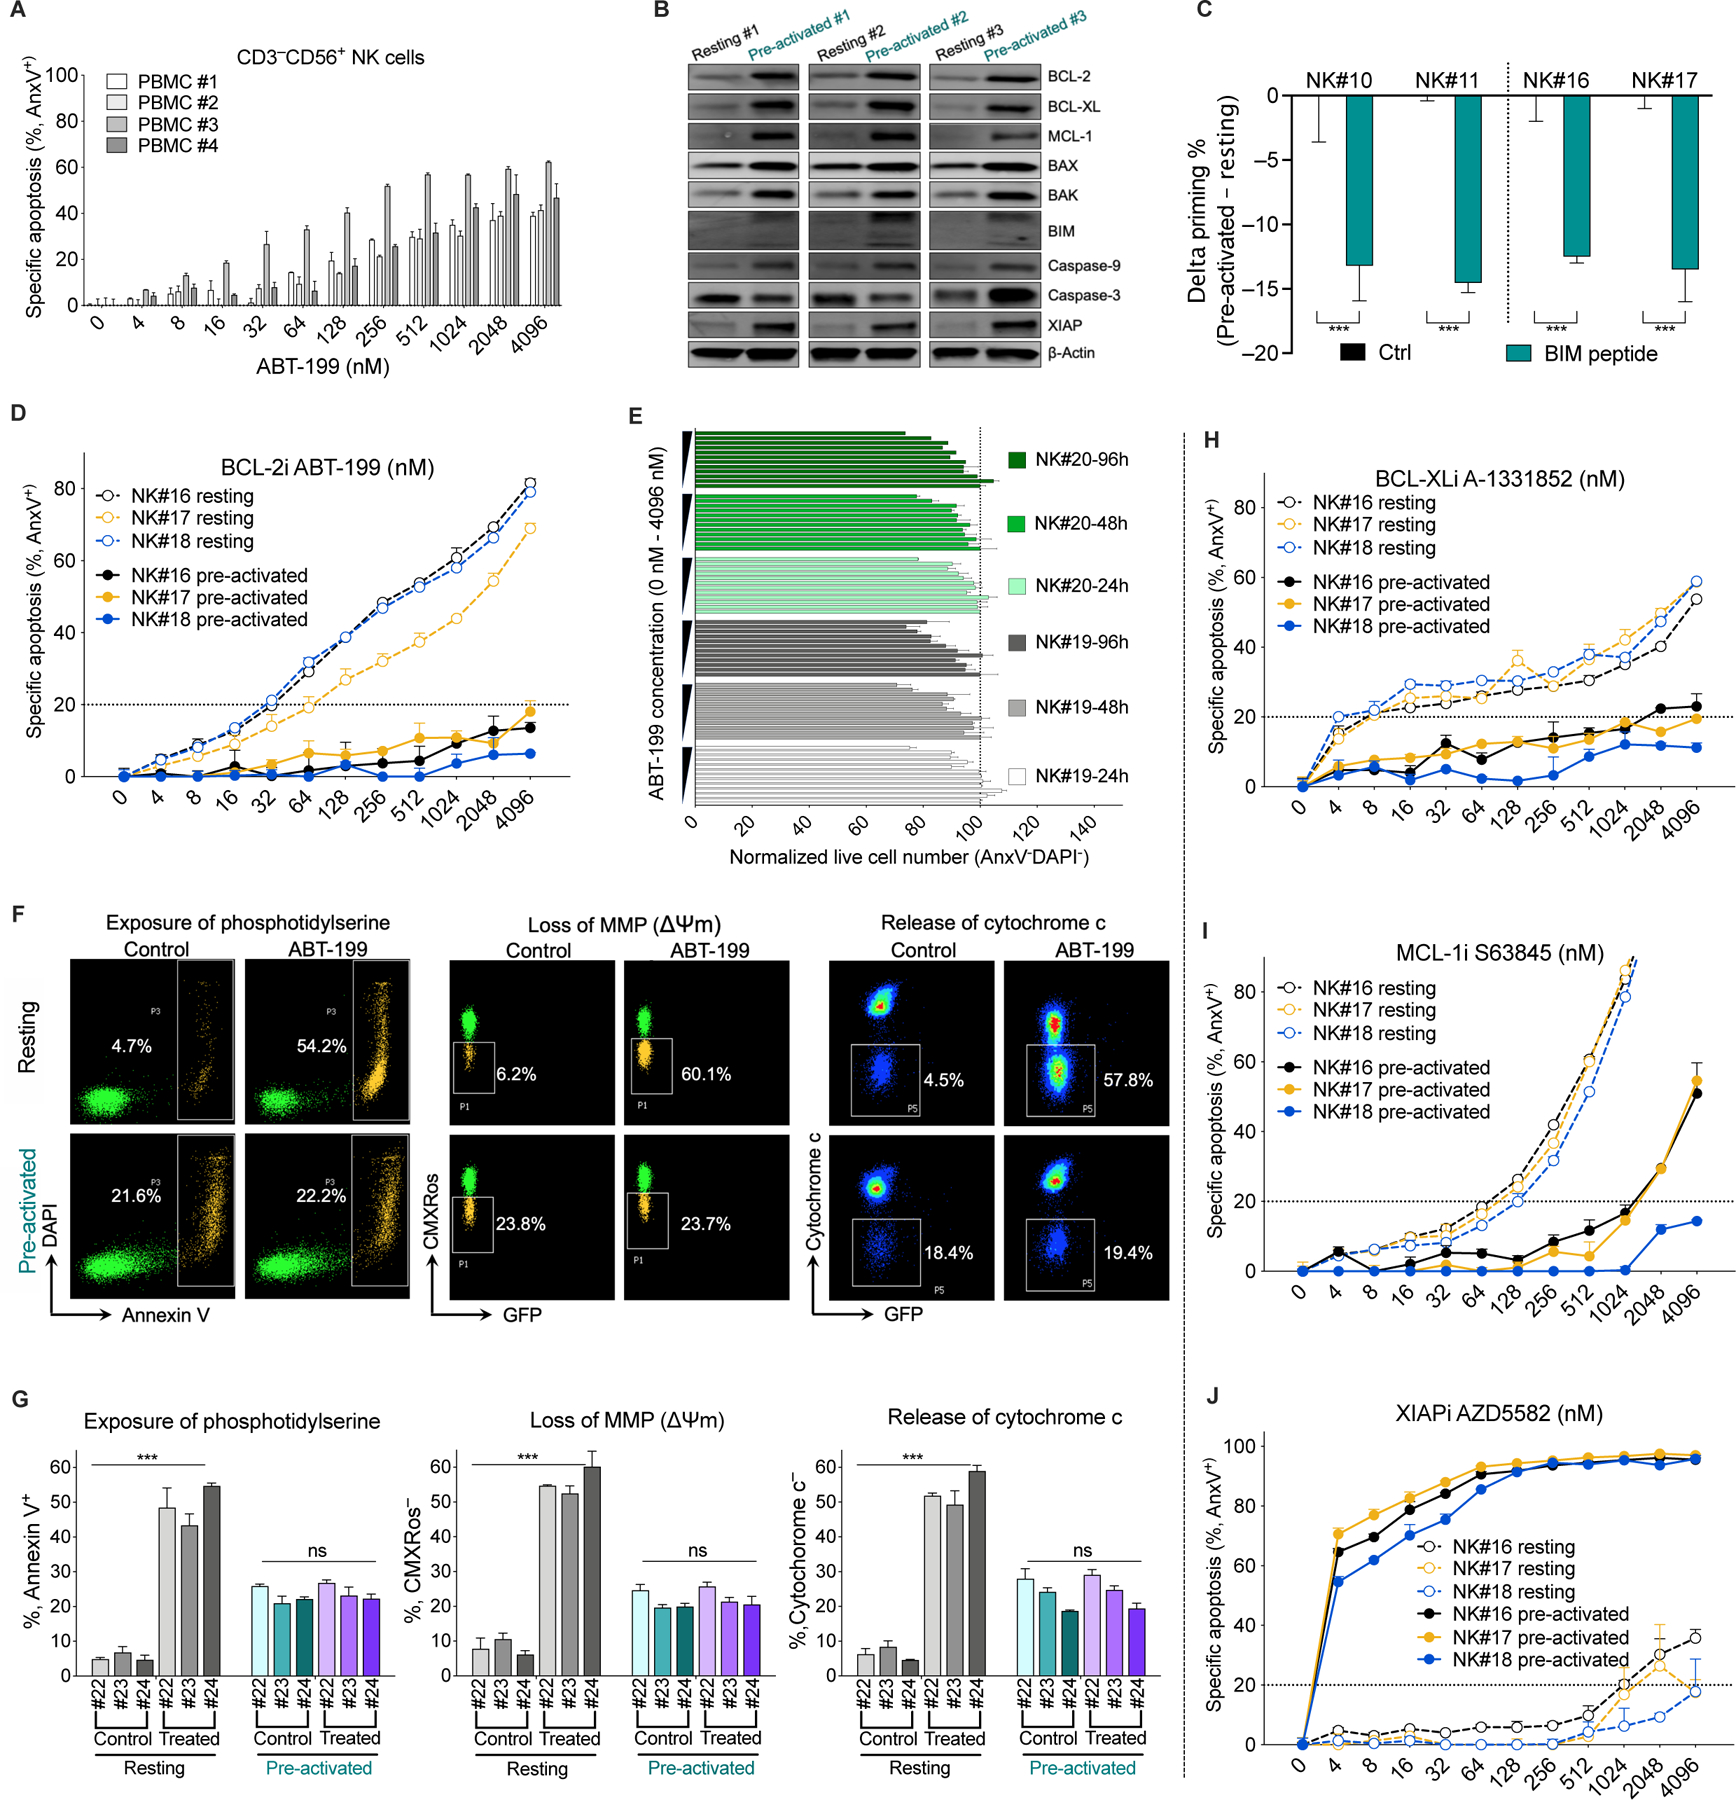
(A) Sensitivity of CD3−CD56+ NK cell subpopulation of PBMCs to BCL-2i ABT-199 (24 h treatment; PBMC, peripheral blood mononuclear cells), as measured by annexin V staining followed by flow cytometry analysis.
(B) Immunoblots showing altered protein expression of NK cells after pre-activation for 3 days (4 biological replicates, see Methods for pre-activation method).
(C) Reduced mitochondrial priming of NK cells after pre-activation as determined by BH3 profiling using the BIM peptide at 0.01 μM. Delta priming is the difference between pre-activated and resting cells, with a negative value indicating a decrease in priming.
(D) Sensitivity of freshly isolated resting NK and pre-activated NK cells to BCL-2i (24 h treatment).
(E) Normalized live cell number of pre-activated NK cells (measured by flow cytometry with counting beads) after treatment with BCL-2i for 24, 48, or 96 h. Numbers were normalized to DMSO control at each time point.
(F and G) BCL-2i treatment (1 µM, 24 h) induced exposure of phosphotidylserine (as measured by annexin V staining), loss of mitochondrial membrane potential (MMP, as measured by CMXRos staining), and cytochrome c release in resting NK cells but not in pre-activated NK cells. Panel F are representative plots and panel G shows quantitative data. Note that matched pre-activated NK cells (day 5) and freshly-isolated resting NK cells (day 0) were used. Resting NK cells (day 5) were unsuitable for cell death studies because viability of resting NK cells quickly decreases in the absence of IL-2 pre-activation.
(H-J) Sensitivity of resting and pre-activated NK cells to BCL-XL, MCL-1, and XIAP inhibitors (24 h), as measured by annexin V staining.
For all bar and line graphs, data were presented as mean ± SEM of triplicate experiments. Statistical significance was assessed by student’s t test between matched NK samples. *p < 0.05, **p < 0.01, ***p < 0.001, ns, nonsignificant.
See also Figure S4.
We therefore performed BH3 profiling using the BIM peptide and found that, surprisingly, 4/4 pre-activated NK samples all became significantly less primed for mtApoptosis (Figure 5C), suggesting pre-activation pushed NK cells away from their apoptotic thresholds. These unexpected findings promoted us to compare the sensitivity of resting and pre-activated NK cells to BH3 mimetics. We first treated three pairs of NK samples with BCL-2i ABT-199 for 24 h and used 20% apoptosis (IC20) as a cutoff for considerable toxicity. The IC20s of pre-activated NK cells from all three donors dramatically increased from < 50 nM to > 4000 nM (Figure 5D). Next, we treated pre-activated NK cells for up to 96 h and enumerated the numbers of viable cells. There was no significant difference between 24 – 96 h (Figure 5E) and the % of apoptosis also remained low at 96 h (Figure S4C). We further examined the effects of BCL-2i at NK mitochondrial level. BCL-2i markedly increased loss of mitochondrial membrane potential (ΔΨm) and induced cytochrome c release in resting NK cells, but not in pre-activated NK cells (Figures 5F-G). Taken together, pre-activated NK cells acquired resistance to BCL-2i at both the cellular and mitochondrial levels. Note that the pre-activated NK cells (day 5) have higher background cell death than freshly isolated resting NK cells (Figure 5G), which is likely caused by prolonged ex vivo culture, as without IL-2 pre-activation, NK cells were mostly dead after 5 days and thus unsuitable for cell death studies.
We next examined if pre-activation also conferred NK cells resistance to BCL-XLi or MCL-1i. Compared to resting NK cells, BCL-XLi IC20s of pre-activated cells increased from < 10 nM to > 4000 nM and the MCL-1i IC20s increased from ~100 nM to > 1000 nM (Figures 5H-I). Interestingly, pre-activated NK cells upregulated XIAP and became extremely sensitive to XIAP inhibition (Figures 5B and 5J), suggesting special precaution need to be taken when considering combining IAP inhibitors with NK therapies. Note that the chosen BH3 mimetics were able to effectively prime tumor cells at low nM range (Figures S4D). Given the acquired resistance of pre-activated NK cells to BH3 mimetics, a wide therapeutic window may exist for augmenting NK-based therapies with BH3 mimetics.
BH3 mimetics synergize with NK cells in killing cancer cells, which can be predicted by BH3 profiling
Having shown that the effects of NK cells and BH3 mimetics converge on mtApoptosis and that pre-activated NK cells can tolerate BH3 mimetics, we next tested if NK cells and BH3 mimetics would synergize in killing cancer cells and if BH3 profiling could predict which mimetic is the ideal one to be combined. BH3 profiling suggested that HeLa cells had anti-apoptotic dependence on MCL-1 (Figure 6A). We thus predicted that MCL-1i, but not BCL-2i or BCL-XLi, would synergize with NK cells in priming and killing HeLa cells. Indeed, only MCL-1i significantly augmented NK-induced priming of HeLa cells, while BCL-2i or BCL-XLi did not (Figure 6B). Furthermore, as predicted, MCL-1i synergized with NK cells in killing HeLa cells while BCL-2i or BCL-XLi did not (Figure 6C).
Figure 6. Selective BH3 mimetics synergize with NK cells in killing cancer cells, which can be predicted by BH3 profiling.
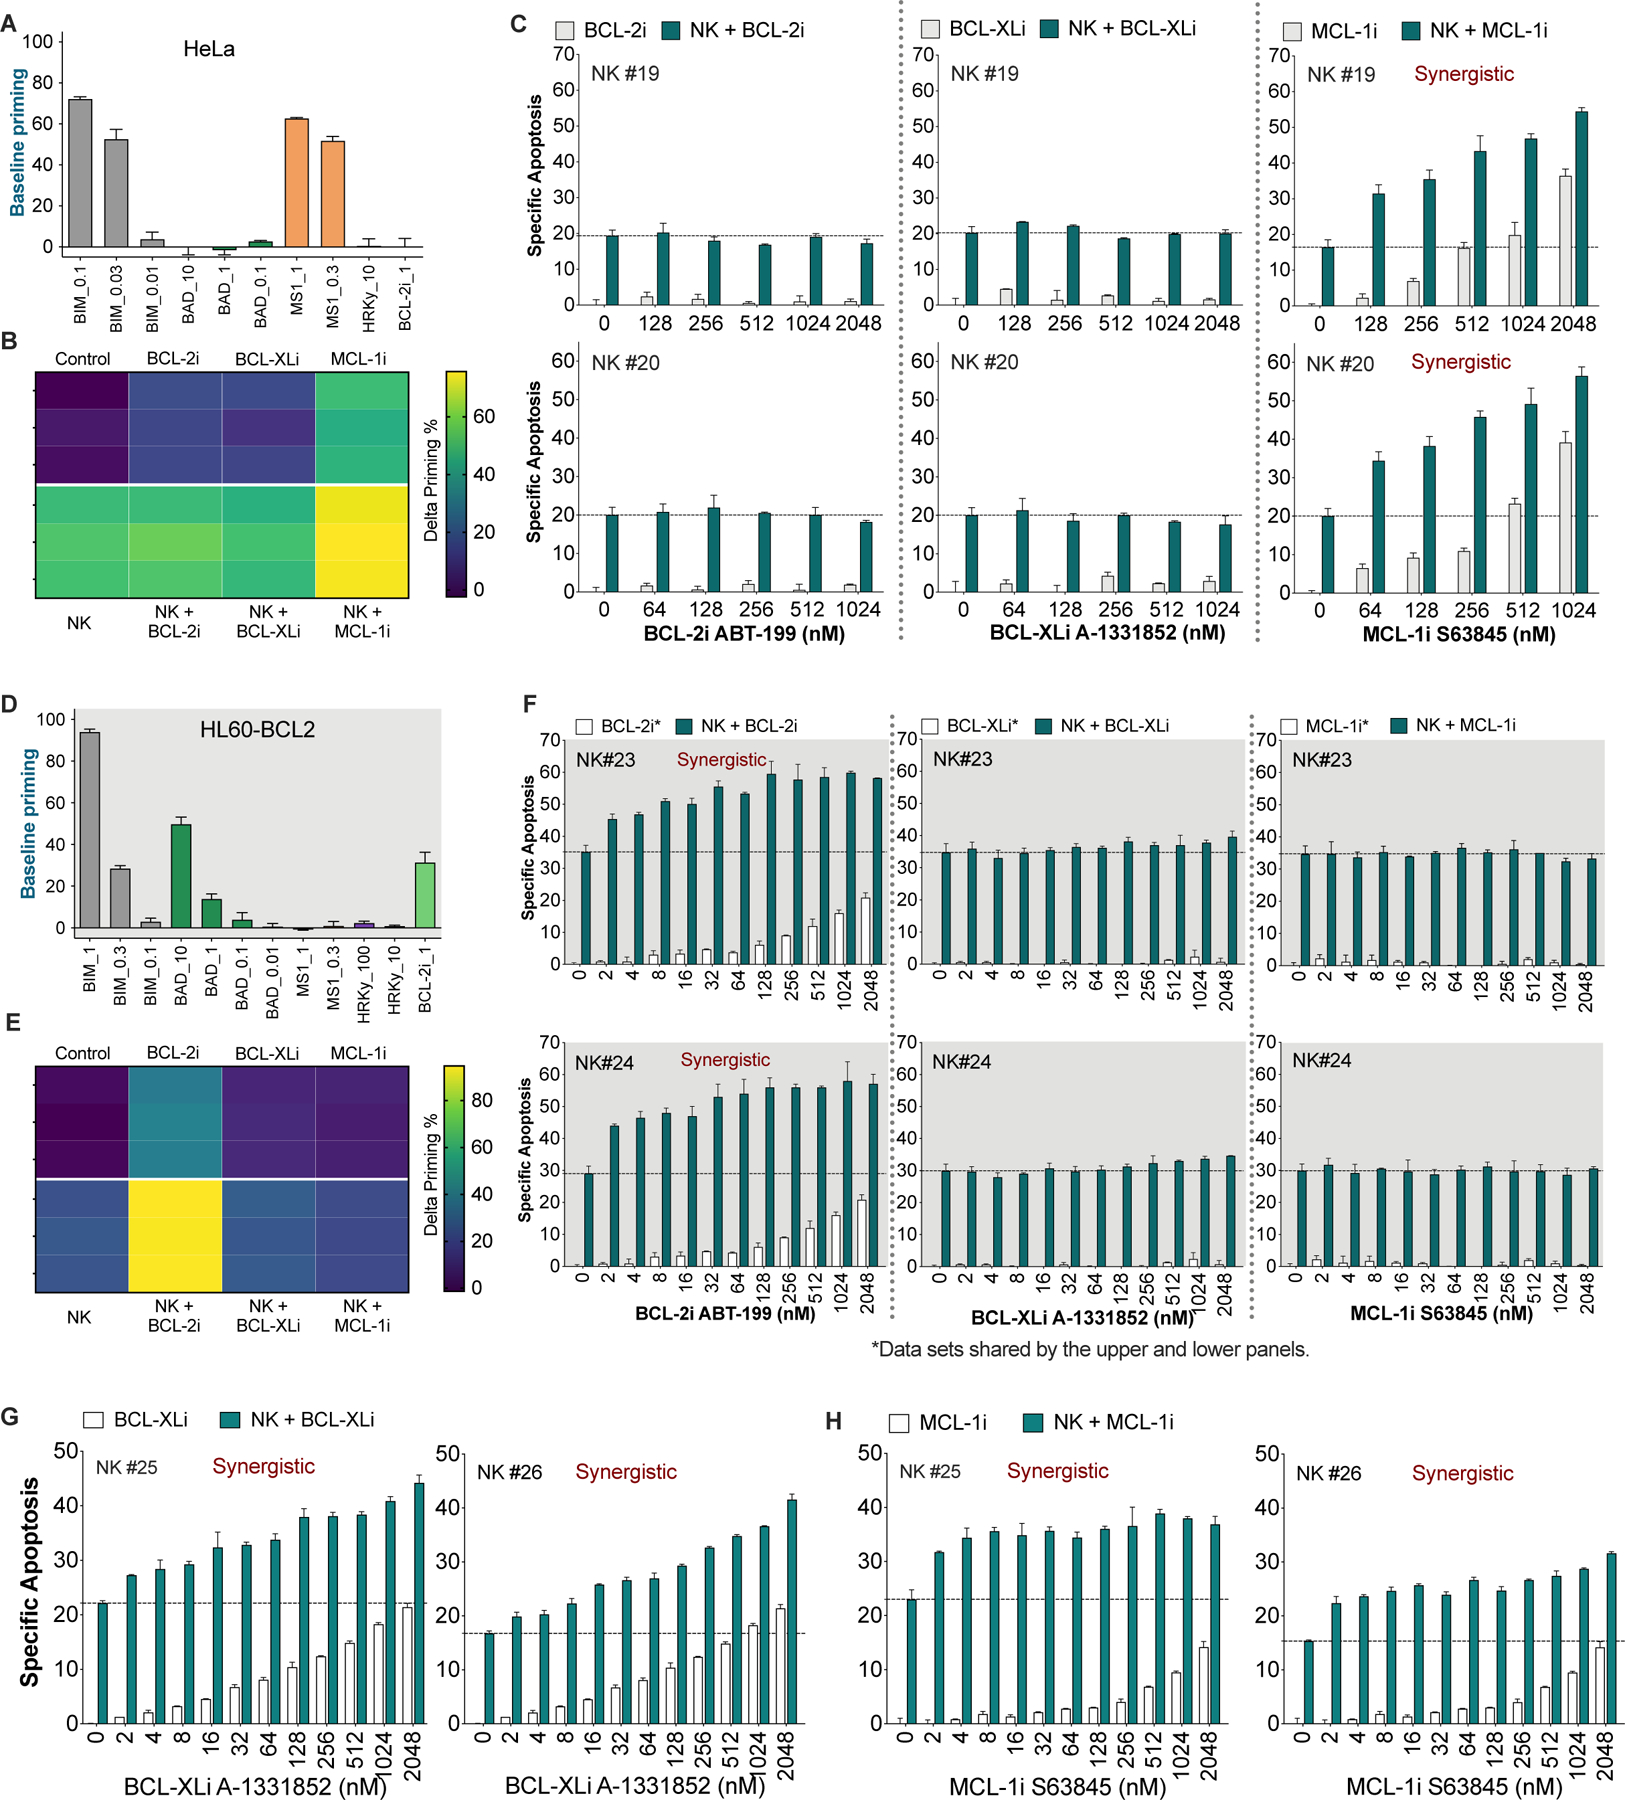
(A and D) Basal level of mitochondrial priming of HeLa (A) and HL60-BCL-2 (D) cells as determined by BH3 profiling with the indicated peptides or BH3 mimetic (BCL-2i = ABT-199) at the indicated concentrations in μM.
(B and E) Delta priming of HeLa (B) and HL60-BCL-2 (E) cells after 2 h treatment with 256 nM BCL-2i, BCL-XLi, and MCL-1i in the presence or absence of NK cells (E:T = 1:2). Delta priming = primingtreated – priminguntreated, as determined using BIM peptide. Each tile represents one data point (n = 3).
(C) NK cells synergized with MCL-1i, but not with BCL-2i or BCL-XLi, in killing HeLa cells. HeLa cells were treated with escalating doses of different BH3 mimetics, in the presence or absence of pre-activated NK cells (E:T = 1:2, 6 h). Specific apoptosis in C, F, G and H was determined by annexin V staining.
(F) NK cells synergized with BCL-2i, but not with BCL-XLi or MCL-1i, in killing HL60-BCL2 cells. HL60-BCL2 cells were treated with escalating doses of different BH3 mimetics, in the presence or absence of two different samples of pre-activated human NK cells (E:T = 1:2, 6 h).
(G) Combined effects of NK cells and BCL-XLi on HL60-BCLXL cells (E:T = 1:2, 6 h).
(H) Combined effects of NK cells and MCL-1i on OCI3-MCL1 cells (E:T = 1:2, 6 h).
For all bar graphs, data were presented as mean ± SEM of triplicate experiments. Dashed lines in bar graphs denote apoptotic percentage induced by NK cells alone.
See also Figures S5, S6, and S7.
We next selected HL60-BCL2, a blood cancer cell line with an anti-apoptotic dependence distinct from HeLa cells (Figure 6D) to further examine our hypothesis. BH3 profiling indicated that it is a BCL-2 dependent cell line. We predicted that BCL-2i, but not BCL-XLi or MCL-1i, would synergize with NK cells in priming and in killing HL60-BCL2 cells. As expected, only BCL-2i triggered a significant increase of delta priming (Figure 6E) and only BCL-2i augmented NK-induced priming (Figure 6E). More importantly, BCL-2i synergized with NK cells in killing target cells, whereas the other two combinations had no synergy at all (Figure 6F).
We have shown that HL60-BCLXL and OCI-AML3-MCL1 cells respectively depend on BCL-XL and MCL-1 for survival. As speculated, BCL-XLi and NK cells synergistically induced apoptosis in the BCL-XL-dependent cells (Figure 6G). Similarly, MCL-1i synergized with NK cells in killing OCI-AML3-MCL1 cells (Figure 6H).
Of note, BH3 mimetics do not upregulate stress-inducible ligands such as MICA and MICB in malignant or non-transformed cells (Figures S5A-B). We also explored the combined effects on non-transformed cells. BCL-2 inhibitor did not increase NK killing of endothelial, macrophage and fibroblast cells (Figure S5C). The MCL-1 or BCL-XL antagonists slightly, or moderately increased NK killing of endothelial cells and macrophages but not fibroblast cells (Figures S5D-E). Of note, NK cells by itself can kill ex vivo expanded non-transformed cells, though to a much lesser extent than they killed malignant cells. This is not unexpected because these non-transformed cells had gone through extended ex-vivo culture which could stress them to upregulate stress-inducible ligands, thus being different from in situ “unstressed” cells which likely do not trigger NK killing. Consistent with this postulation, adoptive transfer of pre-activated NK cells has demonstrated a good safety profile in clinical trials (Miller et al., 2005; Rubnitz et al., 2010; Ruggeri et al., 2002).
A common strategy to augment NK killing is to use antibodies such as rituximab and cetuximab to induce antibody-dependent cellular cytotoxicity (ADCC) of NK cells. We also performed exploratory experiments to examine whether CD20 targeting rituximab or EGFR-targeting cetuximab affect tumor cell priming for mtApoptosis. We found that rituximab treatment significantly increased mitochondrial priming of CD20+ SU-DHL4 and SU-DHL6 cells (Figure S6A). Cetuximab significantly increased priming status of EGFR+ HeLa cells but not of MDA-MB-231 cells (Figure S6B). We postulate that the increased mitochondrial priming may also contribute to the widely reported synergy between the two ADCC-inducing agents and NK cells (Baysal et al., 2020; Dall’Ozzo et al., 2004; Kimura et al., 2007; Kurai et al., 2007). Immune checkpoint blockade has revolutionized the treatment of certain types of cancers. We found that PD-1 inhibitor nivolumab and CTLA-4 inhibitor ipilimumab did not change the priming status of HeLa and OCI-AML3 cells, the two representative cell lines used in this study (Figure S6D-E). We also examined a panel of 14 cancer cell lines and found that none of them express PD-1 or CTLA-4 (Figure S6F), which is not surprising since PD-1 or CTLA-4 are receptor proteins generally expressed and studied in immune cells. Among the 14 profiled cell lines, breast cancer cell line MDA-MB-231 and lung cancer cell lines H1975 and H460 express PD-L1 (Figure S6G-H). PD-L1 inhibitor atezolizumab did not change the mitochondrial priming of the three PD-L1+ cell lines (Figure S6I). In summary, we found that while some therapeutic antibodies may well enhance killing by NK cells via inducing ADCC, an additional mechanism, enhanced mitochondrial priming of the target cancer cells, might also contribute.
Taken together, BH3 mimetics were able to synergize with NK cells in both priming and killing cancer cells. Our previous work showed that BH3 profiling predicted cancer response to different drugs in vitro, in vivo, and in the clinic (Letai, 2017; Montero et al., 2015; Ni Chonghaile et al., 2011; Pan et al., 2014). Here we performed BH3 profiling experiments in the context of immunotherapy and demonstrated that synergy between NK cells and BH3 mimetics can be predicted by BH3 profiling as well.
Selective BH3 mimetics synergize with NK cells in vivo, as predicted by BH3 profiling
Next, we investigated if BH3 mimetics would synergize with adoptively transferred NK cells in vivo and if BH3 profiling could predict the combined effects. For the first mouse model, we subcutaneously injected HL60-BCL2 cells into NSG immunodeficient mice. After mice developed palpable tumors, they were randomly assigned into six groups and treated with regimens as detailed in Figure 7A. Based on the BH3 profiling results that the injected cells are highly dependent on BCL-2 (Figure 6D), we predicted that BCL-2i, but not MCL-1i, would synergize with NK cells in vivo. Indeed, BCL-2i synergized with NK cells in priming engrafted cells in vivo, as determined by ex vivo BH3 profiling assays (Figure 7B). Consistently, NK cells or BCL-2i alone moderately suppressed tumor growth, while the combination reduced tumor burden to a significantly greater extent (Figure 7C). NK cells or BCL-2i monotherapy prolonged mouse median survival by three or four days, while the combination synergistically extended survival by 16 days (Figure 7D) in this highly aggressive model, where 0.5 million injected cells could form tumors > 2,000 mm3 (the endpoint) within two weeks. In contrast, MCL-1i which was predicted to be non-synergistic but nevertheless included as a “negative” control, neither synergized with NK cells in reducing tumor burden nor in prolonging mouse survival (Figure 7D).
Figure 7. BH3 mimetics synergize with pre-activated NK cells in reducing tumor burden and prolonging mouse survival.
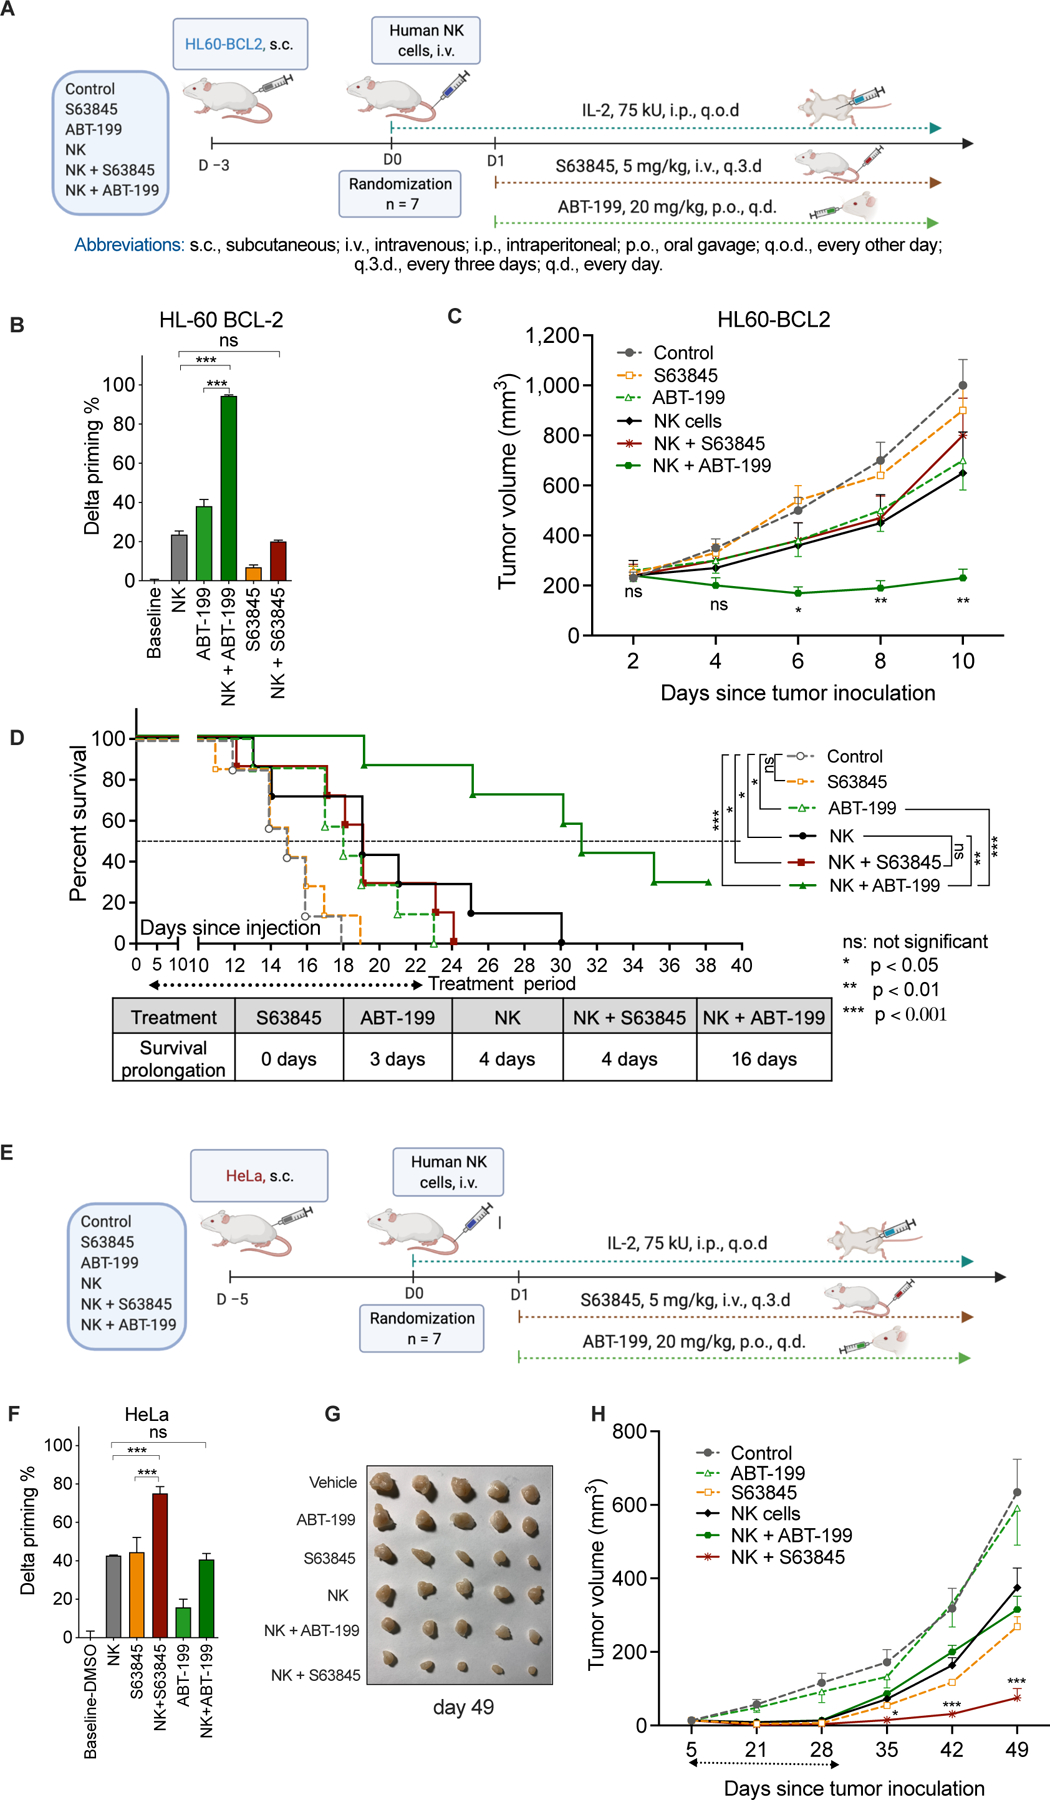
(A) Schematic outline of the HL60-BCL2 mouse model (6 groups, n = 7 per group). NK cells used for in vivo studies were generated and pre-activated following the same procedure as for in vitro studies.
(B) ABT-199, but not S63845, synergized with NK cells in priming engrafted HL60-BCL2 cells treated as xenografts in vivo and then removed and subjected to BH3 profiling. Delta priming was determined using BH3 profiling with BIM peptide on dissociated cells from engrafted tumors, comparing tumors obtained from treated mice with those from untreated mice.
(C) Mean tumor volume of NSG mice subcutaneously implanted with HL60-BCL2 cells. Statistical tests were performed as NK/ABT-199 group versus NK group, the second most efficacious treatment arm.
(D) Kaplan-Meier survival curves of mice engrafted with HL60-BCL2 cells. Statistical significance was calculated using the log rank test.
(E) Schematic outline of the HeLa-NSG mouse model. NK cells used for in vivo studies were generated and pre-activated following the same procedure as for in vitro studies as described in Methods.
(F) S63845, but not ABT-199, synergized with NK cells in priming engrafted HeLa cells in vivo. Delta priming was determined as in 7B.
(G) Photograph of representative HeLa tumors in different groups (day 49).
(H) Mean tumor volume of NSG mice implanted with HeLa cells. Statistical tests were performed as NK/S63845 group vs. S63845 group, the second most efficacious treatment arm.
Data were presented as mean ± SEM (B, C, F, and H). Statistical significance by student’s t test. *p < 0.05, **p < 0.01, ***p < 0.001, ns, nonsignificant.
The second in vivo model we chose is the HeLa-NSG xenograft mouse model (Figure 7E). This model was selected because BH3 profiling suggested that HeLa cells are dependent on MCL-1 rather than BCL-2 for survival (Figure 6A), thus offering a useful contrast to the first model. We thus predicted that NK cells would synergize with MCL-1i, but not BCL-2i, in this model. Indeed, MCL-1i significantly synergized with NK cells in priming engrafted HeLa cells (Figure 7F). Furthermore, both MCL-1i and NK cells suppressed tumor growth, but the combination reduced tumor volume significantly greater than either treatment alone. In contrast, BCL-2i, predicted to be non-synergistic by BH3 profiling, was largely ineffective by itself and did not augment NK-mediated tumor suppression (Figures 7G-H).
Taken together, using a blood and a solid tumor xenograft model, each with different anti-apoptotic dependencies, we demonstrated that BH3 mimetics synergized with NK cells in vivo and that BH3 profiling predicted if a given BH3 mimetic would synergize with adoptive NK cells. In summary, increasing apoptotic priming in target cancer cells with rationally chosen BH3 mimetics augmented efficacy of NK cells both in vitro and in vivo.
The strategy of targeting mtApoptosis to augment NK killing may be adaptable to T cell therapies
Though the current study centered around NK cells, we also performed some exploratory proof-of-concept experiments using T cells. Both NK cells and cytotoxic T cells form immunological synapses to deliver granzymes or use death ligands to initiate killing of cancer cells (Morvan and Lanier, 2016; Waldman et al., 2020). Given this similarity, mtApoptosis may also play an essential role in T cell-mediated killing and, if so, BH3 mimetics may synergize with T cells as well, but again on the premise that T cells could tolerate BH3 mimetics. TCR-, TIL-, and CAR-T cells for adoptive T cell transfer are generally generated from pre-activated T cells (June et al., 2018; Rosenberg and Restifo, 2015). We found that pre-activation with IL-2 and CD3/CD28 Dynabeads rendered CD8+ cytotoxic T cells resistant to BCL-2i and MCL-1i (Figure S7A), similarly as we observed in pre-activated NK cells. The acquired resistance opens the possibility to combine these BH3 mimetics with adoptive T cells. We transduced CD8+ T cells with TCR specific for NY-ESO-1 antigen (Rapoport et al., 2015) and found that the TCR-T cells effectively primed NY-ESO-1 expressing cancer cells for mtApoptosis (Figure S7B). Furthermore, as speculated, TCR-T cells significantly synergized with BCL-2i and MCL-1i in inducing target cell apoptosis and in reducing the number of target cells (Figure S7C-D). Based on these proof-of-concept experiments, we postulated that the strategy of targeting mtApoptosis to augment NK killing may be adaptable to adoptive T cell therapies as well.
DISCUSSION
Our results, using different models, indicate that mtApoptosis deficiency made cells resistant to efficient NK killing. This was true for both ‘weak’ and ‘strong’ NK killers when used at E:T ≤ 1:1. Mitochondria thus appear to be essential amplifiers for the death signal delivered by NK cells. Recent reports suggested that cytotoxic cell contacts are, generally, not binary “live/death” events (Beck et al., 2020; Halle et al., 2016; Weigelin et al., 2020). On the contrary, most contacts are sublethal and the incurred damage can accumulate to lethal levels by subsequent contacts over time. For example, Halle et. al. observed that the probability of target cell death after a single cytotoxic cell contact was ~15%, while that increased to > 80% after three or more contacts. Using different models, Weigelin et.al. demonstrated that apoptotic events were often proceeded by multiple cytotoxic T cell contacts. Furthermore, the sublethal damage in the plasma/nuclear membrane and in DNA integrity resembled damages induced by chemical assaults, which were also incremental and can be repaired if given time (Callen et al., 2013; Denais et al., 2016; Spencer and Sorger, 2011; Weigelin et al., 2020). Our observation of increased apoptotic priming following NK treatment (Figure 3) offers an explanation for the additive cytotoxicity of serial NK encounters. We postulate that at low E:T ratios, the NK-target cell contacts happen less often, and the sublethal damage needs to be amplified by mitochondria to push cancer cells beyond their apoptotic thresholds. This amplifier function seems only dispensable when “strong” killers were used at high E:T ratios (e.g., 2:1, 4:1) where BAX/BAK DKO cells were effectively killed. For ‘weak’ NK killers, even used at high E:T ratios, it seems the accumulated death signal still does not suffice and needs to be amplified by mitochondria. Consequently, ‘weak killers’ were largely ineffective against BAX/BAK DKO cells.
However, when cancer cells are pushed closer to apoptotic thresholds (primed) by BH3 mimetics, less-powerful hits from ‘weak’ killers or less-frequent NK punches due to low E:T ratios may become sufficient to push cancer cells across apoptotic thresholds. This may explain why BH3 mimetics, even used at low nM concentrations where they could prime cancer cells (Figure S4D) but barely kill them as single agents (Figures 6F-H), almost always sensitized cancer cells to NK-mediated killing. The strategy of priming cancer cells with BH3 mimetics could make them easier targets for NK cells, thus potentially accelerating NK-mediated killing. In light of the short lifespan and persistence of adoptively transferred NK cells (Lutz et al., 2011; Romee et al., 2016; Rubnitz et al., 2010), a strategy to accelerate NK killing and augment their anti-tumor efficacy is particularly relevant.
We have demonstrated that combining BH3 mimetics offer synergistic benefit to NK cell therapy in vitro and in vivo. If this concept is taken into the clinic, it is beneficial to first determine the anti-apoptotic dependence of patient cancer cells. For cancers with known dependence (e.g., chronic lymphoid leukemias are highly dependent on BCL-2 (Del Gaizo Moore et al., 2007; Letai, 2008)), it is logical to combine the corresponding BH3 mimetic with NK cells–in this case, a BCL-2i. For cancers without a consistent dependence, BH3 profiling can be used to determine the baseline dependence and/or BH3 mimetic-induced priming of patient cells in an assay which typically takes a few hours and does not require extended ex vivo culture. In the era of precision medicine, BH3 profiling may help rationally assign individual patients to a BH3 mimetic-NK combination which potentially benefits them the most.
In addition to BH3 mimetics, many other chemo- and targeted therapeutics kill cancer cells by inducing mtApoptosis (Ashkenazi et al., 2017; Hata et al., 2015; Letai, 2008; Singh et al., 2019). It is plausible to reason that, properly selected, the right such agent might potentially sensitize tumor cells to NK-mediated killing provided the combined compounds can be well-tolerated by NK cells. We have demonstrated that pre-activated NK cells became less primed for mtApoptosis. They are thus likely capable of tolerating higher doses of mtApoptosis-inducing agents, thus opening the possibility of more combination options. Moreover, certain combinatorial strategies might offer additional benefits. In addition to making malignant cells easier kills for NK cells, some therapeutics (e.g., genotoxic agents) can upregulate germline-encoded ligands on cancer cells and facilitate target recognition by activation receptors on NK cells (Huntington et al., 2020; Raulet and Guerra, 2009), thus leading to a more robust NK response.
In summary, strategies to augment NK-based therapies are much needed. Herein we report that mtApoptosis machinery is essential for efficient NK killing and proposed targeting mtApoptosis to enhance NK anti-tumor efficacy. Using multiple in vitro and in vivo models, we demonstrated that BH3 mimetics and NK cells markedly synergized in killing cancer cells and BH3 profiling can be utilized to rationally select BH3 mimetics to be combined with NK cells. Our results may serve as the basis for future clinical trials testing the combinations of NK cells with BH3 mimetics. Furthermore, as demonstrated by our exploratory experiments, this approach may be adaptable to T cell-based immunotherapies as well. Taken together, we proposed a rational strategy to sensitize cancer cells to cytotoxic cell-mediated killing and a therapeutic avenue to be tested both in laboratories and in the clinic.
Limitations of the study
The employed mouse models utilized immunodeficient mice, human cancer cells, and human NK cells. We had considered using the combination of immunocompetent mice and syngeneic murine cancer and NK cells. However, there are practical issues that render such a model less productive to evaluate adoptive NK therapy. Laboratory mice are inbred so that each strain is homozygous and has a unique MHC haplotype. When using NK cells from the same strain, the inhibitory effects from self-MHC recognition, inefficient stimulation of NK cells by syngeneic tumor cells, development of resistance to “autologous” NK cells after tumor engraftment, and complications from endogenous T, B, and NK cells, made this experimental model unconclusive. Actually, almost all current adoptive NK transfer trials use allogenic NK cells because autologous NK cells failed to produce significant therapeutic effects (Bald et al., 2020; Myers and Miller, 2021; Ruggeri et al., 2002). We had also considered injecting allogeneic NK cells from a different murine strain into immunocompetent mice. However, there is a major concern with host rejection by host T and B cell alloimmune responses, leading to clearance of allogenic NK cells. In fact, this is why nearly all allogeneic NK transfer requires chemical immunosuppression of the recipients. After taking these issues into consideration, we used the combination of immunodeficient mice + human tumor cells + allogenic human NK cells. But there are limitations associated with this type of mouse models. In the clinic, pre-conditioning before allogenic NK transfer ablated recipients’ T, B, and NK cells, etc., but there are still other immunosuppressive or immunostimulatory cells remaining in the tumor stroma. There might be unexpected interactions between those cells and the BH3-mimetics, which could not be investigated by the employed mouse models. For example, the models we employed are not ideal to study whether the combination would cause cytokine release syndrome (CRS) because this effect depends on a complicated immunological milieu likely not present in these models. In addition, the contribution of cytokines released by human NK cells might be underestimated due to their attenuated interaction with murine receptors in the host. Although adoptively transferred NK cells by itself have been shown not to induce CRS, this possibility cannot be excluded when they are used in conjunction with BH3 mimetics. This question may be systematically investigated in the clinic or using primate models to better mimic the clinical situations in follow-up studies.
STAR METHODS
Lead Contact
Further information and requests for resources and reagents should be directed and will be fulfilled by the Lead Contact, Anthony Letai (Anthony_Letai@dfci.harvard.edu)
Materials Availability
This study did not generate new unique reagents.
Data and Code Availability
This study did not generate datasets or code.
EXPERIMENTAL MODEL AND SUBJECT DETAILS
Cell lines
Cell lines were purchased from the American Type Culture Collection (Manassas, VA) or Deutsche Sammlung von Mikroorganismen und Zellkulturen (Braunschweig, Germany) and maintained according to the vendors’ instructions. HL-60 cell lines with stable overexpression of BCL-2 or BCL-XL and the control cell line were kindly provided by Dr. Kapil N. Bhalla (UT MD Anderson Cancer Center). Human caspase-8 knockout HeLa cell line was ordered from Abcam. All cell lines were mycoplasma free, as tested by PCR Mycoplasma Detection Kit (#G238, Applied Biological Materials). Cell lines were validated by short tandem repeat DNA fingerprinting using the AmpFlSTR Identifier kit according to the manufacturer’s instructions (Thermo Fisher Scientific). Cells were cultured at 37°C in a humidified atmosphere containing 5% CO2. Exponentially growing cells with viability greater than 95% were used for all in vitro and in vivo studies.
Mice and housing conditions
Animal experiments were performed after approval from the Dana-Farber Cancer Center Committee on Use and Care of Animals and were conducted as per NIH guidelines for animal welfare. All animal procedures were performed in accordance with approved Institutional Animal Care and Use Committee (IACUC) guidelines at Dana-Farber cancer institute animal facility (IACUC protocol#14–038). Animals were housed and cared according to standard guidelines with free access to water and food. All mouse experiments were performed on 6–8 weeks old, female NOD SCID gamma (NSG) female mice (Jackson labs stock#005557). Animals were randomly assigned to experimental groups.
Human subjects
Peripheral blood leukocytes were isolated from healthy blood donor leukapheresis collars. All human samples were deidentified, discarded clinical material and their use was approved by the Dana-Farber Cancer Institute and Harvard University human studies review boards. Primary Umbilical Vein Endothelial Cells were ordered from ATCC and cultured according to the vendors’ instructions.
METHOD DETAILS
Immunoblotting and Antibodies
Cells were lysed at a density of 1 × 10⁶/50 μL in lysis buffer (0.25 M Tris-HCl, 2% sodium dodecylsulfate, 4% β-mercaptoethanol, 10% glycerol, 0.02% bromophenol blue) supplemented with 1 X protease/phosphatase inhibitor cocktail (#5872, Cell Signaling Technology). Cell lysates were then loaded onto polyacrylamide gels with sodium dodecyl sulfate (Bio-Rad). After electrophoresis, proteins were transferred to polyvinylidene difluoride (PVDF) membranes. The transblotted membranes were blocked for 1 hr and then probed with appropriate primary antibodies overnight at 4°C. Next day, the membranes were washed three times for a total of 30 min and then incubated with IRDye® 680RD Donkey anti-Rabbit IgG (H + L) or IRDye® 800CW Donkey anti-Mouse IgG (H + L) (Li-COR Biosciences) in darkness at room temperature for 1 h. After another three washes, Odyssey infrared imaging system and companion software (LI-COR Biosciences) were used to scan immunoblot membranes and to quantify band intensity according to the manufacturer’s manual. Please refer to the KEY RESOURCES TABLE for providers of all primary or secondary antibodies.
KEY RESOURCES TABLE
| REAGENT or RESOURCE | SOURCE | IDENTIFIER |
|---|---|---|
| Antibodies | ||
| Mouse monoclonal anti-BCL-2 (clone C-2) | Santa Cruz Biotechnology | Cat#sc-7382; RRID:AB_626736 |
| Rabbit polyclonal anti-MCL-1 (clone S-19) | Santa Cruz Biotechnology | Cat#sc-819; RRID:AB_2144105 |
| Rabbit monoclonal anti-BCL-XL(clone 54H6) | Cell Signaling Technology | Cat#2764; RRID:AB_2228008 |
| Rabbit polyclonal anti-PUMA (clone H-136) | Santa Cruz Biotechnology | Cat#sc-28226; RRID:AB_2064827 |
| Rabbit polyclonal anti-PARP-1 | Cell Signaling Technology | Cat#9542; RRID:AB_2160739 |
| Rabbit polyclonal anti-BIM | Cell Signaling Technology | Cat#2819; RRID:AB_10692515 |
| Rabbit polyclonal anti-BID | Cell Signaling Technology | Cat#2002; RRID:AB_10692485 |
| Mouse monoclonal anti-BID | Santa Cruz Biotechnology | Cat#sc-373939 AB_10917226 |
| Mouse monoclonal anti-granzyme B (2C5) | Santa Cruz Biotechnology | Cat#sc-8022 PRID:AB_2232723 |
| Rabbit polyclonal Anti-BAX | Cell Signaling Technology | Cat#2772; RRID:AB_10695870 |
| Rabbit polyclonal anti-BAK | Milipore | Cat#06–536; RRID:AB_310159 |
| Rabbit monoclonal anti-cleaved caspase-3 (D175) (clone 5A1E) | Cell Signaling Technology | Cat#9664; RRID:AB_2070042 |
| Rabbit monoclonal anti-caspase-8 | Cell Signaling Technology | Cat#9496; RRID:AB_2228008 |
| Mouse monoclonal anti-caspase-9 (clone C9) | Cell Signaling Technology | Cat#9508; RRID:AB_10695598 |
| Mouse monoclonal anti-β-Actin (clone AC-74) | Sigma-Aldrich | Cat#A2228; RRID:AB_476697 |
| Rabbit monoclonal anti-GAPDH (clone D16H11) | Cell Signaling Technology | Cat#5174; RRID:AB_10622025 |
| Mouse monoclonal anti-Noxa (clone 114C307) | Abcam | Cat#ab13654; RRID:AB_300536 |
| IRDye® 680RD Donkey anti-Rabbit IgG (H + L) | Li-COR Biosciences | Cat#925–68073; RRID:AB_2716687 |
| IRDye® 800CW Donkey anti-Mouse IgG (H + L) | Li-COR Biosciences | Cat#925–32212; RRID:AB_2716622 |
| Mouse monoclonal anti-human CD45-PE (clone HI30) | BD Biosciences | Cat#555483; RRID:AB_395875 |
| Rat monoclonal anti-mouse CD45-APC (clone 30-F11) | BD Biosciences | Cat#559864; RRID:AB_398672 |
| Alexa Fluor® 647 anti-human CD56 | Biolegend | Cat#362514; RRID:AB_2564087 |
| Alexa Fluor® 647 anti-Cytochrome c antibody | BioLegend | Cat#612310; RRID:AB_2565241 |
| FITC anti-Cytochrome c antibody | BioLegend | Cat#983502; RRID:AB_2749869 |
| PE anti-human CD56 (NCAM) antibody | BioLegend | Cat#362508; RRID:AB_2563925 |
| PE anti-human CD3 antibody | BioLegend | Cat#300308; RRID:AB_314044 |
| Alexa Fluor® 488 anti-human CD3 antibody | BioLegend | Cat#317310; RRID:AB_571877 |
| Brilliant Violet 605™ anti-human CD4 antibody | BioLegend | Cat#317438; RRID:AB_11218995 |
| Brilliant Violet 785™ anti-human CD8a antibody | BioLegend | Cat#301046; RRID:AB_2563264 |
| Annexin V, FITC conjugate | BD Biosciences | Cat#556419; RRID:AB_2665412 |
| Annexin V, APC conjugate | BD Biosciences | Cat#550475; RRID:AB_2868885 |
| APC anti-human CD274 (B7-H1, PD-L1) | Biolegend | Cat#329708; RRID:AB_940360 |
| APC Mouse IgG2b, κ isotype Ctrl | Biolegend | Cat#400322; RRID:AB_326500 |
| FITC anti-human CD279 (PD-1) | Biolegend | Cat#329904; RRID:AB_940479 |
| FITC Mouse IgG1, κ isotype Ctrl | Biolegend | Cat#400107; RID:AB_326429 |
| Brilliant Violet 421™ anti-human CD152 (CTLA-4) | Biolegend | Cat#369605; RRID:AB_2616790 |
| Brilliant Violet 421™ Mouse IgG2a, κ isotype Ctrl | Biolegend | Cat#400260; RRID:AB_10960144 |
| Alexa Fluor® 647 anti-mouse IgG2a | Biolegend | Cat#407116; RRID:AB_2563483 |
| Rabbit (DA1E) mAb IgG XP Isotype Control | Cell Signaling | Cat#3900S; RRID:AB_1550038 |
| Rituximab (anti-CD20) | Sellleck | Cat#A2009–5mg; RRID:AB_2893089 |
| Cetuximab (anti-EGFR) | Selleck | Cat#A2000–5mg; RRID:AB_2893090 |
| Ipilimumab (anti-PD-1) | Thermo Fisher | Cat#501934389; RRID:AB_2893091 |
| Atezolizumab (anti-PD-L1) | Selleck | Cat#A2004–5mg; RRID:AB_2893092 |
| Nivolumab (anti-PD-1) | Selleck | Cat#A2002; RRID:AB_2810223 |
| Human Trail neutralizing antibody | Thermo Fisher | Cat#MAB375100; RRID:AB_2256258 |
| Human FasL neutralizing antibody | Thermo Fisher | Cat#MAB126100; RRID:AB_2246667 |
| Human TNF-alpha Neutralizing (D1B4) Rabbit mAb | Cell Signaling | Cat#7321S; RRID:AB_10925386 |
| Biological Samples | ||
| Fresh human leukapheresis blood collars | Brigham & Women’s Hospital | N/A |
| Chemicals, Peptides, and Recombinant Proteins | ||
| zDEVD-fmk caspase-3 Inhibitor | BD Biosciences | Cat#550378 |
| zVAD-fmk general caspase inhibitor | BD Biosciences | Cat#550377 |
| Necrostatin-1 | Sigma Aldrich | Cat#N9037 |
| Ferrostatin-1 | Sigma Aldrich | Cat#SML0583 |
| α-tocopherol | Sigma Aldrich | Cat#T3251 |
| Dimethyl fumarate | Selleck Chemicals | Cat#S2586 |
| EGTA 0.5M sterile (PH 8.0) | Thermo Fisher | Cat#50255956 |
| ABT-199 | Medchem Express | Cat#HY-15531 |
| S63845 | Medchem Express | Cat#HY-100741 |
| A-1331852 | Medchem Express | Cat#HY-19741 |
| Cytarabine | Selleck Chemicals | Cat#S1648 |
| Etopside | Cell Signaling | Cat#2200S |
| Digitonin | Sigma Aldrich | Cat#D5628 |
| Alamethicin | Cayman Chemical | Cat#11425 |
| Activated S6K1 | Millipore | Cat#14–486 |
| Phosal 50 PG | Fisher Scientific | Cat# NC0130871 |
| PEG400 | Sigma Aldrich | Cat# 202398–500G |
| Hydroxypropyl-b-cyclodextrin powder | Sigma Aldrich | Cat# C0926–5G |
| Protease/Phosphatase Inhibitor Cocktail (100X) | Cell signaling | Cat#5872 |
| BH3 Peptides | ||
| BIM: Acetyl-MRPEIWIAQELRRIGDEFNA-Amide | New England Peptide | Custom |
| BID: Acetyl -EDIIRNIARHLAQVGDSMDRY- Amide | New England Peptide | Custom |
| BAD: Acetyl - LWAAQRYGRELRRMSDEFEGSFKGL-Amide | New England Peptide | Custom |
| HRK: Acetyl -SSAAQLTAARLKALGDELHQY-Amide | New England Peptide | Custom |
| MS1: Acetyl-RPEIWMTQGLRRLGDEINAYYAR-Amide | New England Peptide | Custom |
| FS1: Acetyl-QWVREIAAGLRLAADNVNAQLER-Amide | New England Peptide | Custom |
| Recombinant human Fas ligand | Fisher Scientific | Cat#126-FL-010 |
| Recombinant human TNF alpha | Fisher Scientific | Cat#210-TA-020 |
| Recombinant human Trail | Biolegend | Cat#752906 |
| Recombinant human GM-CSF | Sigma Aldrich | Cat# G5035 |
| Recombinant Human IL-2 | Peprotech | Cat#200–02 |
| Recombinant Human IL-4 | Fisher Scientific | Cat#204IL010 |
| Critical Commercial Assays | ||
| CFSE - Cell Labeling Kit | Abcam | Cat#ab113853 |
| MitoTracker Red CMXRos | Life Technologies | Cat#M7512 |
| BioTracker NucView® 405 Blue Caspase-3 Dye | EMD Millipore | Cat#SCT104 |
| Zombie Violet™ Fixable Viability Kit | BioLegend | Cat#423114 |
| EasySep™ Human NK Cell Isolation Kit | StemCell Technologies | Cat#17955 |
| EasySep™ Human CD8+ T Cell Enrichment Kit | StemCell Technologies | Cat#19053 |
| EasySep™ HLA Chimerism Buffy Coat CD14 Positive Selection Kit | StemCell Technologies | Cat# 17878 |
| Dynabeads Human T-Activator CD3/CD28 | ThermoFisher | Cat#111.31D |
| Experimental Models: Cell Lines | ||
| Human: OCI-AML3 | DSMZ | Cat#ACC-582; RRID: CVCL_1844 |
| Human: HL-60 | ATCC | Cat#HL-60; RRID:CVCL_A794 |
| Human: MOLM-13 | DSMZ | Cat#ACC-554; RRID:CVCL_2119 |
| Human: MDA-MB-231 | ATCC | Cat#MDA-MB-231; RRID:CVCL_0062 |
| Human: H460 | ATCC | Cat#HTB-177; RRID:CVCL_0459 |
| Human: HEK293T | ATCC | Cat#CRL-3216; RRID:CVCL_0063 |
| Human: HeLa | ATCC | Cat#CCL-2; RRID:CVCL_0030 |
| Human: NK92-MI | ATCC | Cat#CRL-2408; RRID:CVCL_3755 |
| Human: KHYG-1 | DSMZ | Cat#ACC-725; RRID:CVCL_2976 |
| Human: CCD-8Lu | ATCC | Cat#CCL-201; RRID:CVCL_2398 |
| Human: IMR-90 | ATCC | Cat#CCL-186; RRID:CVCL_0347 |
| Human: MDA-MB-231 | ATCC | Cat#CRM-HTB-26; RRID:CVCL_0062 |
| Human: NCI-H1975 | ATCC | Cat#CRL-5908; RRID:CVCL_1511 |
| Human: NCI-H460 | ATCC | Cat#HTB-177; RRID:CVCL_0459 |
| Human: HeLa caspase-8 knockout | Abcam | Cat#ab264958 |
| Human: HeLa control | Laboratory of Anthony Letai | N/A |
| Human: HeLa BAX/BAK DKO | Laboratory of Anthony Letai | N/A |
| Human: SU-DHL6 | ATCC | Cat# CRL-2959; RRID:CVCL_2206 |
| Human: SU-DHL4 | ATCC | Cat# CRL-2957; RRID:CVCL_0539 |
| Human: BBDL | Laboratory of Anthony Letai | N/A |
| Human: HL60-control | Laboratory of Kapil N. Bhalla | N/A |
| Human: HL60-BCL2 | Laboratory of Kapil N. Bhalla | N/A |
| Human: HL60-BCLXL | Laboratory of Kapil N. Bhalla | N/A |
| Human: OCI-AML3 control | Laboratory of Michael Andreeff | N/A |
| Human: OCI-AML3-MCL1 | Laboratory of Michael Andreeff | N/A |
| Experimental Models: Organisms/Strains | ||
| Mice: NOD.Cg-PrkdcscidIl2rgtm1Wjl/SzJ | The Jackson Laboratory | Strain: 005557; RRID: IMSR_JAX:005557 |
| Recombinant DNA | ||
| pCDH-EF1-MCS-BGH-PGK-GFP-T2A-Puro | System Biosciences | Cat#CD550A-1 |
| pLKO.1 Vector | Moffat et al., 2006 | Addgene Plasmid #10878 |
| psPAX2 Plasmid | A gift from Didier Trono | Addgene Plasmid #12260 |
| pMD2.G Plasmid | A gift from Didier Trono | Addgene Plasmid #12259 |
| Software and Algorithms | ||
| Image Studio Lite Software | LI-COR Biosciences | https://www.licor.com/bio/products/software/image_studio_lite/ |
| Prism Software v7.0 | GraphPad Software | https://www.graphpad.com/scientific-software/prism/ |
| BD FACSDiva™ Software | BD Biosciences | https://www.bdbiosciences.com/enus/instruments/research-instruments/research-software/flow-cytometry-acquisition/facsdiva-software |
| Flowjo Software v10 | Flowjo, LLC | https://www.flowjo.com/solutions/flowjo |
| Biorender | Biorender.com | https://www.biorender.com/ |
| Other | ||
| CountBrightTM Absolute Counting Beads | Thermo Fisher Scientific | Cat#C36950 |
| Human Ab Serum Heat-inactivated | Fisher Scientific | Cat#NC9310328 |
| Odyssey Infrared Imaging System | LI-COR | Custom |
| BX43 Upright Microscope with DP72 Digital Color Camera | OLYMPUS | Custom |
| Vi-CELL XR Viability Analyzer | Beckman Coulter | Mode#731050 |
| BD LSRFortessa™ X-20 Cell Analyzer | BD Biosciences | Custom |
| BD FACSAria II high speed cell sorters | BD Biosciences | Custom |
Human NK cell isolation and pre-activation
Human NK cells were isolated from fresh leukapheresis blood collars (< 6 h after collection) from healthy donors that were generated by Brigham & Women’s Hospital, Boston. Samples were diluted with an equal volume of PBS, and PBMC cells were isolated by Ficoll density gradient centrifugation. Isolated cells were washed twice with PBS, and NK cells were then isolated by negative selection using the EasySep™ Human NK Cell Isolation Kit (#17955, StemCell Technologies) according to the manufacturer’s protocol. Enriched resting NK cells (purity > 90%) were then cultured with RPMI medium supplemented with 5 mM Hepes, 2 mM Glutamax, 50 µg/ml Pen/Strep, 5 mM NEAA, 5 mM sodium pyruvate, 9% certified heat-inactivated FBS, 1% human A/B serum, as well as 50 µM freshly-added beta-mercaptoethanol. To pre-activate and expand the isolated resting NK cells, the medium was also supplemented with 100 IU/mL of recombinant human IL-2 (Peprotech). Half of the IL-2 containing medium was replaced with fresh medium three times a week. The cell density was kept between 1–3 million/mL and fresh complete medium was added to dilute the cell culture when necessary. Primary NK cells were pre-activated for three days before they were used in killing assays and were used within 2 weeks (day 3 to day 14) after isolation.
NK cell cytotoxicity assays
Exponentially growing adherent cells were trypsinized and then labelled with CFSE (Abcam) according to manufacturer’s protocol. Cells were next resuspended in pre-warmed culture medium and plated in flat-bottom 96-well plates (30,000 cells/100 µL/well). Of note, to achieve even distribution of the plated cells, vibration and agitation should be minimized especially before cells settle down and attach. Cells were cultured in low vibration incubator for 3 hours. The medium was then aspirated off with caution and replaced with 100 µL medium with different compounds, with or without NK cells at indicated E:T ratios. Again, vibration and agitation should be minimized before NK cells settle down. The cells were next co-cultured for indicated time in incubator with low vibration. After incubation, the supernatant was transferred to a 96 well flat-bottom plate with non-binding surface. The remaining attached cells were then washed with PBS, trypsinized, and combined with the supernatant. 20 µL of 10X annexin V binding buffer (100 mM HEPES, 40 mM KCl, 1.4 M NaCl, 7,5 mM MgCl2, 25 mM CaCl2, pH 7.4) with annexin V–Alexa647 and 20 µM/mL DAPI was added and incubated at room temperature for 15 min. Next, the plates were placed on ice and analyzed immediately with BD Fortessa flow cytometer with a high-throughput module.
For non-adherent cells, CFSE-labeled cancer cells were mixed with NK cells at different E:T ratios and the final concentration for cancer cells is 0.5 million/mL. Then 100 µL cell mixture was dispensed into 96-well plates pre-loaded with 100 µL medium supplemented with 2X final concentrations of different drugs. Vibration and agitation should be avoided to allow cancer cells and NK cells settle down evenly on the bottom. The cells were next incubated for indicated time in incubator with low vibration. The cells were then stained and analyzed as described above for adherent cells.
Apoptotic percentage and cell number
Cancer, NK, or T cells were treated with different compounds or dimethyl sulfoxide (DMSO) as indicated in the figures and figure legends. DMSO served as the drug vehicle, and its final concentration was no more than 0.1%. After treatment, cells were collected, stained with annexin V and DAPI, and analyzed by flow cytometry. Briefly, 10X annexin V binding buffer (100 mM HEPES, 40 mM KCl, 1.4 M NaCl, 7,5 mM MgCl2, 25 mM CaCl2, pH 7.4) with fluorochrome-conjugated annexin V and 20 µM/mL DAPI was added and incubated at RT for 15 min. Next, the plates were placed on ice and analyzed immediately with BD Fortessa flow cytometer. To determine absolute cell number, CountBright Absolute Counting Beads (Life Technologies) were also added. Data were analyzed by BD FACSDiva™ Software (BD Biosciences) and Flowjo software v10 (Flowjo). Calcusyn 2.0 software (Biosoft) was used to calculate combination index and whether there is a synergy, based on the number of live cells (i.e., AnxV−/DAPI−). The percentage of specific apoptosis was calculated as follows: 100 × (experimental apoptosis % – spontaneous apoptosis %)/(100 % – spontaneous apoptosis %).
BH3 profiling
Adherent cells were labelled with CFSE and next resuspended in pre-warmed culture medium in T75 flask. Cells were cultured for 3 hours to allow them to attach evenly (For non-adherent cells, this step can be skipped). Compounds were then added followed by addition of NK cells. The cells were then incubated for indicated time in incubator with low vibration. After incubation, the supernatant and the attached cells from one flask were harvested into the same tube. Cells were then counted with Vi-Cell cell counter (Beckman Coulter), stained with Zombie Violet live/dead dye (Biolegend) and fluorescence-labeled antibodies sequentially. After that, BH3 profiling with the iBH3 method was performed as previously described (Ryan et al., 2016). Briefly, cells were washed with PBS and suspended at 1 million/mL in MEB2-P25 buffer (10 mM HEPES, 150 mM mannitol, 150 mM KCl, 5 mM succinate, 1 μM EDTA, 1 μM EGTA, 0.1% protease free BSA, 0.25% polaxamer 188, pH = 7.4). Cells were then dispensed to 384-well plates (15 µL/well) containing peptides at 2X their final concentrations in 15 µL MEB2-P25 buffer with 0.002% digitonin. Cells were incubated at 25°C for 45 min before fixation and neutralization. Cells were then stained with cytochrome c antibody overnight at 4°C. samples were next analyzed by BD Fortessa flow cytometer with a high-throughput module. The raw data were converted to percentage of cytochrome c loss. The BH3 peptides are used as the probes for mitochondrial priming. When BIM peptide is used, the more cytochrome c release, the more primed the cells are for mtApoptosis. Therefore, mitochondrial priming is calculated as percentage of cytochrome c release following peptide exposure. For each data point, % cytochrome c loss was calculated using the equation described below.
“Treated” is the treatment well being analyzed, “ALM” is a control with alamethicin treatment which lead to highest possible release of cytochromes c, thus defining the minimum possible cytochrome c signal. The “Control” is a well with all assay components but no synthetic BH3 peptide, which defines complete cytochrome c retention (0% cytochrome c loss). Additional details can be found online at https://letailab.dana-farber.org/bh3-profiling.html.
Cell surface staining
Cell surface staining was done on ice for 15 min in the dark. Briefly, single cells were stained with conjugated fluorescent, unconjugated primary antibodies, or isotype controls and incubated for 15min. Then cells were washed with ice-cold staining buffer two times by centrifugation at 500 g for 5 min. When using unconjugated primary antibodies, the supernatant was aspirated off and the pellet was resuspended in 100 uL buffer with conjugated fluorescent secondary antibodies and incubated on ice in the dark for 15 min. After another two washes, the cell pellet was resuspended in 0.3 mL of staining buffer with DAPI and incubated for 5 minutes in the dark. The cells are then ready for flow analysis.
Mouse in vivo studies
Seven- to eight-week-old female NOD SCID gamma (NSG) mice (Jackson Laboratory) were subcutaneously injected with four million HeLa cells or half million HL60-BCL2 cells resuspended in a 50:50 mixture of cold PBS and Matrigel (GIBCO). After confirmation of engraftment, the mice were randomly assigned to six groups (n = 7 per group) and treated with drugs and/or NK cells as indicated in Figure 7A. The NK cells used for in vivo studies were generated and pre-activated following the same procedure as described in Methods: Human NK cell isolation and expansion. ABT-199 was prepared weekly in 10% ethanol, 30% polyethyleneglycol-400, and 60% phosal 50 propylene glycol. S63845 was formulated extemporaneously in 25 mM HCl, 20% 2-hydroxy propyl β-cyclo dextrin 20% (Fisher Scientifics). All drugs and IL-2 were administrated at the doses and schedules as described in Figure 7A. The width and length of the tumors were measured every two days (HL60-BCL2 model) or twice a week (HeLa model) using an electronic caliper. Tumor volume was calculated using the formula: (length × width2)/2. For ethical reasons, mice carrying tumors exceeding 2,000 mm3 were euthanized by CO2 asphyxiation after tumor sizes were measured and recorded. Tumor burden is represented as mean of tumor volume ± SEM over time (days). For the statistical analysis of differences in tumor volume between groups, a two-way ANOVA with repeated measures on day factor was performed. Log-rank test was used to statistically compare mouse survival curves of different groups.
Human T cell isolation and expansion
Blood mononuclear cells were isolated as described above. CD8+ T cells were then isolated by negative selection using the EasySep™ Human CD8+ T Cell Enrichment Kit (#19053, StemCell Technologies). Enriched T cells (purity > 90%) were then resuspended with RPMI medium supplemented with 5 mM Hepes, 2 mM Glutamax, 50 µg/ml Pen/Strep, 5 mM NEAA, 5 mM sodium pyruvate, 9% certified heat-inactivated FBS, 1% human A/B serum, 50 µM beta-mercaptoethanol, as well as 30 IU/mL of human IL-2 (Peprotech). Next, 1 mL of T cells (2 million/mL) were transferred into each well of a 48-well plate and stimulated with 2 million CD3/CD28 Dynabeads (#11131D, ThermoFisher Scientific) according to manufacturer’s protocol. After stimulation, cells were pooled into flasks. Half of the medium was replaced with fresh medium to keep the cell density between 0.5 – 4 million/mL. After expansion, T cell purity (CD3+CD8+) was > 97% as determined by flow cytometry analysis.
Transduction of T cells
Non-tissue culture-treated 24-well plates were coated overnight at 4°C with recombinant fibronectin fragment (RetroNectin; Takara) at 25 µg/mL in PBS. The following day, the RetroNection solution was replaced with 0.5 mL of sterile 2% BSA in PBS to block the plates for 30 min at room temperature. After a single wash with PBS, virus particles were added and then pelleted by centrifugation at 2,000 g for 2 hours at 32°C. The supernatant was gently removed, and the wells are washed with 500 µL PBS followed by adding 0.5 million T cells in 2 mL T cell medium supplemented with 10 µg/mL protamine sulfate. Next the plates were centrifuged at 500 g for 3 min and then incubated for 3 days. On the third day after transduction, the cells were pooled together, stained with HA-tag antibody (#901509, Biolegend), and sorted to purify TCR transduced population. After sorting, transduced T cells were cultured in IL-2 containing media (30 IU/mL) and split as necessary to maintain cell density between 0.5 and 4 million cells/mL.
Generation of NY-ESO-1 antigen-expressing cells
Lentiviral transduction was performed as described before (Pan et al., 2017). Briefly, lentivirus was prepared by co-transfection of log-phase HEK293T cells with an equimolar mix of transfer vector psPAX2, packaging plasmid pMD2.G, and NY-ESO-1 Ag-Luci-ZsGreen plasmid using jetPrime transfection reagent according to the manufacturer’s instructions (Polyplus). Lentiviral supernatants were harvested 48 hr after transfection by centrifugation (800 g, 10 min) at room temperature. The supernatant was then filtered through 0.45 mM surfactant-free cellulose acetate membranes to remove lentivirus-producing cells. Polybrene (Chemicon) was added to a final concentration of 8 mg/mL, and the virus stock was used immediately to infect cell lines. Exponentially growing cells were resuspended at a concentration of 0.5 million cells per mL of virus stock, transferred to 12-well tissue plates, and centrifuged for 45 min (1,300 g, 30°C). After adding one volume of fresh virus stock, the cells were centrifuged again and incubated in a tissue culture incubator (37°C, 5% CO2) for 1 hr. The cells were then washed twice with growth medium to remove the polybrene and returned to the tissue culture incubator. After two doubling times, infected cells were subjected to sorting for ZsGreen+ population.
Generation of NK conditioned medium
Pre-activated NK cells were cultured in a T175 flask with a starting density of 1 million/mL. After 3 days, the supernatant was collected and centrifuged at 1000g for 5 min to remove NK cells and cell debris. Then the conditioned medium was filtered using The Stericup™ vacuum filtration system (0.22 μM filter) from MilliporeSigma. The conditioned medium was then used to treat cancer cells on the same day of generation.
Transient Gene Knockdown by Accell siRNAs
Transient gene knockdown was conducted using Accell siRNA transfection method. Accell siRNAs, Accell siRNA delivery media, and Accell non-targeting control were all purchased from Dharmacon. Transfection was performed according to the manufacturer’s protocol. Briefly, log-phase cancer cells or pre-activated human primary NK cells (day 3) were collected by centrifugation at 1,000 g for 5 min. The pelleted cells were then resuspended in appropriate volume of Accell siRNA Delivery Media. Next, siRNAs were added to a final concentration of 1 μM and gently mixed. The cells were then incubated with Accell siRNAs at 37°C in a humidified atmosphere containing 5% CO2. After 48 hr incubation, regular growth media for different cell types were added back to half of the transfection volume. After another 24 h, cells were harvested for cytotoxicity assays and an aliquot was lysed as descried in Immunoblotting and Antibodies. Gene knockdown was validated by immunoblotting.
Quantitation and statistical analysis
Unless otherwise indicated, data represent the mean ± SEM of triplicate experiments. Statistical analyses were performed using Prism software v8.0 (GraphPad Software, La Jolla, CA, USA). For normally distributed data and comparisons between two groups, the significance was calculated using unpaired two-tailed Student’s t-tests. Comparisons between three or more groups were performed using ordinary one-way analysis of variance (ANOVA). Log-rank test was used to statistically compare mouse survival curves of different groups. Throughout the paper, significance was determined at the following cutoff points: not significant (ns), p >0.05, *p < 0.05, **p < 0.01, ***p < 0.001. A p-value < 0.05 was considered statistically significant.
Supplementary Material
Figure S3. Cell-cell contact is required for NK-mediated priming of cancer cells. Data related to Figure 3.
Mitochondrial priming of OCI-AML3 cells (A) and HeLa cells (B) after treatment with NK-conditioned medium (CM), NK cells (E:T = 1:2), or 2 mM EGTA + NK cells for 2 h. Mitochondrial priming is determined via BH3 profiling using BIM peptide. Conditioned medium did not increase overall priming of cancer cells. Interestingly, we observed a reduction in overall priming, likely caused by the nutrient-richer NK culture medium. The Ca2+ chelator EGTA abrogated NK-mediated increase of mitochondrial priming. Each tile represents one of three replicates of a certain treatment.
Figure S2. Data related to Figure 2.
(A and C) Immunoblot analysis of BAX and BAK in HeLa control and BAX/BAK double knockout (DKO) cells (A) and in paired SU-DHL6 and BBDL cells (C). β-Actin served as the loading control.
(B and D) HeLa-Ctrl and SU-DHL6 cells have functional machinery for mtApoptosis while HeLa-DKO and BBDL cells have impaired ones, as determined by their capacity to release cytochrome c from mitochondria after exposure to promiscuous BIM BH3 peptide for 45 minutes. Release of cytochrome c was measured as in BH3 profiling but using DMSO instead of BH3 peptides (see Methods for details).
(E) Apoptotic percentage and viable cell numbers of HeLa control and DKO cells after treatment with NK-92 MI cells at different E:T ratios for 16 h. Cell number was enumerated by absolute counting beads as described in Methods.
Data were presented as mean ± SEM of triplicate experiments.
Figure S1. Data related to Figure 1
(A and B) Gating strategy for annexin V and DAPI co-staining assays (A) and cytochrome c release assays (B).
(C-F) Primary NK cells induced loss of mitochondrial membrane potential (C), release of cytochrome c (D), activation of caspase-3 (E), and exposure of phosphatidylserine (F) in OCI-AML3 and HeLa cells. Cancer cells were treated with indicated E:T ratios and time points.
(G) Cytochrome c release induced by primary NK cell treatment (E:T = 1:2, 4 h) in different cancer cell lines (6/6 tested).
(H) Primary human NK and NK-92MI cells induced apoptosis of cancer cells within few hours. E:T = 1:2.
(I) The concentrations of neutralizing antibodies used in NK experiments (Figure S1K) can effectively block cell death induced by corresponding death ligands (HeLa cells, 24 h treatment).
(J) Death ligand neutralizing assays. OCI-AML3 (left) or HeLa (right) cells were treated with two different NK samples in the presence or absence of TNFα, Trail, or FasL neutralizing antibodies (1, 1, 2 μg/mL) singly or in combinations for 6 h (E:T = 1:2). NK cells were pre-treated with corresponding antibodies or isotype controls for 1 h before they were added. Statistics were calculated versus the arrowed bar (NK treatment alone).
(K) Cell death of HeLa control or caspase-8 KO cells after treatment with three different pre-activated NK samples (E:T = 1:2, 4 h).
(L) Immunoblots showing granzyme B (GZMB) knockdown by GZMB-targeting Accell siRNA in two primary pre-activated NK samples (72 h siRNA treatment, see Methods).
(M) Immunoblots showing BID (BID) knockdown by BID-targeting Accell siRNA in OCI-AML3 and HeLa cells (72 h siRNA treatment).
(N) The purity (% of CD3-CD56+ population) of used primary human NK samples. Primary NK cells were isolated from leukapheresis collars (see Methods). The purity was determined by flow cytometry on day 1 (immediately after isolation) and day 3 (after pre-activation for 3 days).
Cell death % was calculated as 100% − %AnxV−DAPI−. For bar and line graphs, data were presented as mean ± SEM of triplicate experiments. Statistical significance by student’s t test. *p < 0.05, **p < 0.01, ***p < 0.001, ns, nonsignificant.
Figure S4. Data related to Figure 5.
(A) Gating strategy for data in Figures 5A and S4B. Note that only Figures 5A and S4B gated on the CD3−CD56+ NK subpopulation in PBMCs, rather than using isolated NK cells.
(B) Sensitivity of CD3−CD56+ NK cell population in PBMCs to MCL-1 and BCL-XL inhibition as measured by annexin V staining assay (24 h treatment, four biological replicates).
(C) Apoptotic percentage of pre-activated NK cells after treatment with BCL-2i for 24, 48, and 96 h (two biological replicates).
(D) Low nM concentrations (e.g., 4 nM) of MCL-1i S63845 or BCL-2i ABT-199 effectively primed cancer cells for apoptosis induction. OCI-AML3 cells were treated with indicated doses of BCL-2i and MCL-1i combinations for 24 h. Each tile represents the mean of triplicate experiments.
For bar graphs (B and C), data were presented as mean ± SEM of triplicate experiments.
Figure S5. BH3 mimetic ABT-199 do not induce MICA/B expression or sensitize HUVECs, macrophages, or fibroblasts to NK killing. Data related to Figure 6.
(A) Histograms showing MICA/B expression after treatment with indicated BH3 mimetics (256 nM each) for 24 or 48h. The primary antibody used, 7C6-mIgG2a, simultaneously recognizes MICA and MICB.
(B) MICA/B expression of human macrophages, HUVECs, and non-transformed fibroblast cell lines CCD-8Lu or IMR-90 before or after treatment with indicated BH3 mimetics (256 nM, 24 h). Significance by student’s t test, ns, not significant.
(C-E) Combined effects of NK cells and BH3 mimetics on human macrophages, HUVECs, and non-transformed fibroblast cell lines CCD-8Lu or IMR-90. Cells were pre-treated with vehicle or indicated BH3 mimetics for 24 h followed by NK treatment in the presence or absence of BH3 mimetics (E:T = 1:2). To minimize the variability associated with cells from a single donor, we used primary HUVECs pooled from 10 donors. For fibroblasts, we used two non-transformed human cell lines CCD-8Lu or IMR-90. For macrophages, we pooled human macrophages from 3 healthy donors.
For bar graphs (B-E), data were presented as mean ± SEM of triplicate experiments.
Figure S6. ADCC-inducing antibodies, but not immune checkpoint blocking antibodies, prime cancer cells for mtApoptosis. Data related to Figure 6.
(A) Rituximab treatment (10 μg/mL, 24 h) significantly increased mitochondrial priming of two tested CD20+ SU-DHL4 and SU-DHL6 cells (lymphoma cell lines).
(B) Cetuximab treatment (10 μg/mL, 24 h) increased mitochondrial priming of EGFR-expressing HeLa cells but not in EGFR-expressing MDA-MD-231 cells.
(C) A summary of the targets of different FDA-approved antibodies used in Figure S6.
(D and E) Ipilimumab (CTLA-4i) and nivolumab (PD-1i) did not prime the two representative cell lines OCI-AML3 or HeLa cells for mtApoptosis (10 μg/mL, 24 h).
(F) Expression of immune checkpoint proteins PD-L1, PD-1, and CTLA-4 in 14 tested cancer cell lines as determined by flow cytometry analysis.
(G and H) Representative histogram plots showing the expression of PD-L1, PD-1, and CTLA-4 in HeLa, OCI-AML3, MDA-MB-231, and lung cancer cell lines H1975 and H460.
(I) PD-L1i atezolizumab treatment (10 μg/mL, 24 h) did not prime PD-L1+ MDA-MB-231, H1975, and H460 cells for mtApoptosis.
BH3 profiling results were generated using BIM peptides to determine the mitochondrial priming status of cancer cells in the presence or absence of different antibodies. Values following peptide names are used concentrations (µM). The presented peptide concentrations are the most sensitive doses in detecting changes in mitochondrial priming of a cancer cell line after different treatments.
Each tile represents one of three replicates of a certain treatment. Statistical significance was assessed by student’s t test. *p < 0.05, **p < 0.01, ***p < 0.001, ns, nonsignificant.
Figure S7. Targeting mtApoptosis by BH3 mimetics augments T cell-mediated killing. Data related to Figure 6.
(A) Sensitivity of isolated resting and pre-activated CD8+ T cells to different BH3 mimetics. T cells were treated with BCL-2i ABT-199, MCL-1i S63845, or BCL-XLi A-1331852 at indicated concentrations for 48 h.
(B) Heatmap of mitochondrial priming of OCI-AML3_NY-ESO-1 cells (ectopically overexpressing NY-ESO-1 antigen) before or after treatment with CD8+ T cells overexpressing NY-ESO-1 specific T cell receptor (E:T = 1:2). Each tile represents one data point (n = 3). Values following peptide names indicate concentrations (µM).
(C and D) NY-ESO-1 TCR-T cells synergized with BCL-2i ABT-199 or MCL-1i S63845 in inducing apoptosis and reducing live cell number of NY-ESO-1 expressing OCI-AML3 cells. Cells were treated with 256 nM ABT-199, S63845, TCR-T cells (E:T = 1:2), or different combinations for indicated time.
For bar graphs (A, C, and D), data were presented as mean ± SEM of triplicate experiments. Statistical significance was assessed by student’s t test. *p < 0.05, **p < 0.01, ***p < 0.001, ns, nonsignificant.
Highlights.
Mitochondrial readiness for apoptosis affects cancer cell sensitivity to NK cells
Pre-activated NK cells acquire resistance to BCL-2, MCL-1, and BCL-XL inhibitors
BH3 mimetics and NK cells synergize in killing cancer cells in vitro and in vivo
BH3 profiling of cancer cells identifies which BH3 mimetic augments NK killing
ACKNOWLEDGMENTS
Work by R.P., J.R. and A.L. was supported by the NIH through an NCI Outstanding Investigator Award R35 CA242427, R01 CA249062 and through P01 CA066996. K.W.W. was supported by NIH grants R01 CA238039, R01 CA251599, P01 CA163222 and P01 CA236749. D.P. was supported by a postdoctoral fellowship from the Cancer Research Institute (CRI). K.W.W. is a member of the Parker Institute for Cancer Immunotherapy (PICI) and the Ludwig Center at Harvard. Graphical abstract was created with BioRender.com.
Footnotes
Publisher's Disclaimer: This is a PDF file of an unedited manuscript that has been accepted for publication. As a service to our customers we are providing this early version of the manuscript. The manuscript will undergo copyediting, typesetting, and review of the resulting proof before it is published in its final form. Please note that during the production process errors may be discovered which could affect the content, and all legal disclaimers that apply to the journal pertain.
DECLARATION OF INTERESTS
A.L. has consulted for and has received research support from AbbVie, Novartis, and Astra-Zeneca. He is an equity holder and co-founder of Flash Therapeutics, and an advisor for Dialectic Therapeutics, Zentalis Pharmaceuticals, and Anji Onco. K.W.W. serves on the scientific advisory board of T-Scan Therapeutics, SQZ Biotech, Nextechinvest and receives sponsored research funding from Novartis. He is a co-founder of Immunitas, a biotech company. These activities are not related to the research reported in this publication. J.R. is a consultant for Zentalis Pharmaceuticals that has a license for BH3 profiling. The other authors have nothing to declare.
INCLUSION AND DIVERSITY
We worked to ensure sex balance in the selection of non-human subjects. While citing references scientifically relevant for this work, we also actively worked to promote gender balance in our reference list.
REFERENCES
- Aglietti RA, and Dueber EC (2017). Recent Insights into the Molecular Mechanisms Underlying Pyroptosis and Gasdermin Family Functions. Trends Immunol 38, 261–271. [DOI] [PubMed] [Google Scholar]
- Ashkenazi A, Fairbrother WJ, Leverson JD, and Souers AJ (2017). From basic apoptosis discoveries to advanced selective BCL-2 family inhibitors. Nat Rev Drug Discov 16, 273–284. [DOI] [PubMed] [Google Scholar]
- Bald T, Krummel MF, Smyth MJ, and Barry KC (2020). The NK cell-cancer cycle: advances and new challenges in NK cell-based immunotherapies. Nat Immunol 21, 835–847. [DOI] [PMC free article] [PubMed] [Google Scholar]
- Baysal H, De Pauw I, Zaryouh H, De Waele J, Peeters M, Pauwels P, Vermorken JB, Smits E, Lardon F, Jacobs J, et al. (2020). Cetuximab-induced natural killer cell cytotoxicity in head and neck squamous cell carcinoma cell lines: investigation of the role of cetuximab sensitivity and HPV status. Br J Cancer 123, 752–761. [DOI] [PMC free article] [PubMed] [Google Scholar]
- Beck RJ, Bijker DI, and Beltman JB (2020). Heterogeneous, delayed-onset killing by multiple-hitting T cells: Stochastic simulations to assess methods for analysis of imaging data. PLoS Comput Biol 16, e1007972. [DOI] [PMC free article] [PubMed] [Google Scholar]
- Callen E, Di Virgilio M, Kruhlak MJ, Nieto-Soler M, Wong N, Chen HT, Faryabi RB, Polato F, Santos M, Starnes LM, et al. (2013). 53BP1 mediates productive and mutagenic DNA repair through distinct phosphoprotein interactions. Cell 153, 1266–1280. [DOI] [PMC free article] [PubMed] [Google Scholar]
- Certo M, Del Gaizo Moore V, Nishino M, Wei G, Korsmeyer S, Armstrong SA, and Letai A (2006). Mitochondria primed by death signals determine cellular addiction to antiapoptotic BCL-2 family members. Cancer Cell 9, 351–365. [DOI] [PubMed] [Google Scholar]
- Childs RW, and Carlsten M (2015). Therapeutic approaches to enhance natural killer cell cytotoxicity against cancer: the force awakens. Nat Rev Drug Discov 14, 487–498. [DOI] [PubMed] [Google Scholar]
- Crinier A, Narni-Mancinelli E, Ugolini S, and Vivier E (2020). SnapShot: Natural Killer Cells. Cell 180, 1280–1280 e1281. [DOI] [PubMed] [Google Scholar]
- Dall’Ozzo S, Tartas S, Paintaud G, Cartron G, Colombat P, Bardos P, Watier H, and Thibault G (2004). Rituximab-dependent cytotoxicity by natural killer cells: influence of FCGR3A polymorphism on the concentration-effect relationship. Cancer Res 64, 4664–4669. [DOI] [PubMed] [Google Scholar]
- Del Gaizo Moore V, Brown JR, Certo M, Love TM, Novina CD, and Letai A (2007). Chronic lymphocytic leukemia requires BCL2 to sequester prodeath BIM, explaining sensitivity to BCL2 antagonist ABT-737. J Clin Invest 117, 112–121. [DOI] [PMC free article] [PubMed] [Google Scholar]
- Denais CM, Gilbert RM, Isermann P, McGregor AL, te Lindert M, Weigelin B, Davidson PM, Friedl P, Wolf K, and Lammerding J (2016). Nuclear envelope rupture and repair during cancer cell migration. Science 352, 353–358. [DOI] [PMC free article] [PubMed] [Google Scholar]
- Freeman AJ, Vervoort SJ, Ramsbottom KM, Kelly MJ, Michie J, Pijpers L, Johnstone RW, Kearney CJ, and Oliaro J (2019). Natural Killer Cells Suppress T Cell-Associated Tumor Immune Evasion. Cell Rep 28, 2784–2794 e2785. [DOI] [PubMed] [Google Scholar]
- Fujisaki H, Kakuda H, Shimasaki N, Imai C, Ma J, Lockey T, Eldridge P, Leung WH, and Campana D (2009). Expansion of highly cytotoxic human natural killer cells for cancer cell therapy. Cancer Res 69, 4010–4017. [DOI] [PMC free article] [PubMed] [Google Scholar]
- Galon J, and Bruni D (2019). Approaches to treat immune hot, altered and cold tumours with combination immunotherapies. Nat Rev Drug Discov 18, 197–218. [DOI] [PubMed] [Google Scholar]
- Goping IS, Barry M, Liston P, Sawchuk T, Constantinescu G, Michalak KM, Shostak I, Roberts DL, Hunter AM, Korneluk R, et al. (2003). Granzyme B-induced apoptosis requires both direct caspase activation and relief of caspase inhibition. Immunity 18, 355–365. [DOI] [PubMed] [Google Scholar]
- Guillerey C, Huntington ND, and Smyth MJ (2016). Targeting natural killer cells in cancer immunotherapy. Nat Immunol 17, 1025–1036. [DOI] [PubMed] [Google Scholar]
- Halle S, Keyser KA, Stahl FR, Busche A, Marquardt A, Zheng X, Galla M, Heissmeyer V, Heller K, Boelter J, et al. (2016). In Vivo Killing Capacity of Cytotoxic T Cells Is Limited and Involves Dynamic Interactions and T Cell Cooperativity. Immunity 44, 233–245. [DOI] [PMC free article] [PubMed] [Google Scholar]
- Hata AN, Engelman JA, and Faber AC (2015). The BCL2 Family: Key Mediators of the Apoptotic Response to Targeted Anticancer Therapeutics. Cancer Discov 5, 475–487. [DOI] [PMC free article] [PubMed] [Google Scholar]
- Humphries F, Shmuel-Galia L, Ketelut-Carneiro N, Li S, Wang B, Nemmara VV, Wilson R, Jiang Z, Khalighinejad F, Muneeruddin K, et al. (2020). Succination inactivates gasdermin D and blocks pyroptosis. Science 369, 1633–1637. [DOI] [PMC free article] [PubMed] [Google Scholar]
- Huntington ND, Cursons J, and Rautela J (2020). The cancer-natural killer cell immunity cycle. Nat Rev Cancer 20, 437–454. [DOI] [PubMed] [Google Scholar]
- James AM, Hsu HT, Dongre P, Uzel G, Mace EM, Banerjee PP, and Orange JS (2013). Rapid activation receptor- or IL-2-induced lytic granule convergence in human natural killer cells requires Src, but not downstream signaling. Blood 121, 2627–2637. [DOI] [PMC free article] [PubMed] [Google Scholar]
- June CH, O’Connor RS, Kawalekar OU, Ghassemi S, and Milone MC (2018). CAR T cell immunotherapy for human cancer. Science 359, 1361–1365. [DOI] [PubMed] [Google Scholar]
- Kimura H, Sakai K, Arao T, Shimoyama T, Tamura T, and Nishio K (2007). Antibody-dependent cellular cytotoxicity of cetuximab against tumor cells with wild-type or mutant epidermal growth factor receptor. Cancer Sci 98, 1275–1280. [DOI] [PMC free article] [PubMed] [Google Scholar]
- Kundu S, Gurney M, and O’Dwyer M (2021). Generating natural killer cells for adoptive transfer: expanding horizons. Cytotherapy [DOI] [PubMed] [Google Scholar]
- Kurai J, Chikumi H, Hashimoto K, Yamaguchi K, Yamasaki A, Sako T, Touge H, Makino H, Takata M, Miyata M, et al. (2007). Antibody-dependent cellular cytotoxicity mediated by cetuximab against lung cancer cell lines. Clin Cancer Res 13, 1552–1561. [DOI] [PubMed] [Google Scholar]
- Lanier LL (2008). Up on the tightrope: natural killer cell activation and inhibition. Nat Immunol 9, 495–502. [DOI] [PMC free article] [PubMed] [Google Scholar]
- Letai A (2017). Functional precision cancer medicine-moving beyond pure genomics. Nature medicine 23, 1028–1035. [DOI] [PubMed] [Google Scholar]
- Letai AG (2008). Diagnosing and exploiting cancer’s addiction to blocks in apoptosis. Nat Rev Cancer 8, 121–132. [DOI] [PubMed] [Google Scholar]
- Lopez-Soto A, Gonzalez S, Smyth MJ, and Galluzzi L (2017). Control of Metastasis by NK Cells. Cancer Cell 32, 135–154. [DOI] [PubMed] [Google Scholar]
- Lord SJ, Rajotte RV, Korbutt GS, and Bleackley RC (2003). Granzyme B: a natural born killer. Immunol Rev 193, 31–38. [DOI] [PubMed] [Google Scholar]
- Lutz CT, Karapetyan A, Al-Attar A, Shelton BJ, Holt KJ, Tucker JH, and Presnell SR (2011). Human NK cells proliferate and die in vivo more rapidly than T cells in healthy young and elderly adults. J Immunol 186, 4590–4598. [DOI] [PMC free article] [PubMed] [Google Scholar]
- Miller JS, Soignier Y, Panoskaltsis-Mortari A, McNearney SA, Yun GH, Fautsch SK, McKenna D, Le C, Defor TE, Burns LJ, et al. (2005). Successful adoptive transfer and in vivo expansion of human haploidentical NK cells in patients with cancer. Blood 105, 3051–3057. [DOI] [PubMed] [Google Scholar]
- Montero J, Sarosiek KA, DeAngelo JD, Maertens O, Ryan J, Ercan D, Piao H, Horowitz NS, Berkowitz RS, Matulonis U, et al. (2015). Drug-induced death signaling strategy rapidly predicts cancer response to chemotherapy. Cell 160, 977–989. [DOI] [PMC free article] [PubMed] [Google Scholar]
- Morvan MG, and Lanier LL (2016). NK cells and cancer: you can teach innate cells new tricks. Nat Rev Cancer 16, 7–19. [DOI] [PubMed] [Google Scholar]
- Myers JA, and Miller JS (2021). Exploring the NK cell platform for cancer immunotherapy. Nat Rev Clin Oncol 18, 85–100. [DOI] [PMC free article] [PubMed] [Google Scholar]
- Nayyar G, Chu Y, and Cairo MS (2019). Overcoming Resistance to Natural Killer Cell Based Immunotherapies for Solid Tumors. Front Oncol 9, 51. [DOI] [PMC free article] [PubMed] [Google Scholar]
- Ni Chonghaile T, Sarosiek KA, Vo TT, Ryan JA, Tammareddi A, Moore Vdel G, Deng J, Anderson KC, Richardson P, Tai YT, et al. (2011). Pretreatment mitochondrial priming correlates with clinical response to cytotoxic chemotherapy. Science 334, 1129–1133. [DOI] [PMC free article] [PubMed] [Google Scholar]
- Pan R, Hogdal LJ, Benito JM, Bucci D, Han L, Borthakur G, Cortes J, DeAngelo DJ, Debose L, Mu H, et al. (2014). Selective BCL-2 inhibition by ABT-199 causes on-target cell death in acute myeloid leukemia. Cancer Discov 4, 362–375. [DOI] [PMC free article] [PubMed] [Google Scholar]
- Pan R, Ruvolo V, Mu H, Leverson JD, Nichols G, Reed JC, Konopleva M, and Andreeff M (2017). Synthetic Lethality of Combined Bcl-2 Inhibition and p53 Activation in AML: Mechanisms and Superior Antileukemic Efficacy. Cancer Cell 32, 748–760 e746. [DOI] [PMC free article] [PubMed] [Google Scholar]
- Pinkoski MJ, Waterhouse NJ, Heibein JA, Wolf BB, Kuwana T, Goldstein JC, Newmeyer DD, Bleackley RC, and Green DR (2001). Granzyme B-mediated apoptosis proceeds predominantly through a Bcl-2-inhibitable mitochondrial pathway. J Biol Chem 276, 12060–12067. [DOI] [PubMed] [Google Scholar]
- Rapoport AP, Stadtmauer EA, Binder-Scholl GK, Goloubeva O, Vogl DT, Lacey SF, Badros AZ, Garfall A, Weiss B, Finklestein J, et al. (2015). NY-ESO-1-specific TCR-engineered T cells mediate sustained antigen-specific antitumor effects in myeloma. Nature medicine 21, 914–921. [DOI] [PMC free article] [PubMed] [Google Scholar]
- Raulet DH, and Guerra N (2009). Oncogenic stress sensed by the immune system: role of natural killer cell receptors. Nat Rev Immunol 9, 568–580. [DOI] [PMC free article] [PubMed] [Google Scholar]
- Ribas A, and Wolchok JD (2018). Cancer immunotherapy using checkpoint blockade. Science 359, 1350–1355. [DOI] [PMC free article] [PubMed] [Google Scholar]
- Riegman M, Sagie L, Galed C, Levin T, Steinberg N, Dixon SJ, Wiesner U, Bradbury MS, Niethammer P, Zaritsky A, et al. (2020). Ferroptosis occurs through an osmotic mechanism and propagates independently of cell rupture. Nat Cell Biol 22, 1042–1048. [DOI] [PMC free article] [PubMed] [Google Scholar]
- Romee R, Rosario M, Berrien-Elliott MM, Wagner JA, Jewell BA, Schappe T, Leong JW, Abdel-Latif S, Schneider SE, Willey S, et al. (2016). Cytokine-induced memory-like natural killer cells exhibit enhanced responses against myeloid leukemia. Sci Transl Med 8, 357ra123. [DOI] [PMC free article] [PubMed] [Google Scholar]
- Rosenberg SA, and Restifo NP (2015). Adoptive cell transfer as personalized immunotherapy for human cancer. Science 348, 62–68. [DOI] [PMC free article] [PubMed] [Google Scholar]
- Rubnitz JE, Inaba H, Ribeiro RC, Pounds S, Rooney B, Bell T, Pui CH, and Leung W (2010). NKAML: a pilot study to determine the safety and feasibility of haploidentical natural killer cell transplantation in childhood acute myeloid leukemia. J Clin Oncol 28, 955–959. [DOI] [PMC free article] [PubMed] [Google Scholar]
- Ruggeri L, Capanni M, Urbani E, Perruccio K, Shlomchik WD, Tosti A, Posati S, Rogaia D, Frassoni F, Aversa F, et al. (2002). Effectiveness of donor natural killer cell alloreactivity in mismatched hematopoietic transplants. Science 295, 2097–2100. [DOI] [PubMed] [Google Scholar]
- Ryan J, Montero J, Rocco J, and Letai A (2016). iBH3: simple, fixable BH3 profiling to determine apoptotic priming in primary tissue by flow cytometry. Biol Chem 397, 671–678. [DOI] [PubMed] [Google Scholar]
- Ryan JA, Brunelle JK, and Letai A (2010). Heightened mitochondrial priming is the basis for apoptotic hypersensitivity of CD4+ CD8+ thymocytes. Proc Natl Acad Sci U S A 107, 12895–12900. [DOI] [PMC free article] [PubMed] [Google Scholar]
- Sharma P, and Allison JP (2020). Dissecting the mechanisms of immune checkpoint therapy. Nat Rev Immunol 20, 75–76. [DOI] [PubMed] [Google Scholar]
- Shi J, Gao W, and Shao F (2017). Pyroptosis: Gasdermin-Mediated Programmed Necrotic Cell Death. Trends Biochem Sci 42, 245–254. [DOI] [PubMed] [Google Scholar]
- Shimasaki N, Jain A, and Campana D (2020). NK cells for cancer immunotherapy. Nat Rev Drug Discov 19, 200–218. [DOI] [PubMed] [Google Scholar]
- Singh R, Letai A, and Sarosiek K (2019). Regulation of apoptosis in health and disease: the balancing act of BCL-2 family proteins. Nat Rev Mol Cell Biol 20, 175–193. [DOI] [PMC free article] [PubMed] [Google Scholar]
- Spencer SL, and Sorger PK (2011). Measuring and modeling apoptosis in single cells. Cell 144, 926–939. [DOI] [PMC free article] [PubMed] [Google Scholar]
- Stockwell BR, Friedmann Angeli JP, Bayir H, Bush AI, Conrad M, Dixon SJ, Fulda S, Gascon S, Hatzios SK, Kagan VE, et al. (2017). Ferroptosis: A Regulated Cell Death Nexus Linking Metabolism, Redox Biology, and Disease. Cell 171, 273–285. [DOI] [PMC free article] [PubMed] [Google Scholar]
- Sutton VR, Wowk ME, Cancilla M, and Trapani JA (2003). Caspase activation by granzyme B is indirect, and caspase autoprocessing requires the release of proapoptotic mitochondrial factors. Immunity 18, 319–329. [DOI] [PubMed] [Google Scholar]
- Villalobos-Ortiz M, Ryan J, Mashaka TN, Opferman JT, and Letai A (2019). BH3 profiling discriminates on-target small molecule BH3 mimetics from putative mimetics. Cell Death Differ [DOI] [PMC free article] [PubMed] [Google Scholar]
- Vo TT, Ryan J, Carrasco R, Neuberg D, Rossi DJ, Stone RM, Deangelo DJ, Frattini MG, and Letai A (2012). Relative mitochondrial priming of myeloblasts and normal HSCs determines chemotherapeutic success in AML. Cell 151, 344–355. [DOI] [PMC free article] [PubMed] [Google Scholar]
- Waldman AD, Fritz JM, and Lenardo MJ (2020). A guide to cancer immunotherapy: from T cell basic science to clinical practice. Nat Rev Immunol 20, 651–668. [DOI] [PMC free article] [PubMed] [Google Scholar]
- Waterhouse NJ, Sedelies KA, Browne KA, Wowk ME, Newbold A, Sutton VR, Clarke CJ, Oliaro J, Lindemann RK, Bird PI, et al. (2005). A central role for Bid in granzyme B-induced apoptosis. J Biol Chem 280, 4476–4482. [DOI] [PubMed] [Google Scholar]
- Wei MC, Lindsten T, Mootha VK, Weiler S, Gross A, Ashiya M, Thompson CB, and Korsmeyer SJ (2000). tBID, a membrane-targeted death ligand, oligomerizes BAK to release cytochrome c. Genes Dev 14, 2060–2071. [PMC free article] [PubMed] [Google Scholar]
- Wei MC, Zong WX, Cheng EH, Lindsten T, Panoutsakopoulou V, Ross AJ, Roth KA, MacGregor GR, Thompson CB, and Korsmeyer SJ (2001). Proapoptotic BAX and BAK: a requisite gateway to mitochondrial dysfunction and death. Science 292, 727–730. [DOI] [PMC free article] [PubMed] [Google Scholar]
- Weigelin B, den Boer AT, Wagena E, Broen K, Dolstra H, de Boer RJ, Figdor CG, Textor J, and Friedl P (2020). Cancer cell elimination by cytotoxic T cell cooperation and additive damage. BioRxiv [DOI] [PMC free article] [PubMed] [Google Scholar]
- Weigelin B, den Boer AT, Wagena E, Broen K, Dolstra H, de Boer RJ, Figdor CG, Textor J, and Friedl P (2021). Cytotoxic T cells are able to efficiently eliminate cancer cells by additive cytotoxicity. Nat Commun 12, 5217. [DOI] [PMC free article] [PubMed] [Google Scholar]
- Weinlich R, Oberst A, Beere HM, and Green DR (2017). Necroptosis in development, inflammation and disease. Nat Rev Mol Cell Biol 18, 127–136. [DOI] [PubMed] [Google Scholar]
Associated Data
This section collects any data citations, data availability statements, or supplementary materials included in this article.
Supplementary Materials
Figure S3. Cell-cell contact is required for NK-mediated priming of cancer cells. Data related to Figure 3.
Mitochondrial priming of OCI-AML3 cells (A) and HeLa cells (B) after treatment with NK-conditioned medium (CM), NK cells (E:T = 1:2), or 2 mM EGTA + NK cells for 2 h. Mitochondrial priming is determined via BH3 profiling using BIM peptide. Conditioned medium did not increase overall priming of cancer cells. Interestingly, we observed a reduction in overall priming, likely caused by the nutrient-richer NK culture medium. The Ca2+ chelator EGTA abrogated NK-mediated increase of mitochondrial priming. Each tile represents one of three replicates of a certain treatment.
Figure S2. Data related to Figure 2.
(A and C) Immunoblot analysis of BAX and BAK in HeLa control and BAX/BAK double knockout (DKO) cells (A) and in paired SU-DHL6 and BBDL cells (C). β-Actin served as the loading control.
(B and D) HeLa-Ctrl and SU-DHL6 cells have functional machinery for mtApoptosis while HeLa-DKO and BBDL cells have impaired ones, as determined by their capacity to release cytochrome c from mitochondria after exposure to promiscuous BIM BH3 peptide for 45 minutes. Release of cytochrome c was measured as in BH3 profiling but using DMSO instead of BH3 peptides (see Methods for details).
(E) Apoptotic percentage and viable cell numbers of HeLa control and DKO cells after treatment with NK-92 MI cells at different E:T ratios for 16 h. Cell number was enumerated by absolute counting beads as described in Methods.
Data were presented as mean ± SEM of triplicate experiments.
Figure S1. Data related to Figure 1
(A and B) Gating strategy for annexin V and DAPI co-staining assays (A) and cytochrome c release assays (B).
(C-F) Primary NK cells induced loss of mitochondrial membrane potential (C), release of cytochrome c (D), activation of caspase-3 (E), and exposure of phosphatidylserine (F) in OCI-AML3 and HeLa cells. Cancer cells were treated with indicated E:T ratios and time points.
(G) Cytochrome c release induced by primary NK cell treatment (E:T = 1:2, 4 h) in different cancer cell lines (6/6 tested).
(H) Primary human NK and NK-92MI cells induced apoptosis of cancer cells within few hours. E:T = 1:2.
(I) The concentrations of neutralizing antibodies used in NK experiments (Figure S1K) can effectively block cell death induced by corresponding death ligands (HeLa cells, 24 h treatment).
(J) Death ligand neutralizing assays. OCI-AML3 (left) or HeLa (right) cells were treated with two different NK samples in the presence or absence of TNFα, Trail, or FasL neutralizing antibodies (1, 1, 2 μg/mL) singly or in combinations for 6 h (E:T = 1:2). NK cells were pre-treated with corresponding antibodies or isotype controls for 1 h before they were added. Statistics were calculated versus the arrowed bar (NK treatment alone).
(K) Cell death of HeLa control or caspase-8 KO cells after treatment with three different pre-activated NK samples (E:T = 1:2, 4 h).
(L) Immunoblots showing granzyme B (GZMB) knockdown by GZMB-targeting Accell siRNA in two primary pre-activated NK samples (72 h siRNA treatment, see Methods).
(M) Immunoblots showing BID (BID) knockdown by BID-targeting Accell siRNA in OCI-AML3 and HeLa cells (72 h siRNA treatment).
(N) The purity (% of CD3-CD56+ population) of used primary human NK samples. Primary NK cells were isolated from leukapheresis collars (see Methods). The purity was determined by flow cytometry on day 1 (immediately after isolation) and day 3 (after pre-activation for 3 days).
Cell death % was calculated as 100% − %AnxV−DAPI−. For bar and line graphs, data were presented as mean ± SEM of triplicate experiments. Statistical significance by student’s t test. *p < 0.05, **p < 0.01, ***p < 0.001, ns, nonsignificant.
Figure S4. Data related to Figure 5.
(A) Gating strategy for data in Figures 5A and S4B. Note that only Figures 5A and S4B gated on the CD3−CD56+ NK subpopulation in PBMCs, rather than using isolated NK cells.
(B) Sensitivity of CD3−CD56+ NK cell population in PBMCs to MCL-1 and BCL-XL inhibition as measured by annexin V staining assay (24 h treatment, four biological replicates).
(C) Apoptotic percentage of pre-activated NK cells after treatment with BCL-2i for 24, 48, and 96 h (two biological replicates).
(D) Low nM concentrations (e.g., 4 nM) of MCL-1i S63845 or BCL-2i ABT-199 effectively primed cancer cells for apoptosis induction. OCI-AML3 cells were treated with indicated doses of BCL-2i and MCL-1i combinations for 24 h. Each tile represents the mean of triplicate experiments.
For bar graphs (B and C), data were presented as mean ± SEM of triplicate experiments.
Figure S5. BH3 mimetic ABT-199 do not induce MICA/B expression or sensitize HUVECs, macrophages, or fibroblasts to NK killing. Data related to Figure 6.
(A) Histograms showing MICA/B expression after treatment with indicated BH3 mimetics (256 nM each) for 24 or 48h. The primary antibody used, 7C6-mIgG2a, simultaneously recognizes MICA and MICB.
(B) MICA/B expression of human macrophages, HUVECs, and non-transformed fibroblast cell lines CCD-8Lu or IMR-90 before or after treatment with indicated BH3 mimetics (256 nM, 24 h). Significance by student’s t test, ns, not significant.
(C-E) Combined effects of NK cells and BH3 mimetics on human macrophages, HUVECs, and non-transformed fibroblast cell lines CCD-8Lu or IMR-90. Cells were pre-treated with vehicle or indicated BH3 mimetics for 24 h followed by NK treatment in the presence or absence of BH3 mimetics (E:T = 1:2). To minimize the variability associated with cells from a single donor, we used primary HUVECs pooled from 10 donors. For fibroblasts, we used two non-transformed human cell lines CCD-8Lu or IMR-90. For macrophages, we pooled human macrophages from 3 healthy donors.
For bar graphs (B-E), data were presented as mean ± SEM of triplicate experiments.
Figure S6. ADCC-inducing antibodies, but not immune checkpoint blocking antibodies, prime cancer cells for mtApoptosis. Data related to Figure 6.
(A) Rituximab treatment (10 μg/mL, 24 h) significantly increased mitochondrial priming of two tested CD20+ SU-DHL4 and SU-DHL6 cells (lymphoma cell lines).
(B) Cetuximab treatment (10 μg/mL, 24 h) increased mitochondrial priming of EGFR-expressing HeLa cells but not in EGFR-expressing MDA-MD-231 cells.
(C) A summary of the targets of different FDA-approved antibodies used in Figure S6.
(D and E) Ipilimumab (CTLA-4i) and nivolumab (PD-1i) did not prime the two representative cell lines OCI-AML3 or HeLa cells for mtApoptosis (10 μg/mL, 24 h).
(F) Expression of immune checkpoint proteins PD-L1, PD-1, and CTLA-4 in 14 tested cancer cell lines as determined by flow cytometry analysis.
(G and H) Representative histogram plots showing the expression of PD-L1, PD-1, and CTLA-4 in HeLa, OCI-AML3, MDA-MB-231, and lung cancer cell lines H1975 and H460.
(I) PD-L1i atezolizumab treatment (10 μg/mL, 24 h) did not prime PD-L1+ MDA-MB-231, H1975, and H460 cells for mtApoptosis.
BH3 profiling results were generated using BIM peptides to determine the mitochondrial priming status of cancer cells in the presence or absence of different antibodies. Values following peptide names are used concentrations (µM). The presented peptide concentrations are the most sensitive doses in detecting changes in mitochondrial priming of a cancer cell line after different treatments.
Each tile represents one of three replicates of a certain treatment. Statistical significance was assessed by student’s t test. *p < 0.05, **p < 0.01, ***p < 0.001, ns, nonsignificant.
Figure S7. Targeting mtApoptosis by BH3 mimetics augments T cell-mediated killing. Data related to Figure 6.
(A) Sensitivity of isolated resting and pre-activated CD8+ T cells to different BH3 mimetics. T cells were treated with BCL-2i ABT-199, MCL-1i S63845, or BCL-XLi A-1331852 at indicated concentrations for 48 h.
(B) Heatmap of mitochondrial priming of OCI-AML3_NY-ESO-1 cells (ectopically overexpressing NY-ESO-1 antigen) before or after treatment with CD8+ T cells overexpressing NY-ESO-1 specific T cell receptor (E:T = 1:2). Each tile represents one data point (n = 3). Values following peptide names indicate concentrations (µM).
(C and D) NY-ESO-1 TCR-T cells synergized with BCL-2i ABT-199 or MCL-1i S63845 in inducing apoptosis and reducing live cell number of NY-ESO-1 expressing OCI-AML3 cells. Cells were treated with 256 nM ABT-199, S63845, TCR-T cells (E:T = 1:2), or different combinations for indicated time.
For bar graphs (A, C, and D), data were presented as mean ± SEM of triplicate experiments. Statistical significance was assessed by student’s t test. *p < 0.05, **p < 0.01, ***p < 0.001, ns, nonsignificant.
Data Availability Statement
This study did not generate datasets or code.