Abstract
Respiratory syncytial virus (RSV) causes respiratory illness in children, immunosuppressed individuals and the elderly. However, the viral factors influencing the clinical outcome of RSV infections remain poorly defined. Defective viral genomes (DVGs) can suppress virus replication by competing for viral proteins and by stimulating antiviral immunity. We studied the association between detection of DVGs of the copy-back type and disease severity in three RSV A-confirmed cohorts. In hospitalized children, detection of DVGs in respiratory samples at or around the time of admission associated strongly with more severe disease, higher viral load and a stronger pro-inflammatory response. Interestingly, in experimentally infected adults, the presence of DVGs in respiratory secretions differentially associated with RSV disease severity depending on when DVGs were detected. Detection of DVGs early after infection associated with low viral loads and mild disease, whereas detection of DVGs late after infection, especially if DVGs were present for prolonged periods, associated with high viral loads and severe disease. Taken together, we demonstrate that the kinetics of DVG accumulation and duration could predict clinical outcome of RSV A infection in humans, and thus could be used as a prognostic tool to identify patients at risk of worse clinical disease.
Respiratory syncytial virus (RSV) infects all children before the age of two and leads to a wide spectrum of disease severity1. RSV accounts for nearly one-third of severe pneumonia cases in children under the age of five2 and is also an important cause of severe respiratory illness in the elderly and in immunosuppressed patients3. In 2015, 27,300 hospital deaths globally were due to RSV in children4. With the exception of palivizumab, a postnatal prophylaxis for high-risk patients5,6, there are no treatments or vaccines to prevent RSV infection. Although there are well-defined high-risk groups and host genetic factors linked to severe disease7–12, viral determinants of disease outcome are less defined and controversial10,13–20. In this study, we demonstrate that defective viral genomes (DVGs) are viral determinants for RSV disease severity and that detection of DVGs at different stages of infection could be used to identify patients at risk of developing severe disease.
Defective viral genomes of the copy-back type (cbDVGs) are produced during the replication of negative-sense single-stranded RNA viruses, including RSV21,22. cbDVGs are drastically truncated and rearranged viral genomes that are generated when the viral polymerase detaches from the template at a ‘break point’ and resumes elongation at a downstream ‘rejoin point’ by copying the 5′-end of the nascent strand23,24. This replication event results in a shorter viral genome with a theoretical hairpin-loop structure with complementary ends25. cbDVGs generated from the 5′-end of the virus cannot be transcribed to produce the proteins necessary for replication and require complementation with a helper virus to complete a replication cycle26. cbDVGs impact the course of infection by interfering with replication of the standard virus via competition for essential viral proteins27–29 and by strongly stimulating the host antiviral response that controls virus replication and spread21,22,30,31.
We previously reported detection of cbDVGs in respiratory secretions from some RSV-infected paediatric patients and found a positive correlation between detection of cbDVGs and the expression of antiviral genes22. In addition, we showed that during ex vivo RSV infection of explanted human lung tissues, the earlier cbDVGs are detected, the stronger the induction of antiviral responses and the greater the reduction in standard viral replication22. From these studies we hypothesized that the kinetics of cbDVGs’ appearance in patients impacts disease severity. Here, we tested this hypothesis by correlating the presence of cbDVGs with disease severity scores and viral loads of RSV-infected individuals, including hospitalized children, non-hospitalized children and experimentally infected adults who were followed longitudinally. Overall, we observed that the impact of cbDVGs on disease severity is determined by the kinetics of their appearance. Early appearance of cbDVGs after infection results in low viral loads and mild disease, whereas late or prolonged detection of cbDVGs associates with more severe disease. These data indicate that cbDVGs detection serves as a prognostic tool to identify hospitalized patients who are at high risk for longer hospitalization and admission to the intensive care unit (ICU).
Results
cbDVG detection by polymerase chain reaction is a sensitive method for screening respiratory secretions.
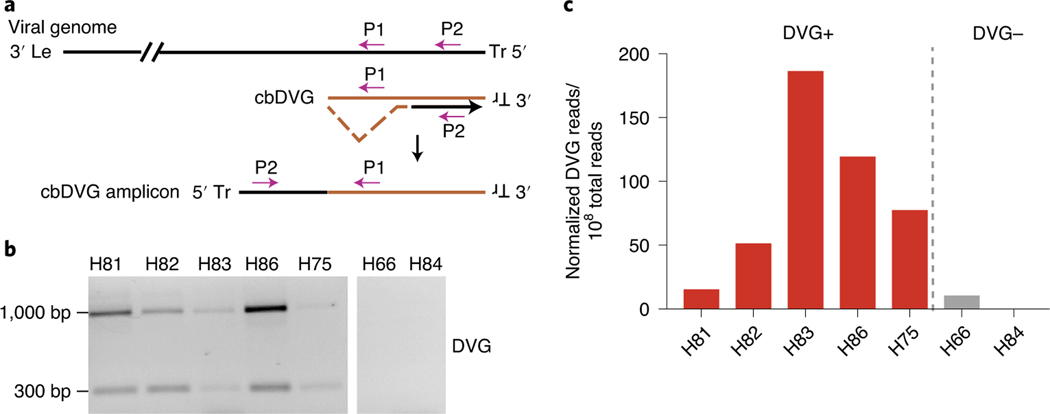
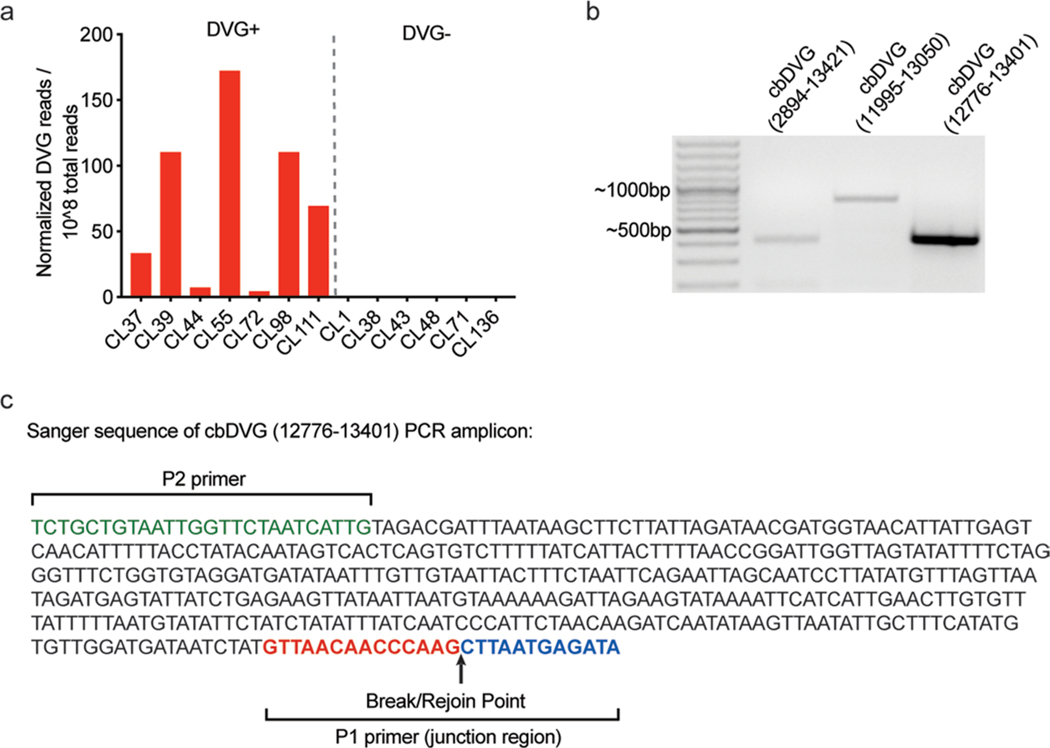
We developed a polymerase chain reaction (PCR) assay to screen for the presence of cbDVGs in respiratory secretions from RSV-infected subjects22. Because of the directionality of the primers, this PCR can distinguish cbDVGs from full-length viral genomes (P1 and P2, Fig. 1a). Controls demonstrating that this PCR does not produce amplicons from the full-length viral genome were published previously22. To establish the sensitivity of and validate our PCR method for the identification of cbDVG+ respiratory secretions, we selected seven samples collected from RSV A-infected patients in a previous study32 and analysed them using PCR (Fig. 1b) and RNA sequencing (RNA-seq) (Fig. 1c). To identify cbDVGs from RNA-seq data, we used the Viral Opensource DVG Key Algorithm (VODKA), that can impartially and specifically identify all cbDVG reads that align to junction sequences, a unique cbDVG region where break point and rejoin point are connected32. Consistent with the PCR results, the five samples that tested positive for cbDVGs by PCR had more cbDVG reads in RNA-seq than the two samples that tested negative (Fig. 1c). Both methods were also consistent among an additional 13 samples from Cohort 1, which is described in detail in the next section (Extended Data Fig. 1a). Based on these data, we established that our PCR method can detect cbDVGs in samples that have as low as 15 cbDVGs junction reads per 108 total reads. Three specific cbDVG species identified by VODKA were additionally confirmed by PCR using specific primers targeting unique cbDVG junction regions (Extended Data Fig. 1b,c). Therefore, our PCR approach serves as a useful binary tool to indicate presence or absence of cbDVGs in clinical samples.
Fig. 1 |. cbDVg screening methods and sensitivity.
a, Scheme of the PCR strategy for cbDVG detection. Le: leader sequence on the 3′-untranslated region (UTR) of the viral genome; Tr: trailer sequence on the 5′ UTR of the viral genome; P1: specific primer used in both reverse transcription and PCR; P2: specific primer used only during PCR. b, Representative PCR results for seven paediatric samples. Five cbDVG-positive and two cbDVG-negative samples are shown. c, Graph of cbDVG reads normalized to 108 total reads obtained from our RNA-seq/VODKA pipeline.
cbDVG+ hospitalized paediatric patients have a higher viral load and worse clinical outcomes than cbDVG−patients.
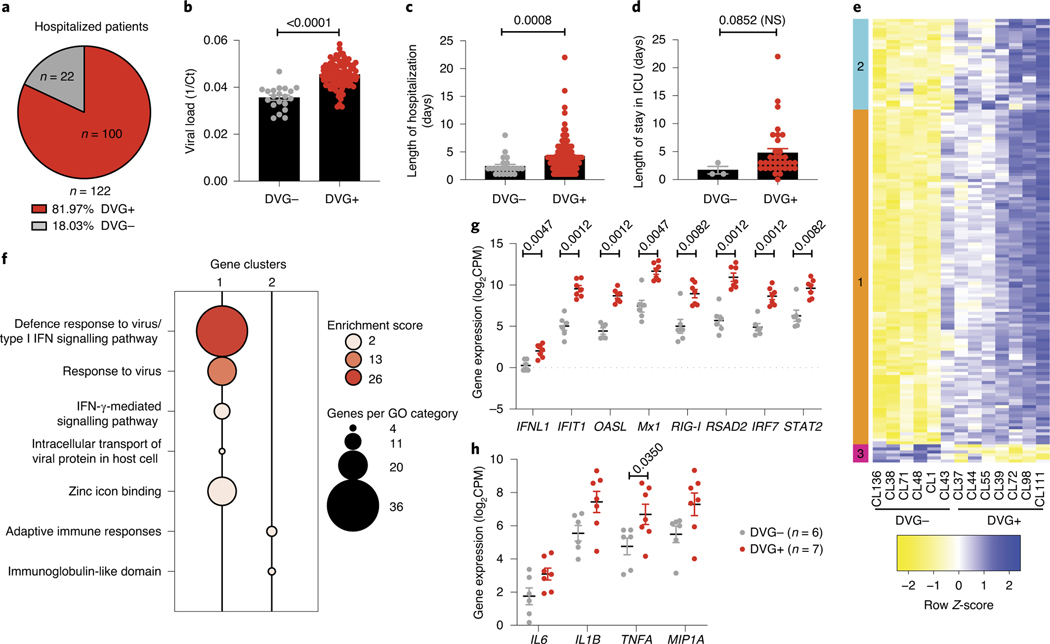
To examine the association between cbDVG presence and clinical outcomes in hospitalized children, we used banked nasal washes obtained from an RSV A-confirmed cohort of 122 hospitalized paediatric patients from the Children’s Hospital of Philadelphia (Cohort 1, Table 1). From this cohort we identified 100 patients (81.97%) as cbDVG positive (DVG+) by PCR (Fig. 2a, Table 1). Representative gel pictures are shown in Extended Data Fig. 2a. Viral load was estimated based on the cycle threshold (Ct) value obtained from quantitative polymerase chain reaction (qPCR) targeting the RSV nucleoprotein (N) gene (Fig. 2b). Disease severity was determined based on length of hospitalization as a primary outcome (Fig. 2c) and length of stay in ICU as a secondary outcome (Fig. 2d). We observed that cbDVG+ patients had significantly higher viral loads and longer hospitalizations than cbDVG−patients (Fig. 2b,c). The same trend was observed in regard to their length of stay in the ICU, although statistical significance was not reached as only three cbDVG−patients were admitted to the ICU limiting statistical power (Fig. 2d). These results indicate that detection of cbDVGs in respiratory secretions from RSV-infected hospitalized paediatric patients associates with higher viral loads and more severe disease outcomes.
Table 1 |.
Demographic, viral data and clinical data of three cohorts
| Total | DVG− | DVG+ | P value | |
|---|---|---|---|---|
| Cohort 1 | ||||
| Number of patients | 122 | 22 | 100 | NA |
| Median age in days (range) | 145.5 (30–714) | 302.5 (42–714) | 116 (30–683) | 0.0052 |
| Sex, M:F | 64:58 | 16:6 | 48:52 | 0.0355 |
| Median viral load Ct value (IQR) | 22.6 (20.6–25.2) | 27.65 (25.7–30.7) | 21.95 (20.3–23.9) | <0.0001 |
| Median length of stay in days (IQR) | 3 (2–5) | 2 (1–3) | 4 (2–5) | 0.0008 |
| Median ICU days (IQR) | 0 (0–2) | 0 (0–0) | 0 (0–2) | NS |
| Cohort 2 (non-hospitalized) | ||||
| Number of patients | 73 | 20 | 53 | NA |
| Median age in weeks (range) | 23.29 (3.29–33) | 23.65 (3.29–33) | 23.14 (5.57–32.43) | NS |
| Sex, M:F | 42:31 | 13:7 | 29:24 | NS |
| Median viral load Ct value (IQR) | 23.91 (20.65–27.29) | 25.61 (23.94–29.78) | 22.82 (20.22–25.80) | 0.0059 |
| Median respiratory severity score (IQR) | 2 (1–4) | 2 (1–4) | 3 (1–4) | NS |
| Sampling days after symptoms (IQR) | 3 (2–4) | 4 (2.25–5.75) | 3 (2–4) | 0.0342 |
| Cohort 2 (hospitalized) | ||||
| Number of patients | 27 | 3 | 24 | NA |
| Median age in weeks (range) | 13.29 (1.57–27.71) | 6.86 (3.71–18.43) | 13.36 (1.57–27.71) | NS |
| Sex, M:F | 14:13 | 1:2 | 13:11 | NS |
| Median viral load Ct value (IQR) | 22.79 (20.44–26.59) | 26.59 (21.59–27.20) | 22.79 (19.94–26.12) | NS |
| Median length of stay in days (IQR) | 3 (1–5) | 2 (1–5) | 3 (1.25–4.75) | NS |
| Sampling days after symptoms (IQR) | 4 (3–5) | 5 (3–5) | 4 (2.25–5) | NS |
| Cohort 3 | ||||
| Number of patients | 56 | 38 | 18 | NA |
| Median age in years (range) | 22 (18–50) | 22 (18–50) | 21 (18–29) | NS |
| Sex, M:F | 35:21 | 28:10 | 7:11 | 0.012 |
| Median total viral load AUC (IQR) | 643.2 (0–34,707) | 503.5 (0–19,737) | 643.2 (1.1–181,479) | NS |
| Median total clinical score (IQR) | 20 (7.3–36.8) | 22 (7.8–43) | 10 (4.8–29.5) | NS |
| Median nasal RSV IgA titer (log2) at baseline (IQR) | 9.61 (8.90–10.41) | 9.93 (8.94–10.42) | 9.43 (8.83–10.46) | NS |
P values are from chi-square test (sex) or two-tailed Mann–Whitney test (the rest) of comparison between cbDVG+ and cbDVG− patients. NA, not applicable; NS, not significant.
Fig. 2 |. cbDVg+ hospitalized paediatric patients have higher viral load and more severe clinical outcomes.
a, Pie chart showing percentages and actual numbers of cbDVG+ and cbDVG− patients in hospitalized paediatric Cohort 1. b–d, Viral load (b), length of hospitalization (c) and ICU days (d) were compared in patients with (n = 100, red) and without cbDVGs (n = 22, grey). Viral load was determined by Ct values from qPCR and is plotted as 1/Ct. Disease severity was determined by the length of hospitalization. Data are shown as mean ± s.e.m. Thirteen samples were used to perform RNA-seq to examine their transcriptional profiling. e, Hierarchical clustering and heatmap representation of differential expressed genes between cbDVG− and cbDVG+ patients. Colour based on row Z-score. Clusters 1 and 2 indicate the genes that were upregulated in cbDVG+ patients and cluster 3 indicates the genes that were downregulated in cbDVG+ patients. f, Bubble chart showing Gene Ontology (GO) enrichment analysis. Bubble size indicates the number of genes associated with each term. Bubble colour intensity indicates the enrichment score of GO terms overrepresented in that cluster of genes. Cluster 3 did not have any GO categories with an enrichment score above 2. g, Scattered dot plots showing expression of IFNL1 and representative interferon-stimulated genes (ISGs). h, Scattered dot plots showing representative pro-inflammatory cytokines from cbDVG− (n = 6; grey) and cbDVG+ (n = 7; red) hospitalized paediatric patients. Data are shown as mean ± s.e.m. Significant P values for two-tailed Mann–Whitney test are indicated. IFN, interferon; CPM, counts per million.
To evaluate whether cbDVGs present in these patients were associated with enhanced antiviral and inflammatory responses, we next compared the transcriptome profile from nasal washes of seven cbDVG+ and six cbDVG−patients from this cohort. We observed a significantly higher expression of genes with known antiviral activity in cbDVG+ patients (Fig. 2e–g). In addition, cbDVG+ patients expressed higher levels of pro-inflammatory cytokine genes, including IL6, IL1B, TNFA and MIP1A (Fig. 2h). In conclusion, the presence of cbDVGs in hospitalized patients is associated with strong antiviral and inflammatory responses, higher viral load and more severe disease.
cbDVG+ non-hospitalized paediatric patients have a higher viral load but similar clinical outcomes to cbDVG−patients.
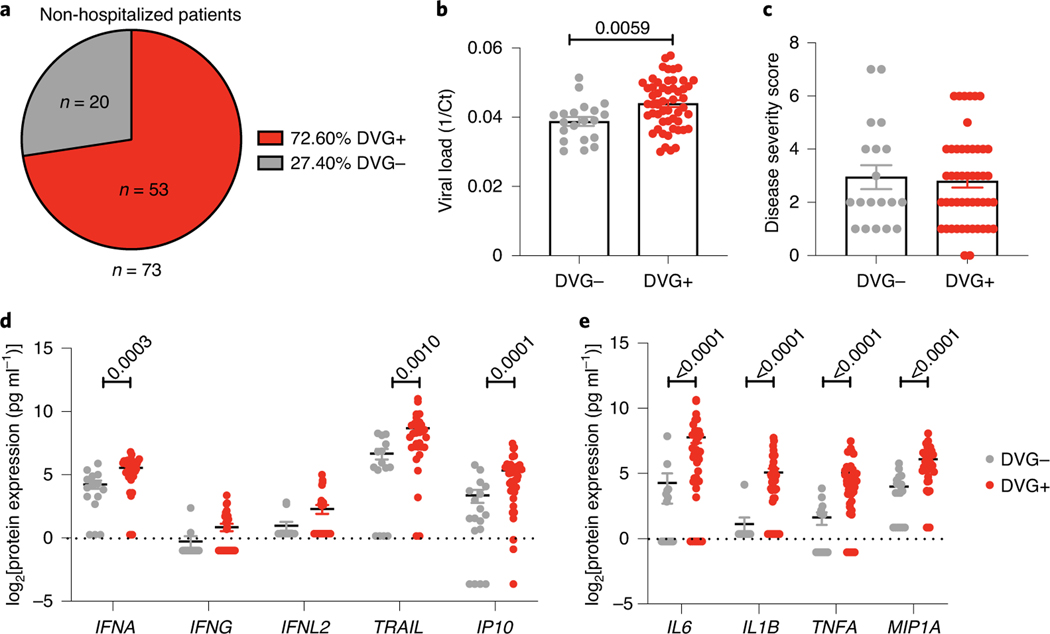
To study the association between cbDVGs presence and disease severity in non-hospitalized children, we used banked nasal washes obtained from an RSV A-confirmed cohort of 73 non-hospitalized paediatric patients and 27 hospitalized patients (Infant Susceptibility to Pulmonary Infections and Asthma Following RSV Exposure Study (INSPIRE) study; Cohort 2). Among the 73 non-hospitalized patients, 53 (72.6%) were identified as cbDVG+ by PCR (Fig. 3a, Table 1). A representative gel picture is shown in Extended Data Fig. 2b. Viral load was estimated based on Ct value from qPCR targeting N gene (Fig. 3b) and disease severity was determined based on the disease severity score (Fig. 3c). In contrast to Cohort 1, cbDVG+ non-hospitalized patients had similar symptoms to cbDVG− non-hospitalized patients despite having higher viral loads (Fig. 3b,c). These results indicate that the presence of cbDVGs in hospitalized and non-hospitalized patients associates with different clinical outcomes despite high viral loads in both scenarios.
Fig. 3 |. cbDVg+ non-hospitalized paediatric patients do not have worse respiratory disease than cbDVg− patients.
a, Pie chart showing the percentage and actual number of cbDVG+ and cbDVG− patients among non-hospitalized paediatric patients detected by PCR. b,c, In the 73 non-hospitalized infants, viral load (b) and disease severity score (c) were compared in patients with (n = 53, red) and without cbDVGs (n = 20, grey). Viral load was determined by Ct values from RT–qPCR and is plotted as 1/Ct. d,e, Scattered dot plots showing (d) expression of IFNA and representative ISGs and (e) representative pro-inflammatory cytokines from cbDVG− (n = 15–18; grey) and cbDVG+ (n = 30–41; red) non-hospitalized paediatric patients. Data are shown as mean ± s.e.m. Significant P values for two-tailed Mann–Whitney test are indicated.
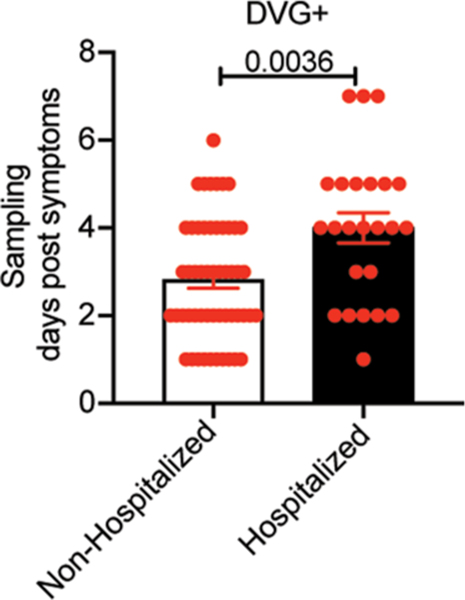
To evaluate whether detection of cbDVGs in non-hospitalized patients was associated with enhanced antiviral and inflammatory responses, we compared cytokine expression in nasal washes from cbDVG+ and cbDVG− patients. We observed significantly higher expression of IFNA and ISGs (TRAIL and IP10) in cbDVG+ patients (Fig. 3d). In addition, similar to Cohort 1, cbDVG+ non-hospitalized patients expressed higher levels of IL6, IL1B, TNFA and MIP1A than cbDVG−patients (Fig. 3e). As we previously showed that earlier cbDVG appearance in human lung explants infected ex vivo associated with earlier antiviral responses and faster virus control compared with no or later cbDVG appearance22, we speculated that the kinetics of the induction of the immune response could explain the differential effect of cbDVGs on clinical outcomes observed in non-hospitalized versus hospitalized patients. Supporting this hypothesis, we noticed that cbDVG+ non-hospitalized patients showed symptoms and were sampled significantly earlier than hospitalized patients (Extended Data Fig. 3), suggesting that cbDVGs accumulate earlier in non-hospitalized patients than in hospitalized patients.
cbDVG appearance is independent of viral load.
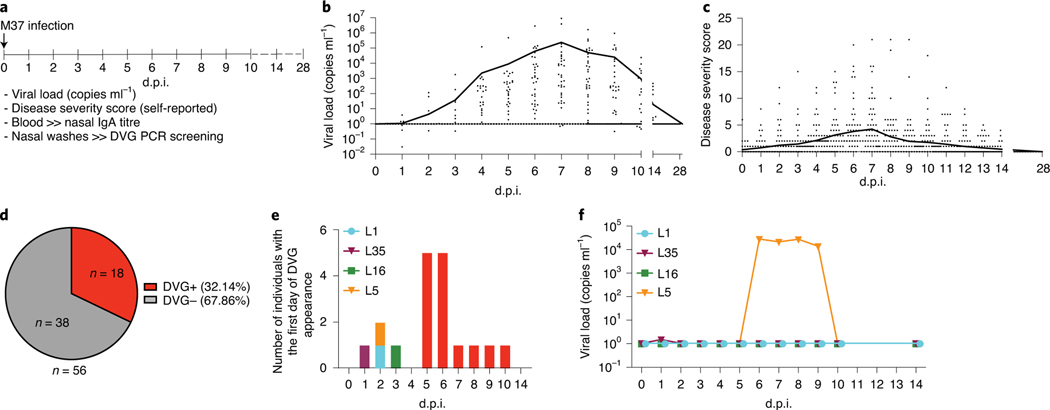
Because high viral load associated with cbDVG+ detection in both Cohorts 1 and 2, we next evaluated whether cbDVG detection was dependent on having a high viral load. To do this, we used a longitudinal cohort (Cohort 3) that allowed us to study cbDVGs that appear at early time points after infection. In this cohort, healthy adults (age 18–50 years; median 22 years) were experimentally infected with 104 plaque-forming units of RSV A M37 intranasally, as described previously33 (Cohort 3, Table 1). We had access to nasal samples from 59 individuals and of these we eliminated from the analysis three participants who did not show detectable virus or symptoms at any time after infection. Viral load, nasal immunoglobulin A (IgA) titre and nasal wash samples were obtained immediately before infection (day 0) then daily for the first 10 days after inoculation, and on day 14 and day 28 after that33 (Fig. 4a). Disease severity scores were self-reported daily for the first 2 weeks. cbDVG presence was examined from nasal washes by PCR (a representative gel picture is shown in Extended Data Fig. 2c). Overall, viral loads and disease severity scores in the infected individuals peaked on day 7 post inoculation (Fig. 4b,c, Table 1). Eighteen subjects (32.14%) had detectable cbDVGs on at least one day within the time points analysed and were defined as cbDVG+. Thirty-eight subjects (67.86%) were negative at all tested time points and thus defined as cbDVG− (Fig. 4d). Age and basal nasal anti-RSV IgA titre were not different between the cbDVG+ and cbDVG− groups (Table 1). Interestingly, the first day of cbDVG detection was spread widely across the infection course and peak cbDVG detection was on days 5 and 6 post inoculation (Fig. 4e), before the peak of viral load (Fig. 4b). Moreover, three of four individuals with cbDVG first detected before day 4 (subjects L1, L16 and L35) had minimal viral load throughout the entire infection course. Subject L5 had detectable viral load starting from day 6 post inoculation, 4 days after cbDVGs were first detected (Figs. 4e,f and 5a). Taken together, these data show that cbDVG detection was not dependent on having a high viral load.
Fig. 4 |. cbDVg appearance is independent of viral load.
a, Study design of Cohort 3. Healthy adult volunteers were experimentally infected with RSV A M37. Disease severity, viral load, nasal IgA titre and nasal washes were analysed for all indicated time points. b,c, Each data point represents the (b) viral load or (c) disease severity score of individual participants at designated days post infection. The black lines connect the daily mean value for all patients. Viral load was examined by RT–qPCR and absolute quantification was calculated using a plasmid DNA standard curve (Methods). All ‘0’ viral load values were replaced with ‘1’ for graphing in the log scale. d, cbDVG PCR was performed to determine cbDVG presence or absence in nasal washes. The pie chart indicates the percentage and actual number of cbDVG+ and cbDVG− patients in this cohort. e, Graphical representation of the number of individuals with first day of cbDVG detection at the indicated day post inoculation (d.p.i.). Red colour represents the individuals with the first day of cbDVG detection after day 4 post inoculation. Coloured bars indicate the individuals with cbDVGs detection before day 4. f, Kinetics of viral load in the four individuals with first cbDVG detection before day 4 post inoculation.
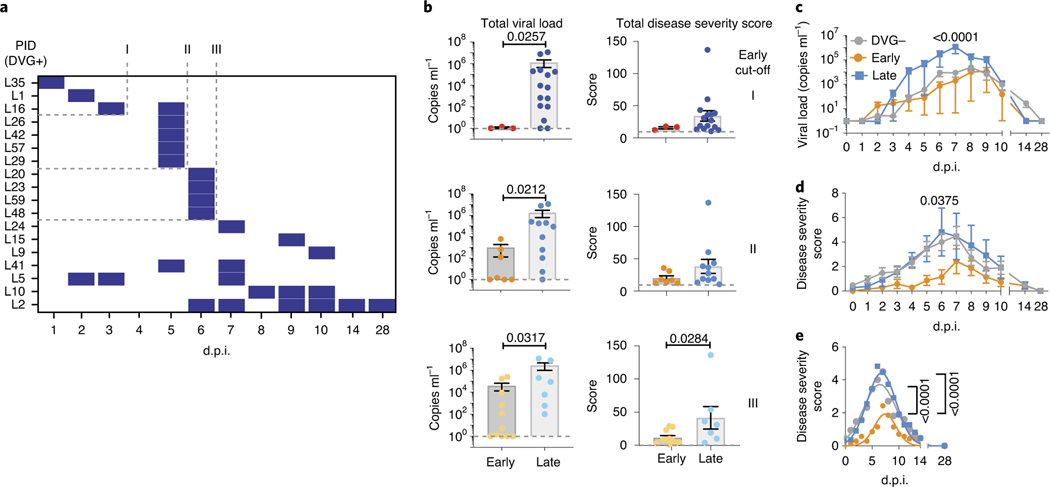
Fig. 5 |. Early appearance of cbDVgs associates with lower viral loads and disease severity scores in experimentally infected subjects.
a, Criteria for early cbDVG appearance and clearance. The heatmap indicates the time points when cbDVGs were detected in samples from 18 cbDVG+ volunteers. Coded patient IDs (PID) are indicated on the left. Three cut-offs used to define cbDVGs as ‘Early’ are indicated: first detection within 3 d.p.i. (I), 5 d.p.i. (II) and 6 d.p.i. (III). For all three cut-offs, DVGs had to be cleared within the first 6 days of infection to be considered ‘Early’. All other patients were considered ‘Late’ cbDVG producers. b, Comparison of total viral load (left) and disease severity score (right) between Early and Late groups for all three cut-offs. For Early groups n = 3 (cut-off I), n = 7 (cut-off II) and n = 11 (cut-off III) and Late groups n = 15 (cut-off I), n = 11 (cut-off II) and n = 7 (cut-off III). Each dot represents the total score or viral load from individual participants and data are shown as mean ± s.e.m. Significant P values for two-tailed Mann–Whitney test are indicated. c,d, Cut-off II was selected to show the comparison of the kinetics of (c) viral load and (d) disease severity score among negative (n = 38), Early (n = 7) and Late (n = 11) groups. Data are plotted over time and trendline represents mean ± s.e.m. Significant P values for two-way analysis of variance (ANOVA) with Bonferroni post-hoc test for Early versus Late groups are indicated. e, Best-fit curves for kinetics of disease severity scores from negative (n = 38), Early (n = 7) and Late (n = 11) groups were calculated using a nonlinear Gaussian model. The best-fit values for amplitude of the negative, Early and Late group curves were compared.
Early appearance of cbDVGs associates with lower disease severity scores than late appearance of cbDVGs.
To further investigate the association between cbDVGs and RSV disease severity and more directly test if the kinetics of cbDVG detection correlates with their effect on clinical outcome, we categorized the patients in Cohort 3 based on when cbDVGs were first and last detected. Because there were no pre-defined cut-offs for ‘Early’ or ‘Late’ DVG appearance in the literature, we defined three different cut-offs for Early detection. In all three cut-offs, cbDVG clearance must have occurred within the first 6 days post infection (before peak of infection) to meet the Early criteria. Early cut-offs I, II and III were defined as cbDVGs first detection occurring on days 3, 5 or 6 post infection, respectively (Fig. 5a). All participants that did not meet the Early criteria were considered Late.
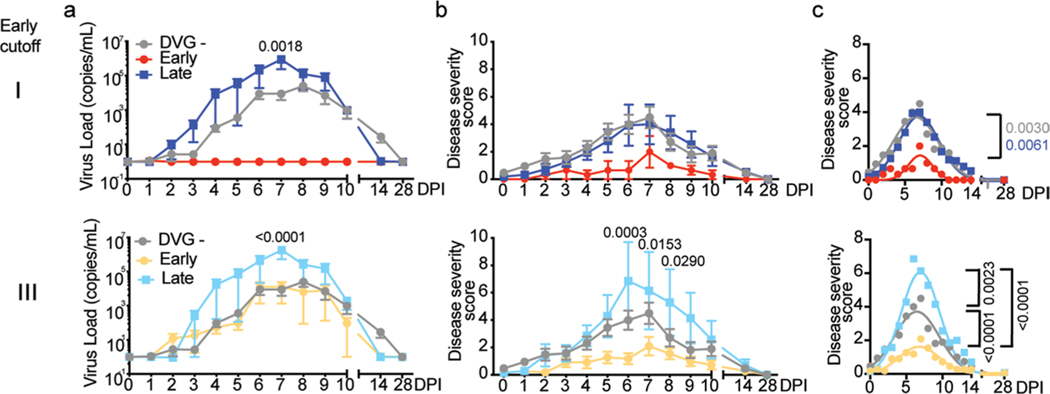
To investigate whether early/late appearance of cbDVGs was associated with different RSV disease severity, total viral load and total disease severity score were compared between groups using all three cut-offs. Overall, Early groups showed significantly lower total disease severity score and total viral load than Late groups, regardless of the cut-off used in the analysis (Fig. 5b). Notably, viral load was lower within earlier cut-offs indicating that the earlier cbDVGs are generated, the more effective they are at controlling viral load. To further analyse the role of early cbDVGs in infection outcome, disease severity score and viral load for each time point from all 56 subjects were compared over time among cbDVG negative, Early and Late groups. Using cut-off II as an example, the Early group had viral loads similar to the negative group and both groups had lower viral loads than the Late group (Fig. 5c). Interestingly, disease severity score in the Early group was lower than both negative and Late groups over the entire infection course (Fig. 5d). Nonlinear Gaussian regression was used to model the kinetics of disease severity score of the three groups. The best-fit value for amplitude of the curves, referring to the peak of disease severity scores, was significantly lower in the Early group than both negative and Late groups (Fig. 5e). Similar results were observed using the other two cut-offs (Extended Data Fig. 4). These data demonstrate that early detection of cbDVGs is associated with less-severe symptoms than late or no cbDVG detection.
Prolonged detection of cbDVGs associates with increased viral load and worsened disease severity.
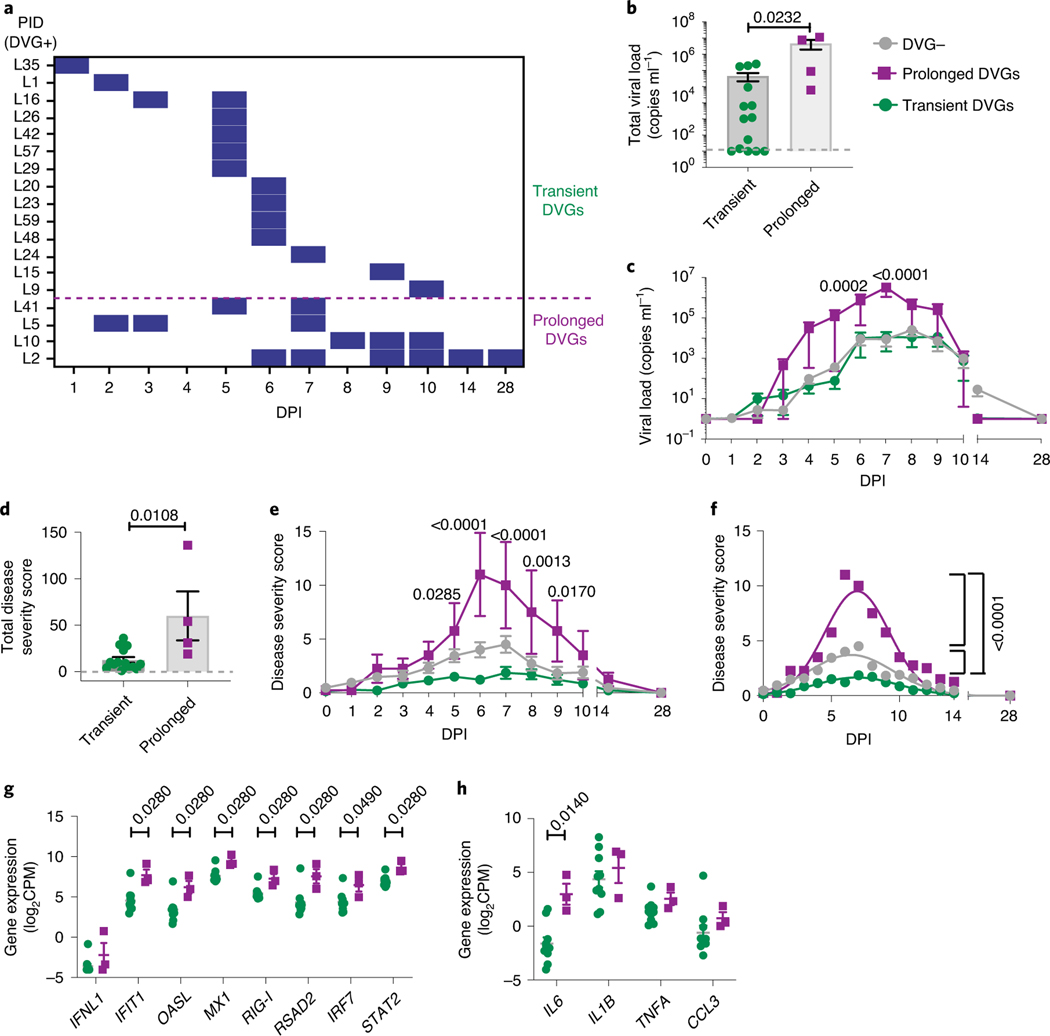
In addition to cbDVGs appearing at different times, cbDVGs were also detected for different durations in the cbDVG+ subjects (Fig. 6a). Within the 18 cbDVG+ subjects, four individuals had detectable cbDVGs on at least two days with cbDVGs detectable beyond day 6 post infection (at or after peak of infection). These four individuals were categorized as ‘Prolonged’ cbDVG producers, whereas the other 14 individuals were considered ‘Transient’ cbDVG producers (Fig. 6a). To investigate how prolonged versus transient presence of cbDVGs impacted disease severity and immune responses, viral loads, disease severity scores, and antiviral and pro-inflammatory gene expression were compared. Individuals in the Prolonged group had significantly higher total viral load than individuals in the Transient group (Fig. 6b). Prolonged cbDVGs were also associated with higher viral load over time (Fig. 6c). Similar trends were observed for disease severity scores. The Prolonged group exhibited elevated disease severity scores in total, as well as at 5–9 days post inoculation (Fig. 6d,e) compared with cbDVG− and Transient groups. When a nonlinear Gaussian regression model was applied to the kinetics of clinical scores, the amplitudes of the best-fit curves for the three groups (negative, Transient, Prolonged) were significantly different from each other (Fig. 6f). Antiviral and pro-inflammatory responses were more elevated in the Prolonged group than the Transient group with IFIT1, OASL, MX1, RIG-I, RSAD2, IRF7, STAT2 and IL6 reaching significant differences (Fig. 6g,h). Taken together, stronger interferon and pro-inflammatory responses associate with higher viral load and worse disease in individuals with prolonged cbDVGs. Notably, the association between the antiviral response, viral load and disease severity in patients with prolonged cbDVGs is similar to that observed in hospitalized children (Cohort 1). Overall, analysis of Cohort 3 demonstrates that the kinetics of appearance and clearance of cbDVGs during RSV infection is directly associated with disease severity. Early appearance is associated with rapid viral control and less-severe disease, whereas late appearance or prolonged presence of cbDVGs is associated with higher viral loads and worse clinical outcomes.
Fig. 6 |. Prolonged detection of cbDVgs associates with higher viral loads and worse clinical outcomes.
a, Criteria for prolonged and transient cbDVG detection. For the Prolonged group, cbDVGs had to be detected on at least 2 days and still be present beyond 6 d.p.i. The rest of the volunteers were considered part of the Transient group. The purple dashed line indicates the division between the Transient and Prolonged groups. b,c, Total viral load (b) and viral load over time (c) were compared between the Transient (n = 14) and Prolonged (n = 4) groups. d,e, Total disease severity score (d) and disease severity score over time (e) were compared between the Transient (n = 14) and Prolonged (n = 4) groups. f, The best-fit curves for the kinetics of disease severity score from the negative (n = 38), Transient (n = 14) and Prolonged (n = 4) groups were calculated and compared using a nonlinear Gaussian model. The best-fit values for amplitude of all three curves are shown. g,h Scattered dot plots showing (g) expression of IFNL1 and ISGs and (h) representative pro-inflammatory cytokines from the Transient (n = 10) and the Prolonged (n = 3) groups. Data are shown as mean ± s.e.m. Significant P values for two-tailed Mann–Whitney test (b,d,g,h) and two-way ANOVA with Bonferroni post-hoc test (c,e) are indicated for Transient versus Prolonged groups.
Discussion
Our ability to predict the trajectory of RSV disease is limited at present. Identification of predictive factors for disease severity and clinical outcome would be of tremendous help not only for high-risk patients, but also for patient management in hospitals during the peak RSV season. Our data suggest that cbDVG detection could be a predictive tool. A higher count of DVG reads was previously shown to correlate with better clinical outcome during influenza virus infection34. However, the impact of cbDVGs on RSV disease severity seems to be more complex because we found that is not only the presence of cbDVGs, but also the time course of cbDVG accumulation that influences the association between cbDVGs and RSV clinical outcomes.
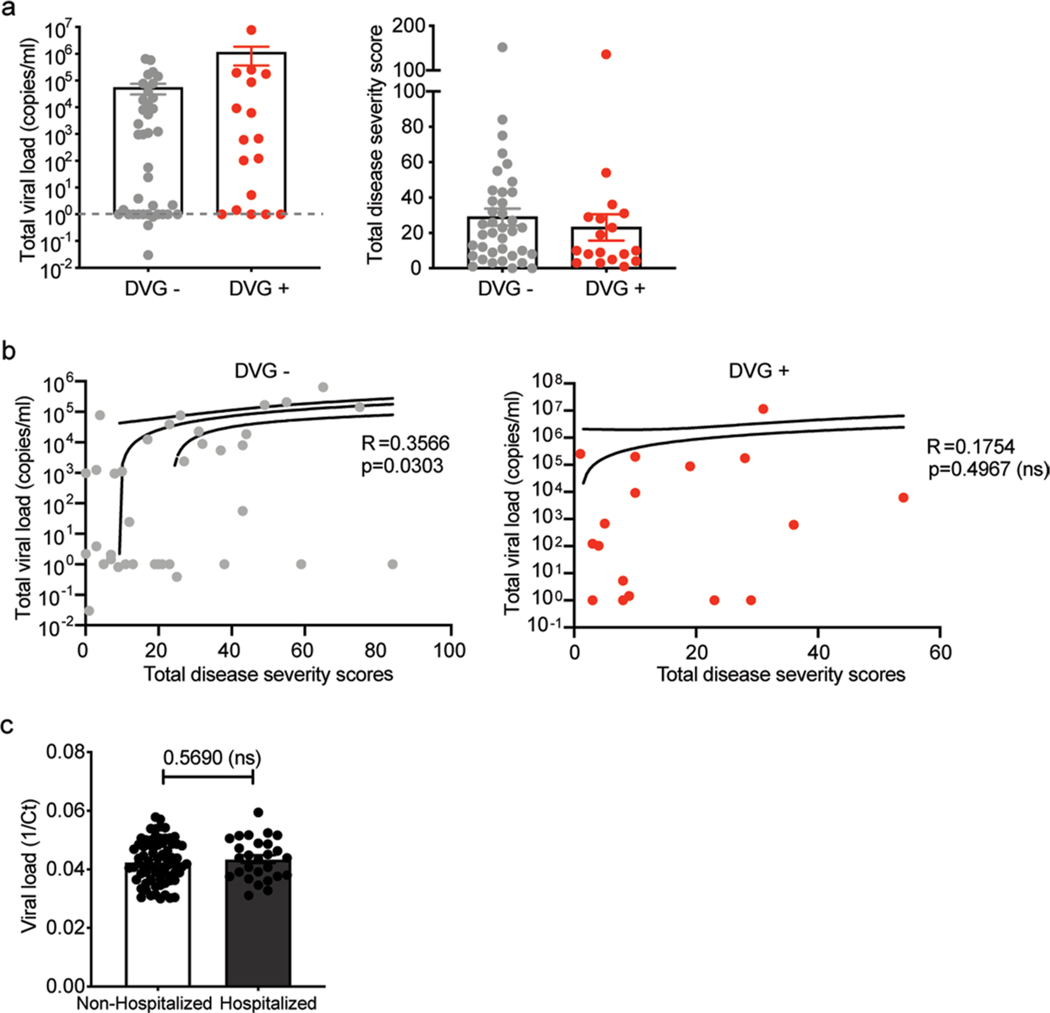
DVG generation is closely tied to viral replication, therefore it is possible that the observed association between cbDVGs and clinical outcome is a secondary effect of different viral loads among the groups. However, both the literature16,20 and our data suggest that high viral load does not always associate with disease severity. In Cohort 3, we noticed that cbDVG+ subjects had higher, albeit not statistically significant, viral loads compared with cbDVG− subjects with a tendency for lower severity scores, indicating that differences in clinical outcomes among these groups cannot be explained by viral load (Extended Data Fig. 5a). In addition, although a correlation between viral loads and disease severity scores was noticed within the cbDVG− group, this correlation was not present among cbDVG+ samples (Extended Data Fig. 5b). Consistent with our observations, although a positive correlation between RSV viral load and severity of illness has been demonstrated among hospitalized patients13–15,18,35, other groups have failed to show such an association in both hospitalized and non-hospitalized settings16,36–38. Indeed, when we compared the Ct value for RSV between hospitalized and non-hospitalized patients in Cohort 2, no obvious differences were observed (Extended Data Fig. 5c), strongly implying that viral load is not the sole viral factor that influences disease severity. Furthermore, cbDVG appearance is not dependent on high viral load because in some subjects, cbDVGs were detected earlier than the peak viral load, and cbDVGs were detected even in individuals with non-detectable viral load (Fig. 4e,f).
How do the kinetics of cbDVGs influence RSV clinical outcomes? Based on this and previous work in mice and human tissue, we hypothesize that cbDVGs alter standard virus replication and the host immune response to the infection, impacting the clinical outcome. Early cbDVGs are present when viruses are still trying to establish infection in the host. In these conditions, the immune response is stimulated earlier leading to decreased viral replication and spread, and better clinical outcomes. In experimentally infected adults, it seems that early appearance of cbDVGs is rare, representing only 5% (3 of 56) of the cohort. However, this number is probably an underestimate due to interference from pre-existing immunity against RSV in adults. In children infected naturally, the percentage of infants that accumulate cbDVGs on or before day 3, especially during their first exposure to RSV, could be higher than 5% and is worth investigating. It is possible that many asymptomatic children belong to this group and were therefore missed in this study. By contrast, late/prolonged cbDVGs accumulate around and after the peak time of viral replication, about 1 week after infection. At this stage, the standard virus has already established infection. Although these cbDVGs induce similar immune responses to early ones, these responses are presumably too late in the infection when viral loads are extremely high, leading to more tissue damage and worse pathology. As shown in Fig. 2, cbDVGs in hospitalized paediatric patients, which presumably belong to late and/or prolonged cbDVGs, were associated with high viral replication and severe disease. Further studies need to be done to understand the mechanism by which different kinetics of cbDVGs influence viral load, host responses and disease progression.
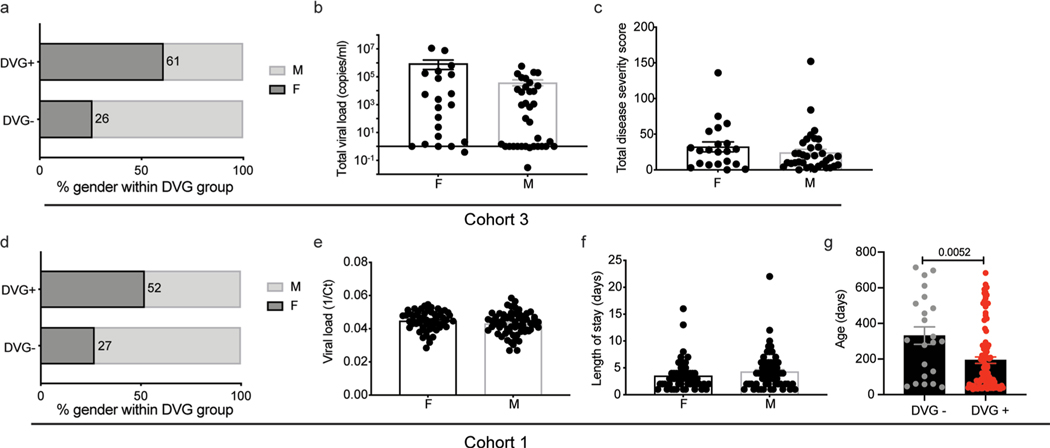
What factors determine cbDVG generation? Host factors that could influence cbDVG generation are sex, age and immune status39. We observed that females were 2.62× more likely than males to be cbDVG+ in the adult cohort (Cohort 3), with a tendency of higher viral load and higher symptom scores (Extended Data Fig. 6a–c). A similar trend was noticed in children. Girls in hospitalized and non-hospitalized cohorts were 1.2× and 1.12× more likely to be cbDVG+ than boys, respectively. However, no differences in viral load and length of stay were observed between sexes (Extended Data Fig. 6d–f). Interestingly, cbDVG+ patients in the hospitalized cohort (Cohort 1) were significantly younger than cbDVG− patients (Extended Data Fig. 6g); however, this was not observed in the non-hospitalized cohort or the adult cohort (Table 1). We previously showed that IgA titre is associated with protection against RSV in patients33. In this study, when we compare the basal anti-RSV IgA titre between cbDVG+ and cbDVG− individuals in Cohort 3, we did not see a significant difference, consistent with the lack of significant difference in disease severity scores and viral loads between these two groups. Viral factors, including number of viral particles containing cbDVGs in the virus inoculum during transmission or different viral isolates could also play a role. Determining if these or other host and viral factors impact cbDVG generation and influence clinical outcomes is the subject of a current investigation.
Overall, we propose that whether cbDVGs are beneficial for or detrimental to the host depends on the context. From a clinical perspective, there are mixed messages in regard to using viral load as a predictor for RSV clinical outcomes. Our study provides a possible explanation for these conflicts and suggests that high viral load in the presence of cbDVGs is a good predictor of severe disease in hospitalized patients but not in non-hospitalized patients. In addition, this study reveals a new window of opportunity to modulate RSV pathogenesis by promoting cbDVG generation early during infection.
Methods
Cohort descriptions and sample collection.
Hospitalized paediatric cohort.
In Cohort 1, a total 122 banked nasopharyngeal swabs were obtained from the Children’s Hospital of Philadelphia. All patients were under 2 years old (range 30–714 days) at the time of sample collection and required hospitalization. All samples were collected at comparable time points, either at the time of or shortly after (1–2 days) admission to the hospital. Sixty-four males and 58 females were included in this cohort. Median for the length of stay in hospital was 3 days [interquartile range (IQR) 2–5 days] and median for the length of stay in the ICU was 0 (IQR 0–2 days). No cases of death were included in this cohort. All samples tested positive for RSV subgroup A by qPCR and the median viral load was Ct value 22.6 (IQR 20.6–25.2)40. Premature infants, patients with congenital heart disease and patients co-infected with other respiratory viruses were excluded from the study. If the same patient had more than two RSV positive nasopharyngeal swabs, only the first was included in the current study. Demographic and clinical data were extracted from the electronic medical records. This study was approved by the Children’s Hospital of Philadelphia Institutional Review Board #14–011453.
Non-hospitalized paediatric cohort.
The samples comprising Cohort 2 were part of the INSPIRE study41. Term healthy infants were enrolled in INSPIRE during their first months of life and were surveilled every 2 weeks during RSV season in their first year of life. Nasal samples were taken at both enrolment and acute respiratory illness visits during RSV seasons. If the infants met prespecified criteria for a respiratory illness visit41, an in-person visit was made, at which nasal and urine samples were collected, respiratory symptoms were assessed and the date of symptom onset was recorded. The respiratory severity score used was an ordinal scale based on respiratory rate, flaring or retractions, heart rate and wheezing that was modified slightly from other scores derived for acute respiratory illnesses. The respiratory severity score ranged from 0 to 12 (ref. 42). For this study, we evaluated a random sample of 100 nasal washes collected during the respiratory illness visit which were qPCR confirmed for RSV subgroup A and represented both outpatient visits and hospitalizations. Among them, 73 were from non-hospitalized patients and 27 were from hospitalized patients. This study was approved by Vanderbilt University School of Medicine, Institutional Review Board no. 111299.
Experimentally infected adults.
The description of Cohort 3 has been previously published33,43. Briefly, 61 healthy non-smoking adults aged 18–50 years were inoculated experimentally with 104 plaque-forming units of RSV A Memphis 37 (M37) by intranasal drops. Of the 61 adults enrolled in this study, we had access to nasal samples from 59 individuals and we eliminated from the analysis three who did not show detectable virus or symptoms at any time after infection. Nasal washes and blood were taken immediately before inoculation (day 0), daily for the first 10 days post infection (day +1 to day +10), on day +14 and on day +28. Additionally, nasal scrapes of selected individuals were collected on day 0, day +3, day +7 and day +10 using ASI Rhino-Pro curettes (Arlington Scientific). Symptom scores, including nasal discharges, nasal congestion, sneezing, cough, sore throat, headache, feverishness and fatigue were self-reported from day 0 to day +14 using a modified Jackson scoring system44. Subjects were asked to score each symptom as: 0 (absent), 1 (mild), 2 (moderate) or 3 (severe). Maximum daily symptom score was 24 and the total maximum score over the 14 days of assessment was 38444. Note that the criteria for uninfected individuals is not based solely on viral loads, because certain cbDVGs were detected even without detectable viral load in patients. This study was approved by the UK National Ethics Service London-Fulham (study number 11/LO/1826). Written informed consent was obtained from all volunteers before inclusion in the study.
Study design.
Our goal was to determine whether detection of cbDVGs in nasal washes/scrapes from RSV-infected patients serves as a correlate of disease severity. Three different cohorts were used in this study: Cohort 1 were hospitalized paediatric patients, Cohort 2 were majorly non-hospitalized infected children, and Cohort 3 were experimentally infected adults. For details about the three cohorts refer to cohort descriptions above. Nasal washes/scrapes, viral titres and clinical information, including age, sex, length of hospitalization, disease severity scores, date of symptom onset, viral load, antibody titre and ICU days were obtained for analysis of the association between cbDVGs and disease severity. For all three cohorts quantitative polymerase chain reaction with reverse transcription (RT–qPCR) methods targeting the virus nucleoprotein were used to estimate viral loads. Although it is possible that DVGs containing the region targeted by these assays could be amplified and included in the viral load measurements, our RNA-seq data indicate than the vast majority of the reads correspond to standard virus. Nasal washes were screened by PCR for the presence of cbDVGs as described previously22. PCR was repeated blindly by two independent researchers for up to a total of four times for each clinical sample. The clinical information mentioned above was compared separately between cbDVG+ and cbDVG− patients for all three cohorts when data were available. Furthermore, we selected some patient samples from different cbDVG groups for RNA-seq to understand the functions and species of cbDVGs present in the three cohorts through host transcriptome analysis. A detail study design for each cohort is shown next.
For Cohort 1, cbDVGs in nasal washes were tested via PCR and the tests were repeated two to four times by two researchers. cbDVG+ patients were defined as PCR positive in at least one repeat. Viral load in this cohort was determined by RT–qPCR. Other clinical information including ICU days, length of stay, sex and age were blinded to both researchers at the time of cbDVG testing and compared between cbDVG+ and cbDVG− patients upon unblinding.
For Cohort 2, viral load was determined by qPCR, and cbDVG screening was performed blindly as indicated for Cohort 1. cbDVG+ patients were defined as PCR positive in at least one of four repeats. Age, sex, symptom scores, date of symptom onset and estimated days post infection, length of hospitalization for hospitalized patients and viral load were compared between cbDVG+ and cbDVG− patients.
For Cohort 3, viral load and nasal IgA titre were determined for all available time points by RT–qPCR and enzyme-linked immunosorbent assay (ELISA), respectively, as described elsewhere45,46. Briefly, RSV was detected in nasal lavage by RT–qPCR for N gene as described previously except that random hexamer primers (Qiagen) were used for cDNA synthesis45. Absolute quantification was calculated using a plasmid DNA standard curve. All ‘0’ viral load values were replaced with ‘1’ for graphing in the log scale. Anti-human IgA-peroxidase antibody produced in goat (Sigma A0295–1ML) was used at a 1:1,000 dilution to detect IgA in nasal lavage. Nasal wash IgA endpoint binding titre to RSV lysate was determined by ELISA as the highest titre exhibiting an optical density of more than two times the background. Endpoint titres were used because mid-point titres could not be calculated in view of the diluted nature of nasal lavage. Observed endpoint titres were corrected for dilution using the ratio of serum to nasal lavage urea before analysis46. cbDVGs in nasal washes were tested via PCR and the tests were repeated two to four times by two researchers. cbDVG+ samples were defined as cbDVG detectable by at least one PCR repeat in nasal washes and individuals containing at least one cbDVG+ samples were considered as cbDVG+ subjects. Correlations between cbDVG kinetics and viral load and between cbDVG kinetics and disease severity score were examined.
RNA extraction and DVG RT–PCR.
Total RNA was extracted from nasal washes of the adult and two paediatric cohorts using TRIzol LS (Invitrogen) according to the manufacturer’s instruction. Isolated total RNA was reversed transcribed using SuperScript III First-Strand Synthesis System (Invitrogen). cbDVGs were then amplified using specific primers (P1: 5′-CTTAGGTAAGGATATGTAGATTCTACC −3′; P2: 5′-CCTCCAAGATTAAAATGATAACTTTAGG-3′) (Fig. 1a). We have previously used this PCR method successfully and identified major cbDVGs in viral stocks and RSV-infected human cells and tissue, which were both confirmed by Sanger’s sequencing and RNA-seq22,32. We applied the same PCR conditions to an RSV full-length viral backbone plasmid and did not detect any amplicons22, indicating that PCR amplicons are not from the viral genome. In addition, no amplicons were observed in samples from RSV-negative patients. Based on RNA-seq data, we determined that 0.2% of cbDVGs are generated from break or rejoin points downstream of P1 and P2, respectively, and are missed by our PCR because of the location of the primers. It is important to note that two major bands resulted from PCR (Fig. 1b). Upon Sanger’s sequencing, we determined that these two bands represent two different viral fragments within cbDVGs shared by many different cbDVG species. For detecting specific cbDVGs we used P1 primers 5′-CTTGCCATAGCTTCTATCATCCAACAC-3 ′ (cbDVG 2894–13421), 5′-GTTAAGTCTATGGCATGAAAGATTCTAAGG-3 ′ (cbDVG 11995–13050) and 5′-GTATCTCATTAAGCTTGGGTTGTTAAC-3′ (cbDVG 12776–13401). P2 was the same for all three specific cbDVGs P1 primers 5′-GTCTGCTGTAATTGGTTCTAATCATTG-3′.
RNA-seq library preparation.
The library preparation description for samples to validate the DVG-specific PCR in Fig. 1 can be found elsewhere32. For Cohort 1, 13 samples including seven cbDVG+ and six cbDVG− were selected. Ten nanograms of extracted RNA from patients’ nasal washes were used. Because of the low and degraded input RNA, SMARTer Stranded Total RNA-seq kit v2-Pico Input Mammalian (Takara) was used to prepare the complementary DNA (cDNA) libraries according to the manufacturer’s instruction. Libraries were run on Illumina Nextseq 500 to generate 75 bp, single-end reads, resulting in 21–62 million reads per sample with average Q30 ≥95.89%. For Cohort 3, RNA-seq cDNA libraries from nasal scrapes of the available 144 samples were prepared using TruSeq Stranded Total RNA Library Prep Kit with Ribo-Zero Human/Mouse/Rat Sample Prep Kit, according to the manufacturer’s instructions, starting with 100 ng of total RNA. Final cDNA libraries were analysed for size distribution using the Agilent Tapestation 2200 (D1000 kit, Agilent Technologies). Prepared libraries were sequenced with 2× 50 bp paired-end reads on the Illumina HiSeq 2500 sequencer with a minimum of 3 GB of raw RNA sequencing data.
DVG/viral reads analysis and host transcriptome/protein expression analysis.
For detection of DVG reads, RNA-seq data sets from patients were analysed, after human read removal by bowtie2, using the VODKA on the entire viral genome (Reference genome NCBI KC731482.1, 2011) with ‘-bp_from_right 15231’ (ref. 32). The Basic Local Alignment Search Tool (BLAST) was then used to align the sequences obtained with VODKA against the virus reference genome. Blastn v.2.11.0 with the following options was used ‘-word_size 11 -gapopen 5 -gapextend 2 -penalty −3 -reward 2 -evalue 0.00000005 -perc_identity 0.1’. Only sequences with two alignment ranges reported on opposite strands of the reference genome were considered cbDVG reads. Sequences with alignment positions that were not consistent with the break and rejoin predicted by VODKA were discarded. Host transcriptome profiling of 13 hospitalized paediatric samples (from Cohort 1) was analysed using a pipeline published elsewhere47 with the actual codes summarized in the Supplementary Information using Rmarkdown. The bubble chart was graphed using Datagraph. For Cohort 2, nasal samples were profiled using Luminex xMap multianalyte bead assays for 53 immune response analytes (Milliplex Human Cytokine/Chemokine Panel II MAGNETIC Premixed 23 Plex Kit, EMD Millipore; and Cytokine 30-Plex Human Panel, Life Technologies Corporation)48. Two replicates of each sample assay were performed on plates with 96 wells each. A blank well was used to estimate the background. Individual gene expression or protein concentration (pg ml−1) comparisons between cbDVG+ and cbDVG− groups were conducted using GraphPad Prism v.9. For Cohort 3 (host analysis), the adaptors of RNA-seq reads were removed by SeqPrep and mapped to the human B38 genome with the Omicsoft OSA aligner. Reads mapped to the human ensemble genes (Release 75) were counted and calculated with RSEM. The gene count data were normalized, and differential gene expression was calculated by DESeq2 (R package, v.1.18.1).
Statistical analysis.
Statistical analyses were performed as indicated in each figure using GraphPad Prism v.9 or using the R environment (R package, v.3.6.0). Nonparametric data were compared using two-tailed Mann–Whitney tests. For kinetics analysis, two-way ANOVA was used to compare the difference at each time point with Bonferroni’s multiple comparisons test. Nonlinear Gaussian regression was used to model the best-fit curve for the kinetics of clinical scores in Cohort 3.
Reporting Summary.
Further information on research design is available in the Nature Research Reporting Summary linked to this article.
Data availability
All data associated with this study are present in the paper or the supplementary materials. Raw sequence data are deposited on SRA or GEO (Fig.1, PRJNA681672; Fig.2 and S1A, GSE146925 and Fig.6, GSE166161). Source data are provided with this paper.
Code availability
All R codes used to analyse RNA-seq data from clinical samples were indicated in Rmarkdown (Supplementary Information). VODKA is self-developed and is deposited in GitHub at https://github.com/itmat/VODKA.
Extended Data
Extended Data Fig. 1 |. Confirmation of rT-PCr and rNA-seq/VoDKA methods with paediatric patient samples.
a, Thirteen hospitalized paediatric patients from cohort 1 were divided into 2 groups based of PCR screening: DVG PCR+ (left) and DVG PCR- (right). DVG reads identified for each patient using the RNA-seq/VODKA pipeline were normalized to 108 total reads. b, Specific primers for unique cbDVG junction regions were designed based on cbDVG sequences identified by RNA-seq/VODKA in sample H75. The numbers in parenthesis indicate break and rejoin positions targeted by the primers in sample H75. Amplicons were of the expected sizes (left to right: 417bp, 804bp and 436bp). c, cbDVG band from sample H75 12776–13401 was gel extracted and confirmed by Sanger’s sequencing. P2 primer sequence is labeled in green and P1 primer sequence (spanning the junction region) is labeled in red and blue to show break/rejoin point.
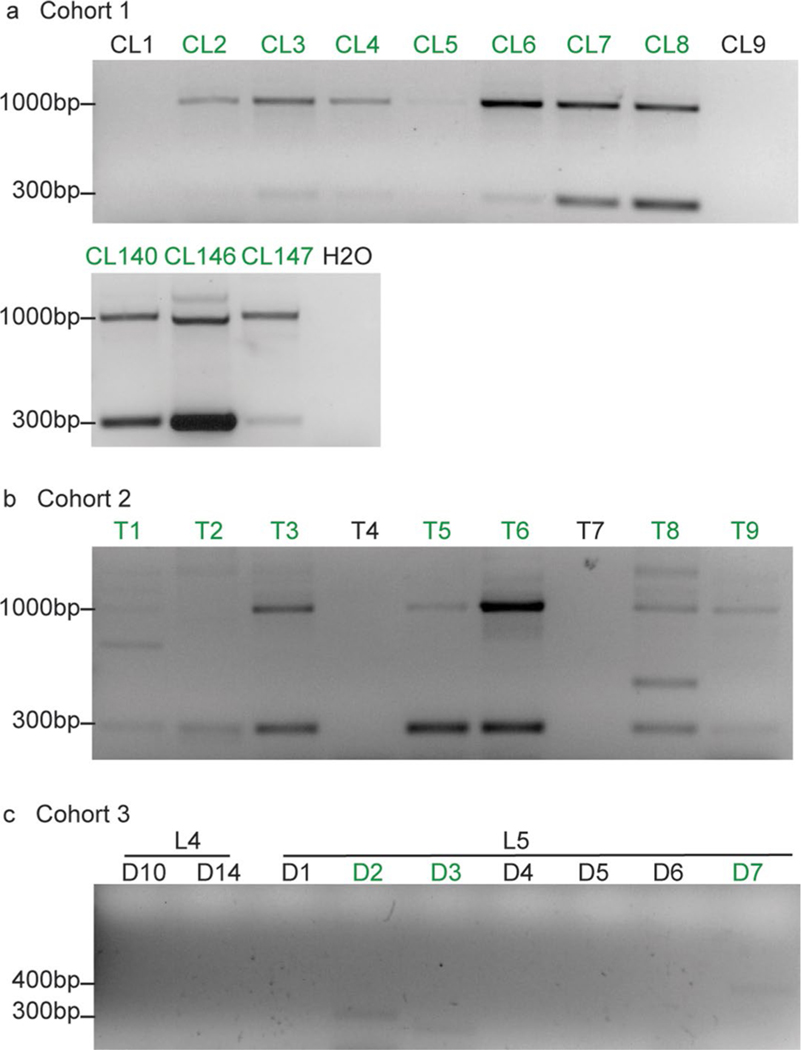
Extended Data Fig. 2 |. representative DNA gel pictures of Cohorts 1, 2 and 3.
Positive PCR results were marked in green. H2O was added as a negative control for each PCR as shown in (a). a, same results were observed for all samples for two independent repeats. b, same results were observed for most samples for 4 independent repeats. T1, T2, T4 and T7 were positive 2, 3, 1 and 1 time out of 4 total repeats, respectively. c, same results were observed for most samples for two independent repeats. D3 and D7 were positive 1 time out of 4 total repeats.
Extended Data Fig. 3 |. cbDVg+ patients in the non-hospitalized group were sampled earlier than that in the hospitalized group.
In Cohort 2, there are 73 non-hospitalized patients and 27 hospitalized patients. Days post the onset of symptoms were recorded at the time of sampling. Within cbDVG+ patients, days post the onset of symptoms was compared between non-hospitalized group and hospitalized group. Data are shown as mean±SEM. Significance upon two-tailed Mann-Whitney test.
Extended Data Fig. 4 |. Cut off i and iii for early appearance of cbDVgs were also associated with lower viral loads and disease severity scores in experimentally infected subjects.
Kinetics of viral load (a) and disease severity score (b) among negative (n=38), Early (cutoff I n=3; cutoff III n=11), and Late (cutoff I n=15; cutoff III n=7) groups were compared. Data are plotted over time and trendline represents mean±SEM. Significant P value for two-way ANOVA with Bonferroni post hoc test are indicated for Early vs Late groups. Best-fit curves for kinetics of disease severity scores from negative, Early, and Late groups were calculated using nonlinear Gaussian model (c). The best-fit values for amplitude of the negative, Early and Late group curves were compared.
Extended Data Fig. 5 |. Viral load is not the sole viral factor that impact rSV disease severity.
a, Total viral load and total disease severity score were compared between cbDVG+ (n=18) and cbDVG- (n=38) individuals in Cohort 3. Data are shown as mean±s.e.m. b, Total viral load and total disease severity scores were correlated within cbDVG+ (n=17) and cbDVG- (n=37) group separately in Cohort 3. One outlier in each group was eliminated upon testing using Grubbs’ test in Prism. P value was tested from the correlation between total clinical scores and viral load using nonparametric spearman correlation. Dashed line represent the 95% confidence for the slopes. c, In Cohort 2, viral load was compared between non-hospitalized (n=73) and hospitalized (n=27) individuals. Data are shown as mean±s.e.m. No significance upon two-tailed Mann-Whitney test.
Extended Data Fig. 6 |. impact of sex and age on cbDVg generation in different cohorts.
In Cohort 3, a, the percentage of female and male patients within the cbDVG+ (11:7 ratio) and cbDVG- (10:28 ratio) groups were compared with the percentage of female subjects shown within the bars. (b-c) showing the comparison of viral load (b) and disease severity (c) between females (n=21) and males (n=35). Data are shown as mean±s.e.m. In Cohort 1, (d) the percentage of female and male patients within the cbDVG+ (52:48 ratio) and cbDVG- (6:16) groups were compared with the percentage of female subjects shown within the bars. (e-f) showing the comparison of viral load (e) and length of stay (f) between females (n=56, n=58) and males (n=62, n=64). Data are shown as mean±s.e.m. g, Age was compared between cbDVG+ (n=100) and cbDVG- (n=22) patients. Data are shown as mean±s.e.m. Significance upon Mann-Whitney test.
Supplementary Material
Acknowledgements
For the Cohort 1 study, we thank DBMI for pulling the data from the data warehouse and S. Worthen and S. Masters for IRB approval and grant support. We thank D. P. Beiting for the help of host transcriptome analysis. We also thank V. Bernhauerova for the help with statistics. Funding was received from NIH R01 AI137092 and R01 AI137062 for C.B.L., NIH U19 AI095227, UL1 RR024975 and K24 AI077930 for T.H., and the Medical Research Council (G0902266) and Wellcome Trust (087805/Z/08/Z) for C.C. C.C. is supported by the Biomedical Research Centre award to Imperial College Healthcare NHS Trust. Infrastructure support for C.C. was provided by the NIHR Imperial Biomedical Research Centre and the NIHR Imperial Clinical Research Facility. The views expressed are those of the authors and not necessarily those of the NHS, the NIHR or the Department of Health and Social Care.
Peer review information Nature Microbiology thanks Shirit Einav and the other, anonymous, reviewer(s) for their contribution to the peer review of this work. Peer reviewer reports are available.
Footnotes
Competing interests
The authors declare no competing interests.
Additional information
Extended data is available for this paper at https://doi.org/10.1038/s41564-021-00882-3.
Supplementary information The online version contains supplementary material available at https://doi.org/10.1038/s41564-021-00882-3.
References
- 1.Hall CB et al. The burden of respiratory syncytial virus infection in young children. N. Engl. J. Med. 360, 588–598 (2009). [DOI] [PMC free article] [PubMed] [Google Scholar]
- 2.Pneumonia Etiology Research for Child Health (PERCH) Study Group. Causes of severe pneumonia requiring hospital admission in children without HIV infection from Africa and Asia: the PERCH multi-country case–control study. Lancet 394, 757–779 (2019). [DOI] [PMC free article] [PubMed] [Google Scholar]
- 3.Falsey AR, Hennessey PA, Formica MA, Cox C & Walsh EE Respiratory syncytial virus infection in elderly and high-risk adults. N. Engl. J. Med. 352, 1749–1759 (2005). [DOI] [PubMed] [Google Scholar]
- 4.Shi T et al. Global, regional, and national disease burden estimates of acute lower respiratory infections due to respiratory syncytial virus in young children in 2015: a systematic review and modelling study. Lancet 390, 946–958 (2017). [DOI] [PMC free article] [PubMed] [Google Scholar]
- 5.Meissner HC et al. Immunoprophylaxis with palivizumab, a humanized respiratory syncytial virus monoclonal antibody, for prevention of respiratory syncytial virus infection in high risk infants: a consensus opinion. Pediatr. Infect. Dis. J. 18, 223–231 (1999). [DOI] [PubMed] [Google Scholar]
- 6.Schmidt R et al. Palivizumab in the prevention of severe respiratory syncytial virus infection in children with congenital heart disease; a novel cost–utility modeling study reflecting evidence-based clinical pathways in Spain. Health Econ. Rev. 7, 47 (2017). [DOI] [PMC free article] [PubMed] [Google Scholar]
- 7.Cai W et al. Risk factors for hospitalized respiratory syncytial virus disease and its severe outcomes. Influenza Other Respir Viruses 14, 658–670 (2020). [DOI] [PMC free article] [PubMed] [Google Scholar]
- 8.Garofalo RP et al. Macrophage inflammatory protein-1alpha (not T helper type 2 cytokines) is associated with severe forms of respiratory syncytial virus bronchiolitis. J. Infect. Dis. 184, 393–399 (2001). [DOI] [PubMed] [Google Scholar]
- 9.Geerdink RJ, Pillay J, Meyaard L & Bont L Neutrophils in respiratory syncytial virus infection: a target for asthma prevention. J. Allergy Clin. Immunol. 136, 838–847 (2015). [DOI] [PMC free article] [PubMed] [Google Scholar]
- 10.Heinonen S et al. Immune profiles provide insights into respiratory syncytial virus disease severity in young children. Sci. Transl. Med. 12, eaaw0268 (2020). [DOI] [PubMed] [Google Scholar]
- 11.Hull J, Thomson A & Kwiatkowski D Association of respiratory syncytial virus bronchiolitis with the interleukin 8 gene region in UK families. Thorax 55, 1023–1027 (2000). [DOI] [PMC free article] [PubMed] [Google Scholar]
- 12.Resch B, Kurath S & Manzoni P Epidemiology of respiratory syncytial virus infection in preterm infants. Open Microbiol. J. 5, 135–143 (2011). [DOI] [PMC free article] [PubMed] [Google Scholar]
- 13.Buckingham SC, Bush AJ & Devincenzo JP Nasal quantity of respiratory syncytical virus correlates with disease severity in hospitalized infants. Pediatr. Infect. Dis. J. 19, 113–117 (2000). [DOI] [PubMed] [Google Scholar]
- 14.DeVincenzo JP, El Saleeby CM & Bush AJ Respiratory syncytial virus load predicts disease severity in previously healthy infants. J. Infect. Dis. 191, 1861–1868 (2005). [DOI] [PubMed] [Google Scholar]
- 15.Fodha I et al. Respiratory syncytial virus infections in hospitalized infants: association between viral load, virus subgroup, and disease severity. J. Med. Virol. 79, 1951–1958 (2007). [DOI] [PubMed] [Google Scholar]
- 16.Garcia-Maurino C et al. Viral load dynamics and clinical disease severity in infants with respiratory syncytial virus infection. J. Infect. Dis. 219, 1207–1215 (2019). [DOI] [PMC free article] [PubMed] [Google Scholar]
- 17.Hall CB et al. Occurrence of groups A and B of respiratory syncytial virus over 15 years: associated epidemiologic and clinical characteristics in hospitalized and ambulatory children. J. Infect. Dis. 162, 1283–1290 (1990). [DOI] [PubMed] [Google Scholar]
- 18.Hasegawa K et al. Respiratory syncytial virus genomic load and disease severity among children hospitalized with bronchiolitis: multicenter cohort studies in the United States and Finland. J. Infect. Dis. 211, 1550–1559 (2015). [DOI] [PMC free article] [PubMed] [Google Scholar]
- 19.Thielen BK et al. Summer outbreak of severe RSV-B disease, Minnesota, 2017 associated with emergence of a genetically distinct viral lineage. J. Infect. Dis. 222, 288–297 (2020). [DOI] [PMC free article] [PubMed] [Google Scholar]
- 20.Piedra FA et al. The interdependencies of viral load, the innate immune response, and clinical outcome in children presenting to the emergency department with respiratory syncytial virus-associated bronchiolitis. PLoS ONE 12, e0172953 (2017). [DOI] [PMC free article] [PubMed] [Google Scholar]
- 21.Tapia K et al. Defective viral genomes arising in vivo provide critical danger signals for the triggering of lung antiviral immunity. PLoS Pathog. 9, e1003703 (2013). [DOI] [PMC free article] [PubMed] [Google Scholar]
- 22.Sun Y et al. Immunostimulatory defective viral genomes from respiratory syncytial virus promote a strong innate antiviral response during infection in mice and humans. PLoS Pathog. 11, e1005122 (2015). [DOI] [PMC free article] [PubMed] [Google Scholar]
- 23.Lazzarini RA, Keene JD & Schubert M The origins of defective interfering particles of the negative-strand RNA viruses. Cell 26, 145–154 (1981). [DOI] [PubMed] [Google Scholar]
- 24.Leppert M, Kort L & Kolakofsky D Further characterization of sendai virus DI-RNAs: a model for their generation. Cell 12, 539–552 (1977). [DOI] [PubMed] [Google Scholar]
- 25.Perrault J in Initiation Signal in Viral Gene Expression (ed. Shatkin AJ) 151–207 (Springer, 1981). [Google Scholar]
- 26.Huang AS & Baltimore D Defective viral particles and viral disease processes. Nature 226, 325–327 (1970). [DOI] [PubMed] [Google Scholar]
- 27.Henle W & Henle G Interference of inactive virus with the propagation of virus of influenza. Science 98, 87–89 (1943). [DOI] [PubMed] [Google Scholar]
- 28.Von Mangus P Propagation of the PR8 strain of influenza A virus in chick embryos. II. The formation of incomplete virus following inoculation of large doses of seed virus. Acta Pathol. Microbiol. Scand. 28, 278–293 (1951). [DOI] [PubMed] [Google Scholar]
- 29.Von Magnus P Incomplete forms of influenza virus. Adv. Virus Res. 2, 59–79 (1954). [DOI] [PubMed] [Google Scholar]
- 30.Lopez CB Defective viral genomes: critical danger signals of viral infections. J. Virol. 88, 8720–8723 (2014). [DOI] [PMC free article] [PubMed] [Google Scholar]
- 31.Weber M & Weber F RIG-I-like receptors and negative-strand RNA viruses: RLRly bird catches some worms. Cytokine Growth Factor Rev. 25, 621–628 (2014). [DOI] [PMC free article] [PubMed] [Google Scholar]
- 32.Sun Y et al. A specific sequence in the genome of respiratory syncytial virus regulates the generation of copy-back defective viral genomes. PLoS Pathog. 15, e1007707 (2019). [DOI] [PMC free article] [PubMed] [Google Scholar]
- 33.Habibi MS et al. Impaired antibody-mediated protection and defective IgA B-cell memory in experimental infection of adults with respiratory syncytial virus. Am. J. Respir. Crit. Care Med. 191, 1040–1049 (2015). [DOI] [PMC free article] [PubMed] [Google Scholar]
- 34.Vasilijevic J et al. Reduced accumulation of defective viral genomes contributes to severe outcome in influenza virus infected patients. PLoS Pathog. 13, e1006650 (2017). [DOI] [PMC free article] [PubMed] [Google Scholar]
- 35.Uusitupa E, Waris M & Heikkinen T Association of viral load with disease severity in outpatient children with respiratory syncytial virus infection. J. Infect. Dis. 222, 298–304 (2020). [DOI] [PubMed] [Google Scholar]
- 36.Martin ET, Kuypers J, Wald A & Englund JA Multiple versus single virus respiratory infections: viral load and clinical disease severity in hospitalized children. Influenza Other Respir. Viruses 6, 71–77 (2012). [DOI] [PMC free article] [PubMed] [Google Scholar]
- 37.Franz A et al. Correlation of viral load of respiratory pathogens and co-infections with disease severity in children hospitalized for lower respiratory tract infection. J. Clin. Virol. 48, 239–245 (2010). [DOI] [PMC free article] [PubMed] [Google Scholar]
- 38.Jansen RR et al. Quantitation of respiratory viruses in relation to clinical course in children with acute respiratory tract infections. Pediatr. Infect. Dis. J. 29, 82–84 (2010). [DOI] [PubMed] [Google Scholar]
- 39.Shi T et al. Risk factors for respiratory syncytial virus associated with acute lower respiratory infection in children under five years: systematic review and meta-analysis. J. Glob. Health 5, 020416 (2015). [DOI] [PMC free article] [PubMed] [Google Scholar]
- 40.van Elden LJ et al. Applicability of a real-time quantitative PCR assay for diagnosis of respiratory syncytial virus infection in immunocompromised adults. J. Clin. Microbiol. 41, 4378–4381 (2003). [DOI] [PMC free article] [PubMed] [Google Scholar]
- 41.Larkin EK et al. Objectives, design and enrollment results from the infant susceptibility to pulmonary infections and asthma following RSV exposure study (INSPIRE). BMC Pulm. Med. 15, 45 (2015). [DOI] [PMC free article] [PubMed] [Google Scholar]
- 42.Rodriguez H, Hartert TV, Gebretsadik T, Carroll KN & Larkin EK A simple respiratory severity score that may be used in evaluation of acute respiratory infection. BMC Res. Notes 9, 85 (2016). [DOI] [PMC free article] [PubMed] [Google Scholar]
- 43.Jozwik A et al. RSV-specific airway resident memory CD8+ T cells and differential disease severity after experimental human infection. Nat. Commun. 6, 10224 (2015). [DOI] [PMC free article] [PubMed] [Google Scholar]
- 44.Jackson GG, Dowling HF, Spiesman IG & Boand AV Transmission of the common cold to volunteers under controlled conditions. I. The common cold as a clinical entity. Arch. Intern Med 101, 267–278 (1958). [DOI] [PubMed] [Google Scholar]
- 45.Perkins SM et al. Comparison of a real-time reverse transcriptase PCR assay and a culture technique for quantitative assessment of viral load in children naturally infected with respiratory syncytial virus. J. Clin. Microbiol. 43, 2356–2362 (2005). [DOI] [PMC free article] [PubMed] [Google Scholar]
- 46.Rennard SI et al. Estimation of volume of epithelial lining fluid recovered by lavage using urea as marker of dilution. J. Appl. Physiol. (1985) 60, 532–538 (1986). [DOI] [PubMed] [Google Scholar]
- 47.Amorim CF et al. Variable gene expression and parasite load predict treatment outcome in cutaneous leishmaniasis. Sci. Transl. Med. 11, eaax4204 (2019). [DOI] [PMC free article] [PubMed] [Google Scholar]
- 48.Turi KN et al. Infant viral respiratory infection nasal immune-response patterns and their association with subsequent childhood recurrent wheeze. Am. J. Respir. Crit. Care Med. 198, 1064–1073 (2018). [DOI] [PMC free article] [PubMed] [Google Scholar]
Associated Data
This section collects any data citations, data availability statements, or supplementary materials included in this article.
Supplementary Materials
Data Availability Statement
All data associated with this study are present in the paper or the supplementary materials. Raw sequence data are deposited on SRA or GEO (Fig.1, PRJNA681672; Fig.2 and S1A, GSE146925 and Fig.6, GSE166161). Source data are provided with this paper.


