Abstract
This paper shows the surface quality results after finishing milling of AZ91D and AZ31 magnesium alloys. The study was performed for variable technological parameters: cutting speed, feed per tooth, axial depth of cut and radial depth of cut. The tools used in the study were two carbide cutters with a different tool cutting edge helix angle. The measurement of the research results presented the surface roughness parameters was made on the lateral faces and the end faces of the specimens. Statistical analysis and simulations using artificial neural networks were carried out with the Statistica software. The normality of the distribution was examined, and the hypotheses of the equality of mean values and variance were verified. For the AZ91D magnesium alloy on the lateral and the end faces (Ra, Rz parameters), simulations were carried out. Two types of ANN were used: MLP (Multi-layered perceptron) and RBF (Radial Basis Function). To increase the machining stability and to obtain a high surface finish, the more suitable tool for finishing milling is the tool with a helix angle of λs = 20°. Artificial neural networks have been shown to be a good tool for predicting surface roughness parameters of magnesium alloys after finishing milling.
Keywords: finishing milling, magnesium alloys, surface roughness, artificial neural networks, statistical analysis
1. Introduction
In finish machining, the standard and final requirement is the production of parts with a precise shape, specific dimensions and high-quality surface. The ultimate objective is to make milling the final machining operation, thus eliminating, e.g., the process of finish grinding that generates harmful grinding dust. The geometric structure created in this way is defined as the overall surface condition and is the final stage of the process of machining a given part.
The surface analysis is carried out by researchers around the world sometimes these studies concern analysis in terms of tribological properties and tribological wear [1] (through, inter alia, the application of protective layers [2]), or the analysis of the suitable tuning of the local composition and atomic arrangement to obtain excellent mechanical properties [3]. Another area of research related to surface analysis relates to the geometric structure of the surface, which consists of waviness, roughness, shape errors and structure directionality, whereas the surface quality includes the following, roughness, waviness and surface defects. It should be noted that the considered surface should be analysed, taking into account its functional and strength characteristics. Whereas the geometrical structure of the surface and the physical properties of the surface layer (including its structure, hardness and internal stress) constitute the so-called technical quality of the product [4,5].
One of the most frequently analysed and well-known surface roughness parameters (despite there being more than 30 of them) is the Ra parameter. Nevertheless, it does not provide information on the shape of the profile and individual peaks that only slightly affect the value of this parameter. Since the parameter is an absolute value, it does not include the valleys or peaks of the profile. The second most common parameter used in production workshops for checking surface quality is the highest roughness profile height—Rz. This parameter partially includes individual valleys or peaks, so it should be mainly analysed and taken into consideration in the case of bearing or sliding surfaces and measurement surfaces [4].
Together with the Rz parameter, the Rp and Rv parameters should be analysed. The Rp parameter provides information about the profile outline and the abrasion resistance of the tested surface. A surface with lower abrasion resistance is characterised by higher Rp values compared to the Rv values. In addition to the Ra parameter, the Rq parameter can be analysed due to its greater sensitivity to individual single valleys or peaks. However, it is impossible to analyse the distribution of peaks, and, as in the case of Ra, the parameters do not include information on whether the profile is characterised by peaks or valleys. Quite simplified, it can be assumed that for a profile of a random nature, this relationship can be defined as Rq ≈ 1.25 Ra [5].
The significant parameters that allow the analysis of the surface functionality are the roughness profile asymmetry coefficient Rsk and the roughness profile slope coefficient Rku [6]. These coefficients require a series of measurements, but they play an important role in monitoring the technological process, and they are useful for detecting surface defects. A surface with negative skewness is characterised by a greater frequency of deep valleys, defined as a plateau, and is considered optimal. The symmetric distribution of the profile is reflected by zero skewness. Rsk can be used to monitor conductivity, keep lubricants and support technological process analysis. Moreover, surfaces with a positive Rsk show good adhesion resistance. In the case of Rku, high values (above 3) indicate the presence of sharp peaks and grooves, while values below 3 indicate that the peaks and grooves are rounded. In conditions without the use of lubricant, it was shown that surfaces with a high Rku value and a positive Rsk value should result in a lower static friction coefficient compared to surfaces with Rku = 3, Rsk = 0 [7]. In addition to the traditional measurements of surface roughness, more and more often, there are works devoted to alternative methods of determining the surface structure, e.g., multi-scale methods [8,9]. These methods make it possible to analyse surfaces with even greater accuracy and detail. Their use allows for additional improvement of the quality of manufactured elements. Among these methods can be distinguished, among others, the Wavelet transformation, which enables the evaluation of the surface structure on the basis of the signals obtained during the measurements. Since the signals largely contain noise and interference, it is necessary to develop appropriate solutions to minimise them [10]. For example, in the work of Gogolewski et al., the images registered with the optical measuring instruments were decomposed using the two-dimensional wavelet transform to determine the minimum chip thickness in face milling [11]. However, multi-scale methods are quite a new solution; therefore, the use of commonly known surface roughness parameters compliant with the ISO standard allows for an easier understanding of the surface condition.
Both the surface roughness and the dimensional accuracy [12] are often important indicators in many manufacturing processes. It has been checked and proven that it is possible to achieve low values of roughness parameters (and thus a high quality final surface) after rough milling with cutters equipped with PCD inserts with Ra ≤ 0.16 µm [7]. Similarly, it has been observed that it is possible to obtain an IT2–IT5-level accuracy [12] with the use of high-quality carbide cutters with or without protective coatings. Similarly, when facing larger surfaces (e.g., the end face), it is possible to obtain the Ra parameter in the range of 0.2–0.8 µm for face milling cutters with PCD inserts. In this case, the Mg-Ca0.8 alloy was analysed [13]. Similar values of the Ra parameter (approx. 0.4 µm) were obtained with a combination of dry milling and low plasticity burnishing [14]. However, in subsequent research on the Mg-Ca0.8 alloy, [15] Ra at the level of approx. 0.9–1.4 μm in milling and Ra at the level of approx. 0.09–0.8 μm in inverse milling were obtained. In these tests, a face milling cutter with uncoated carbide inserts was used.
In other research works [16], the machinability of the Mg-Ca1.0 alloy was analysed. During milling, the Ra parameter obtained was at the level of approx. 0.08–0.16 μm. A face milling cutter with DLC coating (“diamond-like” coating) was used in the research tests. Whereas for milling the AM60 alloy, the Ra parameter obtained was at the level of approx. 0.3 µm [17]. Additionally, during the scientific research, the following was analysed: the geometry of the cutting tool edge and the presence or absence of protective coatings. In the analyses of different tool rake angles (γ = 5° and γ = 30°), the Ra obtained for γ = 5° was approx. 0.5 µm (γ = 5°, end face of specimen), while the Ra obtained for γ = 30° was approx. 2 µm (γ = 30°, end face of specimen). The value of the Ra parameter on the lateral face of the specimen was approx. 0.3 µm. The research was carried out for the rough milling of AZ91D alloy [18]. The protective coatings used in the research work include: TiN coatings [17], TiAlN [19], TiB2 [12] and TiAlCN.
Based on the professional literature, it can be noticed that in terms of modelling, scientists most often conduct research in the field of optimisation and prediction of surface roughness using, among others, the Multiple Regression Technique [20,21,22], Taguchi Analysis [23,24,25] or Artificial Neural Networks [26,27,28]. Based on the works related to the use of ANNs given in Table 1, it can be concluded that the research works conducted by scientists relate to various processes of turning, milling and abrasive water jet machining (AWJM). Various materials were analysed in these works, i.e., magnesium alloys [29,30,31,32], aluminium alloys [28,33,34,35,36,37], titanium alloys [26,38,39], nickel alloys [20], cobalt alloys [40] and steel [41,42].
Table 1.
Comparison of modelling methods using the ANN for the surface roughness parameter.
| Machining | Methods | Research Object (Surface Roughness) | Material | Year | Reference |
|---|---|---|---|---|---|
| turning | ANN | Ra | AZ61 | 2018 | [29] |
| turning | ANN-GA | Ra | Ti-6Al-4 V | 2015 | [26] |
| milling | ANFIS | Ra | AA6061, AA2024, AA7075 | 2019 | [37] |
| milling | ANN | Ra | Ti–6Al–4 V | 2016 | [38] |
| milling | ANN | Ra | S45C steel | 2019 | [41] |
| milling | ANN | Ra | AA6061 | 2021 | [35] |
| milling | ANN | Ra, Rz, RSm | AZ91D | 2021 | [30] |
| milling | ANN | Ra | Ti-6Al-4 V | 2019 | [39] |
| milling | ANN | Ra, Rz | Inconel 718 | 2020 | [20] |
| milling | ANN-GA | Ra | P1.2738 | 2020 | [42] |
| milling | ANN-GA | Ra | AISI D3 | 2019 | [36] |
| milling | ANN-GA | Ra | AZ91D | 2018 | [31] |
| Low-speed turning | ANN | Ra | AISI316 | 2015 | [33] |
| dry turning | ANN | Ra, Rz, Rt | AISI 420 | 2019 | [28] |
| dry milling | ANN | Ra | Co–28Cr–6Mo, Co–20Cr–15W–10Ni | 2021 | [40] |
| AWJM | ANN | Ra, Rz, RSm | AZ91D | 2018 | [32] |
| AWJM | ANN-GA | Ra | Al 6060 | 2016 | [34] |
Based on the comparison of modelling methods using ANNs for the surface roughness parameter, it is clearly seen that researchers in the field of turning and milling primarily deal with modelling only one surface roughness parameter, which is the Ra parameter. It seems that such a narrow scope of research is insufficient to carry out a detailed analysis of surface conditions, as mentioned above. Few researchers have attempted to model more than one parameter. One of such works is the study by Zerti et al. [28], who performed dry turning simulations and extended their analyses with the Rz and Rt parameters. Moreover, the authors of this study [30] performed surface roughness tests (Ra, Rz, RSm) after milling AZ91D magnesium alloy using PCD inserts.
Based on the analysis of the literature on the machinability of magnesium alloys and the possibility of modelling roughness parameters, it can be concluded that:
-
-
thanks to excellent properties and good machinability, the use of magnesium alloys is constantly expanded, especially where high mechanical strength and low specific weight are needed,
-
-
it is justified to extend the research to expand the range of the technological parameters; however, one should take into account the tendency of magnesium alloys to spontaneous combust with a sudden increase in temperature,
-
-
surface roughness is estimated using a small number of parameters, usually Ra and Rz—there is no wider analysis of a larger group of surface roughness parameters, including a more detailed analysis of the features and operational properties of the machined surface,
-
-
the research works conducted so far have referred only to roughing.
Therefore, the aim of this study is to determine the 2D surface roughness for AZ91D and AZ31 magnesium alloys after finish milling. The influence of the change of machining parameters and the change of the helix angle was analysed. The fact that there is no publication on the finish machining of magnesium alloys, which would constitute a significant supplement to the previous research works usually focused on the conditions of high-speed, effective roughing, can be considered a novelty.
2. Materials and Methods
2.1. Testing Methodology
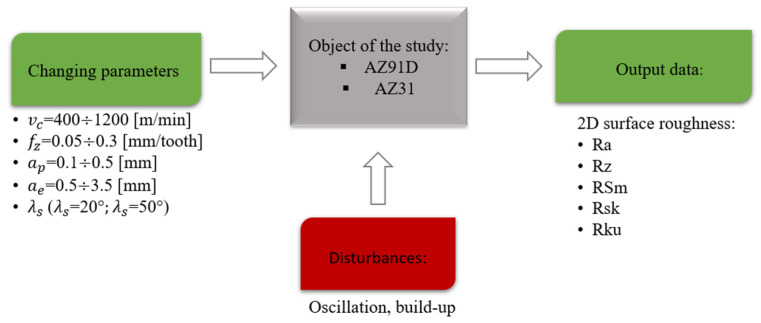
The object of the research was two magnesium alloys: AZ91D and AZ31. Milling was carried out in three sets of cutting parameters for both the lateral face and the end face of the tested samples, in the following ranges: cutting speed vc = 400–1200 m/min, feed per tooth fz = 0.05–0.3 mm/tooth, axial depth of cut ap = 0.1–0.5 mm and radial depth of cut ae = 0.5–3.5 mm. The surface roughness parameters analysed were: Ra, Rz, RSm, Rsk and Rku. Two carbide cutters were applied in the research:
-
-
triple-edge milling cutter: Ø16 mm, tool cutting edge helix angle λs = 20°, tool rake angle γ = 12°, tool clearance angle α = 8°,
-
-
triple-edge milling cutter: Ø16 mm, tool cutting edge helix angle λs = 50°, tool rake angle γ = 15°, tool clearance angle α = 8°.
The choice of tools was determined by verifying the influence of the tool cutting edge helix angle (inclination angle) on the surface roughness. The research schematic diagram of the test set-up is given in Figure 1.
Figure 1.
Research schematic diagram of the test set-up.
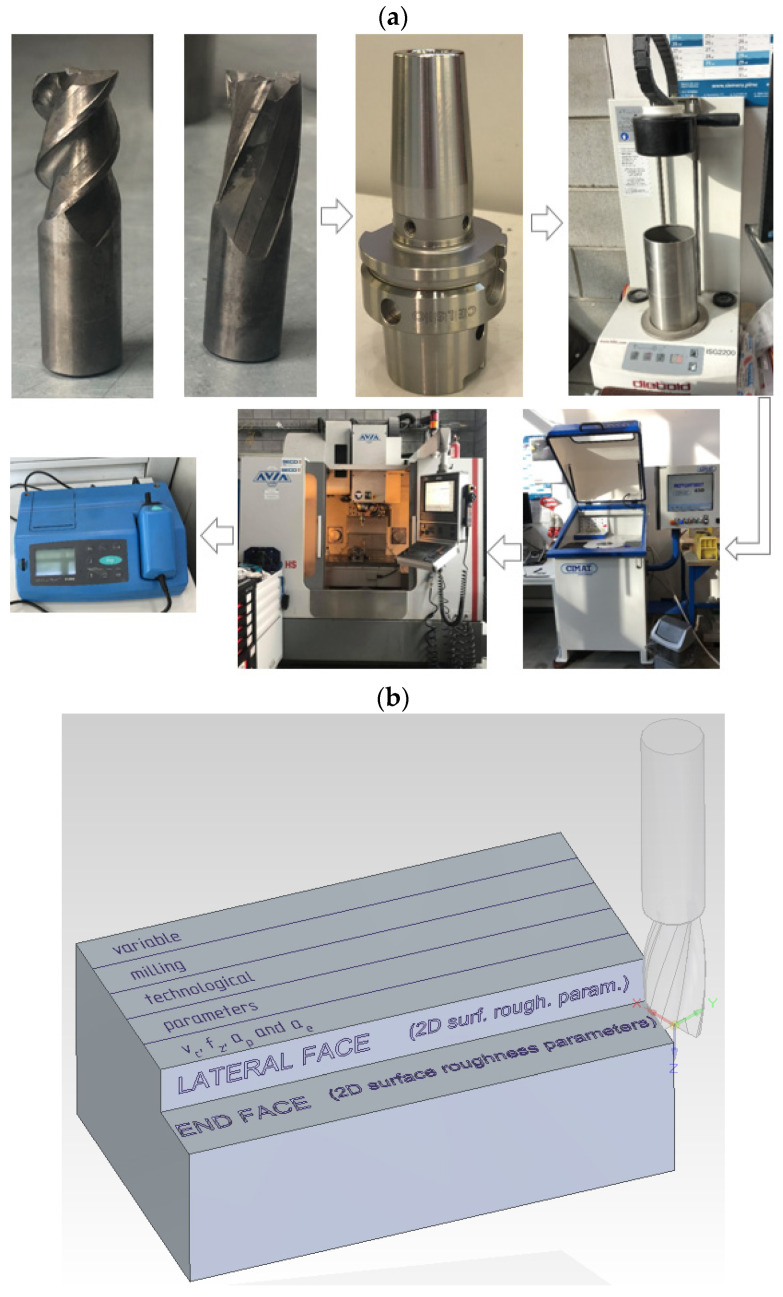
The cutters were mounted into a CELSIO HSK-A63 16 × 95 tool holder from SCHUNK (Lauffen am Neckar, Germany) using an ISG 2200 shrink fit tool holder machine from H. Diebold GmbH & CO (Jungingen, Germany). The tool with the holder was balanced dynamically by a CIMAT RT 610 balancing machine (Bydgoszcz, Poland), according to ISO 21940–11:2016 balancing class G 2.5. The measured value of the residual unbalance was 0.25 gmm. Milling was performed on an AVIA VMC 800 HS-type vertical machining centre, equipped with the Heidenhain iTNC 530 control system, with a maximum spindle speed of 24,000 rpm. The schematic diagram of the test stand is given in Figure 2. Figure 2a presents the object of the study. Figure 2b shows the visualisation with the roughness measurement model. The quality of the end face and the lateral face of the AZ31 and AZ91D magnesium alloys specimens was described using 2D roughness parameters.
Figure 2.
Schematic diagram of the test stand: (a) object of the study, and (b) visualisation with the roughness measurement model on the end face and the lateral face of the magnesium alloys specimens.
The surface roughness measurements were carried out using a HOMMEL TESTER T1000 contact profilometer from ITA K Pollak M Wieczorowski Sp. J. (Poznań, Poland). The measurement parameters were: traverse length lt = 4.8 mm, sampling length lr = 0.8 mm, scanning rate vt = 0.5 mm/s and measuring range/resolution M = ±320 µm/0.04 µm. Each measurement was repeated five times on each surface towards the assessment of the mean values and standard deviation.
2.2. Statistical Analysis Methodology
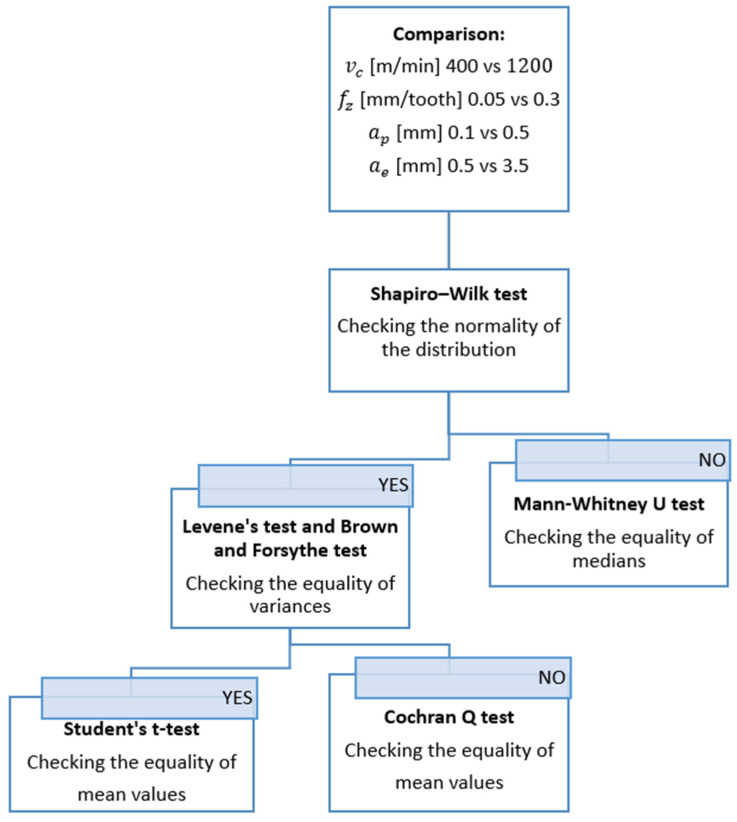
The data obtained from the roughness measurements were subjected to statistical verification. The output data obtained in the study were treated as independent, quantitative variables. The significance level of α = 0.05 was assumed. The normality of distribution was examined, and the hypotheses of the equality of mean values and variance were verified. The fulfilment of specified assumptions regarding the data was the basis for the decision to select the test [43]. In selecting the appropriate statistical test to assess the truth of the hypothesis, a simplified scheme was used, which is given in Figure 3. All statistical tests were performed using the Statistica 13.3 software (TIBCO Software Inc., Palo Alto, CA, USA).
Figure 3.
Statistical test selection scheme [43].
Firstly, the Shapiro–Wilk test was performed to examine the normality of the distribution [43]. The null hypothesis and the alternative hypothesis were as follows:
-
-
H0: The distributions are not different from the normal distribution in a statistically significant way,
-
-
H1: The distributions are different from the normal distribution in a statistically significant way.
When the normality condition was not met, the Mann–Whitney U test was employed for further verification. The Mann–Whitney U test is used to check the equality of the medians [43]. The null hypothesis and the alternative hypothesis were as follows:
| (1) |
| (2) |
If the case with normal distribution was confirmed, the hypothesis of equality of variances was checked by Levene’s test and the Brown–Forsythe test [36]. The null hypothesis and the alternative hypothesis were as follows:
| (3) |
| (4) |
In two cases, the hypothesis about the equality of mean values was verified. In the absence of grounds for rejecting the null hypothesis, Student’s t-test was used to verify the hypothesis of the equality of mean values. If the condition of homogeneity of variance had not been met, the Cochran’s Q test would have been used to verify the hypothesis of the equality of mean values [43]. The null hypothesis and the alternative hypothesis were as follows:
| (5) |
| (6) |
2.3. Artificial Neural Network Methodology
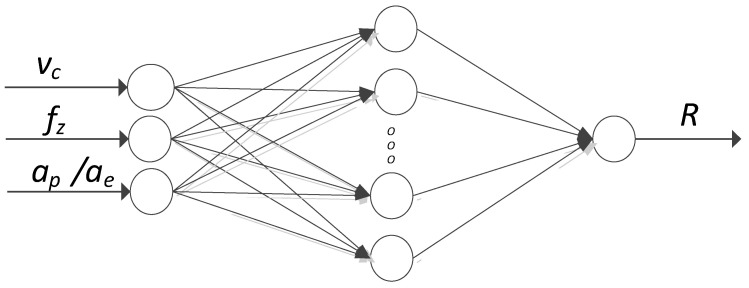
For the AZ91D magnesium alloy on the lateral and the end faces (Ra, Rz parameters), simulations were carried out using artificial neural networks. The scheme of the artificial neural networks is shown in Figure 4, where R in the output denotes the corresponding surface roughness parameter: ap axial or ae radial depth of cut [30].
Figure 4.
Artificial neural networks scheme.
The input layer consists of input neurons that are equal to the number of input data: cutting speed vc, feed per tooth fz and axial depth of cut ap for data obtained from the surface roughness measurements on the end face of the tested sample. For the lateral surface, the variable factors were cutting speed vc, feed per tooth fz and radial depth of cut ae.
Two types of ANN were used: MLP (Multi-layered perceptron) and RBF (Radial Basis Function). The possible activation functions used in the MLP model are as follows: linear, logistic, tanh, exponential, sine. The MLP model was trained using the BFGS learning algorithm. The RBF network model was trained with the RBFT algorithm and included the following activation functions: hidden neurons—Gaussian distribution, output neurons—linear function.
The number of random samples was as follows: 75% training, 25% validation and testing was overlooked due to the small amount of all data sets [44].
Moreover, the following parameters were experimentally determined: the number of hidden neurons (2–10) and the number of epochs (150–300). The assessment of individual networks was executed on the basis of a comparison of the training quality, the quality of validation and the learning error determined by the least-squares method [45].
2.4. Objective of Research and Novelties
The presented work presents an analysis of the surface roughness after finish milling. The analysis of the literature shows that the vast majority of scientific publications concern the rough milling of magnesium alloys. Thus, the proposed research topic is innovative and new in the sense of originality of the scientific goal. One machinability factor is analysed in this work, namely the roughness of the 2D surface. This indicator is particularly important in the production processes of workpieces, both for scientific and cognitive reasons, as well as the possibility of implementing the presented research results (ranges of machining parameters) in industrial plants dealing with the subject of magnesium alloys machining. Moreover, after the analysis of the literature, it can be concluded that many researchers were mainly concerned with the analysis of the basic parameters of surface roughness, both 2D and 3D, ignoring the aspect of maintenance features of the treated surface. This state of affairs is definitely insufficient, hence the proposal to analyse additional roughness parameters, such as RSm, Rsk and Rku. It is a challenge of some kind to be able to predict specific performance properties of the parts produced on the basis of the roughness parameters correlated with the functional properties of the surface. Apart from the main goal (defining the influence of cutting parameters on the change of roughness parameters), the modelling of selected surface roughness parameters (Ra, Rz) can be presented as an additional goal in order to forecast these parameters.
Modelling the roughness parameters after milling can be the basis for creating tools helpful in the work of the technologist for determining the conditions of the machining process in order to obtain the assumed surface roughness. Thus far, no such works have been carried out after the finish milling of magnesium alloys. In addition, the use of, inter alia, artificial neural networks can contribute to the reduction of the number of research trials necessary for the selection and optimisation of the parameters of the technological process. Additionally, the conducted analysis may be interesting due to the universality and availability of both the tools (end mills) and the presented magnesium alloys.
3. Results and Discussion
3.1. Surface Roughness
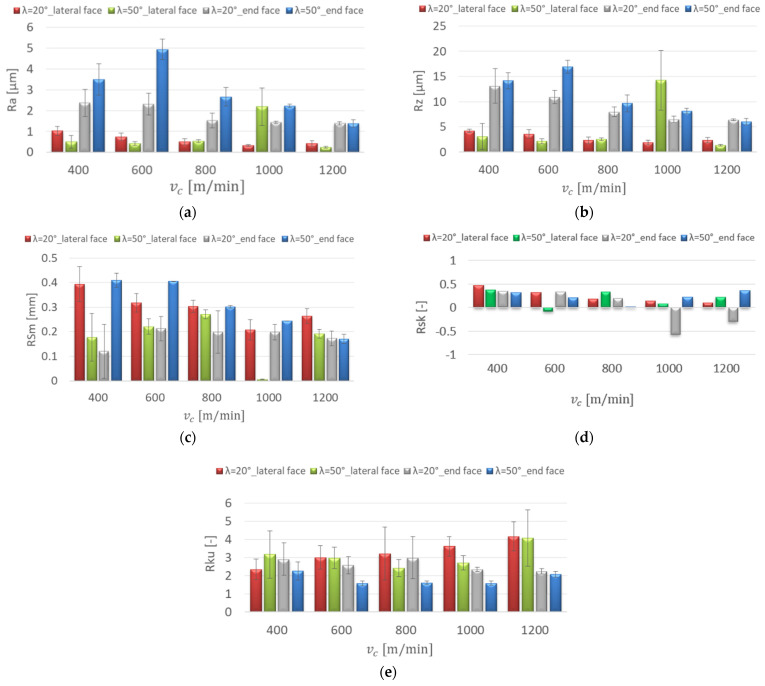
The surface roughness of AZ91D and AZ31 magnesium alloys after milling was analysed depending on the changes in technological parameter values and tools with different tool cutting edge helix angles. Figure 5 shows the influence of the cutting speed on the roughness parameters for the AZ91D magnesium alloy.
Figure 5.
Effect of cutting speed change on the surface roughness: (a) Ra, (b) Rz, (c) RSm, (d) Rsk, (e) Rku; fz = 0.15 mm/tooth, lateral face: ae = 2 mm, ap = 8 mm, end face: ae = 14 mm, ap = 0.3 mm.
The diagrams presented in Figure 5a,b prove that regardless of the tool used, an increase in cutting speed vc resulted in decreasing Ra and Rz values, especially in the cutting speed range 600–1200 m/min. The lowest value for the parameters Ra = 0.235 μm and Rz = 1.37 μm was obtained for the λs = 50° tool, with vc = 1200 m/min on the lateral face of the workpiece. The highest value of the parameters Ra = 4.941 μm and Rz = 16.95 μm was observed at vc = 600 m/min for the λs = 50° tool on the end face of the workpiece.
For the λs = 50° tool, the value of the RSm parameter on the lateral face at vc = 1000 m/min was 0.006 mm, which was much lower than the other values on the end face and for the λs = 20° tool, which ranged between 0.12 and 0.409 mm (Figure 5c). The value of the Rsk (skewness) below 0 is characterised by a higher frequency of deep valleys on the surface, which was obtained at higher cutting speeds: vc = 1000, 1200 m/min for the λs = 20° tool on the end face of the specimens and for the λs = 50° tool on the lateral face at vc = 600 m/min (Figure 5d). The distribution of profile roughness was close enough to the Gaussian distribution at the cutting speed vc = 600 m/min on the lateral face of the workpiece for the λs = 50° tool (Rku = 2.976) and for the λs = 20° tool (Rku = 3.007) and on the end face at vc = 800 m/min, the value of Rku was 2.991 (λs = 20°) (Figure 5e).
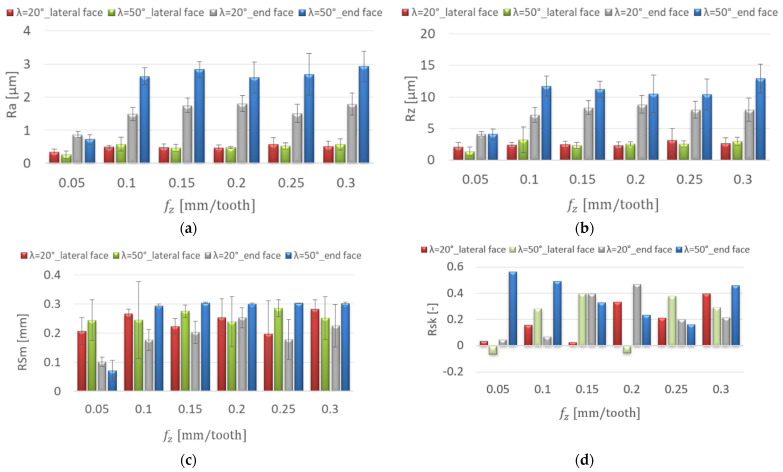
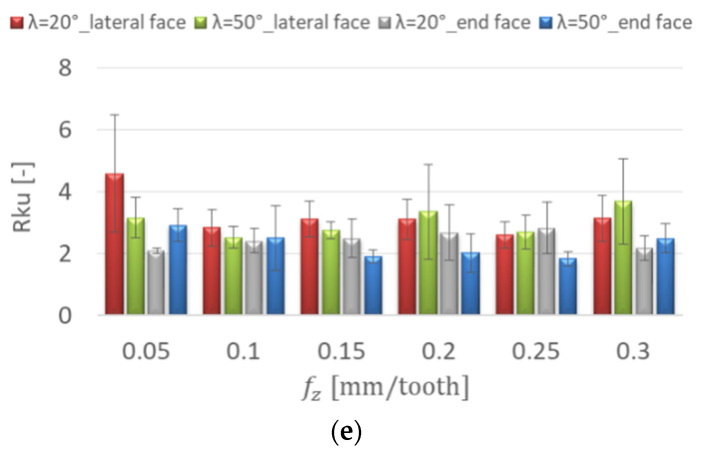
Figure 6 shows the effect of the feed per tooth change on the surface roughness for the AZ91D magnesium alloy. In the range of feed per tooth fz = 0.05–0.3 mm/tooth, lower Ra and Rz values were obtained on the lateral face, and their increase was not as pronounced as on the end face of the workpiece. The highest values of Ra = 2.924 μm and Rz = 12.9 μm were observed on the end face of the specimens for the λs = 50° tool at fz = 0.3 mm/tooth. On the lateral face, the cutting-edge helix angle of the tool did not have a significant influence on the Ra and the Rz values, which were similar and in the range of Ra = 0.259–0.578 μm and Rz = 1.36–3.23 μm. However, the lowest values of the Ra and Rz parameters were obtained at fz = 0.05 mm/tooth for the λs = 50° tool (Figure 6a,b). The values of the RSm parameter on the lateral face were in the range of 0.196–0.285 mm and showed insignificant change with increasing feed per tooth. On the end face of the workpiece (λs = 50° tool), a radical increase in RSm (by 0.223 mm) was observed with the change from fz = 0.05 to 0.1 mm/tooth (Figure 6c). On the lateral face, Rsk (skewness) had positive and negative values. The symmetric profile distribution is expressed as Rsk = 0. Positive values of the Rsk coefficient were obtained on the end faces. These surfaces are marked by good resistance to adhesion (Figure 6d). The values of the Rku coefficient showed insignificant change with the increase of the feed per tooth. Kurtosis values below 3 were obtained on the end face of the specimens. These surfaces were characterised by greatly rounded peaks and valleys, which resulted in an increase in the friction coefficient (Figure 6e).
Figure 6.
Effect of feed per tooth fz change on the surface roughness: (a) Ra, (b) Rz, (c) RSm, (d) Rsk, (e) Rku; vc = 800 m/min, lateral face: ae = 2 mm, ap = 8 mm, end face: ae = 14 mm, ap = 0.3 mm.
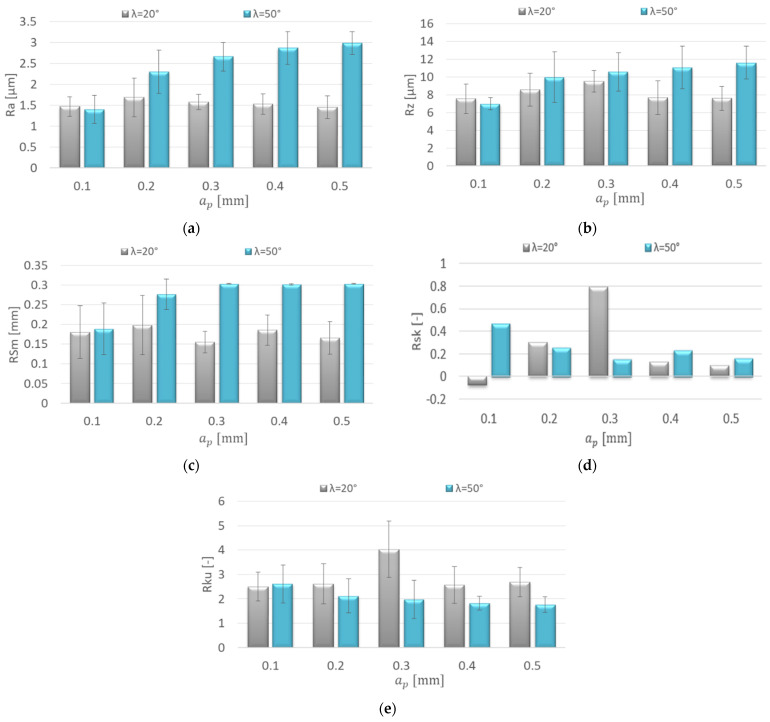
Figure 7 shows the effect of increasing the axial depth of cut ap on the roughness parameters for the AZ91D magnesium alloy. Similar values of the Ra parameter were obtained in the entire range of the axial depth of cut for the λs = 20° tool, which ranged from 1.453 to 1.687 μm. The axial depth of cut change also did not have a significant impact on the Rz parameter value (7.55–9.51 μm). With the range ap = 0.2–0.5 mm, for the λs = 50° tool, higher values of the mentioned parameters were obtained, which were in the following ranges: Ra = 1.402–2.987 μm and Rz = 6.96–11.6 μm (Figure 7a,b).
Figure 7.
Effect of axial depth of cut ap change on the surface roughness: (a) Ra, (b) Rz, (c) RSm, (d) Rsk, (e) Rku; vc = 800 m/min, fz = 0.15 mm/tooth, ae = 14 mm.
The increase in the axial depth of cut did not show a dramatic change in the values of the RSm parameter. For the λs = 20° tool, the RSm values ranged between 0.155 and 0.198 mm and were lower compared to the λs = 50° tool (0.189–0.303 mm). The differences in the values of the RSm parameter depending on the tool used were especially prevalent at ap = 0.2–05 mm (Figure 7c). In the entire range of the axial depth of cut, the Rsk (skewness) values are small, close to the symmetric distribution of the profile. Rsk was only higher compared to the others for the λs = 20° tool with ap = 0.3 mm; the discussed values do not exceed 0.8 (Figure 7d). Kurtosis values below 3 (Rku < 3) were obtained for almost the entire range of the axial depth of cut. The Rku value was only greater than 3 for the λs = 20° tool at ap = 0.3 mm (Figure 7e).
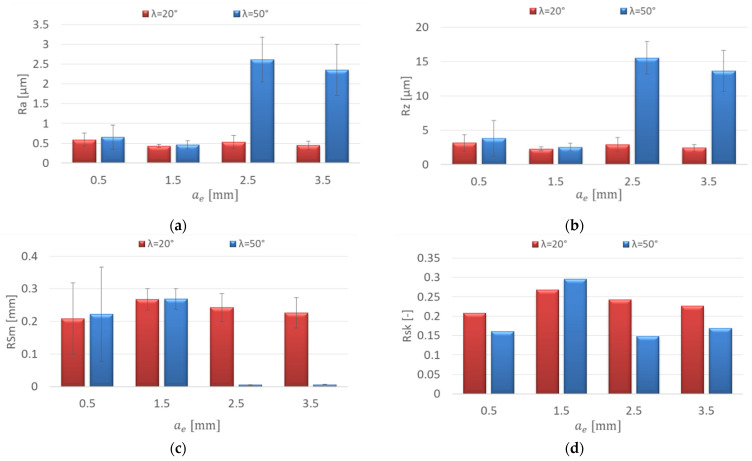
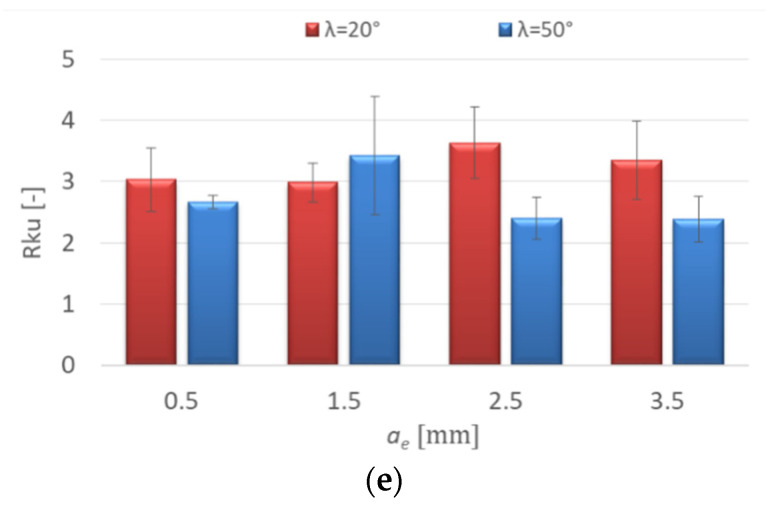
Figure 8 shows the influence of the increasing radial depth of cut ae on the roughness parameters for the AZ91D magnesium alloy. The research showed an insignificant effect of the increase in the radial depth of cut on the roughness parameters: Ra = 0.431–0.589 μm and Rz = 2.28–3.14 μm for the λs = 20° tool. On the other hand, for the λ = 50° tool, a dramatic increase in the Ra (by 2.151 μm) and Rz parameters (by 12.99 μm) was observed with the change of the radial depth of cut from ae = 1.5 to 2.5 mm. When increasing to ae = 3.5 mm, the parameter values did not change significantly (Figure 8a,b). For the λs = 20° tool, it was shown that the change in the radial depth of cut had a negligible effect on the RSm parameter values, which were in the range 0.208–0.268 mm. The values of the RSm parameter after milling with the λs = 50° tool with ae = 2.5–3.5 mm were several times lower than those obtained with smaller values of ae. (Figure 8c). Positive values of Rsk (skewness) were observed in the entire range of the radial depth of cut (Figure 8d). The kurtosis (Rku) values oscillated around 3 for both tools in the entire range of the radial depth of cut, which means that the distribution of the roughness profile corresponded to the Gaussian distribution (Rku = 2.381–3.633) (Figure 8e).
Figure 8.
Effect of radial depth of cut ae change on the surface roughness: (a) Ra, (b) Rz, (c) RSm, (d) Rsk, (e) Rku; vc = 800 m/min, fz = 0.15 mm/tooth, ap = 8 mm.
Figure 9 shows the influence of the cutting speed on the roughness parameters for the AZ31 magnesium alloy. For this alloy, the surface roughness was analysed with the extreme values of the cutting parameters.
Figure 9.
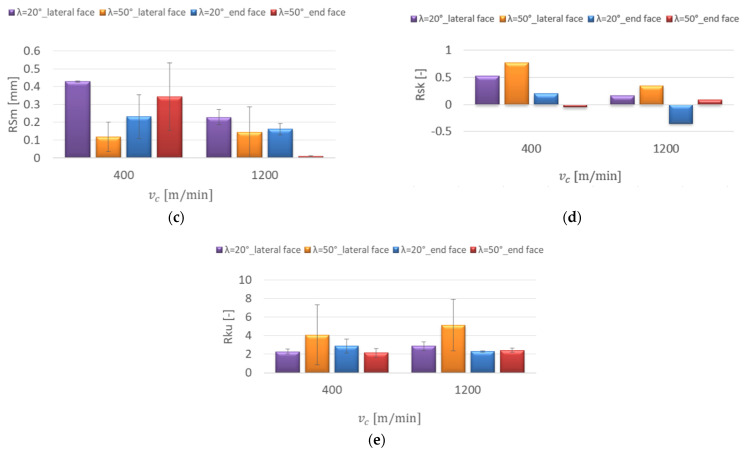
Effect of cutting speed change on the surface roughness: (a) Ra, (b) Rz, (c) RSm, (d) Rsk, (e) Rku; fz = 0.15 mm/tooth, lateral face: ae = 2 mm, ap = 8 mm, end face: ae = 14 mm, ap = 0.3 mm.
When analysing the effect of cutting speed vc, lower values were clearly observed at vc = 1200 m/min on the lateral and end faces for both tools. The greatest influence of the cutting speed increase on the values of the Ra and Rz parameters was apparent for the λs = 50° tool. With the cutting speed vc = 400 m/min, the highest values were obtained on the end face (Ra = 2.764 μm, Rz = 13.32 μm). With the increase of the cutting speed to vc = 1200 m/min, the Ra parameter value decreased by 2.647 μm and the Rz parameter value decreased by 12.61 μm (Figure 9a,b). At the cutting speed vc = 400 m/min, the RSm parameter values were in the range of 0.117–0.428 mm. With the cutting speed vc = 1200 m/min for the λs = 50° tool on the end face, a radical decrease in the value of the RSm parameter was achieved to 0.008 mm, which was several times lower compared to the other values. In addition, a greater dispersion of the results in the series of measurements after milling with the λs = 50° tool was noticed, especially for the surface roughness parameters on the lateral face of the workpiece (Figure 9c).
The Rsk (skewness) values on the end face were small, close to the symmetric distribution of the profile roughness. On the lateral face, lower Rsk values were obtained at a higher cutting speed (vc = 1200 m/min). The values for both the lateral and the end faces did not exceed 0.8 (Figure 9d). The values of the Rku (kurtosis) after milling with the λs = 20° tool ranged from 2.272 to 2.879. On the other hand, for the λs = 50° tool, lower values of the coefficient (Rku < 3) were noticed on the end face. Rku (kurtosis) values greater than 3 were obtained on the lateral face at vc = 400 m/min (4.068) and at vc = 1200 m/min (5.133), which is characteristic for surfaces with sharp peaks and valleys (Figure 9e).
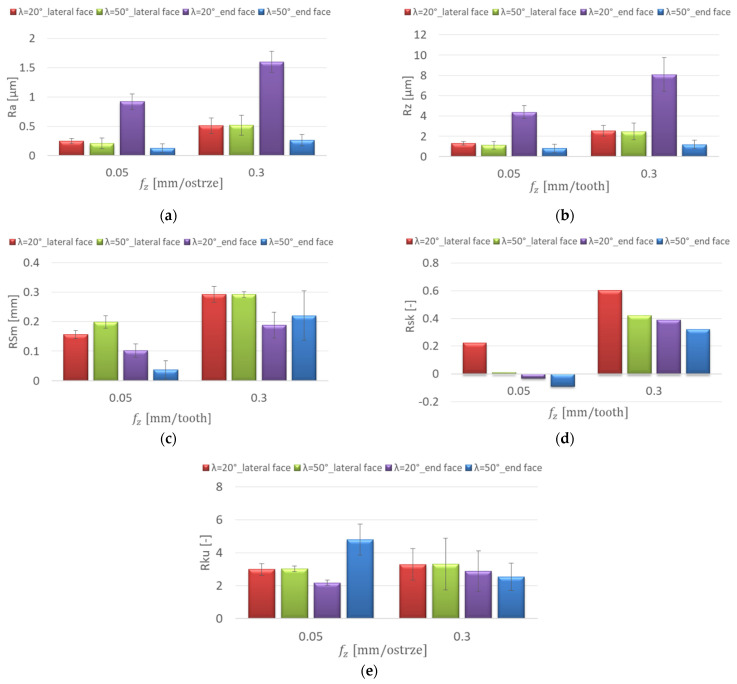
Figure 10 shows the effect of the feed per tooth change on the surface roughness for the AZ31 magnesium alloy. In the research, increasing the feed per tooth fz increased the values of the Ra and the Rz parameters; it was especially visible on the end face for the λs = 20° tool, where the value of the Ra parameter increased from 0.919 to 1.6 μm and the value of the Rz parameter from 4.37 to 8.09 μm. The lowest values of the Ra and the Rz parameters were observed on the end face for the λs = 50° tool at fz = 0.05 mm/tooth (Figure 10a,b). The change of the feed per tooth from 0.05 to 0.3 contributed to an increase in the value of the RSm parameter. The greatest difference was noted on the end face of the workpiece for the λs = 50° tool, where the RSm value increased from 0.037 to 0.221 mm (Figure 10c). The values of the Rsk coefficient with the feed per tooth fz = 0.05 mm/tooth oscillated around 0. With the feed per tooth fz = 0.3 mm/tooth, positive values of the Rsk coefficient were obtained for the two tools (Figure 10d). The values of the Rku coefficient oscillated around 3, which shows that the profile distribution corresponded to the Gaussian distribution. Only the value of the Rku coefficient on the end face of the workpiece after milling with the λs = 50° tool at a feed per tooth fz = 0.05 mm/tooth was 4.796 (Figure 10e).
Figure 10.
Effect of feed per tooth fz change on the surface roughness: (a) Ra, (b) Rz, (c) RSm, (d) Rsk, (e) Rku; vc = 800 m/min, lateral face: ae = 2 mm, ap = 8 mm, end face: ae = 14 mm, ap = 0.3 mm.
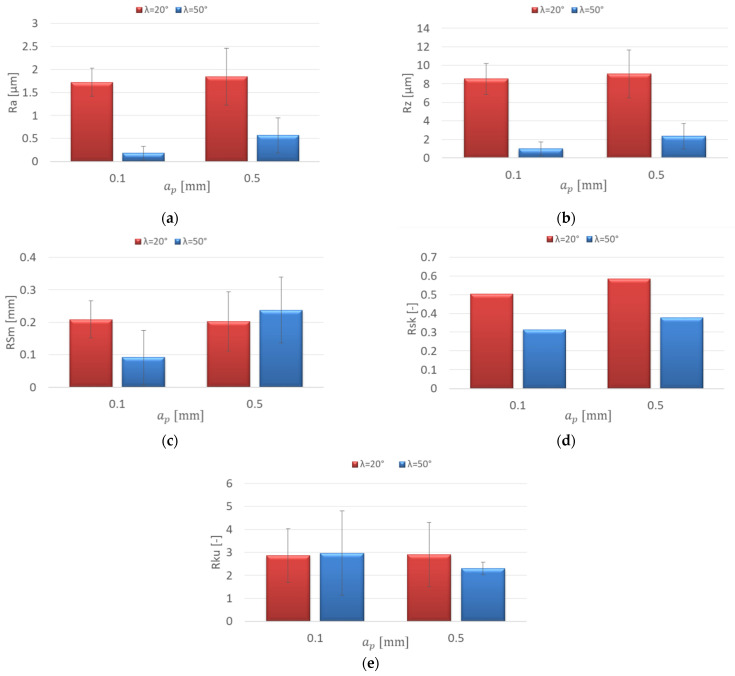
Figure 11 shows the effect of increasing the axial depth of cut ap on the roughness parameters for the AZ31 magnesium alloy. For the λs = 20° tool, the influence of the increase in the axial depth of cut ap on the values of the Ra and Rz parameters was negligible; the values were in the following ranges: Ra = 1.721–1.844 μm and Rz = 8.53–9.07 μm. In the case of the λs = 50° tool, higher values of the discussed parameters were obtained with ap = 0.5 mm. The value of the Ra parameter increased by 0.386 μm, and the Rz parameter increased by 1.35 μm (Figure 11a,b). It was also shown that the change in the axial depth of cut ap for both tools had an insignificant effect on the values of the RSm parameter. For the λs = 20° tool, the RSm parameter value decreased by 0.006 mm, and for the λs = 50° tool, it increased by 0.146 mm (Figure 11c). Regardless of the increase in the axial depth of cut ap and tool cutting edge helix angle (λs = 20°, λs = 50°), positive values of the Rsk coefficient were obtained (Rsk = 0.314–0.585) (Figure 11d). The values of the Rku coefficient were in the range: 2.296–2.969 (Figure 11e).
Figure 11.
Effect of axial depth of cut ap change on the surface roughness: (a) Ra, (b) Rz, (c) RSm, (d) Rsk, (e) Rku; vc = 800 m/min, fz = 0.15 mm/tooth, ae = 14 mm.
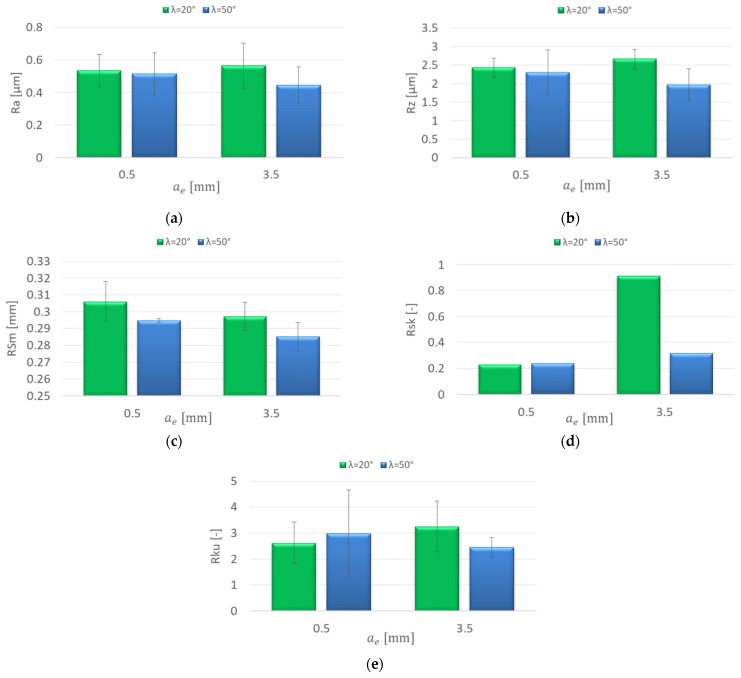
Figure 12 shows the influence of increasing the radial depth of cut ae on the roughness parameters for the AZ31 magnesium alloy. The effect of increasing the radial depth of cut ae was negligible for the Ra and the Rz parameters; the values were similar regardless of the tool helix angle. The Ra parameter values were in the range from 0.455 to 0.565 μm. The Rz parameter values were in the range of 1.98–2.66 μm (Figure 12a,b). In the case of the RSm parameter, it was also shown that the change in radial depth of cut ae had an insignificant effect. The parameter values ranged from 0.285 to 0.306 mm (Figure 12c). With a variable radial depth of cut, the Rsk (skewness) values were positive. The change of the radial depth of cut from ae = 0.5 to 3.5 mm resulted in an increase in the Rsk coefficient value by 0.684 for the λs = 20° tool. For the λs = 50° tool, despite the increase in the radial depth of cut, the values of the Rsk coefficient were small, close to the symmetrical distribution of the profile and ranged between 0.228 and 0.315 (Figure 12d). The Rku (kurtosis) values were in the range of 2.446–3.258, which means that the roughness profile distributions were similar to the Gaussian distribution (Figure 12e).
Figure 12.
Effect of radial depth of cut ae change on the surface roughness: (a) Ra, (b) Rz, (c) RSm, (d) Rsk, (e) Rku; vc = 800 m/min, fz = 0.15 mm/tooth, ap = 8 mm.
3.2. Statistical Analysis
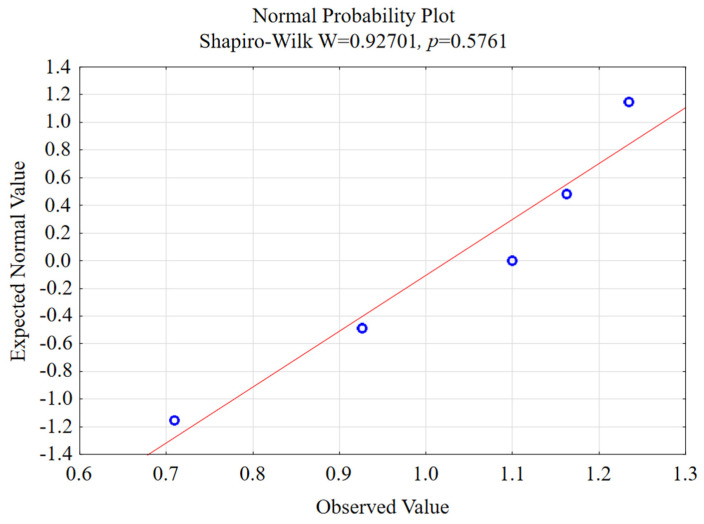
One of the conditions for using the test to check the equality of two means is the normality of the distribution, so firstly, the Shapiro–Wilk test was performed. Figure 13 shows the normal probability plot for selected machining conditions. Furthermore, Table 1, Table 2, Table 3 and Table 4 present a summary of the performed statistical test for the data obtained as a result of the studies carried out.
Figure 13.
Normal probability plot for the λs = 20° tool with the analysis of the Ra parameter on the lateral face of the AZ91D magnesium alloy vc = 400 m/min, fz = 0.15 mm/tooth, ae = 2 mm, ap = 8 mm.
Table 2.
Results of the Shapiro–Wilk test for the roughness parameters after milling the AZ91D magnesium alloy, λs = 20° tool.
| Lateral Face of Workpiece | End Face of Workpiece | |||||||
|---|---|---|---|---|---|---|---|---|
| Comparison | vc = 400 m/min | vc = 1200 m/min | vc = 400 m/min | vc = 1200 m/min | ||||
| Test Result | Test | p-Value | Test | p-Value | Test | p-Value | Test | p-Value |
| Ra | 0.92701 | 0.5761 | 0.90335 | 0.42867 | 0.86041 | 0.22971 | 0.90881 | 0.46046 |
| Rz | 0.92735 | 0.57844 | 0.91341 | 0.48833 | 0.88383 | 0.32701 | 0.92647 | 0.57249 |
| RSm | 0.75007 | 0.02981 | 0.87094 | 0.27027 | 0.87575 | 0.29049 | 0.93743 | 0.64781 |
| Rsk | 0.97334 | 0.89623 | 0.99024 | 0.98054 | 0.91848 | 0.52019 | 0.95693 | 0.78643 |
| Rku | 0.82497 | 0.12748 | 0.99407 | 0.99183 | 0.89512 | 0.38352 | 0.95222 | 0.75305 |
| Comparison | fz = 0.05 mm/tooth | fz = 0.3 mm/tooth | fz = 0.05 mm/tooth | fz = 0.3 mm/tooth | ||||
| Ra | 0.96664 | 0.85328 | 0.80452 | 0.08817 | 0.94366 | 0.69193 | 0.88377 | 0.32677 |
| Rz | 0.95274 | 0.75678 | 0.80547 | 0.08973 | 0.96051 | 0.81156 | 0.969 | 0.86879 |
| RSm | 0.92973 | 0.59453 | 0.79941 | 0.08014 | 0.87406 | 0.28324 | 0.84262 | 0.17229 |
| Rsk | 0.96942 | 0.87153 | 0.99326 | 0.98977 | 0.9765 | 0.91507 | 0.91524 | 0.49972 |
| Rku | 0.84435 | 0.1773 | 0.93277 | 0.6154 | 0.8805 | 0.31157 | 0.74521 | 0.02686 |
Table 3.
Results of the Shapiro–Wilk test for the roughness parameters after milling the AZ91D magnesium alloy, λs = 50° tool.
| Lateral Face of Workpiece | End Face of Workpiece | |||||||
|---|---|---|---|---|---|---|---|---|
| Comparison | vc = 400 m/min | vc = 1200 m/min | vc = 400 m/min | vc = 1200 m/min | ||||
| Test Result | Test | p-Value | Test | p-Value | Test | p-Value | Test | p-Value |
| Ra | 0.81663 | 0.10995 | 0.95541 | 0.77572 | 0.91154 | 0.47691 | 0.97884 | 0.92835 |
| Rz | 0.7354 | 0.02168 | 0.81577 | 0.10827 | 0.92973 | 0.59454 | 0.919 | 0.52351 |
| RSm | 0.7078 | 0.01153 | 0.97664 | 0.91587 | 0.92816 | 0.58389 | 0.84752 | 0.18681 |
| Rsk | 0.84967 | 0.19349 | 0.91019 | 0.46873 | 0.95357 | 0.76262 | 0.85765 | 0.21992 |
| Rku | 0.6497 | 0.00264 | 0.85419 | 0.20812 | 0.95542 | 0.77578 | 0.9657 | 0.84702 |
| Comparison | fz = 0.05 mm/tooth | fz = 0.3 mm/tooth | fz = 0.05 mm/tooth | fz = 0.3 mm/tooth | ||||
| Ra | 0.65288 | 0.00288 | 0.95445 | 0.74398 | 0.95581 | 0.77853 | 0.7713 | 0.04632 |
| Rz | 0.69372 | 0.00822 | 0.94482 | 0.68391 | 0.88753 | 0.34482 | 0.85179 | 0.20024 |
| RSm | 0.8638 | 0.24221 | 0.76603 | 0.05395 | 0.71771 | 0.01454 | 0.67777 | 0.00552 |
| Rsk | 0.89466 | 0.38108 | 0.81947 | 0.14196 | 0.95604 | 0.78018 | 0.77213 | 0.04711 |
| Rku | 0.98535 | 0.96103 | 0.9379 | 0.64158 | 0.80611 | 0.0908 | 0.86626 | 0.25161 |
Table 4.
Results of the Shapiro–Wilk test for the roughness parameters after milling the AZ31 magnesium alloy, λs = 20° tool.
| Lateral Face of Workpiece | End Face of Workpiece | |||||||
|---|---|---|---|---|---|---|---|---|
| Comparison | vc = 400 m/min | vc = 1200 m/min | vc = 400 m/min | vc = 1200 m/min | ||||
| Test Result | Test | p-Value | Test | p-Value | Test | p-Value | Test | p-Value |
| Ra | 0.82009 | 0.11696 | 0.91865 | 0.52124 | 0.98436 | 0.95652 | 0.89208 | 0.36767 |
| Rz | 0.96982 | 0.87409 | 0.98235 | 0.94678 | 0.79289 | 0.07083 | 0.9036 | 0.43009 |
| RSm | 0.88425 | 0.32902 | 0.95601 | 0.77995 | 0.82741 | 0.13302 | 0.79527 | 0.07411 |
| Rsk | 0.94807 | 0.72339 | 0.84938 | 0.19257 | 0.90778 | 0.45435 | 0.93953 | 0.66263 |
| Rku | 0.83942 | 0.16332 | 0.95506 | 0.77327 | 0.92164 | 0.54058 | 0.98535 | 0.96103 |
| Comparison | fz = 0.05 mm/tooth | fz = 0.3 mm/tooth | fz = 0.05 mm/tooth | fz = 0.3 mm/tooth | ||||
| Ra | 0.79205 | 0.0697 | 0.95492 | 0.77224 | 0.76973 | 0.04487 | 0.86523 | 0.24764 |
| Rz | 0.87892 | 0.30443 | 0.91473 | 0.49656 | 0.91012 | 0.46828 | 0.82873 | 0.1361 |
| RSm | 0.89477 | 0.38164 | 0.98237 | 0.94689 | 0.94044 | 0.66902 | 0.9143 | 0.49387 |
| Rsk | 0.98474 | 0.95825 | 0.82927 | 0.13738 | 0.94352 | 0.69091 | 0.79541 | 0.07431 |
| Rku | 0.81641 | 0.10952 | 0.90784 | 0.4547 | 0.91115 | 0.47455 | 0.79599 | 0.07513 |
In the case of the p-value below 0.05, the distributions are different from the normal distribution in a statistically significant way. The p-value is the lowest significance level that leads to the rejection of the null hypothesis [46]. A p-value below 0.05 was obtained for the following parameters (Table 2):
RSm for the variable vc in the case of the lateral face,
Rku for the variable fz for the end face.
In Table 3, on the lateral face of the AZ91D magnesium alloy (λs = 50° tool), the roughness parameters that obtained a p-value below 0.05 were as follows: Rz, RSm and Rku with the variable vc, and Ra and Rz with the variable fz. Further, on the end face: Ra, RSm and Rsk with the variable fz. In Table 4, for the λs = 20° tool on the end face of the AZ31 magnesium alloy, a p-value below 0.05 was only obtained for the Ra parameter for the variable fz.
A p-value below 0.05 was obtained for the following parameters (Table 5):
Lateral face of the workpiece: Rku for the variable vc, and Rku for the variable fz.
End face of the workpiece: RSm and Rsk for the variable vc.
Table 5.
Results of the Shapiro–Wilk test for the roughness parameters after milling the AZ31 magnesium alloy, λs = 50° tool.
| Lateral Face of Workpiece | End Face of Workpiece | |||||||
|---|---|---|---|---|---|---|---|---|
| Comparison | vc = 400 m/min | vc = 1200 m/min | vc = 400 m/min | vc = 1200 m/min | ||||
| Test Result | Test | p-Value | Test | p-Value | Test | p-Value | Test | p-Value |
| Ra | 0.92022 | 0.53137 | 0.98119 | 0.90899 | 0.9685 | 0.86554 | 0.8087 | 0.09522 |
| Rz | 0.99583 | 0.99559 | 0.90767 | 0.47016 | 0.93796 | 0.65154 | 0.8687 | 0.26121 |
| RSm | 0.93284 | 0.61589 | 0.84072 | 0.1975 | 0.63891 | 0.00196 | 0.62463 | 0.00131 |
| Rsk | 0.87526 | 0.28839 | 0.94115 | 0.66137 | 0.98373 | 0.95354 | 0.64235 | 0.00216 |
| Rku | 0.59038 | 0.00046 | 0.77707 | 0.06705 | 0.84398 | 0.17623 | 0.9798 | 0.93355 |
| Comparison | fz = 0.05 mm/tooth | fz = 0.3 mm/tooth | fz = 0.05 mm/tooth | fz = 0.3 mm/tooth | ||||
| Ra | 0.79241 | 0.07018 | 0.83206 | 0.14414 | 0.92731 | 0.57869 | 0.84128 | 0.19917 |
| Rz | 0.90467 | 0.43625 | 0.89212 | 0.36785 | 0.92802 | 0.5828 | 0.88774 | 0.37273 |
| RSm | 0.97436 | 0.90245 | 0.80914 | 0.096 | 0.8692 | 0.29455 | 0.89009 | 0.38352 |
| Rsk | 0.9049 | 0.43754 | 0.94477 | 0.69982 | 0.90068 | 0.43447 | 0.9524 | 0.73114 |
| Rku | 0.71506 | 0.01367 | 0.71978 | 0.01525 | 0.82475 | 0.15451 | 0.86691 | 0.28573 |
Therefore, the non-parametric Mann–Whitney U test was used for further analysis. Table 6 shows the test results for the data obtained in the study. For the roughness parameters, which obtained p-values greater than 0.05 (in the Shapiro–Wilk test), the hypothesis of the equality of variances was tested for further statistical verification. On the AZ91D lateral face (λs = 20° tool), in the case of the RSm roughness parameter with the variable vc, the observed difference was statistically significant. This means that the above-mentioned parameter was influenced by the cutting speed (lower values of these parameters were obtained at vc = 1200 m/min). For the λs = 50° tool with the variable vc, the differences were statistically insignificant, although the registered p-value (p = 0.095238) for the Rz parameter was on the edge of statistical significance. However, with the variable fz for the parameters Ra and Rz, it was proven that the differences were statistically significant, which means that the increase in feed per tooth adversely affects the mentioned parameters. On the end face of the alloy AZ91D (λs = 50° tool), the differences in the roughness parameters (Ra, RSm) for variable fz were statistically significant.
Table 6.
Results of the Mann–Whitney U test for the roughness parameters after milling the magnesium alloy.
| AZ91D | AZ31 | |||||||
|---|---|---|---|---|---|---|---|---|
| λs = 20° | λs = 50° | λs = 20° | λs = 50° | |||||
| Lateral Face | End Face | Lateral Face | End Face | Lateral Face | End Face | Lateral Face | End Face | |
| p-Value | p-Value | p-Value | p-Value | p-Value | p-Value | p-Value | p-Value | |
| vc 400 vs. 1200 | ||||||||
| Ra | - | - | - | - | - | - | ||
| Rz | - | - | 0.095238 | - | - | - | ||
| RSm | 0.015873 | - | 0.309524 | - | - | - | 0.055556 | |
| Rsk | - | - | - | - | - | - | 0.222222 | |
| Rku | - | - | 0.150794 | - | - | - | 0.190476 | |
| fz 0.05 vs. 0.3 | ||||||||
| Ra | - | - | 0.031746 | 0.007937 | - | 0.007937 | ||
| Rz | - | - | 0.031746 | - | - | - | ||
| RSm | - | - | - | 0.007937 | - | - | ||
| Rsk | - | - | - | 1 | - | - | ||
| Rku | - | 1 | - | - | - | - | 0.547619 | |
For the λs = 20° tool on the end face of the AZ31 magnesium alloy, it was shown that an increase in feed per tooth from 0.05 to 0.3 mm tooth influenced the Ra parameter. For the λs = 50° tool on the lateral and end face of the AZ31 magnesium alloy, it was shown that the differences between the examined parameters were not statistically significant at the established significance level α = 0.05 (Table 6).
In order to further statistically verify the data for which the null hypothesis was not rejected (the distributions are not different from the normal distribution in a statistically significant way), it was necessary to check the equality of variances towards selecting the statistical test for checking the equality of the means [43].
Table 7, Table 8, Table 9, Table 10, Table 11, Table 12, Table 13 and Table 14 present the results of: Cochran’s Q test and Student’s t-test verifying the hypothesis of the equality of means.
Table 7.
Results of Student’s t-test and Cochran’s Q test for the roughness parameters on the lateral face of the AZ91D magnesium alloy, λs = 20° tool.
| λs = 20° Lateral Face of the AZ91D | ||||||||||
|---|---|---|---|---|---|---|---|---|---|---|
| Student’s t-Test | ||||||||||
| Roughness Parameter | vc 400 vs. 1200 | fz 0.05 vs. 0.3 | ||||||||
| Mean | Mean | Test | df | p-Value | Mean | Mean | Test | df | p-Value | |
| Ra | 1.0262 | 0.4182 | 5.46025 | 8 | 0.000601 | 0.3352 | 0.5046 | −2.0036 | 8 | 0.080066 |
| Rz | 4.212 | 2.348 | 6.62059 | 8 | 0.000166 | 2.038 | 2.65 | −1.1619 | 8 | 0.27873 |
| RSm | - | - | - | - | - | 0.206 | 0.283 | −3.0689 | 8 | 0.015372 |
| Rsk | - | - | - | - | - | 0.0366 | 0.3976 | −1.4108 | 8 | 0.195969 |
| Rku | 2.3382 | 4.1638 | −4.17206 | 8 | 0.003113 | 4.5826 | 3.132 | 1.5866 | 8 | 0.151259 |
| Cochran’s Q test | ||||||||||
| Roughness parameter | vc 400 vs. 1200 | fz 0.05 vs. 0.3 | ||||||||
| Mean | Mean | Test * | df | p-Value | Mean | Mean | Test * | df | p-Value | |
| Rsk | 0.4694 | 0.1038 | 0.996435 | 4.293571 | 0.37183 | - | - | - | - | - |
* Test with independent variance estimation.
Table 8.
Results of Cochran’s Q test for the roughness parameters on the end face of the AZ91D magnesium alloy, λs = 20° tool.
| λs = 20° End Face of the AZ91D | ||||||||||
|---|---|---|---|---|---|---|---|---|---|---|
| Cochran’s Q Test | ||||||||||
| Roughness Parameter | vc 400 vs. 1200 | fz 0.05 vs. 0.3 | ||||||||
| Mean | Mean | Test * | df | p-Value | Mean | Mean | Test * | df | p-Value | |
| Ra | 2.3714 | 1.3818 | 3.4085 | 4.100354 | 0.026035 | 0.8712 | 1.786 | -5.9069 | 4.583435 | 0.00265 |
| Rz | 13.128 | 6.412 | 4.3650 | 4.022686 | 0.011865 | 4.166 | 7.97 | -4.6056 | 4.361437 | 0.008121 |
| RSm | 0.1196 | 0.1716 | −1.0226 | 4.590582 | 0.357305 | 0.1014 | 0.2248 | -3.6712 | 4.409552 | 0.018011 |
| Rsk | 0.334 | −0.3034 | 3.5067 | 4.432405 | 0.020918 | 0.05 | 0.2152 | -0.7847 | 4.105744 | 0.475401 |
| Rku | 2.9146 | 2.2392 | 1.6676 | 4.217333 | 0.167024 | - | - | - | - | - |
* Test with independent variance estimation.
Table 9.
Results of Student’s t-test and Cochran’s Q test for the roughness parameters on the lateral face of the AZ91D magnesium alloy, λs = 50° tool.
| λs = 50° Lateral Face of the AZ91D | ||||||||||
|---|---|---|---|---|---|---|---|---|---|---|
| Student’s t-Test | ||||||||||
| Roughness Parameter | vc 400 vs. 1200 | fz 0.05 vs. 0.3 | ||||||||
| Mean | Mean | Test | df | p-Value | Mean | Mean | Test | df | p-Value | |
| Ra | 0.5052 | 0.2346 | 1.929121 | 8 | 0.089842 | - | - | - | - | - |
| RSm | - | - | - | - | - | 0.244 | 0.251 | −0.1441 | 7 | 0.889423 |
| Rsk | 0.3698 | 0.2158 | 0.608047 | 8 | 0.560018 | −0.065 | 0.2945 | −2.2076 | 7 | 0.063011 |
| Cochran’s Q test | ||||||||||
| Roughness parameter | vc 400 vs. 1200 | fz 0.05 vs. 0.3 | ||||||||
| Mean | Mean | Test * | df | p-Value | Mean | Mean | Test * | df | p-Value | |
| Rku | - | - | - | - | - | 3.158 | 3.6792 | −0.69778 | 4.09452 | 0.52290 |
* Test with independent variance estimation.
Table 10.
Results of Student’s t-test for the roughness parameters on the end face of the AZ91D magnesium alloy, λs = 50° tool.
| λs = 50° End Face of the AZ91D | ||||||||||
|---|---|---|---|---|---|---|---|---|---|---|
| Student’s t-Test | ||||||||||
| Roughness Parameter | vc 400 vs. 1200 | fz 0.05 vs. 0.3 | ||||||||
| Mean | Mean | Test | df | p-Value | Mean | Mean | Test | df | p-Value | |
| Ra | 3.4866 | 1.3698 | 6.11039 | 8 | 0.000286 | - | - | - | - | - |
| Rz | 14.148 | 5.99 | 10.53708 | 8 | 0.000006 | 4.072 | 12.896 | −8.0618 | 8 | 0.000041 |
| RSm | 0.409 | 0.1698 | 15.43258 | 8 | 0 | - | - | - | - | - |
| Rsk | 0.3126 | 0.359 | −0.43022 | 8 | 0.678391 | - | - | - | - | - |
| Rku | 2.2608 | 2.0778 | 0.7786 | 8 | 0.458621 | 2.91 | 2.4866 | 1.33904 | 8 | 0.217355 |
Table 11.
Results of Student’s t-test and Cochran’s Q test for roughness parameters on the lateral face of the AZ31 magnesium alloy, λs = 20° tool.
| λs = 20° Lateral Face of the AZ31 | ||||||||||
|---|---|---|---|---|---|---|---|---|---|---|
| Student’s t-Test | ||||||||||
| Roughness Parameter | vc 400 vs. 1200 | fz 0.05 vs. 0.3 | ||||||||
| Mean | Mean | Test | df | P-Value | Mean | Mean | Test | df | p-Value | |
| Ra | 0.865 | 0.2802 | 18.87493 | 8 | 0 | - | - | - | - | - |
| Rz | 3.642 | 1.474 | 11.44865 | 8 | 0.000003 | - | - | - | - | - |
| RSm | 0.4284 | 0.228 | 10.31757 | 8 | 0.000007 | 0.1568 | 0.2928 | -9.9378 | 8 | 0.000009 |
| Rsk | 0.5294 | 0.1632 | 1.69294 | 8 | 0.128923 | 0.2238 | 0.6018 | -1.8519 | 8 | 0.101177 |
| Rku | 2.2722 | 2.8788 | −2.46516 | 8 | 0.039004 | 2.9852 | 3.2926 | -0.674 | 8 | 0.519308 |
| Cochran’s Q test | ||||||||||
| Roughness parameter | vc 400 vs. 1200 | fz 0.05 vs. 0.3 | ||||||||
| Mean | Mean | Test * | df | p-Value | Mean | Mean | Test * | df | p-Value | |
| Ra | - | - | - | - | - | 0.2492 | 0.5136 | −4.2146 | 4.955853 | 0.008535 |
| Rz | - | - | - | - | - | 1.31 | 2.542 | −5.0265 | 4.892736 | 0.004262 |
* Test with independent variance estimation.
Table 12.
Results of Student’s t-test and Cochran’s Q test for the roughness parameters on the end face of the AZ31 magnesium alloy, λs = 20° tool.
| λs = 20° End Face of the AZ31 | ||||||||||
|---|---|---|---|---|---|---|---|---|---|---|
| Student’s t-Test | ||||||||||
| Roughness Parameter | vc 400 vs. 1200 | fz 0.05 vs. 0.3 | ||||||||
| Mean | Mean | Test | df | p-Value | Mean | Mean | Test | df | p-Value | |
| Ra | 1.6406 | 1.2122 | 4.32639 | 8 | 0.002524 | - | - | - | - | - |
| Rz | 8.828 | 5.626 | 6.515186 | 8 | 0.000185 | - | - | - | - | - |
| RSm | - | - | - | - | - | 0.1026 | 0.1884 | −3.8625 | 8 | 0.004791 |
| Rsk | 0.1984 | −0.3486 | 3.274444 | 8 | 0.011281 | - | - | - | - | - |
| Cochran’s Q test | ||||||||||
| Roughness parameter | vc 400 vs. 1200 | fz 0.05 vs. 0.3 | ||||||||
| Mean | Mean | Test * | df | p-Value | Mean | Mean | Test * | df | p-Value | |
| Rz | - | - | - | - | - | 4.37 | 8.092 | −4.6895 | 5.185945 | 0.004908 |
| RSm | 0.2312 | 0.1614 | 1.229567 | 4.541987 | 0.27872 | - | - | - | - | - |
| Rsk | - | - | - | - | - | −0.031 | 0.3898 | −1.5343 | 5.887224 | 0.176774 |
| Rku | 2.8686 | 2.28 | 1.748142 | 4.079996 | 0.153946 | 2.1782 | 2.8806 | −1.263 | 4.124669 | 0.273271 |
* Test with independent variance estimation.
Table 13.
Results of Student’s t-test and Cochran’s Q test for the roughness parameters on the lateral face of the AZ31 magnesium alloy, λs = 50° tool.
| λs = 50° Lateral Face of the AZ31 | ||||||||||
|---|---|---|---|---|---|---|---|---|---|---|
| Student’s t-Test | ||||||||||
| Roughness Parameter | vc 400 vs. 1200 | fz 0.05 vs. 0.3 | ||||||||
| Mean | Mean | Test | df | p-Value | Mean | Mean | Test | df | p-Value | |
| Ra | 0.7024 | 0.32675 | 4.346335 | 7 | 0.00337 | - | - | - | - | - |
| Rz | 4.01 | 2.1725 | 4.419454 | 7 | 0.003083 | 1.116 | 2.474 | −3.3989 | 8 | 0.009376 |
| RSm | - | - | - | - | - | 0.1992 | 0.2924 | −8.8984 | 8 | 0.00002 |
| Rsk | 0.7638 | 0.3465 | 1.130161 | 7 | 0.295641 | 0.0098 | 0.4204 | −2.7148 | 8 | 0.026458 |
| Cochran’s Q test | ||||||||||
| Roughness parameter | vc 400 vs. 1200 | fz 0.05 vs. 0.3 | ||||||||
| Mean | Mean | Test * | df | p-Value | Mean | Mean | Test * | df | p-Value | |
| Ra | - | - | - | - | - | 0.2106 | 0.5206 | −3.6098 | 5.986017 | 0.011279 |
| RSm | 0.1174 | 0.14475 | −0.34124 | 4.568971 | 0.748044 | - | - | - | - | - |
* Test with independent variance estimation.
Table 14.
Results of Student’s t-test and Cochran’s Q test for the roughness parameters on the end face of the AZ31 magnesium alloy, λs = 50° tool.
| λs = 50° End Face of the AZ91D | |||||
|---|---|---|---|---|---|
| Student’s t-Test | |||||
| fz 0.05 vs. 0.3 | |||||
| Roughness Parameter | Mean | Mean | Test | df | p-Value |
| Ra | 0.128 | 0.263 | −2.18913 | 6 | 0.071161 |
| Rz | 0.815 | 1.2025 | −1.29384 | 6 | 0.243291 |
| RSm | 0.037 | 0.22075 | −4.09542 | 6 | 0.00639 |
| Rsk | −0.0895 | 0.3225 | −1.56914 | 6 | 0.167667 |
| Rku | 4.796 | 2.54725 | 3.57914 | 6 | 0.011655 |
| Cochran’s Q test | |||||
| vc 400 vs. 1200 | |||||
| Roughness parameter | Mean | Mean | Test * | df | p-Value |
| Ra | 2.7644 | 0.117 | 8.36535 | 4.019698 | 0.001093 |
| Rz | 13.32 | 0.708 | 5.69311 | 4.014721 | 0.00465 |
| Rku | 2.1364 | 2.4142 | −1.16828 | 5.724052 | 0.289037 |
* Test with independent variance estimation.
Table 7 shows the results for the λs = 20° tool on the lateral face of the AZ91D alloy. It was shown that for the variable cutting speed, the differences were statistically significant for the Ra, Rz and Rku parameters. The increase in the cutting speed from vc = 400 to 1200 m/min had a positive impact on the mean values of the mentioned parameters (the mean values of the Ra and Rz parameters were lower, at vc = 1200 m/min). When changing the feed per tooth fz, only the differences for the RSm parameter were statistically significant. However, there was a p-value at the edge of statistical significance for the Ra parameter.
For the λs = 20° tool on the face of the AZ91D magnesium alloy, it was shown that the differences were only statistically insignificant for variable cutting speed for the RSm, and Rku parameters. The change in cutting speed from vc = 400 to 1200 m/min had a positive effect on the mean values of the Ra, Rz and Rsk parameters. When changing the feed per tooth fz, it was shown that the mean values of the parameters Ra, Rz and RSm, were different in a statistically significant way. By increasing the feed per tooth from fz = 0.05 to 0.3 mm/tooth, higher values of these parameters were obtained. The observed differences were only statistically insignificant for the Rsk coefficient (Table 8).
Table 9 shows the results of tests on the lateral face of the AZ91D alloy for the λs = 50° tool. The change in cutting speed vc did not influence the mean values of the roughness parameters Ra and Rsk. However, there was a p-value on the verge of statistical significance for the Ra parameter. The observed differences in the mean values of the RSm, Rsk and Rku parameters when changing the feed per tooth fz were not statistically significant. Nevertheless, it is worth highlighting the p-value (0.063011), which was on the edge of statistical significance for the Rsk coefficient.
Table 10 shows the results for the λs = 50° tool on the end face of the AZ91D alloy. The increase in the cutting speed from 400 to 1200 m/min had a positive effect on the values of the Ra, Rz and RSm parameters (the mean values of these parameters were lower, at vc = 1200 m/min). When changing the feed per tooth fz, the mean value of the Rz parameter was different in a statistically significant way. By increasing the feed per tooth from fz = 0.05 to 0.3 mm/tooth, a higher mean value of the parameter mentioned was obtained.
Table 11 shows the results of tests on the lateral face of the AZ31 alloy for the λs = 20° tool. It was shown that the differences were statistically significant for the roughness parameters Ra, Rz, RSm and Rku at the cutting speed change vc. The increase in the cutting speed from vc = 400 to 1200 m/min had a positive influence on the mean values of the mentioned parameters. In the case of the Rsk coefficient, the differences were statistically insignificant at the established significance level. When changing the feed per tooth on the lateral face of the AZ31 alloy, it was shown that the observed differences were statistically significant. This means that the change of the feed per tooth fz from 0.05 to 0.3 mm/tooth affected the mean values of the mentioned parameters (higher mean values of the Ra, Rz and RSm parameters were received at fz = 0.3 mm/tooth).
Table 12 shows the test results for the AZ31 alloy end face (λs = 20° tool). The differences were statistically significant at the cutting speed change for the parameters Ra, Rz and Rsk. The increase in cutting speed from 400 to 1200 m/min had a positive effect on the mean values of these parameters (lower values were obtained at vc = 1200 m/min). When changing feed per tooth fz, it was shown that the mean values of the Rz and RSm parameters were different in a statistically significant way. When increasing the feed per tooth from fz = 0.05 to 0.3 mm/tooth, higher values of the given parameters were obtained.
On the lateral face of the AZ31 alloy (λs = 50° tool), the differences in the roughness parameters Ra and Rz with the variable vc were statistically significant in favour of a higher cutting speed (lower values were obtained at vc = 1200 m/min). At the feed per tooth change, it was shown that the mean values of the parameters Ra, Rz, RSm and Rsk were statistically different. By increasing the feed per tooth from 0.05 to 0.3 mm/tooth, higher values of these parameters were obtained (Table 13).
For the λs = 50° tool on the end face of the AZ31 magnesium alloy, it was shown that the differences in the mean values of the parameters Ra and Rz at variable cutting speeds vc were statistically significant (lower roughness parameters were obtained at vc = 1200 m/min). Only for the Rku coefficient, the mean values did not differ in a statistically significant way. At the feed per tooth change, the mean values of the RSm parameter and the Rku coefficient proved to be statistically significant. The other parameters with an increase in the feed per tooth fz to 0.3 mm/tooth were not statistically different, although the p-value of 0.071161 received for Ra was at the edge of statistical significance (Table 15).
Table 15.
Selected networks based on quality (learning, validation) and errors (learning, validation).
| Network Name | Quality (Training) | Quality (Validation) | Error (Training) | Error (Validation) | Activation (Hidden) | Activation (Output) |
|---|---|---|---|---|---|---|
| End face of workpiece | ||||||
| Ra | ||||||
| RBF 3-9-1 | 0.975827 | 0.977331 | 0.002393 | 0.009909 | Gaussian | Linear |
| Rz | ||||||
| MLP 3-2-1 | 0.960436 | 0.986464 | 0.101807 | 0.404443 | Exponential | Exponential |
| Lateral face of workpiece | ||||||
| Ra | ||||||
| RBF 3-10-1 | 0.994723 | 0.948386 | 0.000176 | 0.000871 | Gaussian | Linear |
| Rz | ||||||
| RBF 3-10-1 | 0.995174 | 0.980441 | 0.001948 | 0.039403 | Gaussian | Linear |
3.3. Artificial Neural Network
For the AZ91D magnesium alloy, simulations were carried out with the use of artificial neural networks in order to investigate the relationship between the technological parameters and the predicted surface roughness. The networks were created using 15 sets of technological parameters. For each input data, simulations were performed for 100 networks, while 10 networks were preserved for further analysis [45].
The network suitability was assessed by learning quality, validation quality, learning error and validation error. The simulations were carried out for the Ra and Rz parameters on the lateral and end faces of the workpiece. Table 14 shows the four different ANN models obtained. On the basis of the network quality indicators, it was shown that the best match for the Ra and Rz parameters on the lateral surface was obtained for the RBF 3-10-1 network (10 hidden neurons) while analysing the parameters on the end face of the AZ91D alloy showed that the MLP 3-2-1 network (2 hidden neurons) was optimal for the Rz parameter. However, for the Ra parameter, the RBF 3-9-1 network (9 hidden neurons) achieved a high quality of learning and validation in relation to its low error rate for learning and validation. For the MLP network, the best results were obtained for the exponential activation functions. The MLP 3-2-1 network for the Rz parameters on the end face of the AZ91D alloy was obtained after 9254 iterations.
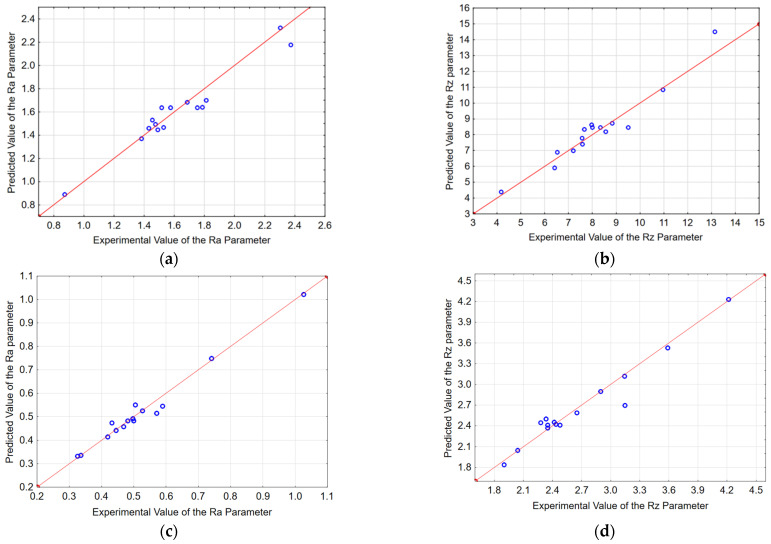
The accuracy of the surface roughness prediction was assessed by comparing the predicted and experimental values. Figure 14 presents a visualisation of the accuracy of the prediction of the surface roughness parameters.
Figure 14.
Comparison of predicted values with experimental values; end face (a) Ra, (b) Rz, lateral face: (c) Ra, (d) Rz.
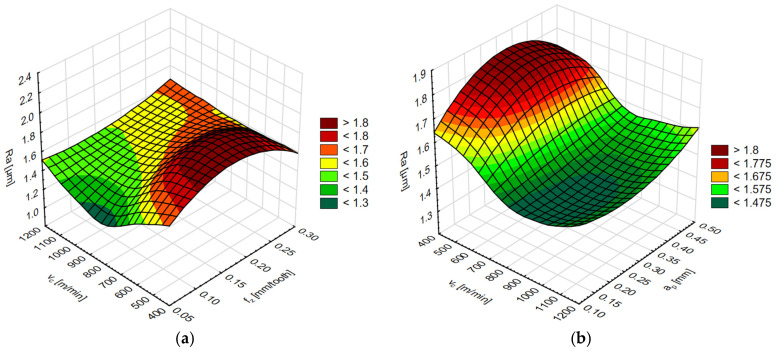
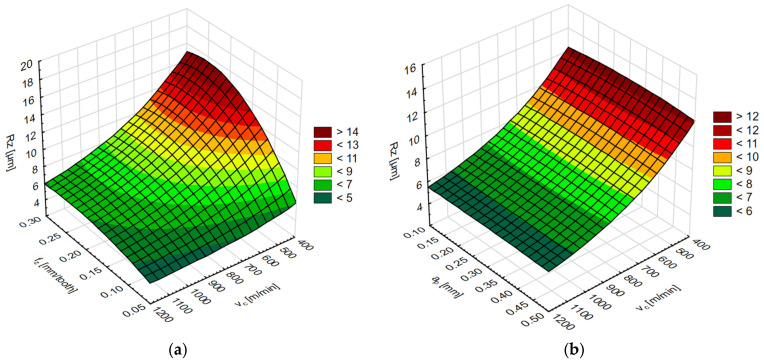
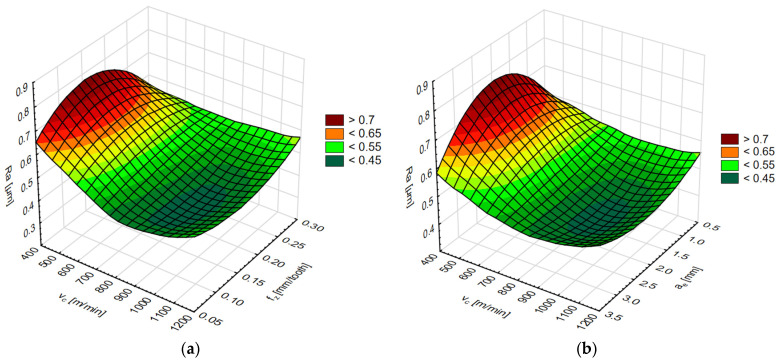
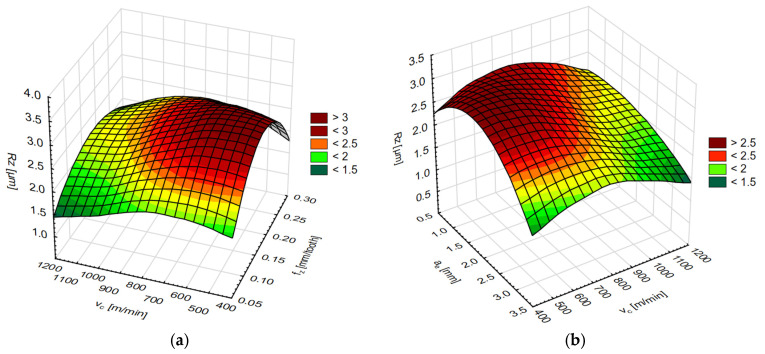
The simulation results for each network are shown in two diagrams, depending on the cutting speed and feed per tooth or cutting speed and axial/radial depth of cut. The results of the surface roughness parameters on the end face of the AZ91D magnesium alloy are shown in Figure 15 and Figure 16 and on the lateral face in Figure 17 and Figure 18.
Figure 15.
Simulation results of the Ra surface roughness parameter (a) for the variable cutting speed vc and feed per tooth fz, and (b) for the variable cutting speed vc and axial depth of cut ap.
Figure 16.
Simulation results of the Rz surface roughness parameter (a) for the variable cutting speed vc and feed per tooth fz, and (b) for the variable cutting speed vc and axial depth of cut ap.
Figure 17.
Simulation results of the Ra surface roughness parameter (a) for the variable cutting speed vc and feed per tooth fz, and (b) for the variable cutting speed vc and radial depth of cut ae.
Figure 18.
Simulation results of the Rz surface roughness parameter (a) for the variable cutting speed vc and feed per tooth fz, and (b) for the variable cutting speed vc and radial depth of cut ae.
In order to determine whether each technological parameter affects the roughness parameter, a sensitivity analysis was performed (Table 16). None of the analysed technological parameters obtained a sensitivity analysis value below 1, which means that each of them had a significant impact. If you remove one of the vc, fz, ap or ae parameters, the network quality may be degraded. The cutting speed vc was the parameter that had the strongest influence on the roughness parameters Ra and Rz on both the lateral and the end faces [47].
Table 16.
Sensitivity analysis values for the technological parameters: cutting speed vc and feed per tooth fz, axial depth of cut ap, radial depth of cut ae.
| Sensitivity Analysis | ||||
|---|---|---|---|---|
| End face of workpiece | vc | fz | ap | |
| Ra | RBF 3-9-1 | 11.83949 | 6.30613 | 1.43421 |
| Rz | MLP 3-2-1 | 8.503714 | 4.79162 | 1.356 |
| Lateral face of workpiece | vc | fz | ae | |
| Ra | RBF 3-10-1 | 42.32768 | 3.59427 | 2.36995 |
| Rz | RBF 3-10-1 | 18.29399 | 2.81688 | 3.5018 |
In summary, the relative error between the roughness parameter values from the ANN simulation and the experimental values did not exceed 15%. This means that the network quality was good enough to be used for simulation [37].
4. Conclusions
The conducted research and analyses allowed for the following conclusions:
The increase in the cutting speed has the greatest influence on the surface roughness. For both tools (λs = 20°, λs = 50°), a clear decrease in the roughness parameter values for both magnesium alloys AZ91D and AZ31 was observed.
Increasing feed per tooth reduces the surface quality; for the AZ91D magnesium alloy, a radical increase in the roughness parameters values was observed after the increase from fz= 0.05 to 0.1 mm/tooth. Within the range of fz = 0.1–0.3 mm/tooth, no significant changes were observed.
The differences in roughness parameters depending on the tool used were clearly noticed after changing the radial and axial depth of cut.
Axial and radial depth of cut had a negligible influence on the values of the surface roughness parameters for the tool λs = 20° for both AZ31 and AZ91D alloys.
For the tool λs = 20°, differences were observed in the roughness parameters between the AZ91D and AZ31 alloys after changes in the cutting speed and the feed rate per tooth (lower roughness parameter values were obtained for AZ31).
Comparing the AZ91D and AZ31 alloy surface quality after milling using the tool λs = 50°, significant differences were found after changing the feed rate per tooth, the axial depth of cut (end face) and the radial depth of cut (lateral face). For the AZ31 magnesium alloy, lower parameter values were obtained, and less radical changes were observed from the increase in a given cutting parameter.
The statistical analysis of the roughness parameters Ra and Rz confirmed the inequality of the mean values and medians when changing the cutting speed vc. The increase in the cutting speed from 400 to 1200 m/min had a positive impact on the mentioned parameters (lower values of the surface roughness parameters were observed at the cutting speed vc = 1200 m/min).
The statistical analysis shows that for all cases, the change of the feed per tooth fz influenced the values of the Ra parameter. With the increase in the feed per tooth value from 0.05 to 0.3 mm/tooth, higher values of this parameter were obtained.
Comparing the tools used in the research, it was noticed that for the λs = 50° tool, in a large number of cases, the normality of the distribution was not confirmed, which results from the number of Mann–Whitney U tests performed.
The RBF neural network turned out to be a better type of network than the MLP in most cases for modelling the Ra and Rz surface roughness parameters obtained after milling the AZ91D magnesium alloy. The networks obtained for the analysed parameters had from 2 to 10 neurons in the hidden layer.
The network obtained as a result of the surface roughness parameter modelling shows satisfactory predictive ability, as evidenced by the obtained values of the R2 correlation coefficient for the appropriate training and validation data. For the training data, they are, respectively, Ra = 0.9758 (end face of workpiece), Ra = 0.9947 (lateral face of workpiece), Rz = 0.9604 (end face of workpiece) and Rz = 0.9951 (lateral face of workpiece), and for the validation data, Ra = 0.9773 (end face of workpiece), Ra = 0.9283 (lateral face of workpiece), Rz = 0.9864 (end face of workpiece) and Rz = 0.9804 (lateral face of workpiece). It can, therefore, be concluded that artificial neural networks are an effective tool that can be used to predict surface roughness parameters.
The trained networks show the relationships between the input data (vc, fz, ap and ae) and the output data (Ra and Rz parameters), enabling the determination of the appropriate values of the analysed surface roughness parameters after entering the given processing parameters into the network.
In workshop practice, it may be most useful to determine the presented technological parameters of milling, under which machining can take place under conditions defined as safe, effective and efficient. Often, industrial manufacturers do not have the appropriate research equipment, and above all, the time needed to carry out research and the measurement, it is also impossible to withhold or suspend the production in progress. It should be emphasized that in industrial practice, low technological milling parameters are often used, justifying it with safety reasons. Hence, the presented research works may be valuable due to the possibility of implementing the presented scope of technological milling parameters in industrial applications.
In the broadly understood workshop practice, it may be most precious to define such machining parameters for which milling can be finish machining, and constitute a very effective, efficient and safe process (without risk of chip flammability and their ignition). Therefore, the presented research investigations may precious due to the possibility of their application in the industrial and manufacturing practice.
Nomenclature
| vc | cutting speed (m/min) |
| fz | feed per tooth (mm/tooth) |
| ap | axial depth of cut (mm) |
| ae | radial depth of cut (mm) |
| λs | helix angle (°) |
| γ | tool rake angle (°) |
| α | tool clearance angle (°) or significance level (in statistical analysis) |
| ANN | artificial neural network |
| MLP | Multi-layered perceptron |
| RBF | Radial Basis Function |
Author Contributions
Conceptualisation, I.Z.; methodology, I.Z., M.K. and A.S.; software, M.K. and A.S.; validation, I.Z., M.K. and A.S.; formal analysis, I.Z., M.K. and A.S.; investigation, I.Z., M.K. and A.S.; resources, I.Z., M.K. and A.S.; data curation, A.S.; writing—original draft preparation, I.Z., M.K. and A.S.; writing—review and editing, I.Z., M.K., J.K. and A.S.; visualisation, I.Z., M.K. and A.S.; supervision, I.Z.; project administration, I.Z.; funding acquisition, I.Z. and J.K. All authors have read and agreed to the published version of the manuscript.
Institutional Review Board Statement
Not applicable.
Informed Consent Statement
Not applicable.
Data Availability Statement
Not applicable.
Conflicts of Interest
The authors declare no conflict of interest.
Funding Statement
The project/research was financed in the framework of the project Lublin University of Technology—Regional Excellence Initiative, funded by the Polish Ministry of Science and Higher Education (contract no. 030/RID/2018/19).
Footnotes
Publisher’s Note: MDPI stays neutral with regard to jurisdictional claims in published maps and institutional affiliations.
References
- 1.Jia Q., He W., Hua D., Zhou Q., Du Y., Ren Y., Lu Z., Wang H., Zhou F., Wang J. Effects of structure relaxation and surface oxidation on nanoscopic wear behaviors of metallic glass. Acta Mater. 2022;232:117934. doi: 10.1016/j.actamat.2022.117934. [DOI] [Google Scholar]
- 2.Luo D., Zhou Q., Ye W., Ren Y., Greiner C., He Y., Wang H. Design and Characterization of Self-Lubricating Refractory High Entropy Alloy-Based Multilayered Films. ACS Appl. Mater. Interfaces. 2021;13:55712–55725. doi: 10.1021/acsami.1c16949. [DOI] [PubMed] [Google Scholar]
- 3.Hua D., Xia Q., Wang W., Zhou Q., Li S., Qian D., Shi J., Wang H. Atomistic insights into the deformation mechanism of a CoCrNi medium entropy alloy under nanoindentation. Int. J. Plast. 2021;142:102997. doi: 10.1016/j.ijplas.2021.102997. [DOI] [Google Scholar]
- 4.Oczoś K.E., Kawalec A. Forming Light Alloys. PWN; Warsaw, Poland: 2012. [Google Scholar]
- 5.Grzesik W. Fundamentals of Cutting Construction Materials. WNT; Warsaw, Poland: 2018. [Google Scholar]
- 6.Sedlaček M., Gregorčič P., Podgornik B. Use of the Roughness Parameters Ssk and Sku to Control Friction-A Method for Designing Surface Texturing. Tribol. Trans. 2017;60:260–268. doi: 10.1080/10402004.2016.1159358. [DOI] [Google Scholar]
- 7.Zagórski I., Korpysa J. Surface Quality Assessment after Milling AZ91D Magnesium Alloy Using PCD Tool. Materials. 2020;13:617. doi: 10.3390/ma13030617. [DOI] [PMC free article] [PubMed] [Google Scholar]
- 8.Li G., Zhang K., Gong J., Jin X. Calculation method for fractal characteristics of machining topography surface based on wavelet transform. Procedia CIRP. 2019;79:500–504. doi: 10.1016/j.procir.2019.02.109. [DOI] [Google Scholar]
- 9.Gogolewski D. Fractional spline wavelets within the surface texture analysis. Measurement. 2021;179:109435. doi: 10.1016/j.measurement.2021.109435. [DOI] [Google Scholar]
- 10.Sun J., Song Z., He G., Sang Y. An improved signal determination method on machined surface topography. Precis. Eng. 2018;51:338–347. doi: 10.1016/j.precisioneng.2017.09.004. [DOI] [Google Scholar]
- 11.Gogolewski D., Makieła W., Nowakowski Ł. An assessment of applicability of the two-dimensional wavelet transform to assess the minimum chip thickness determination accuracy. Metrol. Meas. Syst. 2020;27:659–672. [Google Scholar]
- 12.Korpysa J., Kuczmaszewski J., Zagórski I. Dimensional Accuracy and Surface Quality of AZ91D Magnesium Alloy Components after Precision Milling. Materials. 2021;14:6446. doi: 10.3390/ma14216446. [DOI] [PMC free article] [PubMed] [Google Scholar]
- 13.Guo Y.B., Salahshoor M. Process mechanics and surface integrity by high-speed dry milling of biodegradable magnesium—Calcium implant alloys. CIRP Ann.-Manuf. Technol. 2010;59:151–154. doi: 10.1016/j.cirp.2010.03.051. [DOI] [Google Scholar]
- 14.Salahshoor M., Guo Y.B. Surface integrity of magnesium-calcium implants processed by synergistic dry cutting-finish burnishing. Procedia Eng. 2011;19:288–293. doi: 10.1016/j.proeng.2011.11.114. [DOI] [Google Scholar]
- 15.Qiao Y., Wang S., Guo P., Yang X., Wang Y. Experimental research on surface roughness of milling medical magnesium alloy. IOP Conf. Ser. Mater. Sci. Eng. 2018;397:012114. doi: 10.1088/1757-899X/397/1/012114. [DOI] [Google Scholar]
- 16.Desai S., Malvade N., Pawade R., Warhatkar H. Effect of High Speed Dry Machining on Surface integrity and Biodegradability of Mg-Ca1.0 Biodegradable Alloy. Mater. Today Proc. 2017;4:6718–6727. doi: 10.1016/j.matpr.2017.06.447. [DOI] [Google Scholar]
- 17.Sathyamoorthy V., Deepan S., Sathya Prasanth S.P., Prabhu L. Optimization of Machining Parameters for Surface Roughness in End Milling of Magnesium AM60 Alloy. Indian J. Sci. Technol. 2017;10:1–7. doi: 10.17485/ijst/2017/v10i32/104651. [DOI] [Google Scholar]
- 18.Gziut O., Kuczmaszewski J., Zagórski I. Surface quality assessment following high performance cutting of AZ91HP magnesium alloy. Manag. Prod. Eng. Rev. 2015;6:4–9. doi: 10.1515/mper-2015-0001. [DOI] [Google Scholar]
- 19.Zagórski I., Korpysa J. Surface quality in milling of AZ91D magnesium alloy. Adv. Sci. Technol. Res. J. 2019;13:119–129. doi: 10.12913/22998624/108547. [DOI] [Google Scholar]
- 20.Wiciak-Pikuła M., Felusiak A., Chwalczuk T., Twardowski P. Surface roughness and forces prediction of milling Inconel 718 with neural network; Proceedings of the 2020 IEEE 7th International Workshop on Metrology for AeroSpace (MetroAeroSpace); Pisa, Italy. 22–24 June 2020; Manhattan, NY, USA: IEEE; 2020. pp. 260–264. [Google Scholar]
- 21.Nguyen V.C., Nguyen T.D., Tien D.H. Cutting Parameter Optimization in Finishing Milling of Ti-6Al-4V Titanium Alloy under MQL Condition using TOPSIS and ANOVA Analysis. Eng. Technol. Appl. Sci. Res. 2021;11:6775–6780. doi: 10.48084/etasr.4015. [DOI] [Google Scholar]
- 22.Asiltürk I., Çunkaş M. Modeling and prediction of surface roughness in turning operations using artificial neural network and multiple regression method. Expert Syst. Appl. 2011;38:5826–5832. doi: 10.1016/j.eswa.2010.11.041. [DOI] [Google Scholar]
- 23.Akkuş H., Yaka H. Optimization of Cutting Parameters in Turning of Titanium Alloy (Grade 5) by Analysing Surface Roughness, Tool Wear and Energy Consumption. Exp. Tech. 2021:1–12. doi: 10.1007/s40799-021-00525-6. [DOI] [PMC free article] [PubMed] [Google Scholar]
- 24.Shivakoti I., Das P.P., Kibria G., Khanal B., Bhattarai A., Gupta N.K., Pradhan B.B., Sharma A. Selection of Optimal Turning Parameters Using Multi-Criteria Decision Methods. J. Mult.-Valued Log. Soft Comput. 2021;37:601–618. [Google Scholar]
- 25.Ayyıldız E.A., Ayyıldız M., Kara F. Optimization of Surface Roughness in Drilling Medium-Density Fiberboard with a Parallel Robot. Adv. Mater. Sci. Eng. 2021;2021:6658968. doi: 10.1155/2021/6658968. [DOI] [Google Scholar]
- 26.Sangwan K.S., Saxena S., Kant G. Optimization of machining parameters to minimize surface roughness using integrated ANN-GA approach. Procedia CIRP. 2015;29:305–310. doi: 10.1016/j.procir.2015.02.002. [DOI] [Google Scholar]
- 27.Kaviarasan V., Venkatesan R., Natarajan E. Prediction of surface quality and optimization of process parameters in drilling of Delrin using neural network. Prog. Rubber Plast. Recycl. Technol. 2019;35:149–169. doi: 10.1177/1477760619855078. [DOI] [Google Scholar]
- 28.Zerti A., Yallese M.A., Zerti O., Nouioua M., Khettabi R. Prediction of machining performance using RSM and ANN models in hard turning of martensitic stainless steel AISI 420. Proc. Inst. Mech. Eng. 2019;233:4439–4462. doi: 10.1177/0954406218820557. [DOI] [Google Scholar]
- 29.Abbas A.T., Pimenov D.Y., Erdakov I.N., Taha M.A., Soliman M.S., El Rayes M.M. ANN Surface Roughness Optimization of AZ61 Magnesium Alloy Finish Turning: Minimum Machining Times at Prime Machining Costs. Materials. 2018;11:808. doi: 10.3390/ma11050808. [DOI] [PMC free article] [PubMed] [Google Scholar]
- 30.Kulisz M., Zagórski I., Korpysa J. Surface quality simulation with statistical analysis after milling AZ91D magnesium alloy using PCD tool. J. Phys. Conf. Ser. 2021;1736:012034. doi: 10.1088/1742-6596/1736/1/012034. [DOI] [Google Scholar]
- 31.Pradeepkumar M., Venkatesan R., Kaviarasan V. Evaluation of the surface integrity in the milling of a magnesium alloy using an artificial neural network and a genetic algorithm. Mater. Technol. 2018;52:367–373. doi: 10.17222/mit.2017.198. [DOI] [Google Scholar]
- 32.Zagórski I., Kłonica M., Kulisz M., Łoza K. Effect of the AWJM method on the machined surface layer of AZ91D magnesium alloy and simulation of roughness parameters using neural networks. Materials. 2018;11:2111. doi: 10.3390/ma11112111. [DOI] [PMC free article] [PubMed] [Google Scholar]
- 33.Acayaba G.M.A., Escalona P.M.D. Prediction of surface roughness in low speed turning of AISI316 austenitic stainless steel. CIRP J. Manuf. Sci. Technol. 2015;11:62–67. doi: 10.1016/j.cirpj.2015.08.004. [DOI] [Google Scholar]
- 34.Cojbasic Z., Petkovic D., Shamshirband S., Chong W.T., Sudheer C., Jankovic P., Ducic N., Baralic J. Surface roughness prediction by extreme learning machine constructed with abrasive water jet. Precis. Eng. 2016;43:86–92. doi: 10.1016/j.precisioneng.2015.06.013. [DOI] [Google Scholar]
- 35.Eser A., Ayyıldız E.A., Ayyıldız M., Kara F. Artificial Intelligence-Based Surface Roughness Estimation Modelling for Milling of AA6061 Alloy. Adv. Mater. Sci. Eng. 2021;2021:5576600. doi: 10.1155/2021/5576600. [DOI] [Google Scholar]
- 36.Santhakumar J., Iqbal U.M. Role of trochoidal machining process parameter and chip morphology studies during end milling of AISI D3 steel. J. Intell. Manuf. 2019;32:649–665. doi: 10.1007/s10845-019-01517-5. [DOI] [Google Scholar]
- 37.Asadi R., Yeganefar A., Niknam S.A. Optimization and prediction of surface quality and cutting forces in the milling of aluminium alloys using ANFIS and interval type 2 neuro fuzzy network coupled with population-based meta-heuristic learning methods. Int. J. Adv. Manuf. Technol. 2019;105:2271–2287. doi: 10.1007/s00170-019-04309-6. [DOI] [Google Scholar]
- 38.Karkalos N.E., Galanis N.I., Markopoulos A.P. Surface roughness prediction for the milling of Ti-6Al-4V ELI alloy with the use of statistical and soft computing techniques. Measurement. 2016;90:25–35. doi: 10.1016/j.measurement.2016.04.039. [DOI] [Google Scholar]
- 39.Yanis M., Mohruni A.S., Sharif S., Yani I. Optimum performance of green machining on thin walled TI6AL4V using RSM and ANN in terms of cutting force and surface roughness. J. Teknol. 2019;81:51–60. doi: 10.11113/jt.v81.13443. [DOI] [Google Scholar]
- 40.Dijmărescu M.R., Abaza B.F., Voiculescu I., Dijmărescu M.C., Ciocan I. Surface Roughness Analysis and Prediction with an Artificial Neural Network Model for Dry Milling of Co–Cr Biomedical Alloys. Materials. 2021;14:6361. doi: 10.3390/ma14216361. [DOI] [PMC free article] [PubMed] [Google Scholar]
- 41.Wu T.Y., Lei K.W. Prediction of surface roughness in milling process using vibration signal analysis and artificial neural network. Int. J. Adv. Manuf. Technol. 2019;102:305–314. doi: 10.1007/s00170-018-3176-2. [DOI] [Google Scholar]
- 42.Chen Y., Sun Y., Lin H., Zhang B. Prediction Model of Milling Surface Roughness Based on Genetic Algorithms. In: Xu Z., Choo K.K., Dehghantanha A., Parizi R., Hammoudeh M., editors. Advances in Intelligent Systems and Computing—Cyber Security Intelligence and Analytics. Springer; Cham, Switzerland: 2020. p. 928. [Google Scholar]
- 43.Watroba J. Data Analysis in Statistica 9-Review. Statsoft Polska; Cracow, Poland: 2009. Data mining, testing of research hypotheses and relationship modeling-examples in Statistica 9. [Google Scholar]
- 44.Kulisz M., Zagórski I., Korpysa J. The Effect of Abrasive Waterjet Machining Parameters on the Condition of Al-Si Alloy. Materials. 2020;13:3122. doi: 10.3390/ma13143122. [DOI] [PMC free article] [PubMed] [Google Scholar]
- 45.Szaleniec M. Applications of Statistics and Data Mining in Scientific Research—Review. Statsoft Polska; Kraków, Poland: 2008. Neural networks and multiple regression-how to tame complexity in scientific research. [Google Scholar]
- 46.Montgomery D.C., Runger G.C. Applied Statistics and Probability for Engineers. 3rd ed. John Wiley & Sons, Inc.; Hoboken, NJ, USA: 2003. [Google Scholar]
- 47.Szaleniec J. Applications of Statistics and Data Mining in Scientific Research and Improvement of Production Processes with the Use of Data Analysis—Review. Statsoft Polska; Cracow, Poland: 2015. How to avoid traps when building neural networks? Predicting the results of paranasal sinuses operation. [Google Scholar]
Associated Data
This section collects any data citations, data availability statements, or supplementary materials included in this article.
Data Availability Statement
Not applicable.


