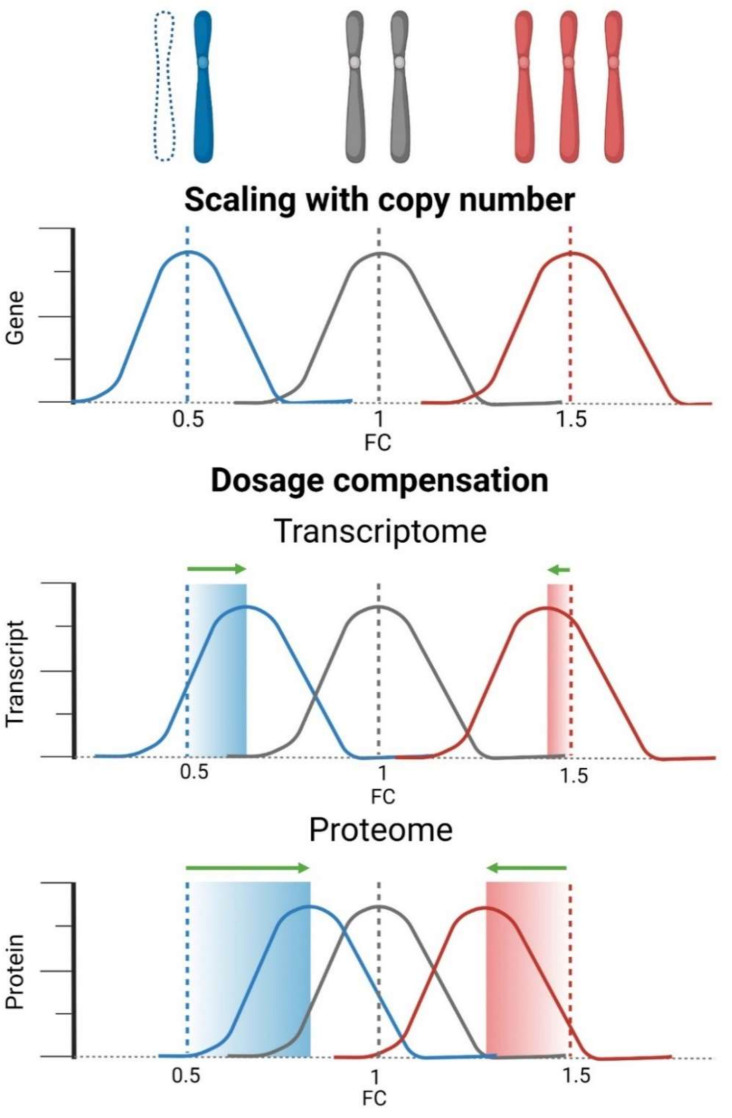
Figure 2.
Gene dosage compensation on transcriptome and proteome level. Monosomy (blue) results in a gene dosage reduction, which is manifested in 50% reduction compared to the diploid status. This can also be expressed as the fold change (FC); the expected median (dashed line) is 0.5 compared to the diploid status 1 (grey), or log2FC = −1 compared to the diploid status log2FC = 0 (not depicted). In reverse, a chromosome gain (red) results in a 50% increase compared to diploids, which is a FC of 1.5, and log2FC = ~0.58. If gene expression reflects the copy number alterations, the same changes will be detected on transcriptome and proteome level. If gene expression becomes compensated toward diploidy on the transcriptome level and proteome level, the calculated FC compared to diploid status changes. Strikingly, the dosage compensation is often stronger at the proteome level than at the transcriptome level, and stronger upon chromosome loss than upon chromosome gain.

