

Abstract
It has previously been shown that, conditional on its fixation, the time to fixation of a semi-dominant deleterious autosomal mutation in a randomly mating population is the same as that of an advantageous mutation. This result implies that deleterious mutations could generate selective sweep-like effects. Although their fixation probabilities greatly differ, the much larger input of deleterious relative to beneficial mutations suggests that this phenomenon could be important. We here examine how the fixation of mildly deleterious mutations affects levels and patterns of polymorphism at linked sites—both in the presence and absence of interference amongst deleterious mutations—and how this class of sites may contribute to divergence between-populations and species. We find that, while deleterious fixations are unlikely to represent a significant proportion of outliers in polymorphism-based genomic scans within populations, minor shifts in the frequencies of deleterious mutations can influence the proportions of private variants and the value of FST after a recent population split. As sites subject to deleterious mutations are necessarily found in functional genomic regions, interpretations in terms of recurrent positive selection may require reconsideration.
Keywords: population genetics, selective sweeps, genetic hitchhiking, deleterious mutations
Johri, Charlesworth et al. re-visit an under-appreciated result from Maruyama & Kimura (1974) pertaining to deleterious fixations resulting in selective sweep-like patterns. The authors extend theory and perform simulations to examine this phenomenon, interpreting it in the contexts of single-population polymorphism-based and between-population Fst-based scans for selection. They demonstrate that, while the effect is probably too localized to be meaningfully misleading in the former, it may be a significant source of error and false-positives in the latter
Introduction
Among the most important results in theoretical population genetics, now nearly a century old, are the fixation probabilities of new beneficial and deleterious mutations, which were obtained by Fisher (1922, 1930), Haldane (1927), and Wright (1931), using different approaches. Their results were later generalized by Kimura (1957, 1962, 1964), using the backward diffusion equation. A somewhat lesser-known result concerns the trajectories of these selected mutations. Specifically, Maruyama and Kimura (1974) found that, conditional on fixation, the time that a beneficial autosomal mutation with selection coefficient +s and dominance coefficient h spends in a given interval of allele frequency in a randomly mating population is the same as that for a deleterious mutation with selection coefficient -s and dominance coefficient 1—h, provided that the conditions for the validity of the diffusion equation approximation hold (i.e., the change in allele frequency of the mutation is small enough to be approximated by a continuous-time diffusion process). Thus, given that the effects of selective sweeps on variability at linked neutral sites are related to their speed of transit through a population (Maynard Smith and Haigh 1974; Stephan 2019), the fixation of a deleterious mutation by genetic drift can generate a similar selective sweep effect to that caused by the fixation of a beneficial mutation, for mutations with the same magnitude of selection coefficient. Moreover, Tajima (1990) demonstrated that, on average, there is a ∼42% mean reduction in diversity at a site where a neutral mutation has recently become fixed by genetic drift. While the mean time to fixation for this class of mutation in diploids is well known to be 4 Ne generations (Kimura and Ohta 1969), this is associated with a wide variance of approximately 4.64 Ne2 (Kimura 1970), such that neutral mutations may also fix relatively rapidly (in less than Ne generations) and generate an appreciable but highly localized sweep effect (see Tables 1 and 2 of Tajima 1990).
Of course, the probabilities of fixation of deleterious and beneficial mutations differ greatly. However, given that the input of deleterious mutations is much higher than the input of beneficial mutations each generation (see reviews by Eyre-Walker and Keightley 2007; Bank et al. 2014a), the potential contribution of such deleterious sweeps to levels and patterns of nucleotide variation, as well as divergence between populations and species, remains an important open question (Charlesworth 2020a). An alternative way of viewing this issue, as discussed by Gillespie (1994) and Charlesworth and Eyre-Walker (2007), is that under a model of constant selection and reversible mutation between two alternative nucleotide variants, statistical equilibrium with respect to the frequencies of sites fixed for the alternatives implies equal rates of beneficial and deleterious substitutions per unit time. It is important to note, however, that only deleterious mutations with selection coefficients on the order of the reciprocal of the population size have significant probabilities of fixation (Fisher 1930; Kimura 1964), implying that the substitutions concerned involve only very weakly selected mutations. The effects on diversity statistics of sweeps of very weakly selected mutations, including those of deleterious mutations, appears to have been investigated previously only by Mafessoni and Lachmann (2015).
A starting point for investigating this problem is the distribution of fitness effects of new mutations (the DFE). There is substantial evidence from both empirical and experimental studies that the DFE of new mutations is bimodal—consisting of a strongly deleterious mode, and a weakly deleterious/neutral mode that may contain a beneficial tail under certain conditions (e.g., Crow 1993; Lynch et al. 1999; Sanjuán 2010; Jacquier et al. 2013; Bank et al. 2014b). While the calculations and simulations presented below represent a general approach to addressing this topic, we have necessarily chosen a specific DFE realization and species for illustration. Specifically, Johri et al. (2020) recently presented an approximate Bayesian (ABC) approach, which represents the first joint estimator of the DFE shape together with population history, and which corrects for the effects of background selection (BGS; Charlesworth et al. 1993). They estimated that a substantial proportion of new mutations in coding regions have mildly deleterious effects on fitness, emphasizing the importance of further understanding the consequences of such mutations in dictating observed polymorphism and divergence. Furthermore, they found it unnecessary to invoke a beneficial mutational class in order to fit the data from the African population of Drosophila melanogaster that they considered.
This analysis provides a basis for exploring the possible implications of sweeps of deleterious mutations, a topic that has been neglected. Here, we re-examine this question, considering both single and recurrent substitution models, which we use to examine the possibility that genomic scans for positive selection may in fact also be identifying deleterious fixations, when based on: (a) levels and patterns of variation; (b) population differentiation; and (c) species-level divergence. Our results suggest that, while this phenomenon is unlikely to be a major factor in polymorphism-based scans within populations, it may be a serious confounder in among-population-based analyses.
Materials and methods
Analytical calculations
For convenience, we assume a Wright-Fisher population of N randomly mating diploid individuals throughout the analytical section. This assumption of an absence of population structure is common and reasonably well-justified in organisms with low like D. melanogaster, although the investigation of these dynamics in the presence of structure would be of great value in the future. Furthermore, the selection coefficient for homozygotes is constant over time and is denoted by s, with and representing selection for and against homozygotes, respectively. In addition, the DFE for semi-dominant deleterious mutations is assumed to be discrete, with four fixed classes of mutations given by 0 < 2N ≤ 1, 1 <2N ≤ 10, 10 < 2N≤ 100, and 100 < 2N ≤ 2N, where mutations are assumed to follow a uniform distribution within each class. These assumptions concerning the distribution of were made in order to simplify integration over the DFE (Johri et al. 2020; Johri et al. 2021).
Probability of fixation
The fixation probability (Pfix) of a new semi-dominant mutation with an initial frequency of 1/(2N) in a Wright-Fisher population of size N was calculated using Equation 10 of Kimura (1962):
| (1) |
Note that this equation assumes demographic equilibrium and independence between the selected sites (violations of this assumption are investigated below), as well as |s| ≪ 1.
Contributions to divergence
Under the DFE model described above, the number of fixations Nfix (i) expected per generation per site for a given DFE class i of deleterious mutations is given by the following expression:
| (2) |
where μ is the total mutation rate per site per generation, fi represents the proportion of new mutations belonging to the ith DFE class and sd2 and sd1 represent the upper and lower bounds to the DFE class, respectively. The integral in Equation (2) was evaluated analytically by means of an infinite series representation (derivation provided in Appendix), which was validated using the “integrate” function in R (R Core Team 2018).
Probability of fixation when correcting for the effects of BGS
The fixation probability () of a new semi-dominant mutation with the homozygous selection coefficient was calculated as:
| (3) |
where represents the effective population size in the presence of BGS, calculated from the corresponding ratio of neutral diversity with and without BGS (see, e.g., Campos and Charlesworth 2019). The mean probability of fixation over an interval of selection coefficients, assuming that mutations are uniformly distributed in this interval (), was calculated as:
| (4) |
where , and and represent the upper and lower bound to the interval, respectively.
Waiting and fixation times
The waiting time (tw) between fixations under a Poisson process was calculated as follows:
| (5) |
where represents the number of functional sites under consideration.
In order to compare the results of simulations to theoretical expectations, the expected time to fixation of a semi-dominant mutation was also calculated by numerically integrating Equation (17) of Kimura and Ohta (1969), using Simpson’s rule (Atkinson 1989).
Reduction in diversity due to a single sweep
The expected reduction in pairwise nucleotide site diversity at the end of a sweep (–), relative to the diversity in the absence of selection, was calculated using Equation (14a) of Charlesworth (2020b) for a nonzero rate of recombination (omitting a factor that describes the effect of BGS):
| (6) |
where Ts is the mean coalescent time (in units of 2N generations) for a pair of alleles sampled at the end of a sweep, Td is the duration of the deterministic phase of the sweep (i.e., excluding the initial and final stochastic phases) in units of 2N generations, is the mean time to a recombination event during the sweep, conditioned on the occurrence of a recombination event; is the probability of at least one recombination event transferring a sampled allele onto the wild-type background during the sweep, and is the probability that there is only a single such recombination event. For large values of the ratio of the rate of recombination between the neutral and selected site (r) to the magnitude of the selection coefficient, this expression can become negative, in which case it is reset to zero.
We also used simulations based on Equations (27) of Tajima (1990), which provide recursion equations for the expectation of the pairwise diversity at a neutral locus linked to a selected locus, conditional on a given trajectory of allele frequency change at the selected locus, as described by Charlesworth (2020b). These equations require only the validity of the diffusion equation approximation. Binomial sampling of allele frequencies post-selection in each generation was used to generate the trajectories of change at the selected locus, using the standard selection equation for a single locus to calculate the deterministic change in allele frequency each generation. Application of the recursion equations to a trajectory of allele-frequency change simulated in this way gives one realization of Δπ; and the overall expected value of Δπ can be obtained from the mean of the simulated values over a large number of replicates. It was found that 1000 replicates gave very accurate estimates of Δπ, with ratios of the standard errors to the means of <5% for the parameter sets used here. Due to the symmetry in the sojourn time (conditional on fixation) in a given interval of allele frequency for beneficial and deleterious mutations when semi-dominance is assumed (Maruyama and Kimura 1974), trajectories for weakly deleterious mutations of selection coefficient were simulated assuming a beneficial selection coefficient . Note that this symmetry does not apply to partially dominant or partially recessive mutations—see Ewens (2004, pp. 170, 171) for a full discussion.
Population genetic parameters used for analytical calculations
The parameters for the calculations were chosen to match those estimated from D. melanogaster populations, estimated from exonic sites. Mutations occurred at a rate μ per basepair (bp) per generation, and were assumed to be a mixture of neutral, nearly neutral and weakly deleterious mutations. For this analysis, μ = 3 × 10⁻⁹ (Keightley et al. 2009, 2014). The sex-averaged rate of crossing over per bp (rc) was assumed to be equal to 10−8 per generation, the mean value for D. melanogaster autosomes (Fiston-Lavier et al. 2010), the effective population size was 106 (Arguello et al. 2019; Johri et al. 2020), and 10 generations per year were assumed. Given estimates of neutral divergence between D. melanogaster and D. simulans, this means that t ∼21.3 × 10⁶ generations elapsed since their common ancestor (Li et al. 1999; Halligan and Keightley 2006), corresponding to 2.13 million years.
Because noncrossover associated gene conversion is an important source of recombination between closely linked sites in Drosophila, it was assumed to occur uniformly across the genome, independently of local differences in the rate of crossing over, as indicated by the data on D. melanogaster (Comeron et al. 2012; Miller et al. 2016). The sex-averaged rate of initiation per bp of conversion events was rg = 10−8 per bp per generation, and there was an exponential distribution of tract length with a mean of dg = 440 bp (Comeron et al. 2012; Miller et al. 2016). The net rate of recombination between sites separated by z bp, r(z), is the sum of the contributions from crossing over and noncrossover gene conversion, given by the formula of Frisse et al. (2001):
| (7) |
For some of the results presented below, only the net rate of recombination r, or its value scaled by the effective population size, ρ = 2Nr, was used. In the presence of gene conversion with the parameters described above, the corresponding value of z can then be obtained by Newton-Raphson iteration of the equation r(z) – r = 0, assuming that the rate of gene conversion does not vary with the rate of crossing over.
Simulations
Simulating individual fixations in a single population
SLiM 3.3.1 (Haller and Messer 2019) was used to simulate a genomic element of length 10 kb. For the single sweep model, in order to quantify the hitchhiking effect of a single fixation, selection only acted on a single site in the middle of the region, with all other sites evolving neutrally. Simulations were performed for five different values of the scaled selection coefficient: 2Ns = 0, −1, +1, −5, and +5. Population genetic parameters resembling those of D. melanogaster were utilized (as defined above) for illustrative purposes. In order to perform simulations efficiently, population size was scaled down by a factor of 100 while the mutation and recombination rates were correspondingly scaled up by the same factor. Simulations were run for a burn-in period of 105 generations (10 Nsim) after which a mutation with a scaled selection coefficient of 2Ns was introduced at the selected site. Simulations in which the introduced mutation reached fixation were retained for analysis. Fifty diploid individuals were sampled at the completion of the simulations to mimic generally available population-genomic data, and population genetic summary statistics were calculated using Pylibseq (Thornton 2003).
Simulating fixations in a single population in the presence of other deleterious mutations
SLiM 3.1 (Haller and Messer 2019) was used to perform simulations resembling both Drosophila- and human-like populations in order to assess the effects of Hill-Robertson interference (Hill and Robertson 1966) amongst deleterious mutations (reviewed by Charlesworth 2012). For parameters resembling the D. melanogaster populations, a ∼15 kb region which was composed of 2 genes, each with 5 exons (of length 300 bp) and 4 introns (of length 100 bp), and with intergenic lengths of 4 kb was simulated. Intergenic and intronic regions experienced only effectively neutral mutations, while the exons experienced mutations with the DFE inferred by Johri et al. (2020). The population parameters were chosen to mimic the Zimbabwe population of D. melanogaster, with , mutation rate per site/generation and recombination rate per site/generation (Arguello et al. 2019).
For parameters resembling human populations, a ∼60kb region composed of 2 genes, each with 5 exons (of length 300 bp) and 4 introns (of length 2 kb), and with intergenic lengths of 15 kb was simulated. Note that these values are nearer to the median than the mean values of the distribution of lengths of genomic regions in humans, and provide a more conservative assessment of potential interference effects. Intergenic and intronic regions experienced only neutral mutations, while the exons experienced mutations with the DFE inferred by Huber et al. (2017), such that f0 = 0.51, f1 = 0.14, f2 = 0.14 and f3 = 0.21. The population parameters used were , mutation rate = per site/generation and recombination rate = per site/generation.
Simulations were conducted with N = 10,000 diploid individuals for both species, and mutation and recombination rates were scaled appropriately (by the factor 195 for D. melanogaster and 1 for humans). In order to estimate the rates of fixation of deleterious mutations and their effects on linked sites, the simulations were run for 100 N generations (of which 10 N generations represent the burn-in period) and were replicated 100 times for D. melanogaster and 600 times for humans. Our simulations resembling D. melanogaster populations resulted in a mean KA/KS value of 0.08, which is consistent with an observed mean autosomal value of 0.145 for a comparison with a closely related species (Campos et al. 2014), where 50% of substitutions are expected to be due to beneficial mutations.
The total number of observed substitutions (presented in Supplementary Table S1) was used to obtain the frequencies of fixation and times to fixation of deleterious mutations, and nucleotide site diversities at linked neutral sites immediately post-fixation, in order to quantify the potential effects of interference among selected mutations. The frequency of fixations of weakly deleterious mutations with scaled selection coefficients distributed between and , , where (i.e., for a set of mutations that are a subset of the weakly deleterious class of mutations) was calculated as:
where , ; and , when not correcting for BGS, and , when correcting for BGS. Again, is the ratio of the expected nucleotide diversity at a neutral site in the presence of BGS to its value in the absence of BGS.
Simulating multiple populations and FST-based analyses:
Based on a recently inferred demographic history of African and European populations of D. melanogaster using populations sampled from Beijing, the Netherlands, and Zimbabwe (Arguello et al. 2019), an ancestral population of size of 1.95 × 10⁶ was simulated, which split into two populations (6.62 × 10⁴ generations ago) of constant size: 3.91 × 10⁶ and 4.73 × 10⁵, representing African and European populations, respectively. Note that, although Arguello et al. inferred recent growth in both populations, we have assumed constant sizes in order to avoid confounding effects of such growth on the fixation probabilities of mutations, and we also assumed no migration between the two populations. For scenarios following the demographic model presented in Arguello et al. (2019), simulations were also performed for the extreme values of the 95% CIs for the current size of the Zimbabwe population (3.02 × 10⁵, 4.69 × 10⁶), the current size of the European population (2.03 × 10⁵, 3.89 × 10⁶), and the time of split (1.17 × 10⁴, 1.03 × 10⁵). Ten replicates of each combination of the above-mentioned values (i.e., 8 different combinations) were simulated in order to account for uncertainties in parameter estimates. For the purpose of FST analyses, a functional region of size 10 kb was simulated, in which mutations had selection coefficients given by the DFE inferred in Johri et al. (2020). Specifically, the DFE was given by a discrete distribution of four fixed bins with 24.7% of mutations belonging to the effectively neutral class (f0: 0 ≤ 2N <1), 49.4% to the weakly deleterious class (f1: 1 ≤ 2N< 10), 3.9% to the moderately deleterious class (f2: 10 ≤ 2N < 100), and 21.9% to the strongly deleterious class of mutations (f3: 100 < 2N ≤ 2N).
In this two-population framework, four separate scenarios were tested: (1) the DFE remained scaled to the ancestral population size (i.e., the distribution of selection coefficients remained constant throughout, making selection effectively weaker in the smaller derived (European) population); (2) the DFE was rescaled after the population split with respect to subpopulation-specific sizes (i.e., both populations experienced equal proportions of mutations belonging to each DFE class as defined in terms of ), such that selection was equally strong in both populations—this is an arbitrary biological model that is simply chosen for comparison, as one would naturally expect selection to be effectively weaker in the derived population as in scenario 1; (3) in addition to this neutral and deleterious DFE, 1% of all mutations were mildly beneficial with selective effects drawn uniformly from the interval 1 ≤ 2Nsa ≤ 10, where is the increase in fitness of the mutant homozygote; and (4) in addition to this neutral and deleterious DFE, 1% of all mutations were strongly beneficial with 2N = 1000. Note that we refer to selection as being weak when is less than 10. In order to assess the role of population bottlenecks in generating neutral outliers, a fifth scenario was simulated in which there was no selection and the demographic history was that inferred by Li and Stephan (2006)—a model that involves a much larger size reduction than inferred in the Arguello et al. (2019) model utilized above. The parameters of both demographic models are provided in Supplementary Table S2.
Fifty diploid individuals were sampled from both populations in order to calculate FST. All sites that would be considered polymorphic in the metapopulation were used to calculate FST (i.e., sites fixed either in one population or both populations (for different alleles) were also included in FST calculations). FST was calculated in sliding windows across the genomic region for: (a) windows containing a constant number of SNPs (10 SNPs) using the package PopGenome (Pfeifer et al. 2014) in R, and (b) for windows representing the same total number of bases (500 bp) using Pylibseq 0.2.3 (Thornton 2003). FST was calculated for both cases by the method of Hudson et al. (1992). FST was also calculated individually for different mutation types (i.e., for neutral, weakly deleterious, and beneficial mutations, by simply restricting the calculations to segregating sites of the specific mutation type). Although there will be an upper bound to the FST values obtained in this way, which is determined by the frequency of the most frequent allele in the metapopulation (Jakobsson et al. 2013), the detection of outliers should not be affected by this procedure and should mimic the empirical practice. In order to evaluate the performance of haplotype-based population differentiation statistics, was calculated following Excoffier et al. (1992), by performing the Analysis of Molecular Variance (AMOVA) approach implemented in the R package Pegas (http://ape-package.ird.fr/pegas.html) on SNPs present in 500 bp, 1 kb, and 2 kb sliding windows.
Simulating multiple species, and divergence-based analyses
McDonald-Kreitman (MK) tests (McDonald and Kreitman 1991) were performed to investigate the degree to which substitutions of mildly deleterious mutations might affect the inference of divergence due to positive selection. A population resembling a D. melanogaster African population was simulated under demographic equilibrium. Ten independent replicates of a 10 kb protein-coding region were considered such that every third position was neutral (representing synonymous sites) while all other sites represented nonsynonymous positions. Nonsynonymous sites experienced purifying selection given by a DFE that comprised only the nonneutral bins (i.e., f1, f2, and f3, in the same proportions described above), while the neutral sites experienced mutations that belonged to class f0. For comparison, simulations were performed in which 10% or 20% of nonsynonymous mutations were also neutral. In all cases, the simulation was run for 20 N generations (where N = 104). The number of segregating nonsynonymous (PN) and synonymous (PS) sites were estimated by sampling 50 diploid individuals from the population from the functional and neutral regions, respectively. The number of fixed substitutions occurring at the functional sites (DN) and neutral sites (DS) were calculated post burn-in (i.e., after 10 N generations), and then rescaled to the number of generations since the D. melanogaster ancestor.
In order to correct for mildly deleterious mutations segregating in populations, the proportion of adaptive substitutions () was also inferred by implementing a variant of the test referred to as the asymptotic MK test. Messer and Petrov (2013) suggested plotting the derived allele frequency (x) of variants against inferred using the number of segregating sites (P(x)) at that derived allele frequency (i.e., ), and showed that the asymptote of this curve would tend toward the true value of . The asymptotic MK test was performed using a web-based tool available at: http://benhaller.com/messerlab/asymptoticMK.html (Haller and Messer 2017). For the purpose of the asymptotic MK test, values of PN/PS were binned with a bin size of 0.05, and the curve-fitting (of with respect to x) was restricted to derived allele frequencies between 0.1 and 1.0.
Data availability
All scripts used in this study are provided in the Github repository: https://github.com/paruljohri/Deleterious_Sweeps.
Supplementary material is available at GENETICS online.
Results and discussion
Theoretical expectations
As has been long appreciated (Fisher 1930; Wright 1931), Equation (1) implies that the probability of fixation of a mutation in the strongly deleterious DFE classes is vanishingly small. However, the weakly deleterious class may contribute substantially to divergence (Figure 1A). We derived an analytical approximation for the probability of fixation for mutations with a DFE represented as a combination of four nonoverlapping uniform distributions (see Materials and Methods and Appendix). In a Wright-Fisher population, the ratio of the mean probability of fixation of mutations with fitness effects between 1 < 2N ≤ 5, relative to the probability of fixation of effectively neutral mutations (0 < 2N ≤ 1), is 0.27 (note that the value of N is irrelevant if the diffusion approximation holds). This ratio rapidly declines to 0.01 for mutations with fitness effects 5 < 2N ≤ 10 (Figure 1A).
Figure 1.
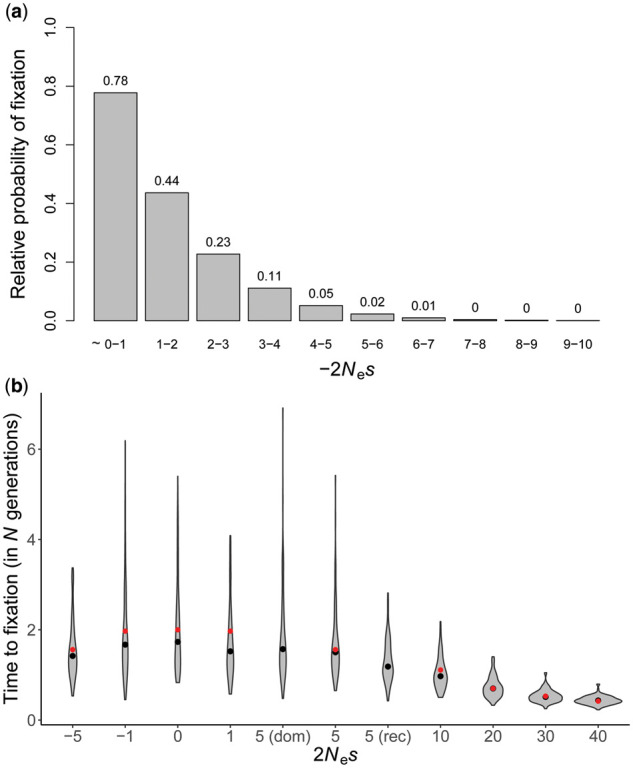
(A) Frequencies of fixations of weakly deleterious mutations relative to those of neutral mutations. (B) The distribution of fixation times (conditional on fixation) of mutations with varying selective effects, obtained from 100 simulated replicates. Fixation times are measured as the time taken for the mutant allele to spread from frequency 1/(2N) to frequency 1. Black solid circles are the means of the distributions obtained from simulations, and red solid circles are the mean expectations obtained by numerically integrating the expression of Kimura and Ohta (1969). The dominance coefficient is 0.5 for all mutations except in the cases “dom” and “rec” where h = 1 and 0, respectively.
Taking the recently estimated DFE for the Zambian D. melanogaster population (Johri et al., 2020) as an example, a question of interest concerns the probabilities of fixation of different classes of mutations and their contributions to population- and species-level divergence (Supplementary Figure S1). In the absence of positive selection, the weakly deleterious class of mutations would be expected to contribute 7.2% of the total divergence in exonic regions, while effectively neutral mutations would be expected to contribute 92.8%. If we were to assume that approximately 50% of all substitutions in Drosophila have been fixed by positive selection (Eyre-Walker and Keightley 2009; Campos et al. 2017), weakly deleterious mutations are still likely to have contributed 3.5% of the total divergence in functional regions and possibly much more in regions experiencing reduced selective constraints.
Hitchhiking effects of deleterious sweeps: levels and patterns of variation
We next considered the fixation times of these mutations contributing to divergence, as well as the expected waiting time between fixations. Using population parameters relevant for D. melanogaster (see Materials and Methods), the neutral and deleterious DFE of Johri et al. (2020), and assuming that 60% of the D. melanogaster genome (of size 140 Mb) is functional, Equation (5) shows that the genome-wide waiting time between successive weakly deleterious fixations is ∼83 generations. Hence, the ∼2.13 million years estimated for the time since the D. melanogaster and D. simulans split is expected to equate to many such fixations.
As expected, there is no significant difference (p = 0.16; Student’s t-test) in fixation times between the mildly beneficial (3.2 N generations; SD: 1.5 N) vs mildly deleterious mutations (2.9 N generations; SD: 1.1 N) with the same fitness effects (2N= 2N= 5) (Supplementary Table S3). Importantly, however, the variance in fixation times of weakly selected mutations is extremely large, such that the faster tails of the fixation time distributions for both 2N= 5 and 2Ns = 0 occupy ∼N generations, which corresponds to a sweep effect of the same size as the mean for 2N= 30 (Figure 1B). In other words, weakly deleterious and neutral fixations can match the sweep effects of comparatively strongly selected beneficial fixations.
We evaluated the impact of these fixations on observed genomic variation in two ways. The first corresponds to a model of a single sweep event, which is relevant to the literature on detecting signatures of individual fixations, as done in genomic scans for positively selected loci (e.g., Harr et al. 2002; Glinka et al. 2003; Haddrill et al. 2005; Nielsen et al. 2005; see also Jensen 2009; Stephan 2019). Such scans operate under the assumption that the selective sweeps in question have achieved fixation immediately prior to sampling, due to the rapid loss of signal as the time since fixation increases (Kim and Stephan 2002; Przeworski 2002). The second corresponds to a recurrent substitution model, which is relevant to the recurrent sweep literature that attempts to quantify the effect of selective sweeps on genome-wide patterns of variability and their relation to rates of recombination (e.g., Wiehe and Stephan 1993; Kim 2006; Andolfatto 2007; Macpherson et al. 2007; Jensen et al. 2008; Campos and Charlesworth 2019; Charlesworth 2020b; see review by Sella et al. 2009).
The reduction of diversity resulting from the fixation of a mildly deleterious or beneficial semi-dominant mutation with a very small selective effect is not expected to be substantially different from that caused by the fixation of a selectively neutral mutation (Tajima 1990). The widely used approximation of Barton (2000) for the reduction in diversity relative to neutrality caused by the sweep of a semi-dominant mutation, Δπ = (2Nsa)(–4r/s), suggests that, when 2N = 5, diversity will only be reduced by more than 20% in a region for which r/s ≤ 0.2, corresponding to approximately 20 bp for a typical D. melanogaster recombination rate of 3 × 10⁻⁸ per bp, including the contribution from gene conversion as given by Equation (7), and assuming an effective population size of ≥106.
However, this formula assumes that fixations are so fast that swept alleles that have failed to recombine onto a wild-type background experience no coalescent events during the duration of the sweep (Hartfield and Bataillon 2020; Charlesworth 2020b), which is unlikely to be true for weakly selected mutations, such that N|s| is close to 1. We therefore used Equation (6) for analytical predictions (Figure 2, Table 1, Supplementary Table S4), which is based on the results of Charlesworth (2020b). But this equation is also likely to be inaccurate with weak selection, because it assumes that the trajectory of allele frequency change is close to that for the deterministic case, except for the initial and final stochastic phases at the two extremes of allele frequencies. We therefore also used simulations based on Equations (27) of Tajima (1990) to predict sweep effects, as described in Materials and Methods.
Figure 2.

Recovery of nucleotide diversity per site () relative to the mean value in the absence of selection (), around a recent fixation (shown at position 0 on the x-axis). The target site has experienced (A) a neutral fixation (2Ns = 0; black lines), (B) a weakly deleterious fixation (2N= 5; red line), and (C) a weakly beneficial fixation (2N = 5; blue line). Solid lines represent mean values of 100 replicates, shaded regions correspond to 1 SE above and 1 SE below the mean. Solid circles show the theoretical predictions using Equation (14) of Charlesworth (2020b); and crosses correspond to simulations based on Equation (27) of Tajima (1990).
Table 1.
Reduction in nucleotide diversity at linked neutral sites, relative to the neutral value, after the fixation of a weakly deleterious or advantageous semi-dominant mutation
| Distance from selected site in scaled recombination rate ( ) | Corresponding number of bases in Drosophila |
Expected diversity reduction |
Expected diversity reduction |
Expected diversity reduction |
|||
|---|---|---|---|---|---|---|---|
| Without gene conversion | With gene conversion |
|
|
||||
| A | B | A | B | ||||
| 0 | 0 | 0 | 0.426 | 0.459 | 0.496 | 0.523 | 0.534 |
| 0.05 | 2.5 | 0.8 | 0.393 | 0.429 | 0.471 | 0.502 | 0.514 |
| 0.10 | 5 | 1.7 | 0.372 | 0.409 | 0.446 | 0.479 | 0.495 |
| 0.20 | 10 | 3.3 | 0.325 | 0.371 | 0.402 | 0.452 | 0.459 |
| 0.40 | 20 | 6.7 | 0.261 | 0.301 | 0.328 | 0.393 | 0.395 |
| 0.80 | 40 | 13.5 | 0.184 | 0.221 | 0.228 | 0.304 | 0.298 |
| 1.60 | 80 | 27.2 | 0.100 | 0.127 | 0.138 | 0.200 | 0.182 |
| 3.20 | 160 | 55.6 | 0.047 | 0.063 | 0.100 | 0.107 | 0.101 |
| 6.40 | 320 | 116 | 0.018 | 0.025 | 0.077 | 0.044 | 0.069 |
| 12.8 | 640 | 254 | 0.006 | 0.009 | 0.043 | 0.014 | 0.040 |
The double entries in the two right-hand columns are the results of (A) 1000 replicate simulations using Equation (27) of Tajima (1990), and (B) the analytical approximation of Charlesworth (2020b, Equation 14). For the simulations, a population size of 100 and a scaled neutral mutation rate per bp of 2.5 × 10⁻⁶ were assumed. One thousand replicate runs were performed. Note that if the diffusion approximation is valid, only the scaled parameter values (ρ, 2Ns and θ = 4Nu = 0.001) are relevant. The distance between the selected and neutral site is presented in units of the scaled recombination rate (), as well as the number of bases corresponding to Drosophila-like populations.
With the full simulations of a 10 kb region, in which we assumed a population size of and mutation rate of /site/generation, with 2N= 5 the nucleotide diversity 10 bp (∼= 0.2) around the selected site (i.e., 5 bp in both directions) was 0.0058 (SE: 0.0012), corresponding to a reduction of 52% below the neutral value. For 2Ns = 0, the 10-bp nucleotide diversity was 0.0083 (SE: 0.0017), corresponding to a reduction of 31%. The observed reduction in both cases almost fully recovers to the expected level under neutrality within 500 bp ( ≈ 10; Figure 2). A similar pattern is seen in Table 1 and Supplementary Table S4, which shows both the analytical predictions and those based on Tajima’s equations, which agree surprisingly well except at the two highest rates of recombination displayed. For comparison, the results of simulating neutral fixations are also shown in Table 1 and Figure 2. The case with is at the higher limit of what is likely to be produced by sweeps of deleterious mutations, given that the ratio of the fixation probability given by Equation (1) to the neutral value of is then approximately 0.0045, compared to 0.034 with .
Mafessoni and Lachmann (2015) showed that fixations of weakly selected, highly dominant favorable mutations—or highly recessive deleterious mutations—could reduce diversity at linked sites by a smaller amount than fixations of neutral mutations (with no recombination, these are associated with a diversity reduction of 42% below the mean neutral value), with a maximum effect when 2Ns is approximately 2 (and h = 1 for favorable mutations, and 0 for deleterious ones). We have confirmed this unexpected observation using Tajima algorithm simulations (Supplementary Table S5), finding that it exists even for (Supplementary Figure S2 and Table S5). However, our use of h = 0.5 and 2Ns ≥ 2.5 means that this phenomenon is absent from the results presented above.
Because gene conversion is an important contributor to recombination between closely linked sites (Miller et al. 2016), the effects of fixations in the presence of gene conversion are restricted to a region that is about one-third of the distance in the absence of gene conversion (Table 1). Thus, a greater than 20% reduction in nucleotide diversity for [] was observed up to = 0.8 [ = 1.6], corresponding to 14 bp [27 bp] with gene conversion, and 40 bp [80 bp] without gene conversion. This quite localized effect is similar for weakly beneficial, weakly deleterious, and neutral mutations.
Given the relatively faster mean speed (3.1 N generations) of fixation of weakly selected semi-dominant mutations compared to the neutral expectation (4 N generations), they should also result in small distortions of the SFS at closely linked neutral sites. We observed a slight skew toward rare variants (as measured by Tajima’s D, Supplementary Table S6) restricted to ∼50 base pairs from the selected site immediately after fixation (for ). This highly localized distortion of the SFS is probably too weak to play any important role in generating false positives in genomic scans. Indeed, owing to the inherent stochasticity involved in the underlying processes, such scans generally only have the power to detect very strongly selected fixations (often requiring values of 2N > 1000 in order to observe appreciable true positive rates: Crisci et al. 2013). Viewed in another way, given that the false-positive rates associated with genomic scans may often be inflated well above true-positive rates owing to the underlying demographic history of the population (e.g., Teshima et al. 2006; Thornton and Jensen 2007; Crisci et al. 2013; Harris et al. 2018), demography is probably a much stronger confounder than deleterious sweeps in polymorphism-based scans.
Finally, using a recurrent fixation model, we have examined the steady-state impact of weakly deleterious sweeps (Figure 3). Here, we used a model of a gene with five exons of 100 codons each, with 70% of exonic mutations subject to selection, which were separated from each other by 100 bp introns, as described by Campos and Charlesworth (2019) and Charlesworth (2020b). Five equally large classes of sites subject to deleterious mutations were modeled, with the lowest scaled selection coefficient being 2Nsd = 2.5 and the largest 2Nsd = 10; as described above, a uniform distribution of 2Nsd values was assumed within each class. The theoretical predictions used the method for predicting the effects of recurrent sweeps of Charlesworth (2020b), based on Equation (6) above. For consistency with the simulations of population divergence described below, the population size was assumed to be 1.95 × 10⁶, giving a neutral diversity of 0.0234 with a mutation rate of 3 × 10⁻⁹. Substitution rates of deleterious nonsynonymous mutations were calculated from Equations (1) and (2). The expected number of nonsynonymous substitutions per gene over 2N generations was 0.506, and the ratio of nonsynonymous to synonymous substitutions was 0.0412, which is somewhat less than half the mean value for comparisons of D. melanogaster and its close relatives (e.g., Campos et al. 2017). The major source of these substitutions is the class with 2N between 2.5 and 4.375, which accounts for 76% of all substitutions, reflecting the fact that mutations in this class have the highest fixation probabilities.
Figure 3.

Predicted mean reductions of nucleotide diversity at linked neutral sites compared to neutrality (–Δπ), due to recurrent fixations of weakly deleterious semi-dominant mutations with in the presence and absence of gene conversion (GC). Results are shown for regions of varying cross-over (CO) rates of recombination. Nucleotide diversity at neutral sites was averaged across a gene comprised of five 300-bp exons and 100-bp introns, in which all intronic sites and 30% of exonic sites were neutral.
The results for single sweeps shown in Table 1 suggest that these theoretical predictions will tend to overestimate sweep effects, so that the results in Figure 3 must be viewed with caution. In addition, the model ignores the mean neutral diversity (π) during the progress of a sweep, considering only the contribution from intervals between sweeps. This provides accurate predictions of recurrent sweep effects with 2Nsd ≫ 1, since the sweep duration is then a relatively small fraction of the interval between sweeps, unless sweeps are extremely frequent (Charlesworth 2020b). However, this is not true with very weak selection, and the expectation of π during a sweep should, therefore, be included in a rigorous treatment. For weak sweeps, it is possible that this quantity could be larger than the expected diversity in the absence of selection, π0. This follows from the fact that π is reduced immediately after the fixation of a neutral mutation at a linked site, but such fixations cannot alter the net expected value of π. Because the post-fixation recovery can only bring π back up to π0, the expectation of π at linked sites over the course of the neutral fixation must exceed π0. This arises because, in the absence of recombination, the two alternative haplotypes associated with the two variants in transit to fixation can only coalesce at a time preceding the sweep, and hence have a coalescent time >2N. By continuity, a similar effect must arise with sufficiently weak selection, although it is not seen when 2Nsd ≫ 1, when the expected value of π is reduced during a sweep (see Figure 8 of Zeng et al. 2021), so that the theory used here is likely to overestimate sweep effects. Furthermore, with such weak selection it is somewhat artificial to isolate the effects on π of fixations of linked deleterious mutations from the effects of their loss from the population (BGS), given the fact that there will be traffic backwards and forwards between alternative variants at a site that is subject to selection and reverse mutation (Gillespie 1994; Charlesworth and Eyre-Walker 2008).
With the standard D. melanogaster sex-averaged rate of crossing over per bp of 1 × 10⁻⁸, the mean reduction in nucleotide diversity at synonymous sites caused by deleterious sweeps was approximately 5% with gene conversion and 8% in its absence (Figure 3). For the lowest rates of crossing over, and with no gene conversion, average reductions can reach ∼19%, suggesting that the fixation of mildly deleterious mutations could play a significant role in organisms or genomic regions with highly reduced rates of recombination. In this low recombination environment, however, selective interference will become a factor, and should accelerate the rate of deleterious fixations, while also making deleterious variants behave more like neutral mutations (see below). Regardless of these details, however, it seems unlikely that substitutions of deleterious mutations will have more than a minor effect on average diversity in the Drosophila genome overall, particularly compared with the effects of population history, BGS, and sweeps of positively selected mutations. Furthermore, the findings of Mafessoni and Lachmann (2015) suggest that fixations of strongly recessive deleterious mutations will have even smaller effects than those studied here, and can even enhance variability (see Supplementary Figure S2, resulting in associative overdominance effects; Charlesworth and Jensen 2021). A detailed study of the possible range of effects of both losses and fixations of weakly selected mutations is planned.
The effects of interference on deleterious sweeps with Drosophila- and human-like parameters
The relatively large input of deleterious mutations could result in interference amongst them, and in turn might affect their probabilities of fixation. In order to evaluate this possibility, genomic regions composed of two adjacent genes with 5 exons and 4 introns each, as well as intergenic regions (see Materials and Methods for details) were simulated. Two separate genomic regions were simulated resembling D. melanogaster and humans—both in terms of architecture and underlying parameter values—with exons experiencing purifying selection specified by the DFE estimated by Johri et al. (2020) for Drosophila, and that estimated by Huber et al. (2017) for humans. Because interference is more likely to occur in regions of lower recombination rates, additional simulations were carried out for 0.5× and 0.1× the mean recombination rate. Simulations were performed with and all other parameters were scaled accordingly.
The frequencies of fixation of mildly deleterious mutations were found to be higher than expected with no interference, suggesting an appreciable role of interference (Supplementary Figure S3). However, the effective reduction in Ne due to BGS also affects the scaled selection coefficients (Barton 1995; Charlesworth 2012; Campos and Charlesworth 2019). After correcting for the effects of BGS [in which case, expected probabilities were obtained using Equations (3) and (4)], the frequencies of fixations of mildly deleterious mutations in humans were found to be unaffected by interference (Supplementary Figure S4). While no interference effects were observed for regions corresponding to the mean recombination rate in Drosophila, for regions with 0.1× the mean recombination rate, the frequencies of fixation were higher than that expected in the absence of interference (Figure 4A).
Figure 4.

(A) Frequencies of fixation of weakly deleterious mutations relative to that of neutral mutations for different rates of recombination (r), when there is a potential for interference amongst deleterious mutations and BGS effects are accounted for. Red solid circles show the expected probability calculated by Equation (4) integrating over the interval of . (B–G) Effects of sweeps immediately post-fixation for (B–D) Drosophila-like and (E–G) human-like parameters and architecture. Recovery of nucleotide diversity per site () is shown relative to the mean intergenic diversity under BGS (), around a recent fixation (shown at position 0 on the x-axis). The target site has experienced a weakly deleterious fixation ( between 1 and 2). Solid lines represent mean values obtained from all substitutions in all replicates, shaded regions correspond to 1 SE above and 1 SE below the mean. Crosses correspond to simulations based on Equation (27) of Tajima (1990) for 2Ns = 0. The extent of BGS in these scenarios is: (B) B = 0.81, (C) B = 0.79, (D) B = 0.67, (E) B = 0.87, (F) B = 0.85, and (G) B = 0.83.
Because of these interference effects in regions of low recombination, we further evaluated the times to fixation and the effects of sweeps on linked neutral sites. In both Drosophila and humans, the fixation times of deleterious mutations were found to be slightly lengthened in the presence of interference (Supplementary Figures S5 and S6) as compared to expected time to fixation obtained by numerically integrating Equation 17 of Kimura and Ohta (1969). This suggests that the reduction in Ne caused by BGS might result in mutations behaving more neutrally, thus taking longer to fix. We have, however, not accounted for BGS when obtaining expected times numerically. Although the decrease in nucleotide diversity at linked neutral sites remained qualitatively similar to that observed in the absence of interference for D. melanogaster (Figure 4, B–D, Supplementary Figure S7), the reduction in mean neutral diversity post-fixation was somewhat more modest for very weakly deleterious alleles in the presence of interference. This smaller effect is probably due to BGS rather than interference per se, as suggested by the results above. For recombination rates one-half and one-tenth of the mean, nucleotide diversity up to ∼ 0.2 was 62% and 60% of the mean intergenic diversity, consistent with a ∼40% reduction in variation. For human-like parameters, we similarly observed that the mean nucleotide diversity post-fixation of a weakly deleterious mutation (Figure 4, E–G, Supplementary Figure 7) was very similar to that observed post-fixation of a neutral mutation (Table 1). In sum, for the parameter ranges investigated, we found that interference between weakly deleterious mutations resulted in only very minor deviations from expectations.
The contribution of deleterious mutations to population- and species-level divergence-based scans
Given the potentially substantial contribution of the weakly deleterious class to observed fixations, it is also of interest to consider their impact on divergence-based analyses (e.g., methodology related to dN/dS) and population differentiation-based scans (e.g., methodology related to FST). We examined properties related to inferring the proportion of substitutions fixed by positive selection (α) by performing MK tests in the presence of mildly deleterious mutations. Specifically, we simulated two scenarios: (1) 50% of mutations at nonsynonymous sites were weakly deleterious, and 50% were neutral, and (2) nonsynonymous sites experienced deleterious mutations that followed the DFE inferred by Johri et al. (2020).
Although, as expected, the presence of mildly deleterious mutations substantially increases values of dN/dS (Supplementary Table S7) relative to stronger purifying selection (i.e., larger proportions of moderately and strongly deleterious mutations), it also leads to strongly negative values of α when performing MK tests. This is due to the fact that mildly deleterious mutations often segregate in the population at low frequency, inflating the total number of segregating nonsynonymous polymorphisms (PN) significantly (Supplementary Table S7). As such, the presence of mildly deleterious mutations can result in negative values of in the absence of positive selection. This is consistent with previous studies that have proposed a derived allele frequency cutoff (Fay et al. 2001, 2002; Andolfatto 2005; but see Charlesworth and Eyre-Walker 2008) to correct for segregating mildly deleterious alleles, as well as proposed modification of the traditional MK test (e.g., the asymptotic MK test; Messer and Petrov 2013). Nevertheless, under the asymptotic MK test, α remains underestimated (Supplementary Table S7) when the proportion of mildly deleterious mutations is sufficiently high.
In order to study inter-population effects, we simulated a model similar to that recently inferred by Arguello et al. (2019), which represents the European and African split of D. melanogaster (see Materials and Methods), and overlaid it with the estimated DFE of Johri et al. (2020). Under this model (i.e., in the absence of positive selection), roughly 50% of SNPs identified as FST outliers (defined as representing the upper 1% or 2.5% tails) are mildly deleterious (Figure 5A; Supplementary Figure 8). Two models of purifying selection are given for comparison (Table 2): (1) a more biologically realistic model in which selection coefficients are scaled to the ancestral population size in defining the DFE classes, such that selection is effectively weaker in the smaller derived population; and (2) an arbitrary model in which the DFE is rescaled such that selective effects are equally strong in the larger ancestral and the smaller derived populations (which, under the chosen demographic model, differ from one another by roughly an order of magnitude). It should be noted that in the model based on Arguello et al., the time post-split between the African and European population is extremely brief, such that there are few or no substitutions post-split (Supplementary Table S8). Thus, FST values are almost entirely dictated by allele frequency differences with respect to co-segregating mutations (Supplementary Table S8).
Figure 5.

Allele frequencies of SNPs in simulated D. melanogaster population 1 (European) vs population 2 (African), using parameters of the Arguello et al. (2019) model, where the selective effects of all mutations were rescaled with respect to their population sizes after the split (i.e., keeping the strength of selection constant in both populations). Genomic elements experienced (A) purifying selection following the DFE inferred by Johri et al. (2020); (B) the same DFE, but with the addition of 1% beneficial mutations with selective effects between ; or (C) the same DFE, but with the addition of 1% beneficial mutations with selective effects of . Left panel: Allele frequency plots for 10 (out of 100) replicates simulated. Colored open circles represent outliers when single SNPs are used to calculate . Green depicts effectively neutral mutations (belonging to class 0), blue depicts beneficial mutations, and warm colors depict deleterious mutations (belonging to classes 1, 2, and 3), with red representing weakly deleterious mutations. Right panel: The distribution of fitness effects of outlier mutations for the corresponding scenarios, showing the mean and standard deviation for all 100 replicates. Sites that were fixed in both populations for the same allele were not included in this analysis.
Table 2.
Mean genome-wide and outlier FST values [calculated in windows of 500 bp (labeled “Constant total sites”), or 10 SNPs (labeled “Constant SNPs”)]
| Evolutionary model | Mean FST |
Outlier FST (1%) |
Outlier FST (1%)/mean FST |
|||
|---|---|---|---|---|---|---|
| Constant total sites | Constant SNPs | Constant total sites | Constant SNPs | Constant total sites | Constant SNPs | |
| Neutrality | 0.0374 | 0.0363 | 0.0874 | 0.1628 | 2.3369 | 4.4838 |
| Purifying selection | 0.0365 | 0.0352 | 0.0880 | 0.1454 | 2.4110 | 4.1296 |
| Purifying selection (rescaled DFE) | 0.0666 | 0.0613 | 0.1585 | 0.2637 | 2.3799 | 4.2999 |
| With 1% weak positive selection | 0.0378 | 0.0362 | 0.1443 | 0.1631 | 3.8143 | 4.5057 |
| With 1% strong positive selection | 0.2353 | 0.2347 | 0.9108 | 0.6689 | 3.8705 | 2.8507 |
| Neutral values, with the Li and Stephan (2006) bottleneck | 0.2828 | 0.2557 | 0.4154 | 0.6956 | 1.4689 | 2.7204 |
These results, with the exception of the bottom row, use the Arguello et al. (2019) parameters for European and African D. melanogaster population histories, under different DFE configurations. Additional details may be found in the text and Supplementary Table S13.
Mean FST values at both neutral and weakly deleterious sites are larger with the rescaled purifying selection model, whereas the unscaled model yields similar values to the purely neutral model (Table 1 and Supplementary Tables S9, S12). In addition, the frequency of private SNPs at all sites is higher for the rescaled model than the unscaled model, with the neutral model having the lowest value of the three (Supplementary Table S8). In order to determine whether these weakly deleterious mutations were associated with a decrease in diversity at linked sites, potentially leading to an increase in FST values (Charlesworth 1998; Cruickshank and Hahn 2014), we evaluated the relationship between FST and nucleotide diversity using neutral variants alone (Supplementary Figure S9; see also the comparison with directly selected sites in Supplementary Figures S10 and S11). The lack of a strong negative correlation suggests that sweep-like effects of deleterious mutations on diversity at linked sites are not primarily responsible for the observed effects on FST and the frequency of private alleles. In contrast, there is a negative relationship between nucleotide diversity and FST after the strong population bottleneck represented by the neutral model of Li and Stephan (2006).
The lack of sweep-like effects of deleterious mutations is not surprising in view of the time-scale to fixation required for weakly selected mutations, which is of the order of the coalescent time, 2N generations; the split times for both the African and European populations are both only a small fraction of their respective coalescent times. Thus, neither new neutral nor weakly deleterious mutations are likely to have reached fixation in either population, consistent with the results shown in the last column of Supplementary Table S8. In addition, there is no time for large changes in π as a result of the altered N values.
Instead, it is more likely that BGS effects on the frequencies of segregating mutations explain these patterns (B = 0.18 and 0.15 in the African and European populations, respectively, see Supplementary Table S9). In the absence of rescaling of the DFEs for deleterious mutations (the more biologically plausible case), the enhanced N for the African population means that fewer deleterious mutations behave as effectively neutral, so that there is less effect of drift on their frequencies compared with the ancestral population; the reverse is true for the European population. As far as linked neutral variants are concerned, there is likely to be a greater BGS effect in the African than in the ancestral population, and vice-versa for the European population. FST relative to the purely neutral case is thus subject to two opposing factors, which presumably explains the lack of any strong effect of this model of purifying selection on FST in Table 2 and Supplementary Table S9. However, the lower effective population size induced by BGS means that rare variants are more likely to be lost after the population split than under neutrality, explaining the increased proportion of private variants compared with neutrality with purifying selection (Supplementary Table S8). Because of the effects of BGS, the relative Ne values of the African and European populations are less disparate than the relative N values, so that the African/European ratio of the proportions of private SNPs is smaller than under neutrality (Supplementary Table S8).
The effect of rescaling is to keep the proportion of deleterious mutations that are effectively neutral the same in the two descendant populations, with the absolute strength of selection being higher in the African population, so that overall there is a stronger BGS effect in this population. This results in a higher overall fraction of private SNPs, and a larger enrichment of private SNPs in the African population, compared with the neutral case (Supplementary Table S8). There is a corresponding increase in mean FST for both neutral and weakly deleterious variants compared with the neutral case (Table 2 and Supplementary Table S9).
It is also of interest to consider the contribution of deleterious mutations to outliers (i.e., variants that are highly differentiated between the two populations) present in the tails of the distribution in the presence of positive selection. When a class of weakly positively selected sites was added to the DFE (i.e., beneficial mutations have fitness effects 1 2N10, and comprise 1% of new mutations), these adaptive mutations contributed little to the observed outliers (<5%)—with mildly deleterious and neutral mutations strongly represented amongst outliers (Figure 5B). Conversely, when positive selection is very strong (i.e., mutations have selective effects with 2N=1000, and comprise 1% of new mutations), the majority (∼75%) of outliers are drawn from this beneficial class (Figure 5B). Yet, even in the presence of this exceptionally strong and frequent positive selection, ∼10% of outliers remain in the mildly deleterious class. Upon simulating the same scenarios—but drawing from the extreme CIs of the demographic parameters to account for underlying uncertainty in the model of Arguello et al. (2019)—a very similar proportion of mildly deleterious mutations persists in the presence of weak positive selection (Supplementary Table S10). However, in the case of strong positive selection, the proportion of strongly beneficial outlier mutations ranges from 25 to 90% depending on the underlying population history (Supplementary Table S10). It is also noteworthy that under this model of strong, recurrent positive selection, little variation within populations is observed, owing to the severity of the selective sweeps (Supplementary Table S11), and inter-population allele frequencies are only weakly correlated with one another (Supplementary Table S8). A haplotype-based measure of population differentiation, (Excoffier et al. 1992), was also used to identify outliers (i.e., genomic regions present in the tails of the distribution) and was not found to differ substantially (Supplementary Table S12).
Because any model, including equilibrium neutrality, will have outliers based on empirical p-values, we further quantified the properties of outliers (2.5 and 1%) relative to the genome-wide mean. Under models of purifying selection, the values of FST outliers were ∼2.3- to 4.5-fold larger than mean FST values (Table 2; Supplementary Table S13), but differed only slightly from the neutral case. Under the strongly bottlenecked neutral model of Li and Stephan (2006), in which the European population experiences a substantial decrease in population size during the bottleneck, the genome-wide mean FST values obtained are much higher, as would be expected, though outlier FST values were smaller in relative magnitude (∼1.5- to 2.7-fold higher than the means). Under models including weak positive selection, only slight increases in genome-wide FST values were observed; whereas the strong positive selection model greatly increased genome-wide values. However, outlier values under both positive selection models were ∼2.4- to 4.6-fold higher than the respective means. Similar results were obtained when using haplotype-based calculations of population differentiation (Supplementary Table S14). This suggests that recurrent positive selection does not generate substantially larger effect sizes for outlier FST values than neutrality or purifying selection.
Conclusions
In this study, we have examined the expected impact of deleterious fixations on polymorphism- and divergence-based scans for selection. Amongst the class of weakly deleterious mutations that have some chance of reaching fixation (1 2N 10), the resulting sweep effects are highly localized, as expected: on the order of a few dozen base pairs for the parameters considered here. This suggests that deleterious sweeps of this kind are unlikely to be detected in genomic scans based on localized deficits of variation or strongly skewed site frequency spectra. Given the theoretically expected symmetry between beneficial and deleterious sweeps (Maruyama and Kimura 1974; Mafessoni and Lachmann 2015; Charlesworth 2020a), this is expected, as common polymorphism-based methods generally have little power unless selection is exceptionally strong (e.g., Kim and Stephan 2002; Jensen et al. 2005; Crisci et al. 2013). However, our results suggest that studies that estimate the frequency and strength of classic selective sweeps using patterns of diversity around substitutions (Hernandez et al. 2011; Sattath et al. 2011; Elyashiv et al. 2016), which assume that reductions are entirely caused by the fixation of positively selected mutations, should take into account the effects of reductions caused by neutral and weakly deleterious substitutions.
Furthermore, for among-population comparisons based on FST, mildly deleterious mutations contribute significantly to observed outliers, even in the presence of positive selection, particularly in the case of a recent population size reduction. This appears to be true regardless of whether selective effects are equally strong in both populations (Figure 5), or if selection is relaxed in the smaller derived population (Supplementary Figure S8). These observations further stress the important point that genomic outliers of a given statistical distribution do not necessarily represent positively selected loci. As such, the performance of outlier-based tests must be assessed on a case-by-case basis under an appropriate baseline model incorporating population history as well as direct and linked purifying selection effects, in order to determine the power and false-positive rates associated with the detection of beneficial alleles (Jensen et al. 2019). Moreover, because such deleterious effects are localized to functional sites (i.e., those genomic regions experiencing purifying selection), this may be particularly pernicious in the sense that this class of outlier will not fall in nonfunctional regions, where they are often attributed to demographic effects. Rather, owing to the common tendency of constructing biological narratives (true or otherwise) around functional outliers (Pavlidis et al. 2012), these results suggest that adaptive story-telling may arise from weakly deleterious outliers.
Supplementary Material
Acknowledgments
The authors thank Laurent Excoffier for addressing queries about the AMOVA analyses, as well as Susanne Pfeifer and two anonymous reviewers for providing helpful comments on the manuscript.
Funding
This work was funded by National Institutes of Health grants R01GM135899 and R35GM139383 to J.D.J.
Conflicts of interest
None declared.
Appendix
Calculating the probability of fixation with uniformly distributed fitness effects
For a selection coefficient s ≪ 1, the fixation probability of a deleterious mutation when Ne ≠ N is approximated by:
| (A1) |
For large Ne, this should be a good approximation, since when 2Nes ≥ 10, the fixation probability is negligible, so that the contribution from the bin with 2Nes ≥ 10 can be ignored. For 2Nes < 10, s is sufficiently small that this equation is an accurate approximation.
The integral of this expression over a given interval of 2Nes values can be found as follows; for convenience, x is substituted for s and a for 2Ne. For a > 0, we need to evaluate the following indefinite integral:
Integration by parts give:
| (A2) |
For a > 0, the logarithm can be expanded as a power series in exp(–ax), which can be integrated term by term:
| (A3) |
where is the polylogarithm. The final expression for the integral of Equation (1) (provided in the Materials and Methods) is thus:
| (A4) |
The contribution to the mean fixation probability from the interval si to si+1 is obtained by dividing this expression by (si+1 – si).
For s0 = 0, Equation (A4) is invalid. However, the integral between 0 and a small positive value of s, sε, can be found as follows. For 2Nes ≪ 1, the initial integrand can be approximated by a−1(1–ax/2), so that Equation 2 (see Materials and Methods) can be replaced with:
and the indefinite integral of the fixation probability becomes:
| (A5a) |
The contribution to the integral of Pfix between s0 = 0 and s1 from the interval (0, sε) is thus:
| (A5b) |
The corresponding mean fixation probability over this interval is:
This is slightly smaller than the neutral value, 1/(2N), as would be expected when 2Nes ≪ 1.
Thus, for the interval (s0, s1) with s0 = 0, Equation (A5b) should be used for the interval (0≤ s ≤ sε), and Equation (A4) with integration limits sε and s1 for the remainder of the interval.
Literature cited
- Andolfatto P. 2005. Adaptive evolution of non-coding DNA in Drosophila. Nature. 437:1149–1152. [DOI] [PubMed] [Google Scholar]
- Andolfatto P. 2007. Hitchhiking effects of recurrent beneficial amino acid substitutions in the Drosophila melanogaster genome. Genome Res. 17:1755–1762. [DOI] [PMC free article] [PubMed] [Google Scholar]
- Arguello JR, Laurent S, Clark AG.. 2019. Demographic history of the human commensal Drosophila melanogaster. Genome Biol Evol. 11:844–854. [DOI] [PMC free article] [PubMed] [Google Scholar]
- Atkinson KE. 1989. Introduction to Numerical Analysis. New York, NY: John Wiley. [Google Scholar]
- Bank C, Ewing GB, Ferrer-Admettla A, Foll M, Jensen JD.. 2014a. Thinking too positive? Revisiting current methods in population genetic selection inference. Trends Genet. 30:540–546. [DOI] [PubMed] [Google Scholar]
- Bank C, Hietpas RT, Wong A, Bolon DN, Jensen JD.. 2014b. A Bayesian MCMC approach to assess the complete distribution of fitness effects of new mutations: uncovering the potential for adaptive walks in challenging environments. Genetics. 196:841–852. [DOI] [PMC free article] [PubMed] [Google Scholar]
- Barton NH. 1995. Linkage and the limits to natural selection. Genetics. 140:821–841. [DOI] [PMC free article] [PubMed] [Google Scholar]
- Barton NH. 2000. Genetic hitchhiking. Phil Trans R Soc B. 355:1553–1562. [DOI] [PMC free article] [PubMed] [Google Scholar]
- Campos JL, Halligan DL, Haddrill PR, Charlesworth B.. 2014. The relationship between recombination rate and patterns of molecular evolutionary and variation in Drosophila melanogaster. Mol Biol Evol. 31:1010–1028. [DOI] [PMC free article] [PubMed] [Google Scholar]
- Campos JL, Zhao L, Charlesworth B.. 2017. Estimating the parameters of background selection and selective sweeps in Drosophila in the presence of gene conversion. Proc Natl Acad Sci USA. 114:E4762–E4771. [DOI] [PMC free article] [PubMed] [Google Scholar]
- Campos JL, Charlesworth B.. 2019. The effects on neutral variability of recurrent selective sweeps and background selection. Genetics. 212:287–303. [DOI] [PMC free article] [PubMed] [Google Scholar]
- Charlesworth B, Morgan MT, Charlesworth D.. 1993. The effect of deleterious mutations on neutral molecular variation. Genetics. 134:1289–1303. [DOI] [PMC free article] [PubMed] [Google Scholar]
- Charlesworth B. 1998. Measures of divergence between populations and the effect of forces that reduce variability. Mol Biol Evol. 15:538–543. [DOI] [PubMed] [Google Scholar]
- Charlesworth B. 2012. The effects of deleterious mutations on evolution at linked sites. Genetics. 190:5–22. [DOI] [PMC free article] [PubMed] [Google Scholar]
- Charlesworth B. 2020a. How long does it take to fix a favorable mutation, and why should we care? Am. Nat. 195:753–771. [DOI] [PubMed] [Google Scholar]
- Charlesworth B. 2020b. How good are predictions of the effects of selective sweeps on levels of neutral diversity? Genetics 216: 1217–1238. [DOI] [PMC free article] [PubMed] [Google Scholar]
- Charlesworth J, Eyre-Walker A.. 2007. The other side of the nearly neutral theory, evidence of slightly advantageous back-mutations. Proc Natl Acad Sci USA. 104:16992–16997. [DOI] [PMC free article] [PubMed] [Google Scholar]
- Charlesworth J, Eyre-Walker A.. 2008. The McDonald–Kreitman test and slightly deleterious mutations. Mol. Biol. Evol. 25:1007–1015. [DOI] [PubMed] [Google Scholar]
- Charlesworth B, Jensen JD.. 2021. The effects of selection on variability at linked sites. Ann Rev Ecol Evol Syst. In press. [DOI] [PMC free article] [PubMed] [Google Scholar]
- Comeron JM, Ratnappan R, Bailin S.. 2012. The many landscapes of recombination in Drosophila melanogaster. PLoS Genet. 8:e1002905. [DOI] [PMC free article] [PubMed] [Google Scholar]
- Crisci J, Poh Y-P, Mahajan S, Jensen JD.. 2013. The impact of equilibrium assumptions on tests of selection. Front Genet. 4:235. [DOI] [PMC free article] [PubMed] [Google Scholar]
- Crow JF. 1993. Mutation, mean fitness, and genetic load. Oxf Surv Evol Biol. 9:3–42. [Google Scholar]
- Cruickshank TE, Hahn MW.. 2014. Reanalysis suggests that genomic islands of speciation are due to reduced diversity, not reduced gene flow. Mol Ecol. 23:3133–3157. [DOI] [PubMed] [Google Scholar]
- Elyashiv E, Sattath S, Hu TT, Strutsovsky A, McVicker G, et al. 2016. A genomic map of the effects of linked selection in Drosophila. PLoS Genet. 12:e1006130. [DOI] [PMC free article] [PubMed] [Google Scholar]
- Ewens WJ. 2004. Mathematical Population Genetics. 1. Theoretical Introduction. New York, NY: Springer. [Google Scholar]
- Excoffier L, Smouse PE, Quattro JM.. 1992. Analysis of molecular variance inferred from metric distances among DNA haplotypes: application to human mitochondrial DNA restriction data. Genetics. 131:479–491. [DOI] [PMC free article] [PubMed] [Google Scholar]
- Eyre-Walker A, Keightley PD.. 2007. The distribution of fitness effects of new mutations. Nat Rev Genet. 8:610–618. [DOI] [PubMed] [Google Scholar]
- Eyre-Walker A, Keightley PD.. 2009. Estimating the rate of adaptive molecular evolution in the presence of slightly deleterious mutations and population size change. Mol Biol Evol. 26:2097–2108. [DOI] [PubMed] [Google Scholar]
- Fay JC, Wyckoff GJ, Wu CI.. 2001. Positive and negative selection on the human genome. Genetics. 158:1227–1234. [DOI] [PMC free article] [PubMed] [Google Scholar]
- Fay JC, Wyckoff GJ, Wu C-I.. 2002. Testing the neutral theory of molecular evolution with genomic data from Drosophila. Nature. 415:1024–1026. [DOI] [PubMed] [Google Scholar]
- Fisher RA. 1922. On the dominance ratio. Proc R Soc Edinburgh. 42:321–341. [Google Scholar]
- Fisher RA. 1930. The Genetical Theory of Natural Selection. Oxford: Clarendon Press. [Google Scholar]
- Fiston-Lavier A-S, Singh ND, Lipatov M, Petrov DA.. 2010. Drosophila melanogaster recombination rate calculator. Gene. 463:18–20. [DOI] [PubMed] [Google Scholar]
- Frisse L, Hudson RR, Bartoszewicz A, Wall JD, Donfack J, et al. 2001. Gene conversion and population histories may explain the contrast between polymorphism and linkage disequilibrium levels. Am J Hum Genet. 69:831–843. [DOI] [PMC free article] [PubMed] [Google Scholar]
- Gillespie JH. 1994. Substitution processes in molecular evolution. III. Deleterious Alleles. Genetics. 138:943–952. [DOI] [PMC free article] [PubMed] [Google Scholar]
- Glinka SL, Ometto L, Mousset S, Stephan W, Lorenzo DD.. 2003. Demography and natural selection have shaped genetic variation in Drosophila melanogaster: a multi-locus approach. Genetics. 165:1269–1278. [DOI] [PMC free article] [PubMed] [Google Scholar]
- Haddrill PR, Thornton KR, Charlesworth B, Andolfatto P.. 2005. Multilocus patterns of nucleotide variability and the demographic and selection history of Drosophila melanogaster populations. Genome Res. 15:790–799. [DOI] [PMC free article] [PubMed] [Google Scholar]
- Haldane JBS. 1927. A mathematical theory of natural and artificial selection. Part V. Selection and mutation. Proc Camb Philos Soc. 23:838–844. [Google Scholar]
- Haller BC, Messer PW.. 2017. asymptoticMK: a web-based tool for the asymptotic McDonald–Kreitman test. G3. 7:1569–1575. [DOI] [PMC free article] [PubMed] [Google Scholar]
- Haller BC, Messer PW.. 2019. SLiM 3: forward genetic simulations beyond the Wright-Fisher model. Mol Biol Evol. 36:632–637. [DOI] [PMC free article] [PubMed] [Google Scholar]
- Halligan DL, Keightley PD.. 2006. Ubiquitous selective constraints in the Drosophila genome revealed by a genome-wide interspecies comparison. Genome Res. 16:875–884. [DOI] [PMC free article] [PubMed] [Google Scholar]
- Harr B, Kauer M, Schlötterer C.. 2002. Hitchhiking mapping: a population-based fine-mapping strategy for adaptive mutations in Drosophila melanogaster. Proc Natl Acad Sci USA. 99:12949–12954. [DOI] [PMC free article] [PubMed] [Google Scholar]
- Harris RB, Sackman A, Jensen JD.. 2018. On the unfounded enthusiasm for soft selective sweeps II: examining recent evidence from humans, flies, and viruses. PLoS Genetics. 14:e1007859. [DOI] [PMC free article] [PubMed] [Google Scholar]
- Hartfield M, Bataillon T.. 2020. Selective sweeps under dominance and inbreeding. G3. 10:1063–1075. [DOI] [PMC free article] [PubMed] [Google Scholar]
- Hernandez RD, Kelley JL, Elyashiv E, Melton SC, Auton A, et al. 2011. Classic selective sweeps were rare in recent human evolution. Science. 331:920–924. [DOI] [PMC free article] [PubMed] [Google Scholar]
- Hill WG, Robertson A.. 1966. The effect of linkage on limits to artificial selection. Genet Res. 8:269–294. [PubMed] [Google Scholar]
- Huber CD, Kim BY, Marsden CD, Lohmueller KE.. 2017. Determining the factors driving selective effects of new nonsynonymous mutations. Proc Natl Acad Sci USA. 114:4465–4470. [DOI] [PMC free article] [PubMed] [Google Scholar]
- Hudson RR, Slatkin M, Maddison WP.. 1992. Estimating levels of gene flow from DNA sequence data. Genetics. 132:583–589. [DOI] [PMC free article] [PubMed] [Google Scholar]
- Jacquier H, Birgy A, Le Nagard H, Mechulam Y, Schmitt E, et al. 2013. Capturing the mutational landscape of the beta-lactamase TEM-1. Proc Natl Acad Sci USA. 110:13067–13072. [DOI] [PMC free article] [PubMed] [Google Scholar]
- Jakobsson M, Edge MD, Rosenberg NA.. 2013. The relationship between FST and the frequency of the most frequent allele. Genetics. 193:515–528. [DOI] [PMC free article] [PubMed] [Google Scholar]
- Jensen JD, Kim Y, DuMont VB, Aquadro CF, Bustamante CD.. 2005. Distinguishing between selective sweeps and demography using DNA polymorphism data. Genetics. 170:1401–1410. [DOI] [PMC free article] [PubMed] [Google Scholar]
- Jensen JD, Thornton KR, Andolfatto P.. 2008. An approximate Bayesian estimator suggests strong recurrent selective sweeps in Drosophila. PLoS Genet. 4:e1000198. [DOI] [PMC free article] [PubMed] [Google Scholar]
- Jensen JD. 2009. On reconciling single and recurrent hitchhiking models. Genome Biol Evol. 1:320–324. [DOI] [PMC free article] [PubMed] [Google Scholar]
- Jensen JD, Payseur BA, Stephan W, Aquadro CF, Lynch M, et al. 2019. The importance of the Neutral Theory in 1968 and 50 years on: a response to Kern & Hahn 2018. Evolution. 73:111–114. [DOI] [PMC free article] [PubMed] [Google Scholar]
- Johri P, Charlesworth B, Jensen JD.. 2020. Toward an evolutionarily appropriate null model: jointly inferring demography and purifying selection. Genetics. 215:173–192. [DOI] [PMC free article] [PubMed] [Google Scholar]
- Johri P, Riall K, Becher H, Excoffier L, Charlesworth B, et al. 2021. The impact of purifying and background selection on the inference of population history: problems and prospects. Mol Biol Evol. 38:2986–3003. [DOI] [PMC free article] [PubMed] [Google Scholar]
- Keightley PD, Trivedi U, Thomson M, Oliver F, Kumar S, et al. 2009. Analysis of the genome sequences of three Drosophila melanogaster spontaneous mutation accumulation lines. Genome Res. 19:1195–1201. [DOI] [PMC free article] [PubMed] [Google Scholar]
- Keightley PD, Ness RW, Halligan DL, Haddrill PR.. 2014. Estimation of the spontaneous mutation rate per nucleotide site in a Drosophila melanogaster full-sib family. Genetics. 196:313–320. [DOI] [PMC free article] [PubMed] [Google Scholar]
- Kim Y. 2006. Allele frequency distribution under recurrent selective sweeps. Genetics. 172:1967–1978. [DOI] [PMC free article] [PubMed] [Google Scholar]
- Kim Y, Stephan W.. 2002. Detecting a local signature of genetic hitchhiking along a recombining chromosome. Genetics. 160:765–777. [DOI] [PMC free article] [PubMed] [Google Scholar]
- Kimura M. 1957. Some problems of stochastic processes in genetics. Ann Math Statist. 28:882–901. [Google Scholar]
- Kimura M. 1962. On the probability of fixation of mutant genes in a population. Genetics. 47:713–719. [DOI] [PMC free article] [PubMed] [Google Scholar]
- Kimura M. 1964. Diffusion models in population genetics. J Appl Probab. 1:177–232. [Google Scholar]
- Kimura M. 1970. The length of time required for a selectively neutral mutation to reach fixation through random frequency drift in a finite population. Genet Res. 15:131–133. [DOI] [PubMed] [Google Scholar]
- Kimura M, Ohta T.. 1969. The average number of generations until fixation of a mutant gene in a finite population. Genetics. 61:763–771. [DOI] [PMC free article] [PubMed] [Google Scholar]
- Li H, Stephan W.. 2006. Inferring the demographic history and rate of adaptive substitution in Drosophila. PLoS Genet. 2:e166. [DOI] [PMC free article] [PubMed] [Google Scholar]
- Li YJ, Satta Y, Takahata N.. 1999. Paleo-demography of the Drosophila melanogaster subgroup: application of the maximum likelihood method. Genes Genet. Syst. 74:117–127. [DOI] [PubMed] [Google Scholar]
- Lynch M, Blanchard D, Houle D, Kibota T, Schultz S, et al. 1999. Spontaneous deleterious mutations. Evolution. 53:645–663. [DOI] [PubMed] [Google Scholar]
- Macpherson JM, Sella G, Davis JC, Petrov DA.. 2007. Genome-wide spatial correspondence between nonsynonymous divergence and neutral polymorphism reveals extensive adaptation in Drosophila. Genetics. 177:2083–2099. [DOI] [PMC free article] [PubMed] [Google Scholar]
- Mafessoni F, Lachmann M.. 2015. Selective strolls: fixation and extinction in diploids are slower for weakly selected mutations than for neutral ones. Genetics. 201:1581–1589. [DOI] [PMC free article] [PubMed] [Google Scholar]
- Maruyama T, Kimura M.. 1974. A note on the speed of gene frequency changes in reverse directions in a finite population. Evolution. 28:161–163. [DOI] [PubMed] [Google Scholar]
- Maynard Smith J, Haigh J.. 1974. The hitch-hiking effect of a favourable gene. Genet Res. 23:23–35. [PubMed] [Google Scholar]
- McDonald JH, Kreitman M.. 1991. Adaptive protein evolution at the Adh locus in Drosophila. Nature. 351:652–654. [DOI] [PubMed] [Google Scholar]
- Messer PW, Petrov DA.. 2013. Frequent adaptation and the McDonald–Kreitman test. Proc Natl Acad Sci USA. 110:8615–8620. [DOI] [PMC free article] [PubMed] [Google Scholar]
- Miller DE, Smith CB, Kazemi NY, Cockrell AJ, Arvanitakis AV, et al. 2016. Whole-genome analysis of individual meiotic events in Drosophila melanogaster reveals that noncrossover gene conversions are insensitive to interference and the centromere effect. Genetics. 203:159–171. [DOI] [PMC free article] [PubMed] [Google Scholar]
- Nielsen R, Williamson S, Kim Y, Hubisz MJ, Clark AG, et al. 2005. Genomics scans for selective sweeps using SNP data. Genome Res. 15:1566–1575. [DOI] [PMC free article] [PubMed] [Google Scholar]
- Pavlidis P, Jensen JD, Stephan W, Stamatakis A.. 2012. A critical assessment of storytelling: gene Ontology categories and the importance of validating genomic scans. Mol Biol Evol. 29:3237–3248. [DOI] [PubMed] [Google Scholar]
- Pfeifer B, Wittelsbürger U, Ramos-Onsins SE, Lercher MJ.. 2014. PopGenome: an efficient Swiss army knife for population genomic analyses in R. Mol Biol Evol. 31:1929–1936. [DOI] [PMC free article] [PubMed] [Google Scholar]
- Przeworski M. 2002. The signature of positive selection at randomly chosen loci. Genetics. 160:1179–1189. [DOI] [PMC free article] [PubMed] [Google Scholar]
- R Core Team 2018. R: A Language and Environment for Statistical Computing. Vienna, Austria: R Foundation for Statistical Computing. https://www.R-project.org/. [Google Scholar]
- Sanjuán R. 2010. Mutational fitness effects in RNA and single-stranded DNA viruses: common patterns revealed by site-directed mutagenesis studies. Phil Trans R Soc B. 365:1975–1982. [DOI] [PMC free article] [PubMed] [Google Scholar]
- Sattath S, Elyashiv E, Kolodny O, Rinott Y, Sella G.. 2011. Pervasive adaptive protein evolution apparent in diversity patterns around amino acid substitutions in Drosophila simulans. PLoS Genet. 7:e1001302. [DOI] [PMC free article] [PubMed] [Google Scholar]
- Sella G, Petrov DA, Przeworski M, Andolfatto P.. 2009. Pervasive natural selection in the Drosophila genome. PLoS Genet. 5:e1000495. [DOI] [PMC free article] [PubMed] [Google Scholar]
- Stephan W. 2019. Selective sweeps. Genetics. 211:5–13. [DOI] [PMC free article] [PubMed] [Google Scholar]
- Tajima F. 1990. Relationship between DNA polymorphism and fixation time. Genetics. 125:447–454. [DOI] [PMC free article] [PubMed] [Google Scholar]
- Teshima KM, Coop G, Przeworski M.. 2006. How reliable are empirical genome scans for selective sweeps? Genome Res. 16:702–712. [DOI] [PMC free article] [PubMed] [Google Scholar]
- Thornton K. 2003. Libsequence: a C++ class library for evolutionary genetic analysis. Bioinformatics. 19:2325–2327. [DOI] [PubMed] [Google Scholar]
- Thornton KR, Jensen JD.. 2007. Controlling the false positive rate in multi-locus genome scans for selection. Genetics. 175:737–750. [DOI] [PMC free article] [PubMed] [Google Scholar]
- Wiehe TH, Stephan W.. 1993. Analysis of a genetic hitchhiking model and its application to DNA polymorphism data from Drosophila melanogaster. Mol Biol Evol. 10:842–854. [DOI] [PubMed] [Google Scholar]
- Wright S. 1931. Evolution in Mendelian populations. Genetics. 16:97–159. [DOI] [PMC free article] [PubMed] [Google Scholar]
- Zeng K, Charlesworth B, Hobolth A.. 2021. Studying models of balancing selection using phase-type theory. Genetics. In press. [DOI] [PMC free article] [PubMed] [Google Scholar]
Associated Data
This section collects any data citations, data availability statements, or supplementary materials included in this article.
Supplementary Materials
Data Availability Statement
All scripts used in this study are provided in the Github repository: https://github.com/paruljohri/Deleterious_Sweeps.
Supplementary material is available at GENETICS online.