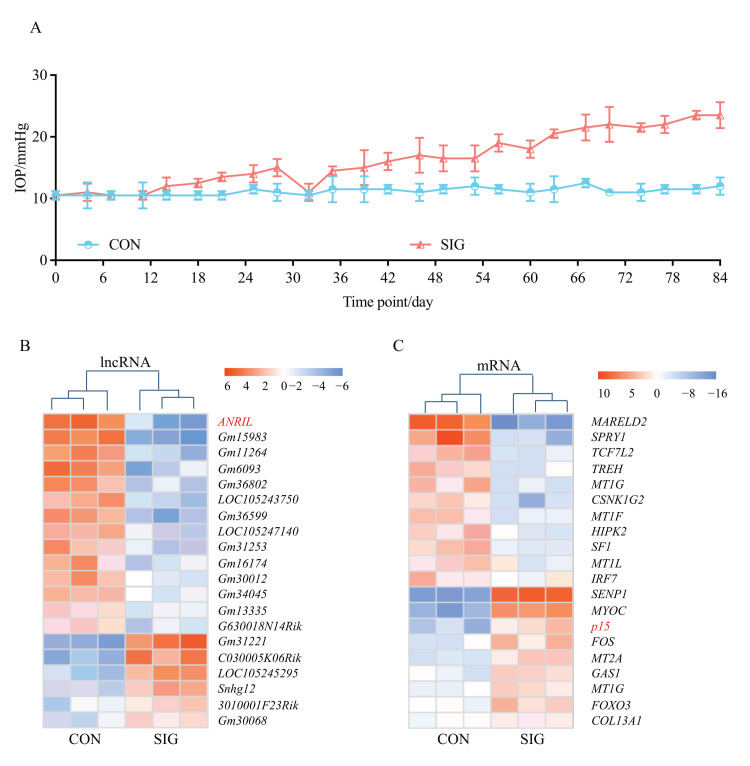
Figure 1.
Transcriptome landscape in SIG mice. C57BL/6J mice were given topical 0.1% DEX or sterile PBS eye drops, 3 times daily for 12 weeks. IOP was measured in both eyes of control mice and SIG mice every three days (A). Only eyes with increased IOP (>21 mmHg) were recruited in the SIG group for the following microarray screening. TM tissues were isolated from SIG mice and normal controls as stated in the Methods. The dysregulated lncRNAs (B) and mRNAs (C) with a fold change >4 and p < 0.05 are listed in the heatmap. Notes: n = 3 per group; CON = control; SIG = steroid-induced glaucoma; IOP = intraocular pressure.

