Abstract
Background
Pancreatic cancer, particularly pancreatic ductal adenocarcinoma (PDA), is an aggressive malignancy associated with a low 5‐year survival rate. Poor outcomes associated with PDA are attributable to late detection and inoperability. Most patients with PDA are diagnosed with locally advanced and metastatic disease. Such cases are primarily treated with chemotherapy and radiotherapy. Because of the lack of effective molecular targets, early diagnosis and successful therapies are limited. The purpose of this study was to screen key candidate genes for PDA using a bioinformatic approach and to research their potential functional, pathway mechanisms associated with PDA progression. It may help to understand the role of associated genes in the development and progression of PDA and identify relevant molecular markers with value for early diagnosis and targeted therapy.
Materials and methods
To identify novel genes associated with carcinogenesis and progression of PDA, we analyzed the microarray datasets GSE62165, GSE125158, and GSE71989 from the Gene Expression Omnibus (GEO) database. Differentially expressed genes (DEGs) were identified, and the Database for Annotation, Visualization, and Integrated Discovery (DAVID) was used for Gene Ontology (GO) and Kyoto Encyclopedia of Genes and Genomes (KEGG) pathway analyses. A protein‐protein interaction (PPI) network was constructed using STRING, and module analysis was performed using Cytoscape. Gene Expression Profiling Interactive Analysis (GEPIA) was used to evaluate the differential expression of hub genes in patients with PDA. In addition, we verified the expression of these genes in PDA cell lines and normal pancreatic epithelial cells.
Results
A total of 202 DEGs were identified and these were found to be enriched for various functions and pathways, including cell adhesion, leukocyte migration, extracellular matrix organization, extracellular region, collagen trimer, membrane raft, fibronectin‐binding, integrin binding, protein digestion, and absorption, and focal adhesion. Among these DEGs, 12 hub genes with high degrees of connectivity were selected. Survival analysis showed that the hub genes (HMMR, CEP55, CDK1, UHRF1, ASPM, RAD51AP1, DLGAP5, KIF11, SHCBP1, PBK, and HMGB2) may be involved in the tumorigenesis and development of PDA, highlighting their potential as diagnostic and therapeutic factors in PDA.
Conclusions
In summary, the DEGs and hub genes identified in the present study not only contribute to a better understanding of the molecular mechanisms underlying the carcinogenesis and progression of PDA but may also serve as potential new biomarkers and targets for PDA.
Keywords: bioinformatic analysis, biomarkers, hub genes, Pancreatic cancer
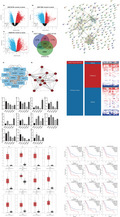
Pancreatic cancer is highly malignant, and using bioinformatics analysis (procedure below), we identified atotal of 11 key genes associated with prognosis, which may help in the diagnosis and treatment of pancreaticcancer.
1. INTRODUCTION
Pancreatic cancer, especially pancreatic ductal adenocarcinoma (PDA), which accounts for >90% of pancreatic cancers, is associated with a poor prognosis. 1 The 5‐year overall survival rate remains approximately 7%. 2 , 3 Despite advancements in our understanding of pancreatic cancer, the precise mechanisms underlying tumorigenicity remain unclear.
Approximately 10% of all patients have an inherited predisposition to PDA development, including KRAS activation mutations, which are present in >90% of tumors 4 ; inactivating mutations affecting TP53, CDKN2A, and SMAD4, which occur in 50–80% of pancreatic cancers 5 ; and mutations affecting other genes, including ARID1A, MLL3, and TGFBR2, which affect approximately 10% of tumors. 6 , 7 , 8 , 9 , 10 , 11 , 12 The median survival is 6–9 months for locally advanced disease and 3 months for metastatic disease. 13
With in‐depth research on the molecular mechanism of PDA, the serum marker Carbohydrate antigen199 (CA199) has been widely used in clinical practice as an adjunctive diagnostic test for PDA and postoperative monitoring. Although CA199 has a high sensitivity for PDA diagnosis, its lack of specificity is also quite limited. 14 About 75% of patients with PDA have mutations in the p53 gene, which is associated with cell cycle arrest and apoptosis. 6 , 15 More than 90% of pancreatic cancer patients have vascular epidermal growth factor (VEGF) overexpression, 16 which has been used as a target for drug therapy to inhibit tumor angiogenesis and thus reduce tumor blood supply to inhibit tumor growth. However, in one study, treatment of PDA with bevacizumab in combination with gemcitabine did not significantly improve the survival prognosis of patients. 17 With the widespread use of next‐generation sequencing (NGS) technology, a reliable tool for early diagnosis and progression prediction of cancer has been provided. 18 And a large amount of relevant biological and clinical data has been generated by NGS analysis, which provides the possibility to study and analyze the bioinformatics of gene expression and molecular functional characteristics associated with PDA. 19
To continue research on the molecular mechanisms of PDA carcinogenesis and progression, we identified a total of 202 DEGs and 12 hub genes. The corresponding bioinformatics analysis revealed that HMMR, CEP55, CDK1, UHRF1, ASPM, RAD51AP1, DLGAP5, KIF11, SHCBP1, PBK, and HMGB2, in particular, may be potential biomarkers and therapeutic targets for PDA.
2. METHODS AND MATERIALS
2.1. Cell culture
Four PDA cell lines (AsPC‐1, SW1990, PANC‐1, and BxPC‐3) and a normal human pancreatic ductal epithelial cell line (HPDE) were used in the study. Cell lines were purchased from the Cell Bank of the Type Culture Collection of the Chinese Academy of Sciences. According to the supplier's protocol, SW1990, PANC‐1, and HPDE cell lines were cultured in Dulbecco's modified Eagle's medium (DMEM; VivaCell), and BxPC‐3 and AsPC‐1 cells were cultured in RPMI 1640 medium (VivaCell). All culture media were supplemented with 10% fetal bovine serum (FBS; VivaCell) and 100 U/ml penicillin and 100 µg/ml streptomycin, and the cells were maintained under standard culture conditions (37°C, 95% humidified air, and 5% CO2).
2.2. Microarray data
PDA gene expression datasets (GSE62165, 20 GSE125158, 21 and GSE71989 22 ) were obtained from the NCBI Gene Expression Omnibus (GEO) database (http://www.ncbi.nlm.nih.gov/geo/), a public functional genomics data repository for storing high‐throughput gene expression datasets, sequence‐based data, and microarrays. 23 GSE62165 (GPL13667 [HG‐U219] Affymetrix Human Genome U219 Array) is based on 118 PDA tissue samples and 13 noncancerous samples, GSE125158 (GPL6480, Agilent‐014850 Whole Human Genome Microarray 4x44K G4112F) is based on 17 PDA and 13 noncancerous samples, GSE71989 (GPL570 [HG‐U133_Plus_2] Affymetrix Human Genome U133 Plus 2.0 Array) is based on 13 PDA and nine noncancer samples.
2.3. Identification of DEGs
A total of 148 tumors and 35 nontumor tissue datasets were identified. DEGs between PDA and noncancer samples were identified using GEO2R (http://www.ncbi.nlm.nih.gov/geo/geo2r). GEO2R is an interactive web tool used to identify DEGs between different datasets by comparing them in a GEO series. This tool was also used to calculate the p‐value and |logFC|, and the cutoff threshold for identifying DEGs was set at p < 0.05, and |logFC|≥1.0). Statistical analyses were performed on each dataset. Venn diagrams were constructed using a web tool (http://bioinformatics.psb.ugent.be/webtools/Venn/).
2.4. GO and KEGG pathway analysis of DEGs
GO and KEGG pathway enrichment analyses were performed to determine the biological functions of DEGs. 24 Gene Ontology (GO) is widely used in functional annotation and enrichment analysis; biological process (BP), molecular function (MF), and cellular component (CC) are the three major components of gene function. KEGG is a database resource for collecting a large amount of data on molecular level information, biological pathways, and chemical substances that are generated by high‐throughput experimental technologies. The database for annotation, visualization, and integrated discovery (DAVID; http://david.ncifcrf.gov) (version 6.8) 25 is an online biological information database that integrates biological data and analysis tools and provides a comprehensive set of functional annotation information of genes and proteins for users to extract biological information. We used DAVID for GO and KEGG pathway analyses of DEGs. Statistical significance was set at p < 0.05.
2.5. PPI network construction and hub gene identification
The PPI network was constructed using STRING (http://string‐db.org), which integrates both known and predicted PPIs. PPI pairs with combined scores of >0.4 were extracted and the PPI network was visualized using Cytoscape version 3.7.2. The most significant PPI network modules were identified using the Molecular Complex Detection (MCODE) plug‐in of Cytoscape (version 1.6.1) using the following cutoff thresholds: MCODE degree cutoff = 2, node score cutoff = 0.2, Max depth = 100, and k‐score = 2.
2.6. Selection and analysis of hub genes
The hub genes were selected with the hub gene module, and their co‐expression network was analyzed using Coexpedia (https://www.coexpedia.org/). Hierarchical clustering of the hub genes was performed using the UCSC Cancer Genomics Browser (http://genome‐cancer.ucsc.edu). Differential expression of hub genes in PAAD patients was evaluated using Gene Expression Profiling Interactive Analysis (GEPIA) (http://gepia.cancer‐pku.cn/), which is a newly developed interactive web server for analyzing the RNA sequencing expression data of 9736 tumors and 8587 normal samples from the TCGA and GTEx projects, using a standard processing pipeline. 26 The association between hub genes and overall survival was evaluated using Kaplan‐Meier analysis.
2.7. RNA isolation and quantitative real‐time PCR
Total RNA was isolated using TRIzol reagent (TaKaRa) and transcribed into cDNA using the PrimeScript RT Reagent Kit (TaKaRa). Quantitative real‐time PCR was carried out using an RT‐PCR amplifier system (Bio‐Rad, USA) using an SYBR Green PCR Kit (Takara). Relative quantitation of mRNA expression was performed using the 2ΔΔCt method after normalization to the endogenous reference GAPDH. Table S1 S1 shows the primers used in this study.
2.8. Statistical analysis
In this study, the relevant data were analyzed using GraphPad Prism 8.0 and GEPIA online tools. The box diagram in GEPIA was used to analyze the expression of related genes, and Kaplan‐Meier survival analysis with log‐rank test was used to analyze the overall survival as well as to plot the survival curves. qRT‐PCR data are expressed as mean ± standard deviation (SD). Comparisons among multiple groups were performed using a one‐way analysis of variance. Statistical significance was set at p < 0.05.
3. RESULTS
3.1. Identification of DEGs
In this study, we selected three gene expression datasets (GSE62165, GSE125158, and GSE71989). As shown in Table 1, GSE62165 contained 118 PDA specimens and 13 normal pancreatic specimens, GSE125158 contained 17 PDA specimens and 13 normal pancreatic specimens, and GSE71989 contained 13 PDA samples and nine normal pancreatic samples. Using GEO2R, 6887, 1770, and 4367 DEGs were identified in datasets GSE62165, GSE125158, and GSE71989, respectively, with 202 overlapping DEGs between the three datasets (Figure 1).
TABLE 1.
A summary of pancreatic cancer microarray datasets from different gene expression omnibus datasets
FIGURE 1.
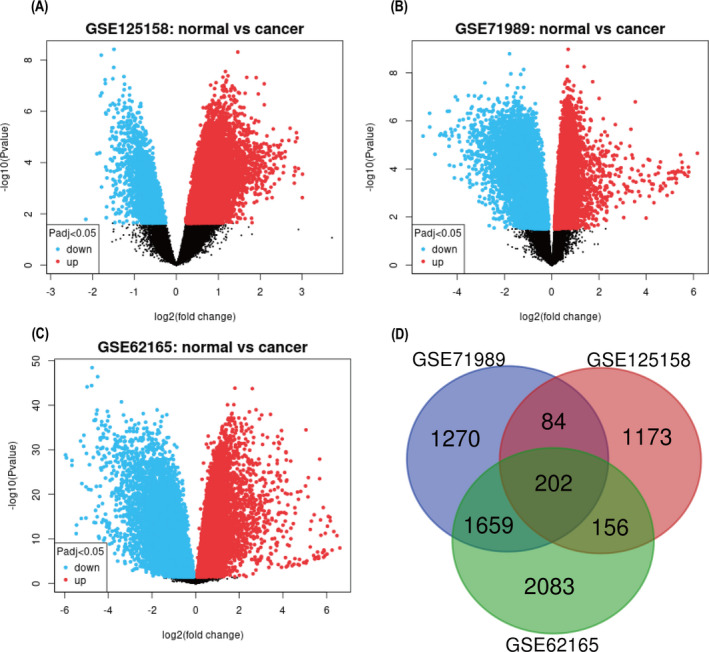
Volcano plots of genes that are different expressions between PDA tissues and noncancerous samples. Each symbol represents a different gene. The red color of the symbols means upregulated, whereas the green color of the symbols means downregulated, and dark color represents not significantly changed genes. X‐axis is log2‐fold changes of genes in PDA compared with normal pancreas samples. Y‐axis is‐log10 (p‐values). (A) Volcano plots of GSE125158. (B) Volcano plots of GSE71989. (C) Volcano plots of GSE62165. (D) Venn diagram. The DEGs were selected with a fold change ≥1 and p‐value <0.05 among the mRNA expression profile sets GSE125158, GSE71989, and GSE62165. The three datasets showed an overlap of 202 genes. DEGs, differentially expressed genes; PDA, pancreatic ductal adenocarcinoma
3.2. KEGG and GO enrichment analyses of DEGs
Next, we used DAVID to perform the GO and KEGG pathway analyses (Table 2). For BP, DEGs were enriched mainly in cell adhesion, collagen, leukocyte migration, endodermal cell differentiation, maintenance of gastrointestinal epithelium, regulation of glucose metabolic processes, positive regulation of transcription, DNA‐templated, and wound healing. MF was mainly enriched in calcium ion binding, fibronectin‐binding, translation repressor activity, nucleic acid binding, integrin binding, insulin‐like growth factor I binding, and serine‐type endopeptidase activity. For CC, DEGs were enriched in extracellular space, matrix, extracellular exosome, and membrane raft. KEGG pathway analysis revealed that the DEGs were associated with pathways related to cancer, extracellular matrix (ECM) receptor interaction, protein digestion, absorption, tumor necrosis factor (TNF) signaling pathway, and focal adhesion.
TABLE 2.
GO and KEGG pathway enrichment analysis of DEGs in PDA samples
| Category | Term | Count | p‐Value |
|---|---|---|---|
| GOTERM_BP_DIRECT | GO:0007155~cell adhesion | 19 | 3.61E−06 |
| GOTERM_BP_DIRECT | GO:0030574~collagen catabolic process | 8 | 6.66E−06 |
| GOTERM_BP_DIRECT | GO:0050900~leukocyte migration | 9 | 6.40E−05 |
| GOTERM_BP_DIRECT | GO:0030199~collagen fibril organization | 6 | 6.70E−05 |
| GOTERM_BP_DIRECT | GO:0035987~endodermal cell differentiation | 5 | 2.10E−04 |
| GOTERM_BP_DIRECT | GO:0030277~maintenance of gastrointestinal epithelium | 4 | 2.73E−04 |
| GOTERM_BP_DIRECT | GO:0030198~extracellular matrix organization | 10 | 3.42E−04 |
| GOTERM_BP_DIRECT | GO:0010906~regulation of glucose metabolic process | 4 | 0.001763481 |
| GOTERM_BP_DIRECT | GO:0045893~positive regulation of transcription, DNA‐templated | 15 | 0.001824127 |
| GOTERM_BP_DIRECT | GO:0042060~wound healing | 6 | 0.001941507 |
| GOTERM_BP_DIRECT | GO:0008284~positive regulation of cell proliferation | 14 | 0.002110314 |
| GOTERM_BP_DIRECT | GO:0090090~negative regulation of canonical Wnt signaling pathway | 8 | 0.00228459 |
| GOTERM_BP_DIRECT | GO:0010628~positive regulation of gene expression | 10 | 0.00262849 |
| GOTERM_BP_DIRECT | GO:0042475~odontogenesis of dentin‐containing tooth | 5 | 0.003200207 |
| GOTERM_BP_DIRECT | GO:0006508~proteolysis | 14 | 0.003853736 |
| GOTERM_BP_DIRECT | GO:0071407~cellular response to organic cyclic compound | 5 | 0.00412687 |
| GOTERM_BP_DIRECT | GO:0043586~tongue development | 3 | 0.005179886 |
| GOTERM_BP_DIRECT | GO:1902042~negative regulation of extrinsic apoptotic signaling pathway via death domain receptors | 4 | 0.005714744 |
| GOTERM_BP_DIRECT | GO:0001649~osteoblast differentiation | 6 | 0.006006712 |
| GOTERM_BP_DIRECT | GO:0050919~negative chemotaxis | 4 | 0.006217342 |
| GOTERM_BP_DIRECT | GO:0097192~extrinsic apoptotic signaling pathway in absence of ligand | 4 | 0.006217342 |
| GOTERM_BP_DIRECT | GO:0060394~negative regulation of pathway‐restricted SMAD protein phosphorylation | 3 | 0.007487389 |
| GOTERM_CC_DIRECT | GO:0005615~extracellular space | 35 | 1.41E−06 |
| GOTERM_CC_DIRECT | GO:0005576~extracellular region | 39 | 1.56E−06 |
| GOTERM_CC_DIRECT | GO:0031012~extracellular matrix | 15 | 3.04E−06 |
| GOTERM_CC_DIRECT | GO:0005578~proteinaceous extracellular matrix | 14 | 5.22E−06 |
| GOTERM_CC_DIRECT | GO:0070062~extracellular exosome | 52 | 3.99E−05 |
| GOTERM_CC_DIRECT | GO:0005581~collagen trimer | 8 | 5.14E−05 |
| GOTERM_CC_DIRECT | GO:0009897~external side of plasma membrane | 9 | 0.001863917 |
| GOTERM_CC_DIRECT | GO:0045121~membrane raft | 8 | 0.006117264 |
| GOTERM_MF_DIRECT | GO:0005509~calcium ion binding | 22 | 5.53E−05 |
| GOTERM_MF_DIRECT | GO:0001968~fibronectin binding | 4 | 0.002970899 |
| GOTERM_MF_DIRECT | GO:0000900~translation repressor activity, nucleic acid binding | 3 | 0.005289145 |
| GOTERM_MF_DIRECT | GO:0005178~integrin binding | 6 | 0.006536482 |
| GOTERM_MF_DIRECT | GO:0031994~insulin‐like growth factor I binding | 3 | 0.007644107 |
| GOTERM_MF_DIRECT | GO:0004252~serine‐type endopeptidase activity | 9 | 0.008138653 |
| KEGG_PATHWAY | hsa05200:Pathways in cancer | 15 | 1.11E−04 |
| KEGG_PATHWAY | hsa04512:ECM‐receptor interaction | 7 | 4.26E−04 |
| KEGG_PATHWAY | hsa04974:Protein digestion and absorption | 7 | 4.53E−04 |
| KEGG_PATHWAY | hsa04668:TNF signaling pathway | 6 | 0.007120596 |
| KEGG_PATHWAY | hsa04510:Focal adhesion | 8 | 0.008530044 |
Abbreviations: DEGs, differentially expressed genes; GO, gene ontology; KEGG, kyoto encyclopedia of genes and genomes; PDA, pancreatic ductal adenocarcinoma.
3.3. PPI network construction and module analysis
The probability of relationships between the pathways was evaluated using STRING and a PPI network was constructed. A PPI network of DEGs that included 138 nodes and 640 interactions was constructed to identify gene interactions, as shown in Figure 2. The most important module was confirmed using Cytoscape (Figure 3A), and 12 hub genes were identified (Table 3). This analysis revealed that HMGB2 had the lowest degree (8), whereas all the others had a degree of 10. These hub genes were upregulated in PDA.
FIGURE 2.
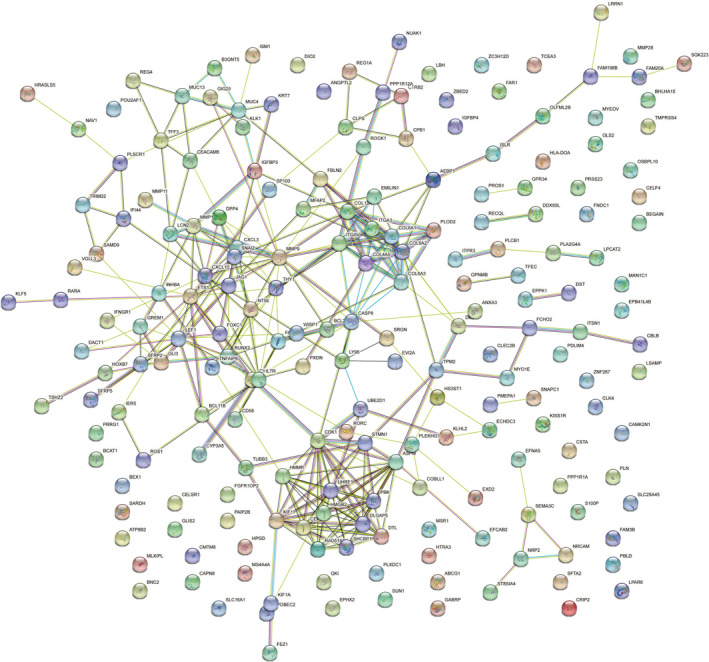
The PPI network of DEGs was constructed using STRING database. The PPI network of DEGs that included 138 nodes and 640 edges. DEGs, differentially expressed genes; PPI, protein‐protein interaction; STRING, search tool for the retrieval of interacting genes
FIGURE 3.
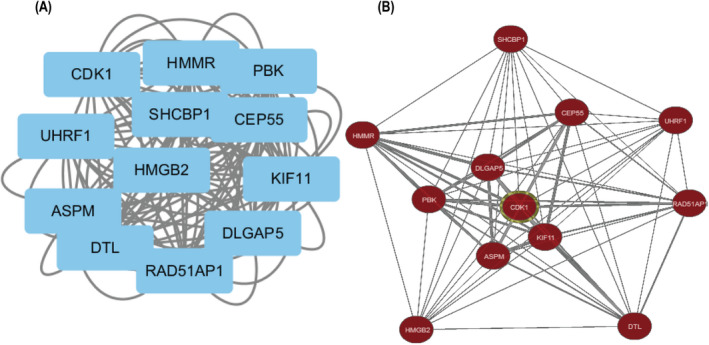
Hub genes module and co‐expression network. (A) The most significant module was obtained from PPI network with 12 nodes and 126 edges, including all the hub genes. (B) The co‐expression network of hub genes was analyzed using Coexpedia online platform
TABLE 3.
Functional roles of 12 hub genes with degree ≥5
| No. | Gene symbol | Full name | Function | Degree |
|---|---|---|---|---|
| 1 | CDK1 | Cyclin‐dependent kinase 1 | CDK1 is essential for G1/S and G2/M phase transitions of eukaryotic cell cycle, and associated with breast cancer | 32 |
| 2 | ASPM | Assembly factor for spindle microtubules | ASPM is essential for normal mitotic spindle function in embryonic neuroblasts, poor prognosis, and regulates cell proliferation in bladder cancer | 28 |
| 3 | KIF11 | Kinesin family member 11 | KIF11 encodes a motor protein, and associated with colorectal cancer | 28 |
| 4 | HMMR | Hyaluronan‐mediated motility receptor | HMMR is involved in cell motility, potentially associated with higher risk of breast cancer | 24 |
| 5 | CEP55 | Centrosomal protein 55 | Plays a role in mitotic exit and cytokinesis, may regulate breast cancer spinal metastases | 24 |
| 6 | UHRF1 | Ubiquitin like with PHD and ring finger domains 1 | UHRF1 plays a major role in the G1/S transition and retinoblastoma gene expression, and is up‐regulated in various cancers | 24 |
| 7 | DLGAP5 | DLG‐associated protein 5 | DLGAP5 is a potential cell cycle regulator, and overexpressed in hepatocellular carcinoma | 24 |
| 8 | PBK | PDZ‐binding kinase | PBK overexpression in tumorigenesis, and drives androgen‐independent growth in prostate cancer | 24 |
| 9 | RAD51AP1 | RAD51‐associated protein 1 | Structure‐specific DNA‐binding protein involved in DNA repair, and promotes progression of ovarian cancer | 22 |
| 10 | SHCBP1 | SHC binding and spindle‐associated 1 | SHCBP1 promotes the progression of prostate cancer | 20 |
| 11 | DTL | Denticleless E3 ubiquitin protein ligase homolog | DTL is involved in cell cycle control, and associated with endometrial squamous cell carcinoma | 20 |
| 12 | HMGB2 | High mobility group box 2 | HMGB2 may promote proliferation and invasion of renal tumor | 16 |
3.4. Hub gene selection and analysis
A total of 12 genes with degrees ≥5 were identified as hub genes, and hub gene networks and hub gene co‐expression were assessed using Coexpedia (Figure 3B). Hierarchical clustering showed that the hub genes could differentiate PDA samples from noncancerous samples (Figure 4). Evaluation of the expression of these hub genes in PDA and noncancerous samples using GEPIA revealed that the expression of 12 hub genes was higher in PDA samples than in noncancerous samples (Figure 5, p < 0.05). Next, we used GEPIA to evaluate the relationship between the 12 hub genes and PDA survival and found that upregulation of HMMR, CEP55, CDK1, UHRF1, ASPM, RAD51AP1, DLGAP5, KIF11, SHCBP1, PBK, and HMGB2 was correlated with poor PDA prognosis (Figure 6). However, there was no significant correlation between DTL expression and prognosis (p > 0.05). Collectively, these findings highlight the therapeutic and diagnostic potential of these hub genes.
FIGURE 4.
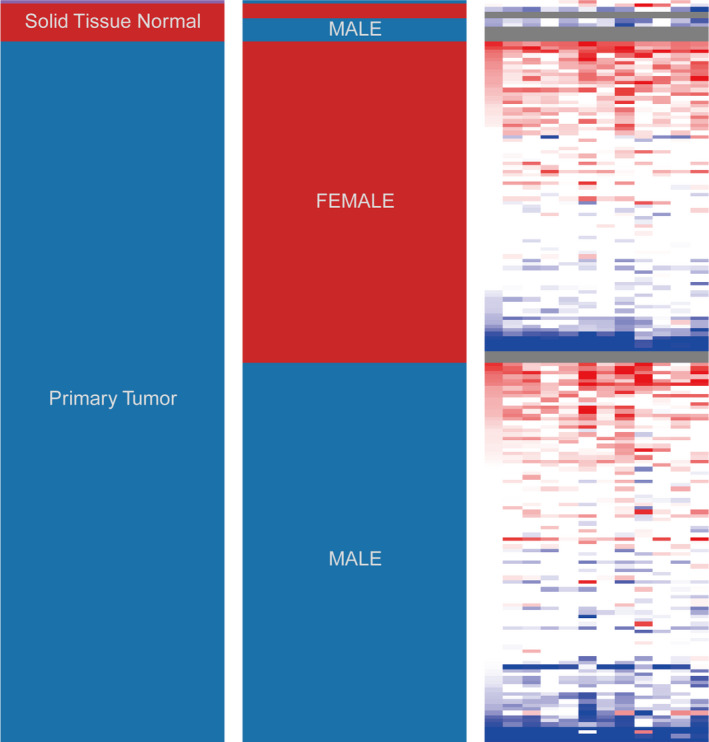
Hierarchical clustering of hub genes was constructed using UCSC Xena. The samples under the pink bar are noncancerous samples, and the samples under the blue bar are PDA samples. Upregulation of genes is marked in red; downregulation of genes is marked in blue. PDA, pancreatic ductal adenocarcinoma
FIGURE 5.
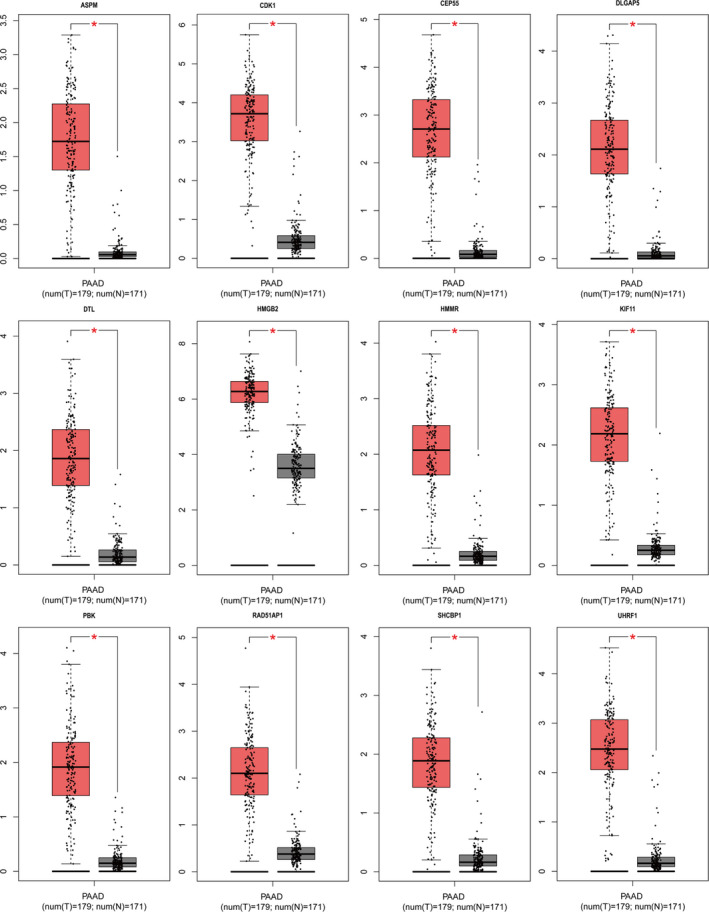
The expression of 12 hub genes in PDA samples and noncancerous samples through GAPIA database (*p < 0.01). All hub genes were upregulated in the tumors of patients with PDA. Red represents tumor tissue and black represents normal tissue. PAAD or PDA, pancreatic ductal adenocarcinoma; GAPIA, gene expression profiling interactive analysis
FIGURE 6.
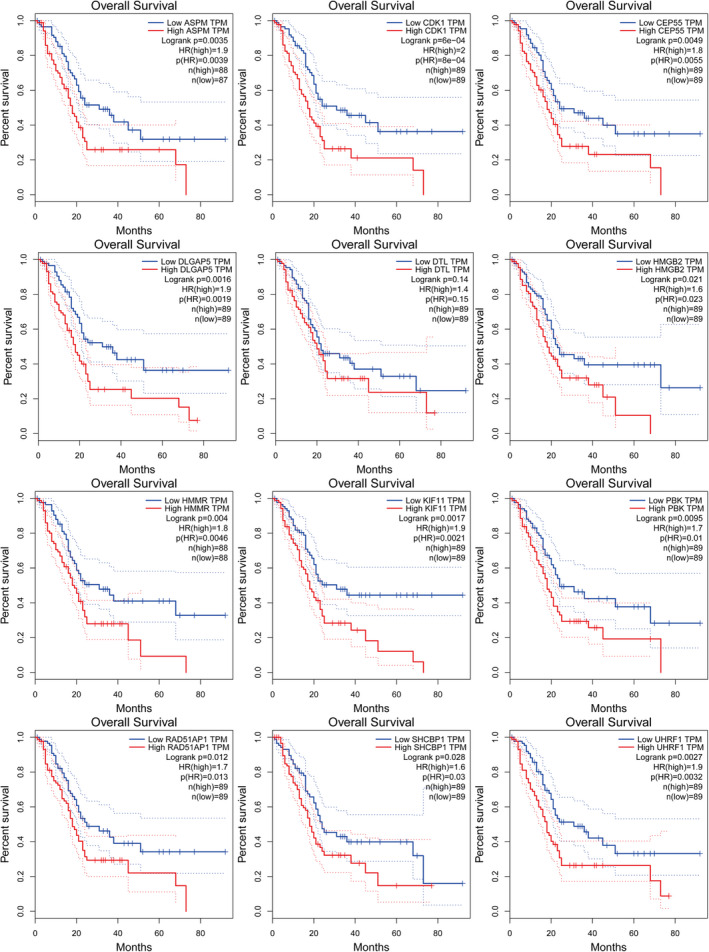
Kaplan‐Meier survival curve analysis. The overall survival of twelve hub genes (HMMR, CEP55, CDK1, UHRF1, ASPM, RAD51AP1, DLGAP5, KIF11, SHCBP1, DTL, PBK and HMGB2) expression in PAD using GEPIA. Red line depicts genes with higher expression associated with poor overall survival and blue line depicts genes with lower expression associated with good survival. PDA, pancreatic ductal adenocarcinoma
qRT‐PCR revealed that contrary to bioinformatics predictions CDK1, ASPM, and SHCBP1 were expressed at low levels in pancreatic cancer cell lines (AsPC‐1, SW1990, PANC‐1, and BxPC‐3) compared to that in HPDE cells (Figure 7). KIF11 was highly expressed in PANC‐1 compared to HPDE (p < 0.05); HMMR was highly expressed in AsPC‐1 and PANC‐1; CEP55 was highly expressed (p < 0.05); UHRF1 was highly expressed in AsPC‐1 and PANC‐1 (p < 0.05); DLGAP5 was highly expressed in AsPC‐1, BxPC‐3, and PANC‐1 (p < 0.05); PBK was highly expressed in AsPC‐1 and BxPC‐3; RAD51AP1 was highly expressed in AsPC‐1; and HMGB2 was highly expressed in AsPC‐1 (p < 0.05).
FIGURE 7.
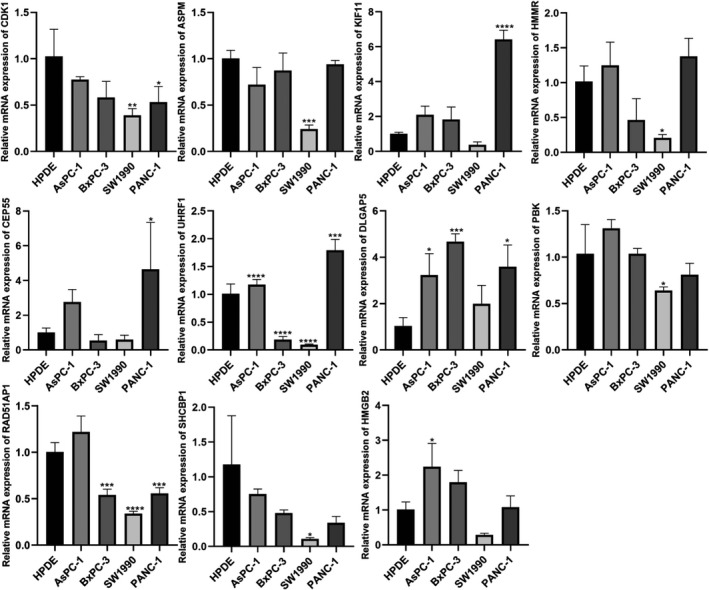
Results of quantitative real‐time PCR revealed that CDK1, ASPM, KIF11, HMMR, CEP55, UHRF1, DLGAP5, PBK, RAD51AP1, SHCBP1, and HMGB2 transcription levels in four cancerous cell lines (AsPC‐1, SW1990, PANC‐1, BxPC‐3) and benign cells (HPDE). *p < 0.05, **p < 0.01, ***p < 0.001, ****p < 0.0001
4. DISCUSSION
Here, we examined three GEO datasets using gene expression and protein‐protein interaction analyses and identified 202 DEGs in PDA versus noncancerous samples. A PPI network was constructed to evaluate the relationship between the DEGs and HMMR, CEP55, CDK1, UHRF1, ASPM, RAD51AP1, DLGAP5, KIF11, SHCBP1, DTL, PBK, and HMGB2 that were identified as hub genes (degrees ≥5). HMMR is involved in cell motility and ECM‐receptor interactions. Intracellular HMMR is an actin‐ and microtubule‐associated protein that maintains spindle integrity. 27 Increased HMMR expression has been associated with progression and poor prognosis in various cancer types. 28 , 29 CEP55 is involved in mitotic exit and cytokinesis, 30 , 31 as well as in mitotic nuclear division. It is located on 10q23.33 and contains nine exons. 30 CEP55 is upregulated in ovarian epithelial carcinoma, gastric cancer, and breast cancer, and influences cell proliferation, cancer aggressiveness, and prognosis. 32 , 33 , 34 CDK1 interacts with various cyclins to regulate the cell cycle by regulating the centrosome cycle, mitotic onset, G2‐M transition, G1 progression, and G1‐S transition. 35 , 36 It phosphorylates p53. 37 , 38 CDK1 can substitute other CDKs and is sufficient to drive the mammalian cell cycle. 39 UHRF1 positively regulates gene expression and DNA topoisomerase (ATP hydrolyzing) activity, nuclear chromatin, and protein binding. Several studies have shown that UHRF1 influences apoptosis in cancer cells. 40 , 41 , 42 ASPM is involved in forebrain neuroblast division, neuron migration, mitotic spindle regulation, coordination of mitotic processes, and maintenance of neural progenitor cells. 43 ASPM mutations have been implicated in microcephaly. 44
RAD51AP1 is a structure‐specific DNA‐binding protein involved in DNA repair via the promotion of RAD51‐mediated homologous recombination. 45 , 46 Upregulation of DNA repair genes is associated with metastatic cancer. 47 RAD51AP1 is upregulated in advanced breast cancer. 48 DLGAP5 plays a role in spindle assembly, kinetochore fiber stabilization, and chromosomal segregation. 49 , 50 , 51 It is upregulated in hepatocellular carcinoma, colorectal cancer, urinary bladder transitional cell carcinoma, prostate cancer, meningioma, and adrenocortical carcinoma. 49 , 52 KIF11 is associated with mitotic nuclear division, and its upregulation is associated with premature separation of sister chromatids and unequal chromosome segregation, 53 which contributes to invasion and metastasis. 54 KIF11 is upregulated in various cancers with poor prognosis, including pancreatic, and gastric cancer. 55 , 56 SHCBP1 (located on 16q11.2) is a member of the Shc adaptor downstream protein family. 57 SHCBP1 phosphorylation is required for cleavage furrow separation, 58 and it promotes the growth of hepatocellular carcinoma via the MEK/ERK pathway. 59 DTL, which is located on chromosome 1q32, encodes a putative 730 amino acid protein 60 associated with intracellular membrane‐bound organelles and regulates p53 protein stability. 61 DTL promotes metastatic potential in HCC as well as tumorigenesis in breast cancer cells. 60 , 62 PBK, a novel serine‐threonine kinase, is a member of the mitogen‐activated protein kinase (MAPK) family and a negative modulator of the inflammatory response and mitotic nuclear division. It influences cytokinesis, DNA damage, and DNA repair. 63 , 64 , 65 PBK has been implicated in various cancers. 66 HMGB2 is a positive modulator of transcription, DNA‐templated, and negative regulation of extrinsic apoptosis via death domain receptors, as well as DNA binding, bending, and transcription factor binding. HMGB2 promotes breast cancer progression by regulating proliferation and glycolysis. 67
The expression of these genes was verified by qRT‐PCR in pancreatic cancer and normal pancreatic cell lines. The results showed that CDK1, ASPM, and SHCBP1 were expressed at low levels in pancreatic cancer cells relative to normal pancreatic cell lines. The remaining eight genes were all or partially highly expressed in pancreatic cancer cell lines, consistent with those predicted by bioinformatic methods. We found that the expression of some genes was contrary to the bioinformatics prediction; therefore, they need to be validated at the tissue and protein levels during the next stage of subsequent experiments.
By reviewing the relevant literature, we found that PIAO J et al. 68 performed immunohistochemical staining of CDK1 in 99 PDA tissues and 71 normal pancreatic tissues to analyze its expression and found that the CDK1 positivity rate (97/99, 98%) was significantly higher than that of normal pancreatic tissues (40/71, 56.3%). HSU C‐C et al. 69 found that ASPM isoform I (ASPM‐iI) and ASPM‐iII, were differentially and heterogeneously expressed in various PDAC cell lines, while ASPM‐iIII and ASPM‐iIV were hardly expressed. YANG C et al. 70 performed immunohistochemical staining of SHCBP1 in 186 PDA specimens and paracancerous tissues and showed that SHCBP1 (115/186, 62%) was expressed at higher levels in PDA samples than in paracancerous tissues.
Here, we identified HMMR, CEP55, CDK1, UHRF1, ASPM, RAD51AP1, DLGAP5, KIF11, SHCBP1, PBK, and HMGB2 as potential biomarkers for early diagnosis and treatment of PDA.
5. CONCLUSION
Using bioinformatic analysis, we identified 202 DEGs and HMMR, CEP55, CDK1, UHRF1, ASPM, RAD51AP1, DLGAP5, KIF11, SHCBP1, PBK, and HMGB2 as hub genes with diagnostic and therapeutic potential in PDA. However, further studies are required to elucidate the biological functions of these genes in PDA.
CONFLICTS OF INTEREST
The authors declare they have no conflicting financial interests.
Supporting information
Table S1
ACKNOWLEDGMENTS
We thank the Lanzhou University Library for providing an online platform to facilitate our data collection and analysis.
Shi H, Xu H, Chai C, Qin Z, Zhou W. Integrated bioinformatics analysis of potential biomarkers for pancreatic cancer. J Clin Lab Anal. 2022;36:e24381. doi: 10.1002/jcla.24381
Funding information
The authors received no funding for this research.
DATA AVAILABILITY STATEMENT
The raw data supporting the conclusions of this article will be made available by the authors, without undue reservation.
REFERENCES
- 1. Chen H, Kong Y, Yao Q, et al. Three hypomethylated genes were associated with poor overall survival in pancreatic cancer patients. Aging (Albany NY). 2019;11(3):885‐897. [DOI] [PMC free article] [PubMed] [Google Scholar]
- 2. Kamisawa T, Wood LD, Itoi T, Takaori K. Pancreatic cancer. Lancet. 2016;388(10039):73‐85. [DOI] [PubMed] [Google Scholar]
- 3. Makohon‐Moore A, Iacobuzio‐Donahue CA. Pancreatic cancer biology and genetics from an evolutionary perspective. Nat Rev Cancer. 2016;16(9):553‐565. [DOI] [PMC free article] [PubMed] [Google Scholar]
- 4. Almoguera C, Shibata D, Forrester K, Martin J, Arnheim N, Perucho M. Most human carcinomas of the exocrine pancreas contain mutant c‐K‐ras genes. Cell. 1988;53(4):549‐554. [DOI] [PubMed] [Google Scholar]
- 5. Yang Y, Ding Y, Gong Y, et al. The genetic landscape of pancreatic head ductal adenocarcinoma in China and prognosis stratification. BMC Cancer. 2022;22(1):186. [DOI] [PMC free article] [PubMed] [Google Scholar]
- 6. Jones Siân, Zhang X, Parsons DW, et al. Core signaling pathways in human pancreatic cancers revealed by global genomic analyses. Science. 2008;321(5897):1801‐1806. [DOI] [PMC free article] [PubMed] [Google Scholar]
- 7. Wang L, Tsutsumi S, Kawaguchi T, et al. Whole‐exome sequencing of human pancreatic cancers and characterization of genomic instability caused by MLH1 haploinsufficiency and complete deficiency. Genome Res. 2012;22(2):208‐219. [DOI] [PMC free article] [PubMed] [Google Scholar]
- 8. Biankin AV, Waddell N, Kassahn KS, et al. Pancreatic cancer genomes reveal aberrations in axon guidance pathway genes. Nature. 2012;491(7424):399‐405. [DOI] [PMC free article] [PubMed] [Google Scholar]
- 9. Waddell N, Pajic M, Patch A‐M, et al. Whole genomes redefine the mutational landscape of pancreatic cancer. Nature. 2015;518(7540):495‐501. [DOI] [PMC free article] [PubMed] [Google Scholar]
- 10. Witkiewicz AK, McMillan EA, Balaji U, et al. Whole‐exome sequencing of pancreatic cancer defines genetic diversity and therapeutic targets. Nat Commun. 2015;6:6744. [DOI] [PMC free article] [PubMed] [Google Scholar]
- 11. Bailey P, Chang DK, Nones K, et al. Genomic analyses identify molecular subtypes of pancreatic cancer. Nature. 2016;531(7592):47‐52. [DOI] [PubMed] [Google Scholar]
- 12. Zhu XL, Zhang TT, Zhang Y, et al. A super‐enhancer controls TGF‐beta signaling in pancreatic cancer through downregulation of TGFBR2. Cell Signal. 2020;66:11. [DOI] [PubMed] [Google Scholar]
- 13. Kleeff J, Korc M, Apte M, et al. Pancreatic cancer. Nat Rev Dis Primers. 2016;2:16022. [DOI] [PubMed] [Google Scholar]
- 14. Yu J, Yang X, Wu H, Li J. Clinical significance of color ultrasound, MRI, miR‐21, and CA199 in the diagnosis of pancreatic cancer. J Oncol. 2021;2021:2380958. [DOI] [PMC free article] [PubMed] [Google Scholar]
- 15. Muller PAJ, Vousden KH. p53 mutations in cancer. Nat Cell Biol. 2013;15(1):2‐8. [DOI] [PubMed] [Google Scholar]
- 16. Seo Y, Baba H, Fukuda T, Takashima M, Sugimachi K. High expression of vascular endothelial growth factor is associated with liver metastasis and a poor prognosis for patients with ductal pancreatic adenocarcinoma. Cancer. 2000;88(10):2239‐2245. [DOI] [PubMed] [Google Scholar]
- 17. Kindler HL, Niedzwiecki D, Hollis D, et al. Gemcitabine plus bevacizumab compared with gemcitabine plus placebo in patients with advanced pancreatic cancer: phase III trial of the Cancer and Leukemia Group B (CALGB 80303). J Clin Oncol. 2010;28(22):3617‐3622. [DOI] [PMC free article] [PubMed] [Google Scholar]
- 18. Liu Y, Wu X, Wang G, Hu S, Zhang Y, Zhao S. CALD1, CNN1, and TAGLN identified as potential prognostic molecular markers of bladder cancer by bioinformatics analysis. Medicine (Baltimore). 2019;98(2):e13847. [DOI] [PMC free article] [PubMed] [Google Scholar]
- 19. Tell RW, Horvath CM. Bioinformatic analysis reveals a pattern of STAT3‐associated gene expression specific to basal‐like breast cancers in human tumors. Proc Natl Acad Sci U S A. 2014;111(35):12787‐12792. [DOI] [PMC free article] [PubMed] [Google Scholar]
- 20. Janky R, Binda MM, Allemeersch J, et al. Prognostic relevance of molecular subtypes and master regulators in pancreatic ductal adenocarcinoma. BMC Cancer. 2016;16(1):632. [DOI] [PMC free article] [PubMed] [Google Scholar]
- 21. Sakai Y, Honda M, Matsui S, et al. Development of novel diagnostic system for pancreatic cancer, including early stages, measuring mRNA of whole blood cells. Cancer Sci. 2019;110(4):1364‐1388. [DOI] [PMC free article] [PubMed] [Google Scholar]
- 22. Jiang J, Azevedo‐Pouly ACP, Redis RS, et al. Globally increased ultraconserved noncoding RNA expression in pancreatic adenocarcinoma. Oncotarget. 2016;7(33):53165‐53177. [DOI] [PMC free article] [PubMed] [Google Scholar]
- 23. Chen F, Zheng A, Li F, Wen S, Chen S, Tao Z. Screening and identification of potential target genes in head and neck cancer using bioinformatics analysis. Oncol Lett. 2019;18(3):2955‐2966. [DOI] [PMC free article] [PubMed] [Google Scholar]
- 24. Zhang YI, He Y, Lu L‐L, et al. miRNA‐192‐5p impacts the sensitivity of breast cancer cells to doxorubicin via targeting peptidylprolyl isomerase A. Kaohsiung J Med Sci. 2019;35(1):17‐23. [DOI] [PMC free article] [PubMed] [Google Scholar]
- 25. Huang DA, Sherman BT, Tan Q, et al. The DAVID gene functional classification tool: a novel biological module‐centric algorithm to functionally analyze large gene lists. Genome Biol. 2007;8(9):R183. [DOI] [PMC free article] [PubMed] [Google Scholar]
- 26. Tang Z, Li C, Kang B, Gao G, Li C, Zhang Z. GEPIA: a web server for cancer and normal gene expression profiling and interactive analyses. Nucleic Acids Res. 2017;45(W1):W98‐W102. [DOI] [PMC free article] [PubMed] [Google Scholar]
- 27. Maxwell CA, McCarthy J, Turley E. Cell‐surface and mitotic‐spindle RHAMM: moonlighting or dual oncogenic functions? J Cell Sci. 2008;121(Pt 7):925‐932. [DOI] [PubMed] [Google Scholar]
- 28. Misra S, Hascall VC, Markwald RR, Ghatak S. Interactions between hyaluronan and its receptors (CD44, RHAMM) regulate the activities of inflammation and cancer. Front Immunol. 2015;6:201. [DOI] [PMC free article] [PubMed] [Google Scholar]
- 29. Cheng X‐B, Sato N, Kohi S, Koga A, Hirata K. Receptor for hyaluronic acid‐mediated motility is associated with poor survival in pancreatic ductal adenocarcinoma. J Cancer. 2015;6(11):1093‐1098. [DOI] [PMC free article] [PubMed] [Google Scholar]
- 30. Fabbro M, Zhou B‐B, Takahashi M, et al. Cdk1/Erk2‐ and Plk1‐dependent phosphorylation of a centrosome protein, Cep55, is required for its recruitment to midbody and cytokinesis. Dev Cell. 2005;9(4):477‐488. [DOI] [PubMed] [Google Scholar]
- 31. Morita E, Sandrin V, Chung H‐Y, et al. Human ESCRT and ALIX proteins interact with proteins of the midbody and function in cytokinesis. EMBO J. 2007;26(19):4215‐4227. [DOI] [PMC free article] [PubMed] [Google Scholar]
- 32. Li C, Hong Z, Ou M, Zhu X, Zhang L, Yang X. Integrated miRNA‐mRNA expression profiles revealing key molecules in ovarian cancer based on bioinformatics analysis. Biomed Res Int. 2021;2021:6673655. [DOI] [PMC free article] [PubMed] [Google Scholar]
- 33. Tao F, Qi L, Liu G. Long intergenic non‐protein coding RNA 662 accelerates the progression of gastric cancer through up‐regulating centrosomal protein 55 by sponging microRNA‐195‐5p. Bioengineered. 2022;13(2):3007‐3018. [DOI] [PMC free article] [PubMed] [Google Scholar]
- 34. Wang Y, Jin T, Dai X, Xu J. Lentivirus‐mediated knockdown of CEP55 suppresses cell proliferation of breast cancer cells. Biosci Trends. 2016;10(1):67‐73. [DOI] [PubMed] [Google Scholar]
- 35. Mori Y, Inoue Y, Taniyama Y, Tanaka S, Terada Y. Phosphorylation of the centrosomal protein, Cep169, by Cdk1 promotes its dissociation from centrosomes in mitosis. Biochem Biophys Res Commun. 2015;468(4):642‐646. [DOI] [PubMed] [Google Scholar]
- 36. Zhao X, Hirota T, Han X, et al. Circadian amplitude regulation via FBXW7‐targeted REV‐ERBα degradation. Cell. 2016;165(7):1644‐1657. [DOI] [PMC free article] [PubMed] [Google Scholar]
- 37. Nantajit D, Fan M, Duru N, Wen Y, Reed JC, Li JJ. Cyclin B1/Cdk1 phosphorylation of mitochondrial p53 induces anti‐apoptotic response. PLoS One. 2010;5(8):e12341. [DOI] [PMC free article] [PubMed] [Google Scholar]
- 38. Wei F, Ojo D, Lin X, et al. BMI1 attenuates etoposide‐induced G2/M checkpoints via reducing ATM activation. Oncogene. 2015;34(23):3063‐3075. [DOI] [PubMed] [Google Scholar]
- 39. Santamaría D, Barrière C, Cerqueira A, et al. Cdk1 is sufficient to drive the mammalian cell cycle. Nature. 2007;448(7155):811‐815. [DOI] [PubMed] [Google Scholar]
- 40. Abdullah O, Omran Z, Hosawi S, Hamiche A, Bronner C, Alhosin M. Thymoquinone is a multitarget single epidrug that inhibits the UHRF1 protein complex. Genes (Basel). 2021;12(5). [DOI] [PMC free article] [PubMed] [Google Scholar]
- 41. Xia T, Liu S, Xu G, Zhou S, Luo Z. Dihydroartemisinin induces cell apoptosis through repression of UHRF1 in prostate cancer cells. Anticancer Drugs. 2022;33(1):e113‐e124. [DOI] [PubMed] [Google Scholar]
- 42. Gao Y, Liu Y, Liu Y, et al. UHRF1 promotes androgen receptor‐regulated CDC6 transcription and anti‐androgen receptor drug resistance in prostate cancer through KDM4C‐mediated chromatin modifications. Cancer Lett. 2021;520:172‐183. [DOI] [PubMed] [Google Scholar]
- 43. Batool T, Irshad S, Mahmood K. Novel pathogenic mutation mapping of ASPM gene in consanguineous pakistani families with primary microcephaly. Braz J Biol. 2021;83:e246040. [DOI] [PubMed] [Google Scholar]
- 44. Bundey S. Prevalence and type of cerebral palsy. Dev Med Child Neurol. 1997;39(8):568. [PubMed] [Google Scholar]
- 45. Modesti M, Budzowska M, Baldeyron C, Demmers JAA, Ghirlando R, Kanaar R. RAD51AP1 is a structure‐specific DNA binding protein that stimulates joint molecule formation during RAD51‐mediated homologous recombination. Mol Cell. 2007;28(3):468‐481. [DOI] [PubMed] [Google Scholar]
- 46. Wiese C, Dray E, Groesser T, et al. Promotion of homologous recombination and genomic stability by RAD51AP1 via RAD51 recombinase enhancement. Mol Cell. 2007;28(3):482‐490. [DOI] [PMC free article] [PubMed] [Google Scholar]
- 47. Redmer T, Walz I, Klinger B, et al. The role of the cancer stem cell marker CD271 in DNA damage response and drug resistance of melanoma cells. Oncogenesis. 2017;6(1):e291. [DOI] [PMC free article] [PubMed] [Google Scholar]
- 48. Zhao H, Gao Y, Chen QI, et al. RAD51AP1 promotes progression of ovarian cancer via TGF‐β/Smad signalling pathway. J Cell Mol Med. 2021;25(4):1927‐1938. [DOI] [PMC free article] [PubMed] [Google Scholar]
- 49. Tsou A‐P, Yang C‐W, Huang C‐Y, et al. Identification of a novel cell cycle regulated gene, HURP, overexpressed in human hepatocellular carcinoma. Oncogene. 2003;22(2):298‐307. [DOI] [PubMed] [Google Scholar]
- 50. Wong J, Fang G. HURP controls spindle dynamics to promote proper interkinetochore tension and efficient kinetochore capture. J Cell Biol. 2006;173(6):879‐891. [DOI] [PMC free article] [PubMed] [Google Scholar]
- 51. Hsu J‐M, Lee Y‐CG, Yu C‐TR, Huang C‐YF. Fbx7 functions in the SCF complex regulating Cdk1‐cyclin B‐phosphorylated hepatoma up‐regulated protein (HURP) proteolysis by a proline‐rich region. J Biol Chem. 2004;279(31):32592‐32602. [DOI] [PubMed] [Google Scholar]
- 52. Gomez CR, Kosari F, Munz J‐M, et al. Prognostic value of discs large homolog 7 transcript levels in prostate cancer. PLoS One. 2013;8(12):e82833. [DOI] [PMC free article] [PubMed] [Google Scholar]
- 53. Wordeman L. How kinesin motor proteins drive mitotic spindle function: lessons from molecular assays. Semin Cell Dev Biol. 2010;21(3):260‐268. [DOI] [PMC free article] [PubMed] [Google Scholar]
- 54. Liu X, Gong H, Huang K. Oncogenic role of kinesin proteins and targeting kinesin therapy. Cancer Sci. 2013;104(6):651‐656. [DOI] [PMC free article] [PubMed] [Google Scholar]
- 55. Liu M, Wang X, Yang Y, et al. Ectopic expression of the microtubule‐dependent motor protein Eg5 promotes pancreatic tumourigenesis. J Pathol. 2010;221(2):221‐228. [DOI] [PubMed] [Google Scholar]
- 56. Yan G‐R, Zou F‐Y, Dang B‐L, et al. Genistein‐induced mitotic arrest of gastric cancer cells by downregulating KIF20A, a proteomics study. Proteomics. 2012;12(14):2391‐2399. [DOI] [PubMed] [Google Scholar]
- 57. Finelli P, Sirchia SM, Masciadri M, et al. Juxtaposition of heterochromatic and euchromatic regions by chromosomal translocation mediates a heterochromatic long‐range position effect associated with a severe neurological phenotype. Mol Cytogenet. 2012;5:16. [DOI] [PMC free article] [PubMed] [Google Scholar]
- 58. Asano E, Hasegawa H, Hyodo T, et al. The Aurora‐B‐mediated phosphorylation of SHCBP1 regulates cytokinetic furrow ingression. J Cell Sci. 2013;126(Pt 15):3263‐3270. [DOI] [PubMed] [Google Scholar]
- 59. Tao H‐C, Wang H‐X, Dai M, et al. Targeting SHCBP1 inhibits cell proliferation in human hepatocellular carcinoma cells. Asian Pac J Cancer Prev. 2013;14(10):5645‐5650. [DOI] [PubMed] [Google Scholar]
- 60. Pan H‐W, Chou H‐YE, Liu S‐H, Peng S‐Y, Liu C‐L, Hsu H‐C. Role of L2DTL, cell cycle‐regulated nuclear and centrosome protein, in aggressive hepatocellular carcinoma. Cell Cycle. 2006;5(22):2676‐2687. [DOI] [PubMed] [Google Scholar]
- 61. Banks D, Wu M, Higa LA, et al. L2DTL/CDT2 and PCNA interact with p53 and regulate p53 polyubiquitination and protein stability through MDM2 and CUL4A/DDB1 complexes. Cell Cycle. 2006;5(15):1719‐1729. [DOI] [PubMed] [Google Scholar]
- 62. Ueki T, Nishidate T, Park JH, et al. Involvement of elevated expression of multiple cell‐cycle regulator, DTL/RAMP (denticleless/RA‐regulated nuclear matrix associated protein), in the growth of breast cancer cells. Oncogene. 2008;27(43):5672‐5683. [DOI] [PubMed] [Google Scholar]
- 63. Gaudet S, Branton D, Lue RA. Characterization of PDZ‐binding kinase, a mitotic kinase. Proc Natl Acad Sci U S A. 2000;97(10):5167‐5172. [DOI] [PMC free article] [PubMed] [Google Scholar]
- 64. Ikeda Y, Park J‐H, Miyamoto T, et al. T‐LAK cell‐originated protein kinase (TOPK) as a prognostic factor and a potential therapeutic target in ovarian cancer. Clin Cancer Res. 2016;22(24):6110‐6117. [DOI] [PubMed] [Google Scholar]
- 65. Hinzman CP, Aljehane L, Brown‐Clay JD, et al. Aberrant expression of PDZ‐binding kinase/T‐LAK cell‐originated protein kinase modulates the invasive ability of human pancreatic cancer cells via the stabilization of oncoprotein c‐MYC. Carcinogenesis. 2018;39(12):1548‐1559. [DOI] [PubMed] [Google Scholar]
- 66. Shih M‐C, Chen J‐Y, Wu Y‐C, et al. TOPK/PBK promotes cell migration via modulation of the PI3K/PTEN/AKT pathway and is associated with poor prognosis in lung cancer. Oncogene. 2012;31(19):2389‐2400. [DOI] [PubMed] [Google Scholar]
- 67. Fu D, Li J, Wei J, et al. HMGB2 is associated with malignancy and regulates Warburg effect by targeting LDHB and FBP1 in breast cancer. Cell Commun Signal. 2018;16(1):8. [DOI] [PMC free article] [PubMed] [Google Scholar]
- 68. Piao J, Zhu L, Sun J, et al. High expression of CDK1 and BUB1 predicts poor prognosis of pancreatic ductal adenocarcinoma. Gene. 2019;701:15‐22. [DOI] [PubMed] [Google Scholar]
- 69. Hsu C‐C, Liao W‐Y, Chan T‐S, et al. The differential distributions of ASPM isoforms and their roles in Wnt signaling, cell cycle progression, and pancreatic cancer prognosis. J Pathol. 2019;249(4):498‐508. [DOI] [PMC free article] [PubMed] [Google Scholar]
- 70. Yang C, Hu J‐F, Zhan Q, et al. SHCBP1 interacting with EOGT enhances O‐GlcNAcylation of NOTCH1 and promotes the development of pancreatic cancer. Genomics. 2021;113(2):827‐842. [DOI] [PubMed] [Google Scholar]
Associated Data
This section collects any data citations, data availability statements, or supplementary materials included in this article.
Supplementary Materials
Table S1
Data Availability Statement
The raw data supporting the conclusions of this article will be made available by the authors, without undue reservation.


