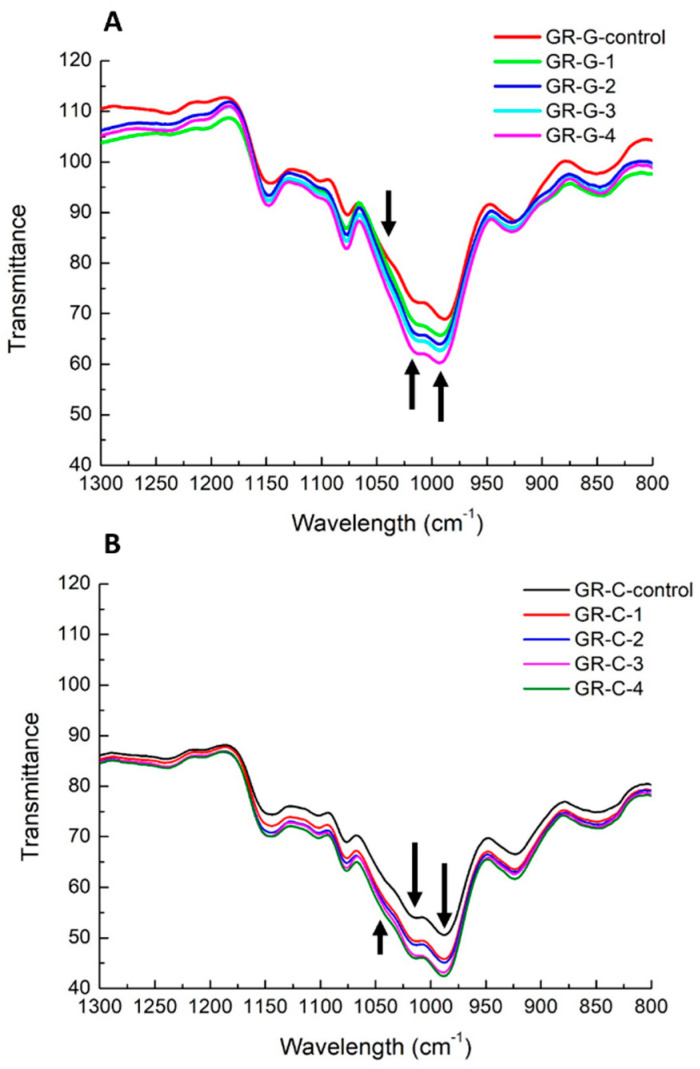
Figure 6.
Overlay FTIR spectra of control glutinous rice gel (A) sample (GR-G-control) and control sweetened glutinous rice cake (B) sample (GR-C-control) and rice samples with 100 (GR-G-1, GR-C-1), 200 (GR-G-2, GR-C-2), 300 (GR-G-3, GR-C-3) and 400 (GR-G-4, GR-C-4) pulses of PEF treatment at 3 kV/cm after 14 days of storage at 4 °C at the regions of 1300–800 cm−1. Arrows indicate the peaks at the wavelength of 995, 1022 and 1047 cm−1 respectively.

