

Abstract
Background/Aim
A randomized clinical trial with a starch‐ and sucrose‐reduced diet (SSRD) in irritable bowel syndrome (IBS) patients has shown clear improvement of participants' symptoms. The present study aimed to explore the effects of the SSRD on the gut microbiota and circulating micro‐RNA in relation to nutrient intake and gastrointestinal symptoms.
Methods
IBS patients were randomized to a 4‐week SSRD intervention (n = 80) or control group (n = 25); habitual diet). At baseline and 4 weeks, blood and fecal samples, 4 day‐dietary records, and symptom questionnaires were collected, that is, Rome IV questionnaires, IBS‐symptom severity score (IBS‐SSS) and visual analog scale for IBS (VAS‐IBS). Micro‐RNA was analyzed in blood and microbiota in faeces by 16S rRNA from regions V1–V2.
Results
The alpha diversity was unaffected, whereas beta diversity was decreased (p < 0.001) along with increased abundance of Proteobacteria (p = 0.0036) and decreased abundance of Bacteroidetes phyla (p < 0.001) in the intervention group at 4 weeks. Few changes were noted in the controls. The shift in beta diversity and phyla abundance correlated with decreased intakes of carbohydrates, disaccharides, and starch and increased fat and protein intakes. Proteobacteria abundance also correlated positively (R 2 = 0.07, p = 0.0016), and Bacteroidetes negatively (R 2 = 0.07, p = 0.0017), with reduced total IBS‐SSS. Specific genera, for example, Eubacterium eligens, Lachnospiraceae UCG‐001, Victivallis, and Lachnospira increased significantly in the intervention group (p < 0.001 for all), whereas Marvinbryantia, DTU089 (Ruminoccocaceae family), Enterorhabdus, and Olsenella decreased, together with changes in amplicon sequence variant (ASV) levels. Modest changes of genus and ASV abundance were observed in the control group. No changes were observed in micro‐RNA expression in either group.
Conclusion
The SSRD induced a shift in beta diversity along with several bacteria at different levels, associated with changes in nutrient intakes and reduced gastrointestinal symptoms. No corresponding changes were observed in the control group. Neither the nutrient intake nor the microbiota changes affected micro‐RNA expression.
The study was registered at ClinicalTrials.gov data base (NCT03306381).
Keywords: gastrointestinal symptoms, gut microbiota, irritable bowel syndrome, micro‐RNA, starch‐ and sucrose‐reduced diet
Key summary.
Current knowledge about this subject
Irritable bowel syndrome (IBS) is characterized by abdominal pain and altered bowel habits.
Food often exaggerates the symptoms.
Functional variants of sucrase–isomaltase genes have been found in IBS patients.
Reduction of gastrointestinal and extra‐intestinal symptoms in IBS have been found after reduction of starch and sucrose content.
What is new in this study
The shift in beta diversity and phyla abundance correlated with decreased intakes of carbohydrates, disaccharides, and starch and increased fat and protein intakes.
Proteobacteria abundance correlated positively, and bacteroidetes negatively, with reduced total gastrointestinal symptoms.
No changes were observed in micro‐RNA expression after the dietary intervention.
INTRODUCTION
Irritable bowel syndrome (IBS) is characterized by abdominal pain and altered bowel habits. The pooled world‐wide prevalence of IBS is 4.1% (range 1.3%–7.6% depending on country) according to the Rome IV criteria. 1 , 2 The etiology is supposed to be multifactorial. Notably, 62%–90% of IBS patients report exacerbation of gastrointestinal (GI) symptoms upon intake of specific foods. 3 However, 25%–50% of IBS patients do not experience improvement in symptoms when following evidence‐based dietary guidelines. 4 Recently, functional variants of the sucrase–isomaltase (SI) gene was found in high prevalence in IBS patients, 5 and reduction of starch and sucrose led to improvement of GI symptoms. 6
Meta‐analysis of gut microbiota in IBS show inconsistent results, but lower beta diversity, and reduced abundance of Bacteroidetes, Lactobacillus and Bifidobacterium, and higher abundance of Proteobacteria, are described. 7 , 8 , 9 Altered gut microbiota may compromise intestinal permeability, causing low‐grade mucosal inflammation and disturbances in the gut‐brain axis. 10 Micro‐RNAs (miRNA) are small noncoding RNAs that regulate gene expression at the post‐transcriptional level. 11 miRNAs have been suspected to be of importance for the pathophysiology of several gastrointestinal diseases, for example, IBS, although studies of various designs show differing results. 12 , 13 Both gut microbiota and epigenetic mechanisms are affected by environmental and dietary factors. 12 , 14 , 15 , 16 Reduction of Fermentable Oligo‐, Di‐ and Monosaccharide And Polyol (FODMAP) in IBS patients caused decreased abundance of Actinobacteria, 17 and IBS patients on exclusion diets showed greater abundance of Lachnospira and lower abundance of Eubacterium. 18
This study aimed to explore the effects of a starch‐ and sucrose‐reduced diet (SSRD) on gut microbiota and miRNA composition in IBS, in relation to nutrient intake and GI symptoms.
METHODS
Study design and subjects
IBS patients were identified from primary care centers (PCC) and the Department of Gastroenterology, Skåne University Hospital, Malmö. Patients were contacted by mail and telephone (Figure S1). 6 , 19 A total of 105 IBS patients were enrolled in the 4‐week SSRD study and randomized to either the intervention (n = 80) or control group (n = 25). Dietary advice was provided according to guidelines for patients with congenital sucrase–isomaltase deficiency (CSID). 20 Controls were instructed to maintain their ordinary eating habits. Blood and fecal samples for analyses of miRNA and microbiota were collected at baseline and end of the study, along with questionnaires and 4‐day food registrations (Figure S1).
The starch‐ and sucrose‐reduced diet
The dietary advice given focused on starch and sucrose reduction, with decreased intake of foods such as confectionary, soda, and processed foods and increased intake of other carbohydrates, fiber, fat, and protein in the form of all meats and fish, natural dairy products, eggs, nuts, seeds and selected berries, fruits, legumes and vegetables low in starch and sucrose (Tables S1 and S2). Participants were allowed one serving per day of whole‐grain bread or oatmeal porridge.
Diet recording and questionnaires
Participants reported amount and/or volume of all consumed foods for 4 consecutive days at baseline day 7–10 and at day 25–28 of the intervention, including the percentage of fat in dairy products, fiber in bread products, cacao in chocolate, information on the type of soda (sugar‐free or regular) consumed, and product manufacturer when applicable. Nutrient intake in amount and energy percentages (E%) was calculated from a single day (day 2) of the 4‐day registrations by a nutritionist, using the AIVO Diet computer program. 21
A study questionnaire covering sociodemography, lifestyle habits, medical history, and drug consumption were completed. To register GI symptoms, the Rome IV questionnaire, 22 the irritable bowel syndrome‐symptom severity score (IBS‐SSS), 23 and the visual analog scale for irritable bowel syndrome (VAS‐IBS) 24 were completed before and after the study.
Fecal microbiota analyses
Feces was collected at home in sterile tubes (Sarstedt), stored in the deep‐freezer until delivery to the hospital, then stored at −80°C until analyzed at the Institute of Clinical Molecular Biology, Christian‐Albrechts‐University, Kiel, Germany. DNA was extracted using the QIAamp DNA stool mini kit automated on the QIAcube. Approximately 200 mg stool was transferred to 0.70 mm Garnet Bead tubes filled with 1.1 ml ASL lysis buffer (containing Proteinase K). Subsequently, bead beating was performed using the SpeedMill PLUS for 45 s at 50 Hz. Samples were then heated to 95°C for 5 min. Contaminants were removed as DNA bound specifically to the QIAamp silica‐gel membrane. The combined action of InhibitEX, a unique adsorption resin, and an optimized buffer was used for removal of PCR inhibitors. Approximate DNA amount ranged between 10 and 40 μg/sample.
Variable regions V1 and V2 of the 16S rRNA gene were amplified using the primer pair 27F‐338 R in a dual‐barcoding approach according to Caporaso et al. 25 Three μl of 1:10 diluted DNA was used for amplification. PCR‐products were verified through electrophoresis in agarose gel. PCR products were normalized using the SequalPrep Normalization Plate Kit (Thermo Fischer Scientific), pooled equimolarily, and sequenced on the Illumina MiSeq v3 2 × 300 bp (Illumina Inc.). Demultiplexing after sequencing was based on 0 mismatches in the barcode sequences. Forward and reverse reads were merged using the FLASH software, allowing an overlap of the reads between 250 and 300 bp. 26 Data was filtered by removing low‐quality sequences (Q‐score < 30) in less than 95% of the nucleotides. Chimeras were removed with UCHIME and 10,000 reads for each sample were randomly selected. 27
Blood miRNA analyses
Blood was sampled (PAXgene® Blood RNA Tube, BD Biosciences) and analyzed at the Institute of Clinical Molecular Biology, Christian‐Albrechts‐University. Total RNA input quality was evaluated on a TapeStation 4200 (Agilent). Most samples had a RIN score >8. Samples were quantified with a fluorometric dye (Quant‐IT, thermofisher) and 200 ng per sample were used as input for the NEXTFLEX Small RNA‐Seq Kit v3 (PerkinElmer) according to manufacturer's instructions in a gel‐free workflow. Resulting libraries were sequenced on an Illumina HiSeq 3000 (Illumina) with 50 bp single‐read sequencing (24 samples per lane).
Statistical analyses
Basal characteristics were calculated by SPSS, version 25, using Mann–Whitney U test or Fisher's exact test. The demultiplexed 16S samples from MiSeq were processed mainly with QIIME2 (v.2018.11) 1. Within QIIME2, DADA2 2 was used to predict the amplicon sequence variants (ASVs). Then, the taxonomy of those ASVs were predicted using VSEARCH 3 together with the SILVA (v. 132) database 4. The alpha‐ and beta diversity metrics for all samples were calculated within QIIME2. Further statistical analyses were performed using ‘phyloseq’ 5 and ‘vegan’ 6 packages in R. The differentially abundant ASVs in the different sample groups were calculated using DESeq2 7.
Two different alpha diversity measurements were used; the observed numbers of ASVs (Observed) and the Shannon‐Weiner index. The beta diversity was measured at ASV level using Bray‐Curtis method. Diversities were measured and visualized using the ‘phyloseq’ package. Wilcoxon t‐test of comparing means was applied to test the alpha diversity from different groups and PERMANOVA was applied to beta diversity.
The correlation between the continuous physiological factors of the samples to the beta diversity and phylum abundance were calculated using the ‘envfit’ function in the ‘vegan’ package. The PERMANOVA analysis of the categorical variables on the beta diversity were performed using the ‘adonis’ function in the ‘vegan’ package.
The miRNA sequences obtained from the sequencing facility were mainly processed through the ‘smrnaseq (v1.0.0)’ pipeline from the ‘nf‐core’ framework 28 at NGI, SciLifeLab, Sweden. In brief, the raw sequences were processed for quality trimming using Cutadapt (v3.4) 29 and the reads were then mapped to the miRNA database miRBase (v 22.1) 30 using bowtie2 (v1.3.0). 31 The counts of these miRNAs were used for the downstream analysis. From raw counts, lower count miRNAs were filtered with the following thresholds: ≥5 reads mapped for each specific miRNA in ≥5 samples. This filtered dataset was transformed with VST using DESeq2 (v1.32.0). 32 The pair‐wise sample distances were calculated from the transformed data and visualized in PCA. The statistical significance of the different factors of the samples on the distribution of miRNA abundances was calculated by PERMANOVA using the ‘adonis()’ function from the ‘vegan’ R package. Similar calculations were performed within control and intervention groups from the filtered miRNA dataset.
RESULTS
Participant characteristics
From the 105 IBS patients, two patients from the intervention group were excluded due to missing fecal samples at baseline. For the remaining 103 patients, the median age was 46 (33–57) years and the median body mass index (BMI) was 24.2 (22.3–27.6) kg/m2 (range 16.0–39.8 kg/m2). The control group had a lower median age and weight, a lower frequency of full‐time employment, and higher smoking frequency than the intervention group. The groups did not differ significantly in terms of sex, BMI, IBS disease duration, IBS subgroup distribution, level of physical activity, or antibiotic use prior to and during the study (Table 1). One participant in each group ate probiotics.
TABLE 1.
Participant characteristics
| All patients n = 103 | Intervention n = 78 | Control n = 25 | p | |
|---|---|---|---|---|
| Age, years | 46 (33–57) | 48 (37–57) | 35 (29–50) | 0.028 |
| BMI, kg/m2 | 24.2 (22.3–27.6) | 24.6 (22.3–28.4) | 23.6 (21.4–26.5) | 0.180 |
| Missing value: 6 | ||||
| Weight, kg | 71 (63–82) | 72 (64–84) | 68 (57–75) | 0.037 |
| Missing value: 6 | ||||
| Female sex, n (%) | 81 (78.6) | 59 (75.6) | 22 (88.0) | 0.265 |
| Smoker, n (%) | 11 (11.0) | 5 (6.6) | 6 (24.0) | 0.033 |
| Missing value: 3 | ||||
| Disease duration, years | 17 (8.8–28) | 18 (8.0–28) | 11 (9.0–29) | 0.561 |
| Missing value: 17 | ||||
| Employment, n (%) | 0.049 | |||
| Missing value: 2 | ||||
| 100% | 51 (50.5) | 43 (56.6) | 8 (32.0) | |
| ≥50% | 64 (63.4) | 52 (68.4) | 12 (48.0) | |
| Subgroup, n (%) | 0.227 | |||
| Missing value: 2 | ||||
| IBS‐D | 26 (25.2) | 23 (29.5) | 3 (12.0) | |
| IBS‐M | 37 (35.9) | 29 (37.2) | 8 (32.0) | |
| IBS‐C | 19 (18.4) | 12 (15.4) | 7 (28.0) | |
| Unspecified IBS | 3 (2.9) | 2 (2.6) | 1 (4.0) | |
| Non‐IBS FGID | 16 (15.6) | 10 (12.8) | 6 (24.0) | |
| Physical activity, n (%) | 0.863 | |||
| Missing value: 2 | ||||
| None | 11 (10.9) | 9 (11.8) | 2 (8.0) | |
| <30 min/week | 24 (23.8) | 19 (25.0) | 5 (20.0) | |
| 30–60 min/week | 15 (14.6) | 11 (14.5) | 4 (16.0) | |
| 60–120 min/week | 25 (24.8) | 19 (25.0) | 6 (24.0) | |
| >120 min/week | 26 (25.7) | 18 (23.7) | 8 (32.0) | |
| Antibiotic use, n (%) | ||||
| 0–6 months before study | 15 (14.9) | 11 (14.5) | 4 (16.0) | 1.0 |
| Missing value: 2 | ||||
| During study | 4 (4.3) | 3 (4.2) | 1 (4.8) | 0.925 |
| Missing value: 10 |
Abbreviations: BMI, body mass index; FGID, functional gastrointestinal disorders; IBS, irritable bowel syndrome; IBS‐D, diarrhea‐predominant irritable bowel syndrome; IBS‐M, mixed IBS; IBS‐C, constipation‐predominant IBS.
Note: Values are presented as median and interquartile ranges (IQR) or number and percentage. Mann–Whitney U test or Fisher's exact test. p < 0.05 was considered statistically significant.
The most common comorbidities were allergy, hypothyroid disease, asthma, depression, hypertension, and migraine. Frequent drug treatments included antidepressants, levothyroxine, laxatives, proton pump inhibitors, and vitamin D (Table S3).
Gastrointestinal symptoms and dietary intake
Gastrointestinal symptoms and dietary intake were equal in both groups at baseline and symptoms were higher than in healthy volunteers (Table S4 and S5). 33 In the intervention group, 73.1% were classified as responders (decrease in total IBS‐SSS≥50 points) and 28.2% did not fulfill the Rome criteria for FGID/IBS at 4 weeks, as compared to 24% and 0%, respectively, in the control group (p < 0.001). Complete absence of GI symptoms (<75 in total IBS‐SSS) was seen in 19.2% of the intervention group. Compared to controls, the intervention group showed decreased intake of carbohydrates, starch, sucrose, and disaccharides and increased energy percentages of protein and fat at 4 weeks (Table S5).
Overall microbiota assessment
In total, ∼5.8 million paired‐end sequence reads were trimmed for quality to end up with ∼5.2 million paired‐end reads. The blank and mock‐community samples were also used as controls to this experiment. There were in total 4220 ASVs comprising 172 different genera in 13 different phyla from 198 samples.
Alpha‐ and beta diversity
Alpha diversity indices at the genus level were not significantly different between groups at baseline or at 4 weeks (baseline: p = 0.43 for both measurements; 4 weeks: p = 0.65 and p = 0.19 for Observed ASVs and Shannon Weiner's index, respectively; Figure 1a,b), with no significant changes in alpha diversity in either group (p ≥ 0.44).
FIGURE 1.
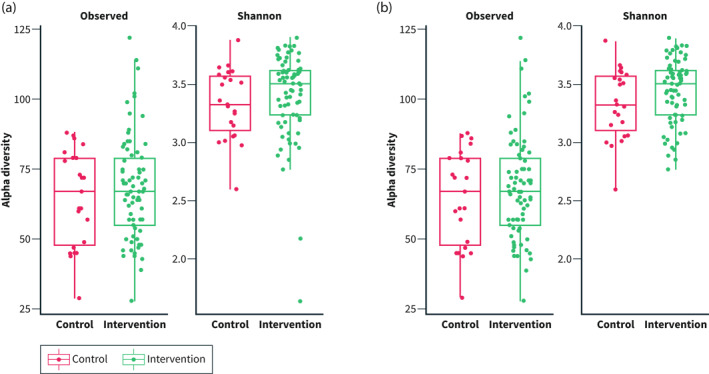
Alpha diversity indices (Observed amplicon sequence variants and Shannon‐Weiner) in the intervention versus control group. (a) Before the study (T0) and (b) After the study (T1)
Beta diversity differed between groups already at baseline (p < 0.01) but shifted significantly only in the intervention group (p < 0.001), and not in controls (p = 0.99; Figure 2a,b). Weak correlations were identified between beta diversity and decreased intake of g carbohydrates (r 2 = 0.049, p = 0.028), g disaccharides (r 2 = 0.058, p = 0.014), g starch (r 2 = 0.068, p = 0.013), E% starch (r 2 = 0.045, p = 0.025), and g sucrose (r 2 = 0.033, p = 0.089), and increased E% protein intake (r 2 = 0.066, p = 0.009), in the intervention group (Figure 2b). No correlations could be identified between changes in beta diversity and total IBS‐SSS or individual GI symptom scores (data not shown).
FIGURE 2.
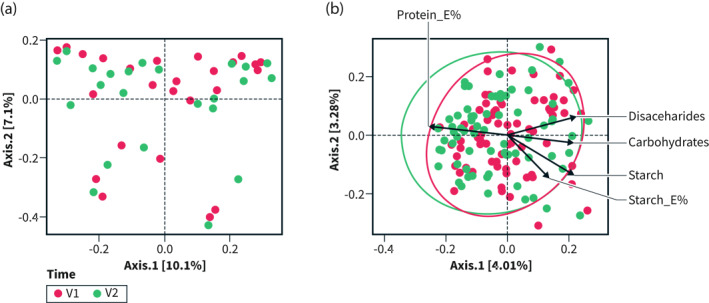
PCA plot of beta diversity at baseline (T0) and 4 weeks (T1) in (a) the control group and (b) the intervention group. E% = energy percent. PCA biplot showing delta nutrient variables (arrows) significantly correlated to the community composition of each participant in the intervention group (b) (through ‘envfit()’). Ellipses show the distribution of the samples according to time‐point (V1 = baseline; V2 = 4 weeks). The variance of the variables is approximated by arrow length, and their correlations by the angles between them. Observations with similar PCA component score correspond to proximity between individual points. The biplot shows that community composition correlated with self‐reported changes in nutrient intakes of disaccharides (g), carbohydrates (g), starch (g and E%) and protein (E%) (p < 0.05 for all, and p < 0.01 for protein). Further, changes in disaccharides, carbohydrates and starch are shown to be positively correlated to each other, while negatively correlated to change in protein E%
PERMANOVA analysis showed no influence of sex (p = 0.65), marital/cohabitation status (p = 0.28), educational level (p = 0.25), employment (p = 0.71), or the usage of antibiotics (up to 6 months before the study; p = 0.54) on beta diversity at baseline (all patients). Smoking alone marginally affected (p = 0.059) the beta diversity at baseline. Antibiotic use during the study did not influence beta diversity at 4 weeks (p = 0.41).
Taxonomy measures
Phylum level
Thirteen different phyla were identified, that is, Actinobacteria, Bacteroidetes, Cyanobacteria, Elusimicrobia, Epsilonbacteraeota, Firmicutes, Fusobacteria, Lentisphaerae, Patescibacteria Proteobacteria, Tenericutes, Verrumicrobia, and an unknown phylum (Table S6). There was a clear dominance of seven of these phyla in both groups (Figure 3). The most dominant phyla in the intervention and control group both before and after the SSRD trial were Bacteroidetes and Firmicutes (Figure 3, Table S6). There was an increase in Proteobacteria (p = 0.0036), Lentisphaere (p = 0.0038), Cyanobacteria (p = 0.038), and a decrease in Bacteroidetes (p < 0.001), in the intervention group during the trial, with a tendency of decrease in Actinobacteria (p = 0.075; Table S6). In the control group, Verrumicrobia tended to increase (p = 0.077). No other significant phyla changes occurred in either group (p ≥ 0.14 for all).
FIGURE 3.
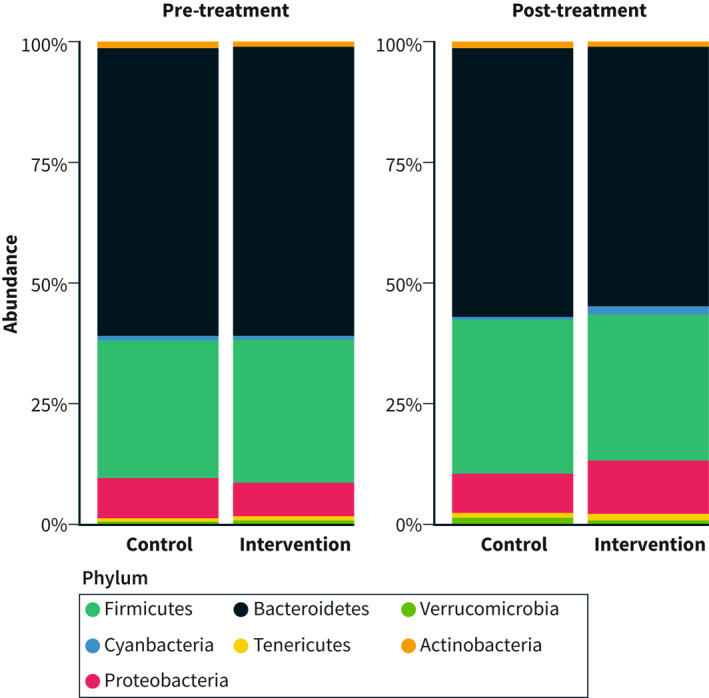
Relative abundance of phyla in the intervention and control group before and after the sucrose‐reduced diet intervention
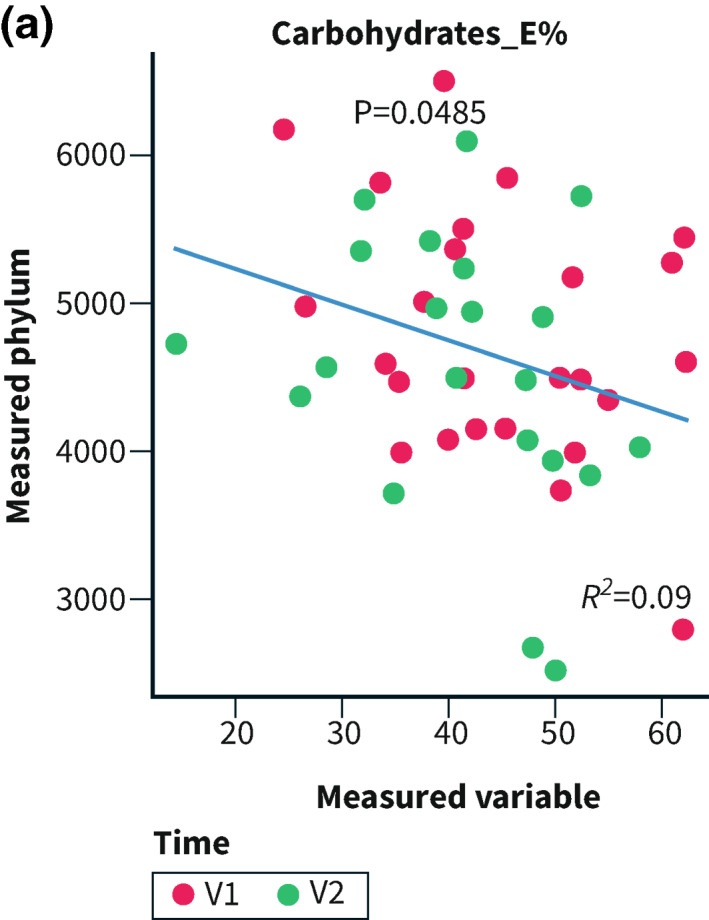
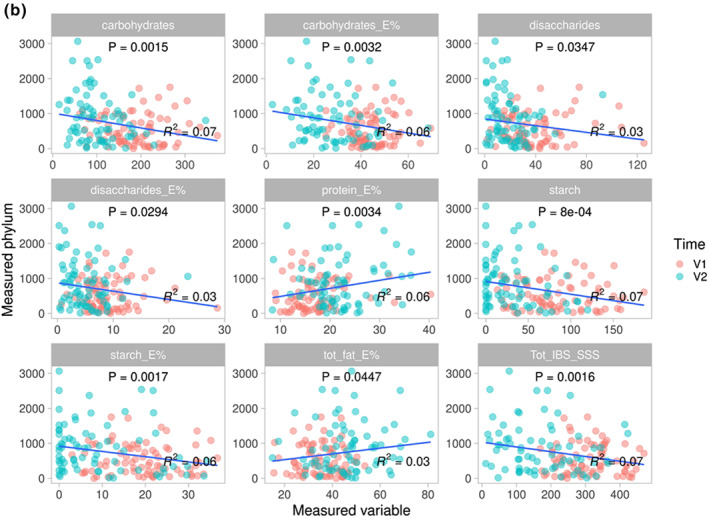
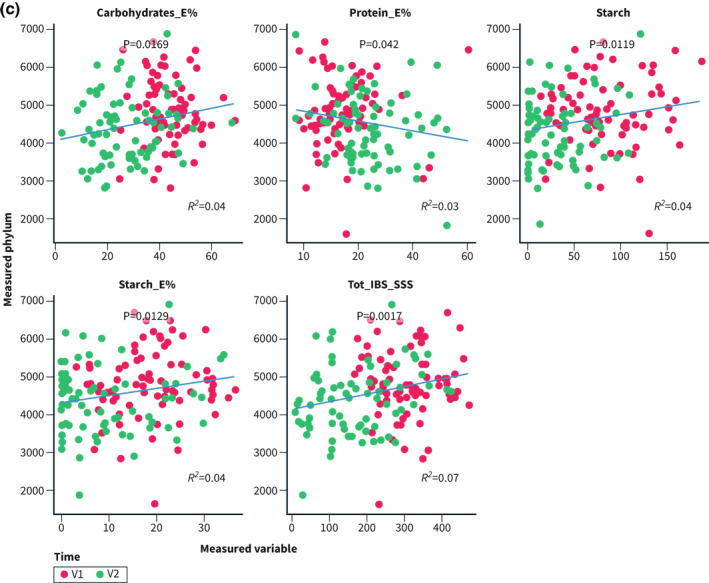
Correlations were performed for Bacteroidetes and Proteobacteria since they were the most abundant of the altered phyla. Bacteroidetes and E% of carbohydrates correlated in the controls (R 2 = 0.09; p = 0.048; Figure 4a). In the intervention group, the abundance of Proteobacteria correlated inversely with intake of carbohydrates, disaccharides, and starch, and positively with fat and protein, whereas Bacteroidetes correlated positively with carbohydrates and starch, and inversely with protein. The total IBS‐SSS correlated inversely with the abundance of Proteobacteria and positively with Bacteroidetes (Figure 4b,c).
FIGURE 4.
E% = energy percentage. Correlations between the abundance of Proteobacteria and Bacteroidetes and nutrients and total irritable bowel syndrome‐symptom severity score (IBS‐SSS) calculated through ‘envfit()’ within the control group (4a), and regarding Proteobacteria (4b) and Bacteroidetes (4c) in the intervention group. p < 0.05 was considered statistically significant
Genus level
In the intervention group, the abundance of Eubacterium eligens, Lachnospiraceae UCG‐001, Victivallis, Lachnospir, Negativibacillus, Eggerthella, Enterobacter and Eubacterium ruminantium increased (p < 0.001 for all), whereas Marvinbryantia, DTU089 (Ruminoccocaceae family), Enterorhabdus, Olsenella, Acidaminococcus, Slackia, Catenibacterium, and an uncultured bacterium decreased (Figure 5b). In the control group, the genera of Vellionella and Faecalitalea decreased significantly (Figure 5a).
FIGURE 5.
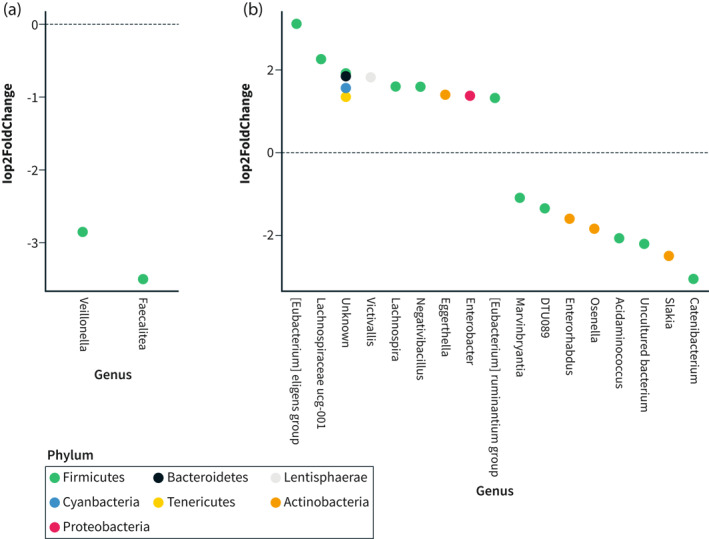
Differential abundance of genera (baseline to 4 weeks) in (a) The control group and (b) The intervention group
ASV level
Out of all ASVs analyzed, 183 changed significantly in the intervention group during the dietary trial (Figure S2 and Supporting Information S2). These differentially abundant ASVs constituted around 18% and 22% of the whole community at baseline and 4 weeks, respectively, and belonged mainly to the Bacteroidetes or Firmicutes phyla. Although almost all ASVs could be annotated to a genus, species annotation of ASVs was not possible due to the analysis method used.
miRNA measures
The miRNA expression did not differ between the intervention or control group (p = 0.462), or between baseline and 4 weeks in the intervention (p = 0.863) or control group (p = 0.418; Figure 6a,b). When examining specific miRNA, no changes could be found in either group (data not shown).
FIGURE 6.
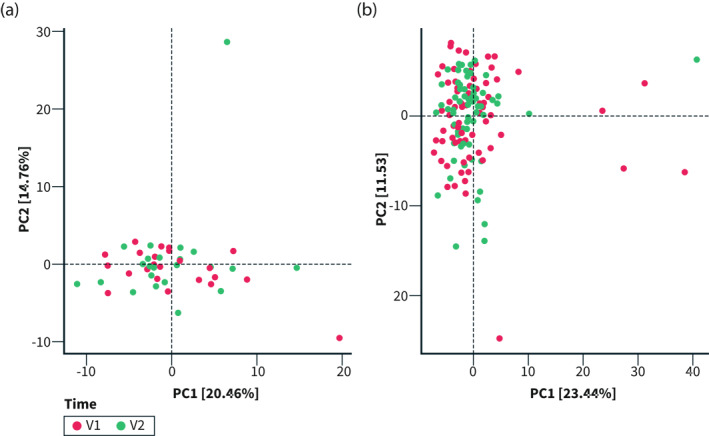
PCA plot of miRNA expression at baseline (T0) and 4 weeks (T1) in (a) the control group and (b) the intervention group. PCA biplot showing the miRNA expression of each participant in the intervention group (b). V1 = baseline; V2 = 4 weeks p > 0.05 for all
DISCUSSION
The SSRD intervention altered gut microbiota with a shift in beta diversity and changes in the abundance of bacteria at the phylum, genus and ASV levels, whereas it did not affect circulating miRNA expression. The alterations correlated with reduced GI symptoms, decreased carbohydrate, disaccharide, and starch intakes and increased protein and fat intakes.
Although great inconsistencies between studies, IBS has been associated with decreased beta diversity, increased Firmicutes‐to‐Bacteroidetes‐ratio, decreased Bacteroidetes, and increased Protebacteria. 7 , 8 Still, improved GI symptoms correlated with decreased Bacteroidetes and increased Proteobacteria in the current study. Cross‐sectional studies do not reflect causality and may hypothetically reflect secondary, compensatory mechanisms to reduce symptoms.
The gut microbiota, and the response to dietary modification, is unique in each individual with a great intra‐individual variation at different time points. 7 , 34 No healthy gut microbiota composition has so far been defined. 35 During the study, participants increased their intake frequency of dairy products, vegetables, fruits, whole‐grains, fish, and nuts with a decreased intake of sweets and cereals and shifted from regular soda to soda with artificial sweeteners. 19 Thus, they changed from a Western diet to a more Mediterranean‐like diet. Specific foods not estimated, that is, fructose, polysaccharides, resistant starch, and artificial sweeteners, may also have contributed to the changes. 17 , 36 , 37 Low FODMAP induced lower abundance of Actinobacteria. 17 Lower intake of polysaccharides has been related to a higher relative abundance of Proteobacteria and a tendency to lower Actinobacteria among healthy individuals on Mediterranean diet, 38 whereas higher intake of artificial sweeteners have been correlated with Actinobacteria. 39 In animal trials, Western diet increased the abundance of Bacteroidetes and Mediterranean diet increased Proteobacteria abundance, with similar changes at genus levels as SSRD. 40 A phylum includes both potentially pathogenic and potentially health‐promoting genera and species, 41 and Proteobacteria is the most variable phylum. 42 Our observed decrease in the Bacteroidetes phylum, along with specific genus level within this phylum, could be related to increased consumption of fish, plant‐based foods, and nuts. 8 , 19 , 43 , 44 In contrast, increased glucose, fructose and saturated fat induced the same increase of Protebacteria and decrease of Bacteroidetes in mice as SSRD. 6 , 45 , 46 Inconsistency between studies may depend on confounders, for example, luminal pH is of crucial importance for the Bacteroidetes abundance; a factor seldom taken into account. 47
Lactobacillus and Bifidobacterium were not affected by the intervention. Several of the genera found increased after the present study have been related to the degradation of plant fibers. 48 Two genera from the Lachnospiraceae family, that is, Lachnospiraceae UCG‐001 and Lachnospira, increased in the intervention group. Accordingly, Lachnospira is strongly associated with vegetable diets, 18 , 49 and wholegrain‐rich diet and psyllium husk supplementation. 50 , 51 Lachnospiraceae UCG‐001 and Lachnospira were among 15 genera included in the model, which had an estimated 85% accuracy for determining intake of four foods, that is, avocado, almonds, walnuts and whole‐grain. 52 Blautia, belonging to the Lachnospiraceae family, has previously been found to be increased in those with self‐reported IBS compared with non‐IBS patients from the same geographic area. 53 In contrast, decrease of two Eubacterium genera was found in participants with exclusion/vegetarian diets. 18 However, E eligens share phylogenetic and phenotypic similarity with Lachnospira, and has been found to be increased after a Mediterranean intervention. 47 Both Lachnospiraceae and Eubacterium are considered as the next‐generation health‐promoting bacteria. 40 , 47
Although a few studies have shown that dietary patterns may affect DNA methylation, histone modification, 12 , 15 and miRNA expression, 16 no dietary intervention has to our knowledge examined the effect of a dietary change on miRNA expression in IBS. The unchanged plasma miRNA profile within the intervention group suggests that neither the SSRD nor the microbiota did affect the expression of miRNA. Though a close relation between plasma and stool expression of miRNA, 16 an effect on local miRNA cannot be excluded.
The main strength of this longitudinal study, with a documented high degree of compliance, 6 , 54 is its novelty as the effect of starch‐ and sucrose reduction on gut microbiota and miRNA expression in IBS has not been previously explored. The controlling for several confounders is another strength.
Limitations are that the nutrient calculations did not include fructose, lactose, and artificial sweeteners and that many of the differentially abundant ASVs could not be determined on the strain level, due to being unknown or uncultured bacteria. The study may have benefited from metagenomic analysis and functional profiling of ASVs. Further, transit time, luminal pH levels, mucosa sampling, or drug treatment were not considered. Since the original purpose of the study was to identify rare SI gene variants in IBS patients, recruiting a larger number of patients to the intervention group was prioritized, rendering a smaller control group. Further, a 4‐week follow‐up is rather short for a chronic disease, but often used in dietary studies to improve compliance to the advice. 4 , 17
CONCLUSION
The dietary modification of SSRD correlated with reduced beta diversity and increased abundance of Proteobacteria and reduced Bacteroidetes. The phylum levels also correlated with the reduced GI symptoms. Neither the changes in nutrient intake nor changes of gut microbiota did affect the miRNA expression.
CONFLICT OF INTEREST
There are no competing interests.
AUTHOR CONTRIBUTIONS
Clara Nilholm, Bodil Roth, Mauro D'Amato, and Bodil Ohlsson designed the study, performed and analyzed the tests and contributed to data entry. Clara Nilholm, Lokeshwaran Manoharan, and Bodil Ohlsson performed the statistical analysis. Clara Nilholm and Bodil Ohlsson drafted the manuscript with contributions from Lokeshwaran Manoharan, Bodil Roth, and Mauro D'Amato. All authors approved the final version of the manuscript.
ETHICS STATEMENT
This study was performed in accordance with the declaration of Helsinki and approved by the Ethical Review Board of Lund University (2017/171, date of approval: 27/04/2017 and 2017/810, date of approval: 16/10/2017). All subjects gave their written, informed consent before inclusion. The study was registered at ClinicalTrials.gov data base (NCT03306381).
INFORMED CONSENT
All participants submitted oral and written informed consent.
Supporting information
Supporting Information S1
Supporting Information S2
ACKNOWLEDGEMENTS
We want to acknowledge the patients enrolled in the study for participating in our trial. We also want to acknowledge the dietician, Ewa Larsson. This study was conducted by grants from the Development Foundation of Region Skane, Dr Per Håkansson Foundation, Dir Albert Påhlsson Foundation and Skåne University Hospital Foundation. The data and computations were handled by resources provided by the Swedish National Infrastructure for Computing (SNIC) at UPPMAX, partially funded by the Swedish Research Council through grant agreement no. 2018‐05973.
Nilholm C, Manoharan L, Roth B, D’Amato M, Ohlsson B. A starch‐ and sucrose‐reduced dietary intervention in irritable bowel syndrome patients produced a shift in gut microbiota composition along with changes in phylum, genus, and amplicon sequence variant abundances, without affecting the micro‐RNA levels. United European Gastroenterol J. 2022;10(4):363–75. 10.1002/ueg2.12227
DATA AVAILABILITY STATEMENT
The data that support the findings of this study are available on request from the corresponding author. The data are not publicly available due to privacy or ethical restrictions.
REFERENCES
- 1. Sperber AD, Dumitrascu D, Fukudo S, Gerson C, Ghoshal UC, Gwee KA, et al. The global prevalence of IBS in adults remains elusive due to the heterogeneity of studies: a Rome Foundation working team literature review. Gut. 2017;66(6):1075–1082. [DOI] [PubMed] [Google Scholar]
- 2. Sperber AD, Bangdiwala SI, Drossman DA, Ghoshal UC, Simren M, Tack J, et al. Worldwide prevalence and burden of functional gastrointestinal disorders, results of Rome foundation global study. Gastroenterology. 2021;160(1):99–114. [DOI] [PubMed] [Google Scholar]
- 3. Hayes PA, Fraher MH, Quigley EM. Irritable bowel syndrome: the role of food in pathogenesis and management. Gastroenterol Hepatol. 2014;10(3):164–74. [PMC free article] [PubMed] [Google Scholar]
- 4. Mitchell H, Porter J, Gibson PR, Barrett J, Garg M. Review article: implementation of a diet low in FODMAPs for patients with irritable bowel syndrome‐directions for future research. Aliment Pharmacol Ther. 2019;49(2):124–39. [DOI] [PubMed] [Google Scholar]
- 5. Garcia‐Etxebarria K, Zheng T, Bonfiglio F, Bujanda L, Dlugosz A, Lindberg G, et al. Increased prevalence of rare sucrase–isomaltase (SI) pathogenic variants in irritable bowel syndrome. Clin Gastroenterol Hepatol. 2018;16:1673–1676. [DOI] [PMC free article] [PubMed] [Google Scholar]
- 6. Nilholm C, Larsson E, Sonestedt E, Roth B, Ohlsson B. Assessment of a 4‐week starch‐ and sucrose‐reduced diet and its effects on gastrointestinal symptoms and inflammatory parameters among patients with irritable bowel syndrome. Nutrients. 2021;13(2):416. [DOI] [PMC free article] [PubMed] [Google Scholar]
- 7. Duan R, Zhu S, Wang B, Duan L. Alterations of gut microbiota in patients with irritable bowel syndrome based on 16S rRNA‐targeted sequencing: a systematic review. Clin Transl Gastroenterol. 2019;10(2):e00012. [DOI] [PMC free article] [PubMed] [Google Scholar]
- 8. Rinninella E, Raoul P, Cintoni M, Franceschi F, Miggiano GAD, Gasbarrini A, et al. What is the healthy gut microbiota composition? A changing ecosystem across age, environment, diet, and diseases. Microorganisms. 2019;7(1):14. [DOI] [PMC free article] [PubMed] [Google Scholar]
- 9. Wang L, Alammar N, Singh R, Nanavati J, Song Y, Chaudhary R, et al. Gut microbial dysbiosis in the irritable bowel syndrome: a systematic review and meta‐analysis of case‐control studies. J Acad Nutr Diet. 2020;120(4):565–586. [DOI] [PubMed] [Google Scholar]
- 10. Chong PP, Chin VK, Looi CY, Wong WF, Madhavan P, Yong VC. The microbiome and irritable bowel syndrome ‐ a review on the pathophysiology, current research and future therapy. Front Microbiol. 2019;10:1136. [DOI] [PMC free article] [PubMed] [Google Scholar]
- 11. Fabian MR, Sonenberg N, Filipowicz W. Regulation of mRNA translation and stability by microRNAs. Annu Rev Biochem. 2010;79:351–379. [DOI] [PubMed] [Google Scholar]
- 12. Mahurkar‐Joshi S, Chang L. Epigenetic mechanisms in irritable bowel syndrome. Front Psychiatr. 2020;11:805. [DOI] [PMC free article] [PubMed] [Google Scholar]
- 13. Mahurkar‐Joshi S, Rankin CR, Videlock EJ, Soroosh A, Verma A, Khandadash A, et al. The colonic mucosal MicroRNAs, MicroRNA‐219a‐5p, and MicroRNA‐338‐3p are downregulated in irritable bowel syndrome and are associated with barrier function and MAPK signaling. Gastroenterology. 2021;160(7):2409–22. [DOI] [PMC free article] [PubMed] [Google Scholar]
- 14. Gentile CL, Weir TL. The gut microbiota at the intersection of diet and human health. Science. 2018;362(6416):776–80. [DOI] [PubMed] [Google Scholar]
- 15. Romani M, Pistillo MP, Banelli B. Environmental epigenetics: crossroad between public health, lifestyle, and cancer prevention. Biomed Res Int. 2015;2015:587983. [DOI] [PMC free article] [PubMed] [Google Scholar]
- 16. Tarallo S, Pardini B, Mancuso G, Rosa F, Di Gaetano C, Rosina F, et al. MicroRNA expression in relation to different dietary habits: a comparison in stool and plasma samples. Mutagenesis. 2014;29(5):385–391. [DOI] [PubMed] [Google Scholar]
- 17. Wilson B, Rossi M, Kanno T, Parkes GC, Anderson S, Mason AJ, et al. β‐Galactooligosaccharide in conjunction with low FODMAP diet improves irritable bowel syndrome symptoms but reduces fecal bifidobacteria. Am J Gastroenterol. 2020;115(6):906–15. [DOI] [PubMed] [Google Scholar]
- 18. Lenhart A, Dong T, Joshi S, Jaffe N, Choo C, Liu C, et al. Effect of exclusion diets on symptom severity and the gut microbiota in patients with irritable bowel syndrome. Clin Gastroenterol Hepatol. 2021;20(3):e465–83. [DOI] [PMC free article] [PubMed] [Google Scholar]
- 19. Nilholm C, Larsson E, Roth B, Gustafsson R, Ohlsson B. Irregular dietary habits with a high intake of cereals and sweets are associated with more severe gastrointestinal symptoms in IBS patients. Nutrients. 2019;11(6):1279. [DOI] [PMC free article] [PubMed] [Google Scholar]
- 20. QoL Medical . Choosing your foods—a basic dietary guide for people with CSID. 2021. https://www.sucroseintolerance.com/choosing‐your‐foods [Google Scholar]
- 21. Mashie FoodTech solutions . The AIVO diet computer program. 2021. https://www.matildafoodtech.com/page/aivo [Google Scholar]
- 22. Palsson OS, Whitehead WE, van Tilburg MA, Chang L, Chey W, Crowell MD, et al. Rome IV diagnostic questionnaires and Tables for investigators and clinicians. Gastroenterology. 2016;S0016‐5085(16)00180‐3. [DOI] [PubMed] [Google Scholar]
- 23. Francis CY, Morris J, Whorwell PJ. The irritable bowel severity scoring system: a simple method of monitoring irritable bowel syndrome and its progress. Aliment Pharmacol Ther. 1997;11(2):395–402. [DOI] [PubMed] [Google Scholar]
- 24. Bengtsson M, Ohlsson B, Ulander K. Development and psychometric testing of the visual analogue scale for irritable bowel syndrome (VAS‐IBS). BMC Gastroenterol. 2007;7(1):1–10. [DOI] [PMC free article] [PubMed] [Google Scholar]
- 25. Caporaso JG, Lauber CL, Walters WA, Berg‐Lyons D, Huntley J, Fierer N, et al. Ultra‐high‐throughput microbial community analysis on the Illumina HiSeq and MiSeq platforms. ISME J. 2012;6(8):1621–4. [DOI] [PMC free article] [PubMed] [Google Scholar]
- 26. Magoč T, Salzberg SLF. Fast length adjustment of short reads to improve genome assemblies. Bioinformatics. 2011;27(21):2957–63. [DOI] [PMC free article] [PubMed] [Google Scholar]
- 27. Edgar RC, Haas BJ, Clemente JC, Quince C, Knight R. UCHIME improves sensitivity and speed of chimera detection. Bioinformatics. 2011;27(16):2194–200. [DOI] [PMC free article] [PubMed] [Google Scholar]
- 28. Ewels PA, Peltzer A, Fillinger S, Patel H, Alneberg J, Wilm A, et al. The nf‐core framework for community‐curated bioinformatics pipelines. Nat Biotechnol. 2020;38(3):276–8. [DOI] [PubMed] [Google Scholar]
- 29. Martin M. CUTADAPT removes adapter sequences from high‐throughput sequencing reads. EMBnetjournal. 2011;2(1):10–2. [Google Scholar]
- 30. Kozomara A, Birgaoanu M, Griffiths‐Jones S. miRBase: from microRNA sequences to function. Nucleic Acids Res. 2019;47(D1):D155–62. [DOI] [PMC free article] [PubMed] [Google Scholar]
- 31. Langmead B, Trapnell C, Pop M, Salzberg SL. Ultrafast and memory‐efficient alignment of short DNA sequences to the human genome. Genome Biol. 2009;10(3):R25. [DOI] [PMC free article] [PubMed] [Google Scholar]
- 32. Love MI, Huber W, Anders S. Moderated estimation of fold change and dispersion for RNA‐seq data with DESeq2. Genome Biol. 2014;15(12):1–21. [DOI] [PMC free article] [PubMed] [Google Scholar]
- 33. Bengtsson M, Persson J, Sjölund K, Ohlsson B. Further validation of the visual analogue scale for irritable bowel syndrome after use in clinical practice. Gastroentreol Nurs. 2013;36:188–98. [DOI] [PubMed] [Google Scholar]
- 34. Li F, Hullar MA, Schwarz Y, Lampe JW. Human gut bacterial communities are altered by addition of cruciferous vegetables to a controlled fruit‐ and vegetable‐free diet. J Nutr. 2009;139(9):1685–91. [DOI] [PMC free article] [PubMed] [Google Scholar]
- 35. Fan Y, Pedersen O. Gut microbiota in human metabolic health and disease. Nat Rev Microbiol. 2021;19(1):55–71. [DOI] [PubMed] [Google Scholar]
- 36. Davani‐Davari D, Negahdaripour M, Karimzadeh I, Seifan M, Mohkam M, Masoumi SJ, et al Prebiotics: definition, types, sources, mechanisms, and clinical applications. Foods. 2019;8(3):92. [DOI] [PMC free article] [PubMed] [Google Scholar]
- 37. Peng M, Tabashsum Z, Anderson M, Truong A, Houser AK, Padilla J, et al. Effectiveness of probiotics, prebiotics, and prebiotic‐like components in common functional foods. Compr Rev Food Sci Food Saf. 2020;19(4):1908–33. [DOI] [PubMed] [Google Scholar]
- 38. Garcia‐Mantrana I, Selma‐Royo M, Alcantara C, Collado MC. Shifts on gut microbiota associated to mediterranean diet adherence and specific dietary intakes on general adult population. Front Microbiol. 2018;9:890. [DOI] [PMC free article] [PubMed] [Google Scholar]
- 39. Suez J, Korem T, Zeevi D, Zilberman‐Schapira G, Thaiss CA, Maza O, et al. Artificial sweeteners induce glucose intolerance by altering the gut microbiota. Nature. 2014;514(7521):181–6. [DOI] [PubMed] [Google Scholar]
- 40. Newman TM, Shively CA, Register TC, Appt SE, Yadav H, Colwell RR, et al Diet, obesity, and the gut microbiome as determinants modulating metabolic outcomes in a non‐human primate model. Microbiome. 2021;9(1):1–17. [DOI] [PMC free article] [PubMed] [Google Scholar]
- 41. Douillard FP, de Vos WM. Biotechnology of health‐promoting bacteria. Biotechnol Adv. 2019;37(6):107369. [DOI] [PubMed] [Google Scholar]
- 42. Bradley PH, Pollard KS. Proteobacteria explain significant functional variability in the human gut microbiome. Microbiome. 2017;5(1):1–23. [DOI] [PMC free article] [PubMed] [Google Scholar]
- 43. Bratlie M, Hagen IV, Helland A, Erchinger F, Midttun Ø UPM, Ueland PM, et al. Effects of high intake of cod or salmon on gut microbiota profile, faecal output and serum concentrations of lipids and bile acids in overweight adults: a randomised clinical trial. Eur J Nutr. 2021;60(4):2231–48. [DOI] [PMC free article] [PubMed] [Google Scholar]
- 44. Fitzgerald E, Lambert K, Stanford J, Neale EP. The effect of nut consumption (tree nuts and peanuts) on the gut microbiota of humans: a systematic review. Br J Nutr. 2021;125(5):508–520. [DOI] [PubMed] [Google Scholar]
- 45. Do MH, Lee E, Oh MJ, Kim Y, Park HY. High‐glucose or ‐fructose diet cause changes of the gut microbiota and metabolic disorders in mice without body weight change. Nutrients. 2018;10(6):761. [DOI] [PMC free article] [PubMed] [Google Scholar]
- 46. Singh RP, Halaka DA, Hayouka Z, Tirosh O. High‐fat diet induced alteration of mice microbiota and the functional ability to utilize fructooligosaccharide for ethanol production. Front Cell Infect Microbiol. 2020:376. [DOI] [PMC free article] [PubMed] [Google Scholar]
- 47. Chung WS, Walker AW, Louis P, Parkhill J, Vermeiren J, Bosscher D, et al Modulation of the human gut microbiota by dietary fibres occurs at the species level. BMC Biol. 2016;14(1):1–3. [DOI] [PMC free article] [PubMed] [Google Scholar]
- 48. Mukherjee A, Lordan C, Ross RP, Cotter PD. Gut microbes from the phylogenetically diverse genus Eubacterium and their various contributions to gut health. Gut Microb. 2020;12(1):1802866. [DOI] [PMC free article] [PubMed] [Google Scholar]
- 49. Vacca M, Celano G, Calabrese FM, Portincasa P, Gobbetti M, De Angelis M. The controversial role of human gut Lachnospiraceae. Microorganisms. 2020;8(4):573. [DOI] [PMC free article] [PubMed] [Google Scholar]
- 50. Vanegas SM, Meydani M, Barnett JB, Goldin B, Kane A, Rasmussen H, et al. Substituting whole grains for refined grains in a 6‐wk randomized trial has a modest effect on gut microbiota and immune and inflammatory markers of healthy adults. Am J Clin Nutr. 2017;105(3):635–50. [DOI] [PMC free article] [PubMed] [Google Scholar]
- 51. Jalanka J, Major G, Murray K, Singh G, Nowak A, Kurtz C, et al. The effect of psyllium husk on intestinal microbiota in constipated patients and healthy controls. Int J Mol Sci. 2019(2):20:433. [DOI] [PMC free article] [PubMed] [Google Scholar]
- 52. Shinn LM, Li Y, Mansharamani A, Auvil LS, Welge ME, Bushell C, et al. Fecal bacteria as biomarkers for predicting food intake in healthy adults. J Nutr. 2021;151(2):423–33. [DOI] [PMC free article] [PubMed] [Google Scholar]
- 53. Brunkwall L, Ericson U, Nilsson PM, Orho‐Melander M, Ohlsson B. Self‐reported bowel symptoms are associated with differences in overall gut microbiota composition and enrichment of Blautia in a population‐based cohort. J Gastroenterol Hepatol. 2021;36(1):174–80. [DOI] [PubMed] [Google Scholar]
- 54. Stenlund H, Nilholm C, Chorell E, Roth B, D'Amato M, Ohlsson B. Metabolic profiling of plasma in patients with irritable bowel syndrome after a 4‐week starch‐ and sucrose‐reduced diet. Metabolites. 2021;11(7):440. [DOI] [PMC free article] [PubMed] [Google Scholar]
Associated Data
This section collects any data citations, data availability statements, or supplementary materials included in this article.
Supplementary Materials
Supporting Information S1
Supporting Information S2
Data Availability Statement
The data that support the findings of this study are available on request from the corresponding author. The data are not publicly available due to privacy or ethical restrictions.