

Abstract
L-Arginine:glycine amidinotransferase (AGAT) catalyzes the formation of L-homoarginine (hArg) and L-ornithine (Orn) from L-arginine (Arg) and L-lysine (Lys): Arg + Lys ↔ hArg + Orn; equilibrium constant KhArg. AGAT also catalyzes the formation of guanidinoacetate (GAA) and Orn from Arg and glycine (Gly): Arg + Gly ↔ GAA + Orn; equilibrium constant KGAA. In humans, pharmacological hArg is metabolized to Lys. Low circulating and low excretory concentrations of hArg are associated with worse outcomes and mortality in the renal and cardiovascular systems. The metabolism and pharmacology of hArg have been little investigated. In the present study, we investigated the effects of pharmacological hArg (i.p., 0, 20, 220, 440 mg/kg at time point 0 min) on amino acids homeostasis in a rat model of isoprenaline-induced takotsubo cardiomyopathy (i.p., 50 mg/kg at time point 15 min). We measured by gas chromatography-mass spectrometry free and proteinic amino acids, as well as the polyamines putrescine and spermidine in the heart, lung, kidney, and liver of ten rats sacrificed at various time points (range, 0 to 126 min). hArg administration resulted in multiple changes in the tissue contents of several free and proteinic amino acids, as well as in the putrescine-spermidine molar ratio, an indicator of polyamines catabolism. Our results suggest that Lys and Arg are major metabolites of pharmacological hArg. Kidneys and heart seem to play a major metabolic role for hArg. Circulating Lys does not change over time, yet there is a considerable interchange of free Lys between organs, notably kidney and heart, during the presence of isoprenaline in the rats (time range, 15 to 90 min). Antidromic changes were observed for KhArg and KGAA, notably in the heart in this time window. Our study shows for the first time that free hArg and sarcosine (N-methylglycine) are positively associated with each other. The acute effects of high-dosed hArg administration and isoprenaline on various amino acids and on AGAT-catalyzed reaction in the heart, lung, kidney, and liver are detailed and discussed.
Keywords: AGAT, amino acids, L-arginine, GC-MS, L-homoarginine, isoprenaline, L-lysine, polyamines, putrescine, spermidine, sarcosine
1. Introduction
L-Arginine:glycine amidinotransferase (AGAT), also known as glycine amidinotransferase (GATM; EC 2.1.4.1), catalyzes the formation of guanidinoacetate (GAA) from L-arginine (Arg) and glycine (Gly) with L-ornithine (Orn) being the second reaction product (reaction (a) in Scheme 1) [1]. The catalytic process includes a nucleophilic attack of the sulfhydryl (SH) of a cysteine (Cys) moiety of AGAT on the guanidino C atom of Arg [2]. GAA is further metabolized to creatine by guanidinoacetate N-methyltransferase (GAMT; EC 2.1.1.2). AGAT also catalyzes the formation of L-homoarginine (hArg) from Arg and L-lysine (Lys), with Orn being the second reaction product (reaction (b) in Scheme 1) [1]. hArg can be converted to Arg and Lys (reversed reaction (b)). Rat kidney AGAT has a relatively broad substrate specificity [3]. Other guanidino compounds such as GAA and creatine can serve as substrates (Scheme 1, reaction (c)) and/or inhibitors of AGAT activity [1]. Low circulating and low excretory concentrations of hArg are associated with worse cardiovascular outcomes and mortality [4,5,6,7,8,9,10], suggesting a particular importance of hArg in health and disease. Yet, the underlying mechanisms are still elusive and warrant further investigation.
Scheme 1.
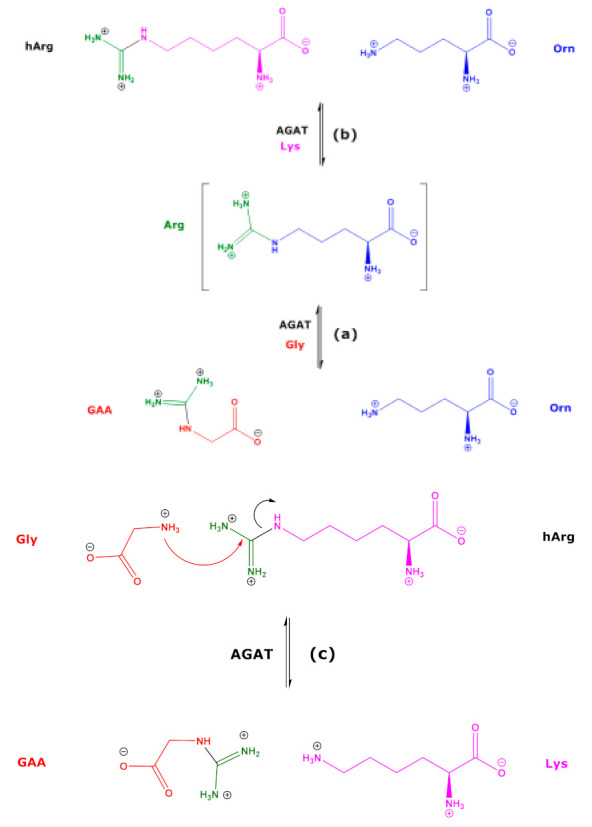
Simplified schematic of the AGAT-catalyzed synthesis of guanidinoacetate (GAA) from L-arginine (Arg) and glycine (Gly) (a), of L-homoarginine (hArg) from L-arginine and L-lysine (Lys) (b), and of the AGAT-catalyzed synthesis of GAA from L-homoarginine and Gly (c).
The metabolic fate of hArg in humans and animals has been little investigated. Arginase readily hydrolyzes Arg to Orn and urea. Bovine and human arginase also catalyze the hydrolysis of hArg to Lys, yet the reaction rate is several orders of magnitude smaller than that of Arg [11,12,13]. Injection of unlabeled hArg (1880 mg hArg/kg body weight) together with radiolabeled hArg (i.e., L-[guanidino-14C]-homoarginine) into rats was found to result in the appearance of unlabeled and radiolabeled urea in the kidney and liver, suggesting arginase-dependent hydrolysis of hArg to urea [14]. Analogous to other amino acids and metabolites, hArg has been shown to be a substrate of alanine:glyoxylate aminotransferase 2 [15,16]. Pharmacological hArg was shown to be metabolized to Lys in humans and in rats [13], and to the polyamine homoagmatine in rats [17], presumably by Orn decarboxylase (ODC; EC 4.1.1.17). Free Lys is known to undergo multiple metabolism and catabolism including enzymatic decarboxylation by ODC in the heart and brain [18,19,20,21]. Furthermore, residues of Lys and Arg in proteins undergo numerous enzymatic and non-enzymatic post-translational modifications (PTM) [22].
Catecholamines, including the drug isoprenaline, are known to affect the ODC activity in the rat heart [23,24,25,26,27]. Isoprenaline is experimentally used to induce takotsubo cardiomyopathy (TCC) in animals [28]. In this rat model of TTC, we previously investigated the distribution and the metabolism of pharmacological high-dosed hArg in blood and main organs of the rat to metabolites of the Arg/NO pathway [17,29]. We observed high, dose-dependent concentrations of hArg in plasma, but relatively small changes in the concentration of Arg, indicating that even high-dosed hArg is not expected to severely affect Arg-involving pathways in the rat [17,29]. In rats, dietary hArg was reported to induce lysine imbalance [30]. Moreover, supplementation of creatine, a guanidino compound, in healthy humans was found to alter plasma guanidino compounds [31]. Interestingly, inter-organ amino acid interchange was observed in propionic acidemia suggesting the possible contribution of inter-organ interchange of amino acids to the physiopathology of propionic acidemia [32]. Prominent examples of inter-organ amino acid interchanges are glutathione, cysteine, and cystine [33,34].
In our previous study [29], we did not measure Lys and many other amino acids in blood and organ specimens of the rats administered with hArg. As Lys and hArg are mutual metabolites (Scheme 1), the focus of the present study was on the effects of hArg on Lys distribution and possible interchanges between organs. In the present study, we measured free and proteinic Lys and other free and proteinic amino acids in heart, kidney, lung, and liver specimens collected in our previous study [29] by means of validated gas chromatography-mass spectrometry (GC-MS) methods [35] and analyzed their relationships to hArg and Lys. Since isoprenaline was used in the study to induce TCC, we were also interested to obtain information about the possible effects of isoprenaline on Lys and hArg metabolism.
2. Results
Table 1 summarizes the rats used in the study, the hArg doses applied, the time points of blood sampling and sacrifice, and the organs analyzed for their amino acid contents.
Table 1.
Summary of the rats used in the study, the hArg doses applied, the time points of blood sampling and sacrifice, and the organs analyzed for amino acids.
| Rat (R) Dose (D) a |
hArg Dose (mg/kg) |
Time of Blood Sampling (min) | Time of Sacrifice (min) |
Rat Organs Analyzed for Amino Acids |
|---|---|---|---|---|
| R5, D0 | 0 | 0, 15, 30, 60 | 70 | Lung, kidney, liver, heart b (no Lys) |
| R2, D1 | 20 | 0, 15, 30, 60 | 64 | Lung, kidney, liver, heart |
| R3, D1 | 20 | 0, 15 | 28 | Lung, kidney, liver, heart |
| R13, D1 | 20 | No sampling | 126 | Lung, kidney, liver, heart |
| R18, D1 | 20 | 0, 90 | 114 | Lung, kidney, liver, heart |
| R14, D2 | 220 | 90 | 108 | Lung, kidney, liver, heart |
| R19, D2 | 220 | 0, 100 | 98 | Lung, kidney, liver, heart b (no Lys) |
| R1, D3 | 440 | 0, 15, 30 | 32 | Lung, kidney, liver, heart b (no Lys) |
| R4, D3 | 440 | 0, 15, 30, 60 | 87 | Lung, kidney, liver, heart b (no Lys) |
| R17, D3 | 440 | 0 | 14 c | Lung, kidney, liver, heart |
a D0, 0 mg/kg; D1, 20 mg/kg; D2, 220 mg/kg; D3, 440 mg/kg; b the heart of rat #5 (R5) was used for histological analyses only; no data are available for heart amino acids; c rat #17 (R17) received hArg and died just before isoprenaline administration.
2.1. Free Amino Acids in Tissue Homogenates
The concentrations of the free amino acids in the organ homogenates are listed in Table S1. The sum of the concentrations of the free and proteinic amino acids in homogenates (incubated at room temperature and 110 °C for 20 h in 6 M HCl, respectively) measured in the organ homogenates are summarized in Tables S2 and S3. The concentrations of free hArg, Lys and Arg measured at various time points in the organ homogenates of the rats administered with hArg are summarized in Table 2 and illustrated in Figure 1. The concentrations (in µM) of free and total amino acids in the homogenates of the analyzed organs of the rats are listed in Table S3.
Table 2.
Time of sacrifice, hArg dose, isoprenaline (ISO) administration and concentrations of free homoarginine (hArg), free lysine (Lys), and free arginine (Arg) measured in the tissue homogenates of the analyzed organs of the rats at the indicated time points. See also Table 1.
| Rat No. Organ | Time of Sacrifice (min) |
hArg Dose (mg/kg) | ISO Use |
hArg (µM) |
Lys (µM) |
Arg (µM) |
|---|---|---|---|---|---|---|
| R17 Heart | 14 | 440 | no | 127 | 140 | 92 |
| R17 Lung | 14 | 440 | no | 199 | 386 | 230 |
| R17 Kidney | 14 | 440 | no | 416 | 1138 | 767 |
| R17 Liver | 14 | 440 | no | 249 | 497 | 29.8 |
| R3 Heart | 28 | 20 | yes | 7.6 | 834 | 575 |
| R3 Lung | 28 | 20 | yes | 3.8 | 191 | 7.34 |
| R3 Kidney | 28 | 20 | yes | 8.1 | 173 | 60.7 |
| R3 Liver | 28 | 20 | yes | 15.5 | 392 | 14.3 |
| R1 Lung | 32 | 440 | yes | 186 | 229 | 102 |
| R1 Kidney | 32 | 440 | yes | 444 | 646 | 365 |
| R2 Heart | 64 | 20 | yes | 9.7 | 644 | 384 |
| R2 Lung | 64 | 20 | yes | 5.1 | 306 | 210 |
| R2 Kidney | 64 | 20 | yes | 9.7 | 96 | 37.4 |
| R2 Liver | 64 | 20 | yes | 6.3 | 241 | 124 |
| R5 Lung | 70 | 0 | yes | 0.64 | 313 | 181 |
| R5 Liver | 70 | 0 | yes | 0.62 | 433 | 9.6 |
| R4 Lung | 87 | 440 | yes | 194 | 441 | 185 |
| R4 Kidney | 87 | 440 | yes | 255 | 187 | 73.8 |
| R4 Liver | 87 | 440 | yes | 425 | 714 | 10.3 |
| R19 Lung | 98 | 220 | yes | 70 | 169 | 233 |
| R19 Kidney | 98 | 220 | yes | 109 | 145 | 56.3 |
| R19 Liver | 98 | 220 | yes | 117 | 451 | 15 |
| R14 Heart | 108 | 220 | yes | 143 | 154 | 91.2 |
| R14 Lung | 108 | 220 | yes | 52 | 245 | 171 |
| R14 Kidney | 108 | 220 | yes | 220 | 1101 | 733 |
| R14 Liver | 108 | 220 | yes | 132 | 391 | 15.9 |
| R18 Heart | 114 | 20 | yes | 15.4 | 153 | 51.3 |
| R18 Lung | 114 | 20 | yes | 7.2 | 391 | 136 |
| R18 Kidney | 114 | 20 | yes | 9.9 | 503 | 262 |
| R18 Liver | 114 | 20 | yes | 7.65 | 328 | 10.1 |
| R13 Heart | 126 | 20 | yes | 20.3 | 151 | 75.4 |
| R13 Lung | 126 | 20 | yes | 15.9 | 471 | 261 |
| R13 Kidney | 126 | 20 | yes | 15.1 | 602 | 370 |
| R13 Liver | 126 | 20 | yes | 22.1 | 492 | 21.2 |
Figure 1.

Tissue-free hArg (A), Lys (B), and Arg (C) concentrations in the study rats administered with the indicated hArg doses at t = 0 min and sacrificed at the indicated time points. See also Table 2.
The lowest free hArg concentrations were measured in the lung and liver of the rat R5 that did not receive hArg; similarly, low hArg concentrations are also expected for the heart and kidney of this rat (not measured). Besides free hArg (Figure 1A), the greatest changes were observed for tissue-free Lys (Figure 1B) and tissue-free Arg (Figure 1C), notably in the kidney and heart. There was no correlation between the free hArg, Lys, and Arg concentrations in the organ homogenates and the time of sacrifice of the rats when considering all data. When considering all measurements as well, only the concentration of free hArg in the tissue homogenates correlated closely with the hArg dose administered (r = 0.9165, p < 0.0001; n = 34). The hArg dose correlated strongly with the free hArg concentration in the kidney (r = 0.9354, p = 0.0016; n = 9), in the lung (r = 0.9211, p = 0.0008; n = 10) and in the liver (r = 0.9037, p = 0.0026; n = 9), but not in the heart (r = 0.7775, p = 0.1333; n = 6). The concentration–time “curves” of free Lys and free Arg in the kidneys are very similar and seem to opposite their course in the heart (Figure 1B,C) and to parallel the concentration–time “curve” of hArg in the heart (Figure 1A).
The correlation coefficients after Spearman between the tissue-free Lys concentration and the concentration of the other tissue-free amino acids are summarized in Table 3. Free Lys tissue concentration correlated with free hArg concentration positively in the kidney (r = 0.667) and liver (r = 0.683), negatively in the heart (r = −0.677), and did not correlate with free hArg in the lung. The correlation coefficients after Spearman between the hArg dose and the concentration of the other tissue-free amino acids are summarized in Table 3. Analogously, the hArg dose correlated with the tissue concentration of free Lys positively in the kidney and liver, negatively in the heart, and did not correlate with free hArg in the lung.
Table 3.
Spearman coefficients of correlation between the tissue concentrations (µM) of (A) free Lys and (B) free hArg with the indicated free amino acids in lung, kidney, heart, and liver of the rats.
| (A) Free Lys Versus Free Amino Acids and hArg Dose | (B) Free hArg Versus Free Amino Acids and hArg Dose | ||||||||
|---|---|---|---|---|---|---|---|---|---|
| Amino acid | Lung | Kidney | Heart | Liver | Amino acid | Lung | Kidney | Heart | Liver |
| Ala | 0.967 | 0.933 | 0.714 | 0.933 | Ala | 0.233 | 0.617 | −0.829 | 0.650 |
| Thr | 0.933 | 0.983 | 0.829 | 0.917 | Thr | −0.033 | 0.567 | −0.714 | 0.600 |
| Gly | 0.683 | 0.95 | 0.829 | 0.444 | Gly | 0.333 | 0.617 | −0.486 | 0.561 |
| Val | 0.967 | 0.983 | 0.829 | 0.733 | Val | 0.133 | 0.567 | −0.486 | 0.417 |
| Ser | 0.95 | 0.967 | 0.657 | 0.483 | Ser | 0.050 | 0.650 | −1.000 | 0.300 |
| Sarc | 0.017 | 0.617 | −0.486 | 0.067 | Sarc | −0.283 | −0.050 | 0.829 | 0.050 |
| Leu + Ile | 0.95 | 0.983 | 0.543 | 0.5 | Leu + Ile | 0.000 | 0.567 | −0.657 | 0.350 |
| GAA | 0.55 | 0.95 | 0.943 | 0.3 | GAA | 0.533 | 0.750 | −0.600 | −0.300 |
| Asp + Asn | 0.867 | 0.983 | 0.829 | 0.683 | Asp + Asn | 0.533 | 0.733 | −0.486 | 0.267 |
| OH-Pro | 0.9 | 0.795 | 0.943 | 0.267 | OH-Pro | 0.500 | 0.469 | −0.829 | −0.050 |
| Pro | 0.983 | 0.933 | 0.657 | 0.883 | Pro | 0.217 | 0.617 | −1.000 | 0.500 |
| Met | 0.983 | 0.717 | 0.429 | 0.45 | Met | 0.333 | 0.667 | −0.086 | 0.017 |
| Glu + Gln | 0.967 | 0.683 | 0.886 | 0.55 | Glu + Gln | 0.417 | 0.800 | −0.371 | 0.550 |
| Orn + Cit | 0.617 | 0.967 | 0.829 | 0.933 | Orn + Cit | −0.067 | 0.550 | −0.943 | 0.483 |
| Phe | 0.95 | 0.967 | 0.714 | 0.3 | Phe | 0.050 | 0.483 | −0.600 | 0.183 |
| Tyr | 0.817 | 0.933 | 0.486 | 0.368 | Tyr | 0.067 | 0.517 | −0.600 | 0.326 |
| Arg | 0.717 | 0.983 | 0.6 | −0.05 | Lys | 0.283 | 0.667 | −0.657 | 0.683 |
| hArg | 0.283 | 0.667 | −0.657 | 0.683 | Arg | 0.300 | 0.583 | −0.486 | 0.233 |
| Trp | −0.25 | 0.767 | 0.543 | −0.483 | Trp | −0.217 | 0.500 | −0.429 | 0.000 |
| ADMA | 1 | 0.9 | 0.6 | 0.5 | ADMA | 0.283 | 0.483 | −0.486 | 0.300 |
| hArg dose | −0.009 | 0.49 | −0.507 | 0.562 | hArg Dose | 0.940 | 0.935 | 0.778 | 0.949 |
Abbreviations: Sarc, sarcosine; OH-Pro, hydroxy-proline; ADMA, asymmetric dimethylarginine.
Linear regression analysis by considering the free Lys and free Arg concentrations measured in the hearts of all rats (except for R17, which did not receive isoprenaline) resulted in strong linear relationships between the heart concentration (y, µM) and the sacrifice time (x, min): Lys: y = 1080 − 7.8x, r2 = 0.9632, p = 0.003; Arg: y = 730 − 5.6x, r2 = 0.9947, p = 0.0017. These data allow an estimate of the cardiac half-life of 69 min for Lys and 65 min for Arg, indicating concomitant metabolism of Lys and Arg.
Due to the potentially key role of the heart in hArg metabolism to Lys (Figure 2), we calculated the percentage changes of free Lys in the tissues of the rats in which heart data were available. R17 received the highest hArg dose but not isoprenaline because it died just before, whereas all the other rats (R2, R3, R13, R14, R18) received isoprenaline. Figure 2 shows the percentage content of free Lys in the homogenates of the heart and the summed percentage content of free Lys in the homogenates of lung, kidney, and liver of the rats. Figure 2 also shows the remaining isoprenaline percentage concentration at the indicated time points, which was calculated by considering an elimination half-life of 10 min in the rat [36].
Figure 2.
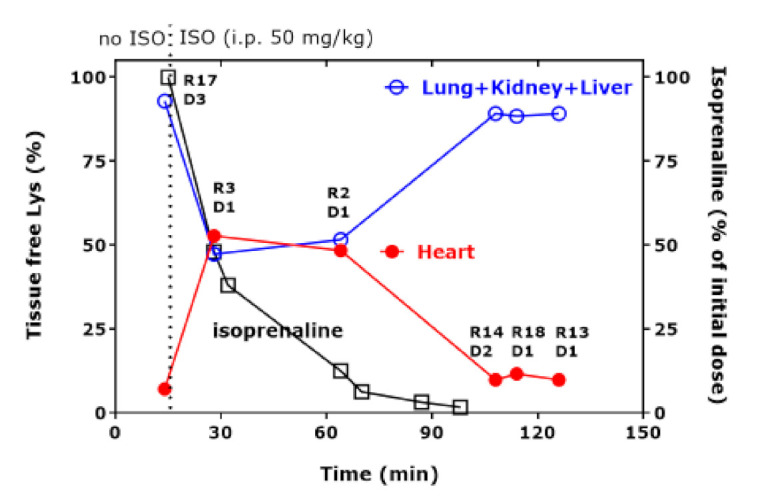
Tissue-free Lys percentage concentration in the heart and summed free Lys percentage concentration in lung, kidney, and liver of the indicated rats administered with the indicated hArg doses at t = 0 min and sacrificed at the indicated time points. The time course of percentage isoprenaline was calculated using an elimination half-life of 10 min [36]. D1, 20 mg/kg; D2, 220 mg/kg; D3, 440 mg/kg. R, rat; D, hArg dose.
Figure 2 shows the diametrical “course” of the Lys content of the heart and of the other organs together. Upon the disappearance of isoprenaline from the rat’s body at about 100 min, free Lys in the heart and the summed free Lys in the other organs did not change over time anymore. Between the time points 28 min and 64 min there seems to be an equilibrium for the percentage content of free Lys in the heart and of free Lys in the other three organs. Figure 2 suggests that free Lys is first shifted from the lung/kidneys/liver to the heart to reach an equilibrium and then in the time interval 64–108 min from the heart to the other organs, obviously without a considerable change in the blood concentration of Lys in the circulation.
2.2. Total Amino Acids in Tissue Homogenates
The concentrations of free hArg and of free + proteinic hArg measured in all tissues were very similar: 21.2 [8–188] µM vs. 20.1 [9.4–164] µM (p = 0.407, Wilcoxon test) (Tables S2 and S3). Bland–Altman analysis revealed a bias 3.9 ± 13.1 µM (95% limits of agreement, −22 to 30; four negative values). Free hArg and total hArg concentrations in all organs correlated strongly (r = 0.991, p < 0.0001). Linear regression analyses resulted in the regression equation y = 1.35 + 0.949x (r2 = 0.9919, p < 0.0001). These observations strongly suggest no incorporation of pharmacological hArg into tissue proteins and no guanidination of Lys residues to generate hArg residues in the rat tissue proteins under the experimental conditions. Free ADMA and total ADMA concentrations in all organs correlated moderately (r = 0.7159, p < 0.0001). Linear regression analyses resulted in the regression equation y = 3.7 + 4.777x (r2 = 0.5866, p < 0.0001), indicating an almost 5-fold higher proteinic ADMA concentration. A stronger correlation was observed for the sum of free and total Cit and Orn (r = 0.9309, p < 0.0001). Linear regression analyses resulted in the regression equation y = 48.1 + 1.184x (r2 = 0.9265, p < 0.0001), indicating quite similar free and proteinic Cit + Orn concentrations. Of the other amino acids, correlations between free and total concentrations were observed only for Met (r = 0.3773, p = 0.0255) and Glu + Gln (r = 0.3518, p = 0.0382).
Figure 3 shows that the sum concentration of all proteinic amino acids measured in the tissue homogenates of the study rats behave differently, suggesting an exchange between the organs with different kinetics. The concentration of the sum of all amino acids in all organs was determined to be (mean ± SEM) 19.9 ± 2.2 mM, with Lys being the largest contributor (12.5 ± 1.9 mM) (Figure S1).
Figure 3.

Sum of tissue-free and proteinic amino acid (AA) concentrations in heart (A), lung (B), kidney (C), and liver (D) of rats administered with the indicated hArg doses at time = 0 min and sacrificed at the indicated time points. Data are presented as the mean ± SEM. The vertical dotted lines indicate the time point of isoprenaline (ISO) injection at t = 15 min.
Figure 4 shows the concentration–time “curves” for total Lys in the organs of the study rats. All curves are similar to those obtained for the sum of proteinic amino acids have a relatively broad minimum between 30 min and 64 min after hArg administration. There was no linearity between Lys concentration and time. Linearity was observed for the lung, when the 14 min value was disregarded (r2 = 0.69, p = 0.0055). The highest yet borderline correlations (after Spearman) between hArg dose and total Lys concentration were observed for the heart (r = 0.8332, p = 0.0667) and the liver (r = 0.6672, p = 0.0560) suggesting a steady increase in tissue Lys in these two organs.
Figure 4.
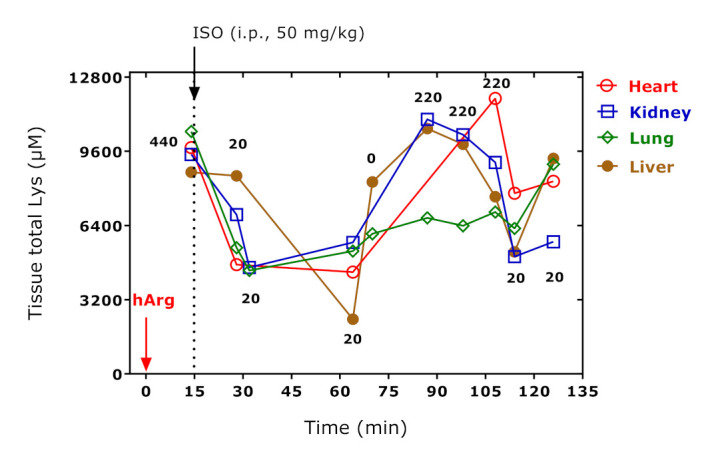
Total Lys concentrations in heart, kidney, lung, and liver of the study rats administered with the indicated hArg doses at t = 0 min and isoprenaline (ISO) at t = 15 min and sacrificed at the indicated time points. Arrows indicate the administration of hArg and isoprenaline. See Table S1.
2.3. Guanidinoacetate in Organ Homogenates
The concentration of free and total GAA in the rat organs correlated (r = 0.479, p = 0.004), but did not differ each from other (p = 0.1565). Bland–Altman analysis revealed a bias of −4.5 ± 19.5 µM (95% limits of agreement, −43 to 34, seven negative values) and a systematic error: Linear regression analysis between the difference (y) and the average (x) of total and free GAA concentration yielded a straight line with the regression equation y = 6.5 − 0.97x (r2 = 0.7868). These observations argue for the instability of GAA under the strong acidic and thermal conditions of the proteolysis and for the lack of proteinic GAA in the analyzed organs of the rats. We, therefore, considered the concentration of free GAA. Figure 5 shows the concentration–time “curves” for free GAA in four organs of the study rats. This “kinetics” resembles that of free Lys in the same organs (Figure 2). The greatest and diametric changes were seen for GAA in the heart and kidney, whereas the GAA concentrations did not change very much in the lung and liver. GAA in the heart and lung correlated inversely (r = −0.885, p = 0.019, n = 6); the negative correlation between GAA in the heart and kidney failed statistical significance (r = −0.775, p = 0.070, n = 6). Figure 5 suggests an almost 100-fold increase in free GAA in the kidney, presumably by the reaction of Arg and hArg with Gly releasing Orn and Lys, respectively (Scheme 1). Comparable increases were observed for free GAA in the heart of the rats sacrificed at 28 and 64 min (Figure 5).
Figure 5.

Tissue-free GAA concentration in organ homogenates of the rats. The indicated hArg doses were administered at t = 0 min and the rats were sacrificed at the indicated time points. Isoprenaline (ISO) was administered at t = 15 min. Arrows indicate the administration of hArg and isoprenaline.
2.4. ADMA in Organ Homogenates—Effects on Post-Translational Arg-Dimethylation
The summed concentrations of total and free ADMA in the homogenates of all organs and time points were 16.2 ± 9.9 µM and 2.6 ± 1.6 µM, respectively. There was a moderate correlation (r = 0.766, p < 0.0001, n = 34) between total and free ADMA concentration when considering all organs and all time points. Bland–Altman analysis revealed a bias of 13.6 ± 8.7 µM (95 % limits of agreement, −3.5 to 31) with no negative values. This result suggests that the concentration of total ADMA was consistently higher than the concentration of free ADMA. In the Bland–Altman analysis, linear regression analysis between the difference (y) of total and free ADMA, i.e., the concentration of proteinic ADMA, versus the average of total and free ADMA (x), resulted in a straight line with the regression equation y = −0.82 + 1.53x, r2 = 0.9575.
The concentration–time “profiles” for proteinic and free ADMA in the organs of the ras obtained in the present study are shown in Figure 6. Administration of the highest dose of hArg (i.e., 440 mg/kg) in R17 which was sacrificed at 14 min and was not treated with isoprenaline resulted in proteinic ADMA with the highest concentration being observed in the lung followed by the liver, heart, and kidney (Figure 6A). This order differed from that observed for free ADMA: liver ≈ lung, kidney, and heart (Figure 6B). It can be assumed that this distribution was independent of isoprenaline because R17 did not receive any isoprenaline. The concentration–time “course” of ADMA behaved almost diametrically only in the heart. Moreover, the free ADMA concentration in the lung and heart correlated inversely each with other (r = −0.8393, p = 0.037, n = 6). The lowest value for proteinic ADMA was observed at 64 min, whereas the highest value for free ADMA was obtained at 28 min. The cardiac half-life of free ADMA is estimated from the data of Figure 6B to be about 80 min.
Figure 6.

Tissue proteinic (A) and tissue-free (B) ADMA concentration in organ homogenates of the rats. The indicated hArg doses were administered at t = 0 min and the rats were sacrificed at the indicated time points. Isoprenaline (ISO) was administered at t = 15 min. Arrows indicate the administration of hArg and isoprenaline.
2.5. Proline and Hydroxy-Proline in Organ Homogenates—Effects on Post-Translational Pro-Hydroxylation
The summed concentrations of total and free Pro in the homogenates of all organs and time points were 4552 [3350–5787] µM and 249 [123–327] µM respectively. There was no correlation between total and free Pro concentration when considering all organs and time points. Bland–Altman analysis revealed a bias of 4265 ± 1387 µM (95% limits of agreement, 1547 to 6983) with no negative values. This result suggests that the concentration of total Pro was consistently higher than the concentration of free Pro. In the Bland–Altman analysis, linear regression analysis between the difference (y) of total and free Pro, i.e., the concentration of proteinic Pro, versus the average of total and free Pro (x) resulted in a straight line with the regression equation y = 32 + 1.72x, r2 = 0.8054.
The summed concentrations of total and free OH-Pro in the homogenates of all organs and time points were 46.5 [28–144] µM and 15.4 [10.5–19.3] µM, respectively. There was no correlation between total and free OH-Pro concentration when considering all organs and time points. Bland–Altman analysis revealed a bias of 100 ± 195 µM (95% limits of agreement, −282 to 483) with no negative values. This result suggests that the concentration of total OH-Pro was consistently higher than the concentration of free OH-Pro. In the Bland–Altman analysis, linear regression analysis between the difference (y) of total and free OH-Pro, i.e., the concentration of proteinic Pro, versus the average of total and free OH-Pro (x) resulted in a straight line with the regression equation y = −33 + 1.97x, r2 = 0.9833.
The summed molar ratio of total OH-Pro to total Pro in the homogenates of all organs and time points was 0.013 [0.009–0.028]. The summed molar ratio of free OH-Pro to free Pro in the homogenates of all organs and time points was 0.065 [0.040–0.093]. Bland–Altman analysis revealed a bias of −0.05 ± 0.039 µM (95% limits of agreement, −0.127 to 0.025) with all values being negative. In the Bland–Altman analysis, linear regression analysis between the difference (y) of total OH-Pro to total Pro, and of total OH-Pro to total Pro, versus the average of the ratios (x) resulted in a straight line with the regression equation y = −0.025 − 0.522x, r2 = 0.1526 (p = 0.0224). The molar ratio of total Pro to free Pro was estimated to be 20.1 [11.4–36.2]. The molar ratio of total OH-Pro to free OH-Pro was calculated to be 2.69 [1.89–10.8]. The molar ratio of the ratio of total OH-Pro to total Pro to the ratio of free OH-Pro to free Pro was determined to be 0.21 [0.14–0.40]. The hArg dose correlated solely with the total Pro concentration (r = 0.401, p = 0.019).
Figure 7 shows the molar ratio of Pro to OH-Pro (Pro/OH-Pro) in their free and proteinic forms in organ homogenates of the rats. The free Pro/OH-Pro ratio did not differ between the organs. The total Pro/OH-Pro ratio did differ in the liver, and total Pro correlated closely with free Pro (r = 0.867, p = 0.005). None of the Pro parameters measured in the liver did correlate with the hArg dose, presumably due to the lack of an effect of pharmacological hArg on Pro metabolism. It seems that the extent of the hydroxylation of Pro residues in liver proteins is about 3 to 4 times lower than in the other rat organs.
Figure 7.
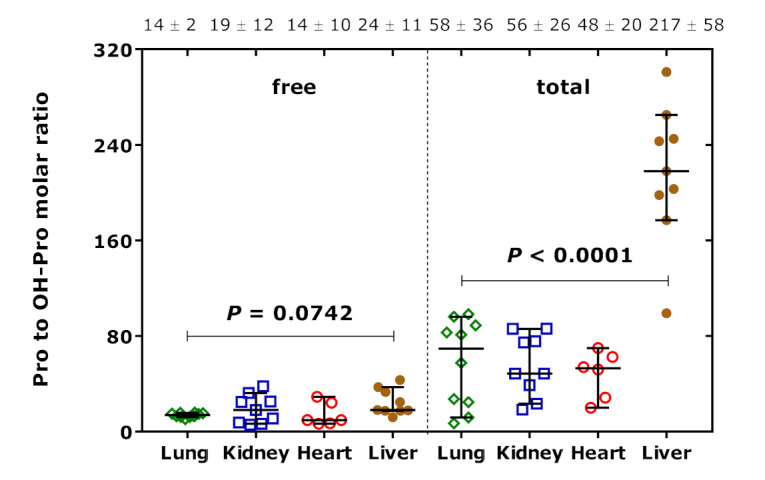
Molar ratio of Pro to OH-Pro in their free and proteinic forms in organ homogenates of the rats. Data are shown as the median with 95% confidence interval (n = 6–10). One-way ANOVA was performed in both cases. The numbers on the top of the Figure are the mean ± standard deviation values of the respective molar ratios.
2.6. Citrulline und Ornithine—Effects on Post-Translational Citrullination and Arginase Activity
The GC-MS method used in the present study measures the sum of Cit and Orn because Cit is converted to Orn during the derivatization procedures [35]. Thus, the utility of proteinic Cit as a measure of citrullination in proteins is limited. Nevertheless, under the assumptions that Orn, which is not a proteinogenic amino acid, and that Orn cannot be formed under the conditions of the animal experiment, the extent of citrullination can be estimated. Figure 8 shows the calculated concentration of Cit the proteins of the rat organs. The greatest difference is seen between the liver and the other organs. This observation may suggest that the extent of citrullination is about two times higher in the liver compared to the lung, kidney, and heart. The citrullination was independent of the hArg dose and of the sacrifice time in all organs (data not shown).
Figure 8.
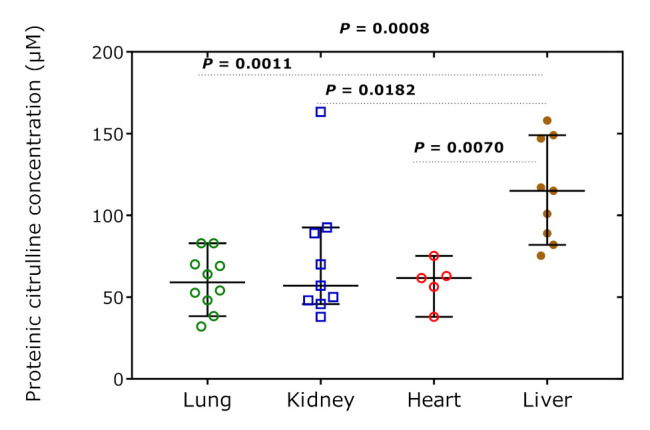
Concentration of Cit in the rat tissue organs over all time points. Data are shown as the median with 95% confidence interval (n = 5–10). One-way ANOVA with Tukey’s multiple comparisons test was performed.
The values of the global arginine bioavailability ratio (GABR), i.e., the molar ratio of free Arg concentration to the sum concentration of free Cit and Orn, were 1.97 [0.85–3.61] in the lung, 1.85 [1.1–3.1] in the kidney, 2.63 [1.24–3.39] in the heart, and 0.055 [0.045–0.29] in the liver (Figure 9). This observation would indicate a very high arginase activity in the rat liver. GABR was independent of the hArg dose and sacrifice time (data not shown).
Figure 9.
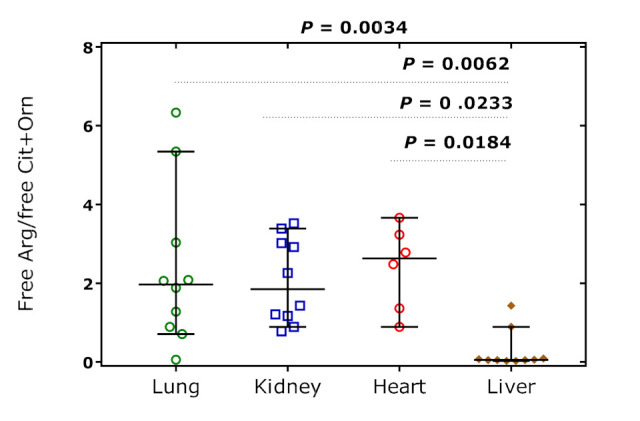
Molar ratio of free Arg to the summed concentration of free Cit and Orn, the global arginine bioavailability ratio (GABR), in the rat tissue organs over all time points. Data are shown as the median with 95% confidence interval (n = 6 or 10). One-way ANOVA was performed (p = 0.0034) with Tukey’s multiple comparisons test.
2.7. Glutamate und Glutamine
The GC-MS method used in the present study measures the sum of Glu and Gln because Gln is converted to Glu during the derivatization procedures [35]. The results for the sum of Glu and Gln are summarized in Tables S1–S3. When considering all data, there were weak positive correlations between total Glu + Gln, free Glu + Gln, and hArg (data not shown). The concentrations of total Glu + Gln, on the one side, and those of free Glu + Gln, on the other side, did not differ in the organs. This also applies to their molar ratio. Linear regression analysis between the difference of total Glu + Gln and free Glu + Gln concentration (y) and their average concentration (x) resulted in high linearity in all organs. They were as follows: y = −70 + 1.61x (r2 = 0.942, p < 0.0001) for the lung; y = −498 + 1.62x (r2 = 0.871, p = 0.0002) for the kidney; y = −3932 + 2.11x (r2 = 0.983, p = 0.0001) for the heart; and y = −1707 + 1.92x (r2 = 0.996, p < 0.0001) for the liver. We tested correlations between the hArg dose and the concentrations of total and free Glu + Gln in the rat organs. There were correlations after Spearman in the lung. The hArg dose correlated with free Glu + Gln only in the kidney (r = 0.802, p = 0.016). When considering all data, hArg dose correlated weakly both with free Glu + Gln (r = 0.368, p = 0.032) and total Glu + Glu (r = 0.420, p = 0.014). A correlation between free and total Glu + Gln was found only for the lung (r = 0.733, p = 0.020).
2.8. Correlations between Free Amino Acids in Organ Homogenates
We performed additional statistical analyses to investigate potential relationships among the amino acids. First, separate correlations after Spearman were performed between the concentrations of the free amino acids measured in the homogenates in rat organs. Then, the correlation coefficients obtained from those analyses were plotted for each amino acid and the four organs. The relationships for Sarc, hArg, and Arg are separately illustrated in Figure 10. The results of these analyses for all amino acids are summarized in Figure S2. In the hearts of all rats, the correlation coefficients were negative for Sarc (Figure 10A) and hArg (Figure 10B) and positive for Arg (Figure 10C). In the hearts as well, there was a positive correlation between Sarc and hArg, but negative between Arg with hArg or Sarc. Solely for Met in the hearts, there was no correlation. These analyses suggest a close association of Sarc with hArg and Arg in the rat hearts.
Figure 10.

Spearman correlation coefficients for free tissue Sarc (A), hArg (B), and Arg (C) versus the other free tissue amino acids in lung, kidney, heart, and liver of the study rats. The complete set of the results are found in Figure S2. All amino acids are represented by a symbol. The data points for Sarc and hArg are encircled.
2.9. Effects on the AGAT-Catalyzed Reactions and Equilibria
AGAT catalyzes the reaction Arg + Lys ↔ hArg + Orn (see Figure 1). The equilibrium constant KhArg of this reaction is calculated by using the concentrations (set in square brackets) of the free amino acids Arg, Lys, hArg, and Orn measured in the rat organs at the time of sacrifice: KhArg = ([hArg] × [Orn])/([Arg] × [Lys]) are listed in Table 4 and shown in Figure 11A for clarity. AGAT also catalyzes the reaction Arg + Gly ↔ GAA + Orn (see Figure 1). The equilibrium constant KGAA of this reaction is calculated by using the concentrations (set in square brackets) of the free amino acids Arg, Gly, GAA, and Orn measured in the rat organs at the time of sacrifice: KGAA = ([GAA] × [Orn])/([Arg] × [Gly]) are listed in Table 4 and shown in Figure 11 for clarity. Because of methodological reasons [35], [Orn] is actually the sum of free Orn and Cit concentrations.
Table 4.
Equilibrium constant (KhArg) values of the AGAT-catalyzed reaction Arg + Lys ↔ hArg + Orn, equilibrium constant (KGAA) values of the AGAT-catalyzed reaction Arg + Gly ↔ GAA + Orn, and their KhArg/KhArg ratio in the organs of the rats at the time of sacrifice upon i.p. administration of the indicated doses of hArg. n.a., not applicable.
| Time (min) | hArg Dose (mg/kg) | KhArg; KGAA and KhArg/KGAA ratio | |||
|---|---|---|---|---|---|
| Lung | Kidney | Heart | Liver | ||
| 14 | 440 | 0.17; 0.04/4.0 | 0.12; 1.64/0.07 | 0.33; 0.09/3.8 | 5.38; 0.80/6.7 |
| 28 | 20 | 0.31; 5.34/0.06 | 0.06; 0.37/0.16 | 0.002; 1.39/0.001 | 0.74; 2.11/0.35 |
| 32 | 440 | 0.40; 0.06/6.8 | 0.24; 1.83/0.13 | n.a. | n.a. |
| 64 | 20 | 0.003; 0.023/0.13 | 0.07; 0.31/0.23 | 0.005; 2.26/0.002 | 0.02; 0.09/0.19 |
| 70 | 0 | 0.001; 0.044/0.02 | n.a. | n.a. | 0.05; 13.9/0.03 |
| 87 | 440 | 0.34; 0.13/2.61 | 1.16; 0.53/2.18 | n.a. | 20.3; 12.6/1.61 |
| 98 | 220 | 0.20 | 0.62; 0.35/1.8 | n.a. | 5.26; 2.59/2.0 |
| 108 | 220 | 0.03; 0.03/1.13 | 0.06; 1.32/0.05 | 0.38; 0.20/1.9 | 5.16; 1.07/4.8 |
| 114 | 20 | 0.03; 0.21/0.12 | 0.009; 1.94/0.005 | 0.11; 0.31/0.36 | 0.50; 4.20/0.12 |
| 126 | 20 | 0.02; 0.07/0.27 | 0.007; 1.14/0.006 | 0.10; 0.23/0.43 | 0.76; 2.45/0.31 |
Figure 11.
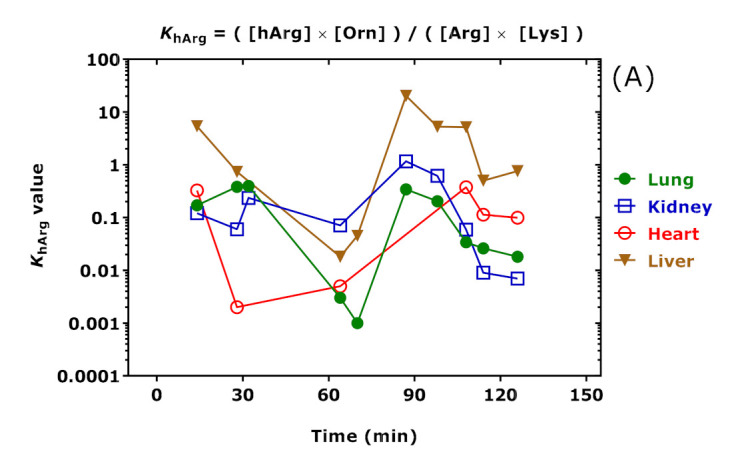
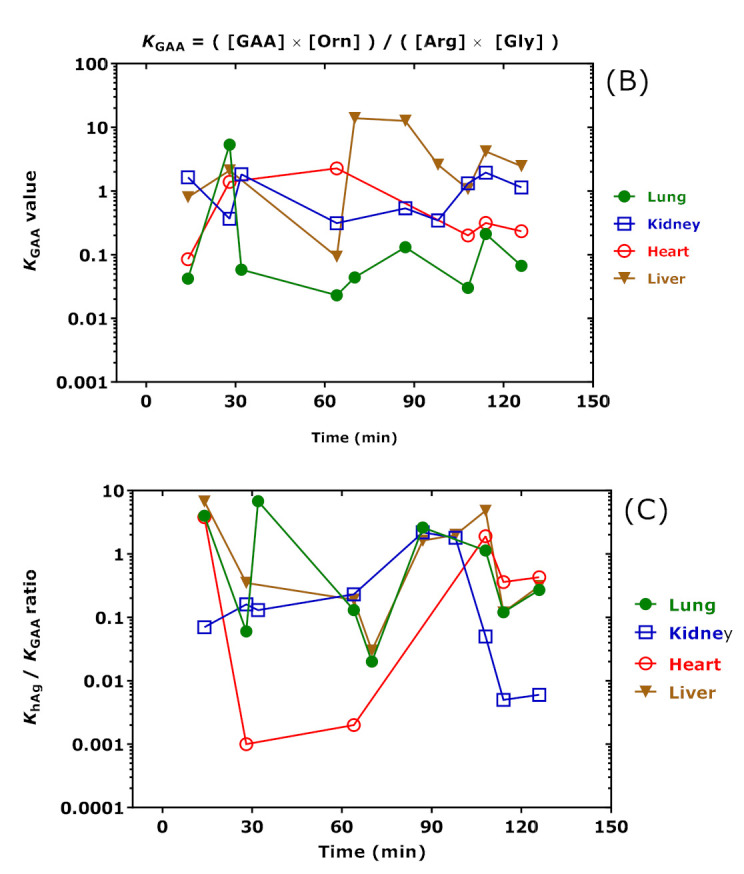
(A) Equilibrium constant (KhArg) values of the AGAT-catalyzed reaction Arg + Lys ↔ hArg + Orn; (B) equilibrium constant (KGAA) values of the AGAT-catalyzed reaction Arg + Gly ↔ GAA + Orn; and (C) KhArg/KGAA values in the organs of the rats at the time of sacrifice upon i.p. administration of the indicated doses of hArg. The Figure was constructed using the data listed in Table 4. Note the logarithmic scale on the y axes.
The KhArg and KGAA values changed over time in dependence of the hArg dose. The Spearman correlation coefficients between KhArg and hArg dose were r = 0.706 (p = 0.03) for the lung, r = 0.739 (p = 0.03) for the kidney, r = 0.778 (p = 0.13) for the heart, and r = 0.905 (p = 0.002) for the liver. The Spearman correlation coefficients between KGAA and hArg dose were inverse and borderline: r = −0.845 (p = 0.07) for the heart. The highest KhArg and KGAA values and greatest changes were observed in the liver. These findings suggest that the liver may play a particular role in the catabolism of pharmacological hArg. The highest correlation after Spearman was observed between liver and lung for KhArg (r = 0.683, p = 0.05; see Figure 11A). The highest correlation after Spearman was observed between the kidney and heart for KGAA but failed statistical significance (r = −0.657, p = 0.18). Interestingly, the “time-courses” of KhArg and KGAA were opposite in the heart (Figure 11). The “time-course” of the KhArg/KGAA ratio in the heart indicates that the greatest decreases were observed at 28 min and 64 min, presumably due to the presence of isoprenaline in this time window. The KhArg/KGAA ratio corresponds to the product ([hArg]/[GAA]) × ([Gly]/[Lys]).
2.10. Putrescine and Spermidine in Organ Homogenates
Polyamine putrescine (PUT) is the decarboxylation product of Orn and is further metabolized to spermidine (SPD). The putrescine:spermidine (PUT/SPD) molar ratio is generally considered a useful indicator of polyamine catabolism. In the rat R17, which did not receive isoprenaline but did receive the highest hArg dose, the PUT/SPD molar ratio was highest in the heart, very close in the lung and kidney, and lowest in the liver 14 min after hArg administration (Figure 12). When considering all other rats, the mean PUT/SPD molar ratio was lower in the heart (1.1 vs. 1.5; n = 4) and in the lung (0.71 vs. 0.83, n = 7), higher in the kidney (1.11 vs. 0.86, n = 6) and in the liver (0.31 vs. 0.12, n = 6) in the rats administered with isoprenaline.
Figure 12.

Putrescine-to-spermidine molar ratio in the organs of the rats administered with isoprenaline (left panel) and in a rat (R17) that did not receive isoprenaline (right panel). The rats received various doses of hArg. R17 received an hArg dose of 440 mg/kg. See also Table 1.
3. Discussion
There is evidence of significant inter-organ amino acids transport by blood cells rather than by plasma in humans [37,38]. Blood contributes substantially to the net flux of amino acids from the muscle and gut to the liver in humans, with Ala predominating by way of blood cells as well as of plasma [37]. Dietary hArg at large amounts administered for several days was found to induce imbalances in the homeostasis of various biochemically closely related (Lys, Orn, Arg, Gly) and other less closely related amino acids in plasma and in several organs of fed rats [30]. Dietary hArg was found to completely prevent the rise of Lys concentration in the brain [30]. This effect was less pronounced for Arg and Orn in the brain as well as in the liver and in the muscle of the rats. Chronic oral supplementation of large amounts of creatine to healthy humans was found to alter plasma guanidino compounds including hArg, Arg, and GAA, yet to a much lower extent [31]. An inverse relationship between plasma GAA and plasma creatinine was observed, suggesting creatine as a regulator of AGAT activity rather than of AGAT expression in humans [31]. Yet, given the supplementation of creatine at high amounts, the observed changes should be considered rather minor, presumably due to the low repressor effect of creatine on the AGAT activity. In the present study, we investigated the effects of pharmacological hArg on the amino acids’ homeostasis in the liver, kidney, heart, and lung in the rat model of isoprenaline-induced TTC. For this, we measured the concentrations of free and proteinic amino acids in the remaining specimens collected previously [29].
In the rat model of isoprenaline-induced TTC [28], a single i.p. injection of hArg (20, 220, 440 mg hArg per kg body weight; 440 mg hArg ≈ 2.3 mmol) resulted in the dose-dependent distribution of hArg in plasma and investigated organs [29]. The hArg plasma concentration ranged between about 2 µM and 1300 µM, and hArg disappeared from the rat plasma with a half-life in the order of 20 to 40 min [29]. Despite the high i.p. doses, hArg resulted in relatively small changes in the tissue and free plasma concentrations of its relatives, i.e., Arg, ADMA, and GAA [29]. The plasma Arg concentration ranged between 160 µM and 260 µM, suggesting Arg as a major metabolite of hArg [29]. The changes in nitrite and nitrate, the major metabolites of Arg-derived nitric oxide (NO), were marginal. In this rat model of TTC, we also observed a close correlation between tissue hArg and its decarboxylation product homoagmatine (hAgm): r = 0.904 (p = 7.3 × 10⁻¹²) [17]. This observation strongly suggests the ODC-catalyzed conversion of hArg to hAgm, albeit to a low extent (34.8 [4.6–270] nM; range, 0.2 to 698 nM). Correlations were also observed between hAgm and Glu + Gln (r = 0.489, p = 0.0061) or hAgm and Met (r = 0.416, p = 0.022), suggesting a role of these amino acids in the expression and/or activity of ODC and presumably of other decarboxylases. In healthy subjects, oral administration of low-dosed hArg increased plasma free Lys concentration suggesting the conversion of pharmacological hArg to Lys [13] as observed previously for dietary hArg [30]. In the rat, we found that endogenous hArg and Lys are closely interrelated, independent of rat age and diet [39]. In the present study, we investigated the effects of i.p.-administered hArg to anesthetized rats on the distribution of several free and proteinic amino acids in the main organs of the rat. The focus of our study was on Lys being a major metabolite of hArg.
With the exception of hArg, the plasma concentration of free amino acids did not change considerably in the study, presumably due to their rapid transport through the rapid circulating blood. The tissue concentration of free Lys, hArg, and Arg ranged between 96 µM and 1138 µM, 0.6 µM and 444 µM, and 7.3 µM and 767 µM, respectively. Ranges in this order of magnitude and even higher have been reported in rats administered chronically with large amounts of Lys and hArg [30]. The time-dependent opposite changes of considerable extent observed for the concentration of free hArg and Lys in the kidney and heart suggest that administered hArg is distinctly managed than Lys in the rat in these organs, and that dietary hArg and its metabolite Lys are closely interrelated. In our study, we did not analyze the rat brain for amino acids so we cannot confirm an opposite interaction of co-administered Lys and hArg in the rat brain [30]. Considerable changes in tissue amino acid concentrations were observed in our study in the time interval in which isoprenaline is present in the rats. Our results suggest that isoprenaline may be responsible for shifts in free and proteinic amino acids in the rat organs. It seems that isoprenaline contributed to the temporary increase in the Lys content in the heart until 60 min and a concomitant decrease in the Lys content in the other organs in the same period. The greatest and opposite changes in the contents of free and proteinic amino acids occurred in the heart, possibly suggesting that significant proteolysis may have occurred followed by protein synthesis. Isoprenaline, at concentrations of 10 nM to 1000 nM, was found to increase cardiac troponin I (a Lys-rich protein) via release and degradation in isolated rabbit heart [40]. These concentrations are presumably much lower than the isoprenaline concentrations in our study. Isoprenaline was also found to proteolyze troponin I in vivo in the rat [41]. In isoproterenol-induced cardiac hypertrophy in mice, the proteasome function was found to be altered after 30 min [42]. The lysyl oxidase (LOX) family catalyzes the conversion of lysine residues in proteins into highly reactive aldehydes that form cross-links in extracellular matrix proteins. LOX is considered to play a role in cardiac function and disease [43] and may be involved in the isoprenaline-induced TTC [44]. The effects of isoprenaline on proteolysis and LOX in the isoprenaline-induced TTC were not addressed in the present study and warrant further investigations.
Lys, Arg, hArg, Gly, and GAA are closely inter-connected in the AGAT pathway (Scheme 1). Our results suggest that GAA, a non-proteinic guanidino amino acid, behaved analogous to Lys with drastic (almost 100-fold) inter-changes in the heart and kidney. This finding may be an indication for the attempt of the rat organism to support the heart with energy, as GAA may compensate the heart in case of insufficient creatine provision [45,46,47].
In addition to the amino acids discussed above, we observed changes in other amino acids, including Glu/Gln, Cit/Orn, Pro, and Arg that argue for multiple effects of hArg and isoprenaline on other pathways including the metabolism of free amino acids and post-translational modifications (PTM) of amino acid residues in proteins including citrullination [22]. Arg-dimethylation and citrullination are two major PTMs that play important roles in many diseases including heart failure and arthritis [22,48]. In the present study, we observed comparable citrullination levels in the heart, kidney, and lung, which were on average about two times lower than in the liver. As citrullination was independent of the hArg dose, hArg and isoprenaline are likely not to modulate citrullination in the rat. The molar ratio of free Arg to the sum of free Cit and Orn is a measure of global Arg bioavailability (GABR). In contrast to citrullination, the GABR was lowest in the liver suggesting high arginase activity in this organ. hArg is a poor substrate for arginase [13], yet this enzyme is likely to have hydrolyzed a rather minor part of administered hArg to Lys in the liver of the rats.
Isoprenaline has been shown to regulate arginase expression [49,50,51]. In rats in which isoprenaline induced cardiac hypertrophy, long-term administration of L-arginine (800 mg/kg/day) has been reported to inhibit cardiac hypertrophy by increasing moderately NO and polyamines synthesis by elevating the expression of NO synthases and ODC, respectively [52]. In a long-term experiment in rats, isoprenaline elevated ODC activity, putrescine, spermidine, and spermine levels in the rat heart, while additional treatment with α-difluoromethylornithine (DFMO), a specific inhibitor of ODC activity and polyamine synthesis, attenuated the isoprenaline-induced effects of isoprenaline [53]. When considering all rats, which were treated with hArg and isoprenaline in our study, the mean PUT/SPD molar ratio, an indicator of polyamines synthesis, was lower in the heart and lung, higher in the kidney and liver compared to the rat treated with hArg only. Yet, the effects of isoprenaline (50 mg/kg) on polyamines synthesis are difficult to be evaluated in our study, because there was only one rat (R17) that was not treated with isoprenaline but did receive the highest hArg dose of 400 mg/kg. R17 died 14 min after hArg administration, just 1 min prior to planned isoprenaline administration. In this context, it should be noted that isoprenaline was found to elevate ODC activity and polyamine synthesis in a time-dependent manner in different regions of the rat heart [54]. In the left atrium, isoprenaline (subcutaneous 20 mg/kg) increased the PUT/SPD molar ratio from about 0.4 at baseline to the highest value of about 0.6 reached at 4 h after isoprenaline, with PUT increasing much stronger than SPD [54]. With respect to NO synthesis, the changes we observed for nitrite and nitrate in plasma and tissue were very small [29] and may indicate that administration of hArg did not influence the expression and activity of NO synthases (NOS) in our study. hArg is a substrate for NOS, yet it is also a competitor to Arg and may eventually lead to decreased NO synthesis, notably at higher hArg concentrations [55], as those measured in our study.
In humans, Lys is also catabolized to Glu, 2-amino-adipic acid, and acetyl-CoA [56]. In the skeletal muscle of the hemicorpus of the rat, isoprenaline (at 1 µM) inhibited the accumulation of many amino acids, while it increased the loss of other amino acids including Glu [57]. The isoprenaline-induced changes in amino acids were found to be in part (by about 20%) due to a decrease in protein degradation, with protein synthesis being largely unaffected by isoprenaline [57]. At high doses, Lys and Arg (each 2.64 g/day) treatment for a week was found to decrease salivary cortisol in males but not in females [58], indicating another potential action of Lys and Arg. Lys and Arg administration to rats reduced the effects of cerebral ischemic insults and inhibited Glu-induced neuronal activity [59]. It is noticeable that Lys acts like a partial serotonin receptor 4 antagonist and inhibits serotonin-mediated intestinal pathologies and anxiety in rats [60]. Whether the above-mentioned effects occurred in our study, is unknown as we did not analyze other organs of the rats besides the liver, heart, lung, and kidney. The high correlation coefficients between free Lys and Glu + Gln in the lung, kidney, and heart may suggest that Lys and its metabolite Glu/Gln [56] play a role in these organs and are affected by isoprenaline. It is noticeable that isoprenaline is assumed to have changed the rat urine metabolome [61]. The results of the present study obtained from analyses of plasma and tissue samples of isoprenaline-induced TTC in rats are supportive of this assumption including the changes seen in Sarc concentrations.
In healthy young volunteers, oral administration of hArg (125 mg/day) resulted in increases in hArg and Lys plasma concentrations without changes in pulse wave velocity (PWV), augmentation index (AIx), flow-mediated vasodilatation (FMD), corticospinal excitability, and cortical excitability [62]. In this study, plasma Lys concentration increased by about 8% compared to placebo supplementation [13]. The same dose also did not reveal any appreciable effects on cognition in healthy humans [63]. Oral administration of hArg to C57BL6 mice resulted in increased hArg plasma concentrations compared with vehicle-treated C57BL6 mice (0.15 ± 0.01 versus 0.20 ± 0.02 µM). hArg treatment decreased infarct sizes and improved neurological scores in a dose-dependent manner [64]. These observations may suggest that much higher hArg doses may be required to achieve pharmacological effects in humans than in murine models of myocardial infarction.
Potential limitations of our study are the relatively small number of rats, the lack of a control group, the lack of cardiac parameters, and the lack of tissue material from the gut, muscle, and brain that hampered a more comprehensive investigation and elucidation of underlying mechanisms. Nevertheless, our pilot study provides sufficient information for performing a more sophisticated study on the metabolism of hArg in the rat, on the effects of hArg and isoprenaline in the heart and other rat organs by measuring various biochemical and pharmacodynamic parameters.
4. Materials and Methods
The distribution and the metabolism of pharmacological hArg to Arg and its metabolites from the Arg/NO pathway in a rat model of isoprenaline-induced cardiomyopathy [28] have been described in detail elsewhere [29]. Sprague-Dawley rats (10 weeks old, 250 g body weight on average) received humane care and the study protocol complied with the institutional guidelines of the Sahlgrenska University Hospital (Gothenburg, Sweden). Saline (as a control; dose D of 0 mg hArg/kg; D0) and hArg hydrochloride solutions in saline of various doses were injected intra-peritoneally (i.p.) into the anesthetized rats. Fifteen minutes after injection of saline (D0) or hArg solution in saline (D1, 20 mg/kg; D2, 220 mg/kg; D3, 440 mg/kg), isoprenaline was injected i.p. at the fixed dose of 50 mg/kg. Rats were sacrificed at varying times after a bolus dose of pentobarbital (50 mg/kg) [28]. Heart, lung, liver, and kidneys were obtained from the sacrificed rats (Table 1). Rat #17 (R17) did not receive isoprenaline because it died 14 min after hArg administration, i.e., just prior to the planned isoprenaline administration. Organs were washed with ice-cold physiological saline and stored immediately at −80 °C. After their transport on dry ice to the Hannover Medical School (Hannover, Germany), the organs were stored at −20 °C until further processing. Homogenization of weighed ice-cooled tissue (about 100 mg of each organ) was performed in 1 mL aliquots of ice-cooled phosphate-buffered saline, pH 7.2, as described previously [29]. The concentration of free and proteinic amino acids was determined by GC-MS in 10 µL aliquots of tissue homogenates [29] using trideuteromethyl esters of amino acids that served as internal standards as described elsewhere [35]. Free amino acids were measured in 10 µL aliquots of the homogenates after their incubation with 6 M HCl for 20 h at room temperature to avoid proteolysis. Total amino acids, i.e., free and proteinic amino acids, were measured after classical proteolysis in homogenates with 6 M HCl for 20 h at 110 °C. The concentration of proteinic amino acids was calculated by difference. The tissue-free polyamines putrescine and spermidine were analyzed by GC-MS as described previously after selective extraction and derivatization with pentafluoropropionic anhydride [17]. GC-MS analyses were carried out on an apparatus model ISQ from ThermoFisher (Dreieich, Germany).
Data are reported as the mean ± standard deviation (SD) for normally distributed data and as the median with interquartile range for skewed data. Correlations between groups were performed after Spearman. Statistical analysis and preparation of graphs were performed with GraphPad Prism (version 7 for Windows, La Jolla, CA, USA).
5. Conclusions
Our study shows remarkable changes in free and proteinic amino acids in the rat organs. The equilibria of the AGAT-catalyzed reactions are dependent on hArg dose and time. Considerable antidromic effects were observed in the heart for the two AGAT-catalyzed reactions notably in the time window of 15–90 min, in which i.p.-administered isoprenaline is present in the rat organism. hArg and Sarc are closely and positively correlated in the heart.
Acknowledgments
The author acknowledges the contribution of Joel Lundgren (Department of Cardiology, Sahlgrenska University Hospital, Gothenburg, Sweden) for performing the animal study. The author thanks Duygu Naile Günes, Arslan Arinc Kayacelebi, Alexander Bollenbach, and Bibiana Beckmann (Hannover Medical School) for technical and administrative support.
Supplementary Materials
The following are available online at https://www.mdpi.com/article/10.3390/ijms23094734/s1.
Author Contributions
Conceptualization, D.T.; methodology, D. and B.R.; validation, D.T.; formal analysis, D.T.; investigation, D.T. and B.R.; resources, D.T and B.R.; data curation, D.T.; writing—review and editing, D.T. and B.R.; supervision, D.T and B.R.; All authors have read and agreed to the published version of the manuscript.
Funding
This research received no external funding.
Institutional Review Board Statement
All animals received humane care and the study protocol complied with the institutional guidelines of the Sahlgrenska University Hospital (Gothenburg, Sweden).
Informed Consent Statement
The study did not involve humans.
Data Availability Statement
The study did not report any data.
Conflicts of Interest
The authors declare no conflict of interest.
Footnotes
Publisher’s Note: MDPI stays neutral with regard to jurisdictional claims in published maps and institutional affiliations.
References
- 1.Tsikas D., Wu G. Homoarginine, arginine, and relatives: Analysis, metabolism, transport, physiology, and pathology. Amino Acids. 2015;47:1697–1702. doi: 10.1007/s00726-015-2055-5. [DOI] [PubMed] [Google Scholar]
- 2.Humm A., Fritsche E., Steinbacher S., Huber R. Crystal structure and mechanism of human L-arginine:glycine amidinotransferase: A mitochondrial enzyme involved in creatine biosynthesis. EMBO J. 1997;16:3373–3385. doi: 10.1093/emboj/16.12.3373. [DOI] [PMC free article] [PubMed] [Google Scholar]
- 3.Watanabe Y., Van Pilsum J.F., Yokoi I., Mori A. Synthesis of neuroactive guanidino compounds by rat kidney L-arginine: Glycine amidinotransferase. Life Sci. 1994;55:351–358. doi: 10.1016/0024-3205(94)00645-8. [DOI] [PubMed] [Google Scholar]
- 4.März W., Meinitzer A., Drechsler C., Pilz S., Krane V., Kleber M.E., Fischer J., Winkelmann B.R., Böhm B.O., Ritz E., et al. Homoarginine, cardiovascular risk, and mortality. Circulation. 2010;122:967–975. doi: 10.1161/CIRCULATIONAHA.109.908988. [DOI] [PubMed] [Google Scholar]
- 5.Pilz S., Meinitzer A., Tomaschitz A., Drechsler C., Ritz E., Krane V., Wanner C., Boehm B.O., März W. Low homoarginine concentration is a novel risk factor for heart disease. Heart. 2011;97:1222–1227. doi: 10.1136/hrt.2010.220731. [DOI] [PubMed] [Google Scholar]
- 6.Pilz S., Meinitzer A., Gaksch M., Grübler M., Verheyen N., Drechsler C., Hartaigh B.Ó., Lang F., Alesutan I., Voelkl J., et al. Homoarginine in the renal and cardiovascular systems. Amino Acids. 2015;47:1703–1713. doi: 10.1007/s00726-015-1993-2. [DOI] [PubMed] [Google Scholar]
- 7.Atzler D., Schwedhelm E., Choe C.U. L-homoarginine and cardiovascular disease. Curr. Opin. Clin. Nutr. Metab. Car. 2015;18:83–88. doi: 10.1097/MCO.0000000000000123. [DOI] [PubMed] [Google Scholar]
- 8.Frenay A.R., Kayacelebi A.A., Beckmann B., Soedamah-Muhtu S.S., de Borst M.H., van den Berg E., van Goor H., Bakker S.J., Tsikas D. High urinary homoarginine excretion is associated with low rates of all-cause mortality and graft failure in renal transplant recipients. Amino Acids. 2015;47:1827–1836. doi: 10.1007/s00726-015-2038-6. [DOI] [PubMed] [Google Scholar]
- 9.Kayacelebi A.A., Minović I., Hanff E., Frenay A.S., de Borst M.H., Feelisch M., van Goor H., Bakker S.J.L., Tsikas D. Low plasma homoarginine concentration is associated with high rates of all-cause mortality in renal transplant recipients. Amino Acids. 2017;49:1193–1202. doi: 10.1007/s00726-017-2420-7. [DOI] [PubMed] [Google Scholar]
- 10.Hanff E., Said M.Y., Kayacelebi A.A., Post A., Minovic I., van den Berg E., de Borst M.H., van Goor H., Bakker S.J.L., Tsikas D. High plasma guanidinoacetate-to-homoarginine ratio is associated with high all-cause and cardiovascular mortality rate in adult renal transplant recipients. Amino Acids. 2019;51:1485–1499. doi: 10.1007/s00726-019-02783-6. [DOI] [PubMed] [Google Scholar]
- 11.Reczkowski R.S., Ash D.E. Rat liver arginase: Kinetic mechanism, alternate substrates, and inhibitors. Arch. Biochem. Biophys. 1994;312:31–37. doi: 10.1006/abbi.1994.1276. [DOI] [PubMed] [Google Scholar]
- 12.Moali C., Boucher J.L., Sari M.A., Stuehr D.J., Mansuy D. Substrate specificity of NO synthases: Detailed comparison of L-arginine, homo-L-arginine, their N omega-hydroxy derivatives, and N omega-hydroxynor-L-arginine. Biochemistry. 1998;37:10453–10460. doi: 10.1021/bi980742t. [DOI] [PubMed] [Google Scholar]
- 13.Bollenbach A., Cordts K., Hanff E., Atzler D., Choe C.U., Schwedhelm E., Tsikas D. Evidence by GC-MS that lysine is an arginase-catalyzed metabolite of homoarginine in vitro and in vivo in humans. Anal. Biochem. 2019;577:59–66. doi: 10.1016/j.ab.2019.04.019. [DOI] [PubMed] [Google Scholar]
- 14.Ryan W.L., Barak A.J., Johnson R.J. Lysine, homocitrulline, and homoarginine metabolism by the isolated perfused rat liver. Arch. Biochem. Biophys. 1968;123:294–297. doi: 10.1016/0003-9861(68)90137-9. [DOI] [PubMed] [Google Scholar]
- 15.Rodionov R.N., Oppici E., Martens-Lobenhoffer J., Jarzebska N., Brilloff S., Burdin D., Demyanov A., Kolouschek A., Leiper J., Maas R., et al. A novel pathway for metabolism of the cardiovascular risk factor homoarginine by alanine:glyoxylate aminotransferase 2. Sci. Rep. 2016;6:35277. doi: 10.1038/srep35277. [DOI] [PMC free article] [PubMed] [Google Scholar]
- 16.Martens-Lobenhoffer J., Emrich I.E., Zawada A.M., Fliser D., Wagenpfeil S., Heine G.H., Bode-Böger S.M. L-Homoarginine and its AGXT2-metabolite GOCA in chronic kidney disease as markers for clinical status and prognosis. Amino Acids. 2018;50:1347–1356. doi: 10.1007/s00726-018-2610-y. [DOI] [PubMed] [Google Scholar]
- 17.Tsikas D., Bollenbach A., Hanff E., Beckmann B., Redfors B. Synthesis of homoagmatine and GC-MS analysis of tissue homoagmatine and agmatine: Evidence that homoagmatine but not agmatine is a metabolite of pharmacological L-homoarginine in the anesthetized rat. Amino Acids. 2020;52:235–245. doi: 10.1007/s00726-019-02808-0. [DOI] [PubMed] [Google Scholar]
- 18.Persson L. Evidence of decarboxylation of lysine by mammalian ornithine decarboxylase. Acta. Physiol. Scand. 1977;100:424–429. doi: 10.1111/j.1748-1716.1977.tb05966.x. [DOI] [PubMed] [Google Scholar]
- 19.Pegg A.E., McGill S. Decarboxylation of ornithine and lysine in rat tissues. Biochim. Biophys. Acta. 1979;568:416–427. doi: 10.1016/0005-2744(79)90310-3. [DOI] [PubMed] [Google Scholar]
- 20.Hallen A., Jamie J.F., Cooper A.J. Lysine metabolism in mammalian brain: An update on the importance of recent discoveries. Amino Acids. 2013;45:1249–1272. doi: 10.1007/s00726-013-1590-1. [DOI] [PMC free article] [PubMed] [Google Scholar]
- 21.Pena I.A., Marques L.A., Laranjeira Â.B., Yunes J.A., Eberlin M.N., MacKenzie A., Arruda P. Mouse lysine catabolism to aminoadipate occurs primarily through the saccharopine pathway; implications for pyridoxine dependent epilepsy (PDE) Biochim. Biophys. Acta. Mol. Basis. Dis. 2017;1863:121–128. doi: 10.1016/j.bbadis.2016.09.006. [DOI] [PubMed] [Google Scholar]
- 22.Tsikas D. Post-translational modifications (PTM): Analytical approaches, signaling, physiology and pathophysiology-part I. Amino Acids. 2021;53:485–487. doi: 10.1007/s00726-021-02984-y. [DOI] [PMC free article] [PubMed] [Google Scholar]
- 23.Flamigni F., Guarnieri C., Caldarera C.M. Heart ornithine decarboxylase from control and isoproterenol-treated rats: Kinetic properties, multiple forms and subcellular distribution. Gen. Pharmacol. 1986;17:31–36. doi: 10.1016/0306-3623(86)90007-8. [DOI] [PubMed] [Google Scholar]
- 24.Guarnieri C., Muscari C., Flamigni F., Caldarera C.R. Effect of catecholamines on ornithine decarboxylase activity monitored in the perfused rat heart. Ital. J. Biochem. 1983;32:77–83. [PubMed] [Google Scholar]
- 25.Guarnieri C., Flamigni F., Muscari C., Caldarera C.M. Involvement of calcium ions in the activation of ornithine decarboxylase by isoprenaline evaluated ’in situ’ in the perfused rat heart. Biochem. J. 1983;212:241–243. doi: 10.1042/bj2120241. [DOI] [PMC free article] [PubMed] [Google Scholar]
- 26.Stefanelli C., Flamigni F., Carati D., Rossoni C. Effect of adrenergic stimulation on ornithine decarboxylase activity in the rat spleen. Gen. Pharmacol. 1986;17:355–357. doi: 10.1016/0306-3623(86)90054-6. [DOI] [PubMed] [Google Scholar]
- 27.Stefanelli C., Carati D., Rossoni C., Flamigni F., Caldarera C.M. Accumulation of N1-acetylspermidine in heart and spleen of isoprenaline-treated rats. Biochem. J. 1986;237:931–934. doi: 10.1042/bj2370931. [DOI] [PMC free article] [PubMed] [Google Scholar]
- 28.Redfors B., Oras J., Shao Y., Seemann-Lodding H., Ricksten S.E., Omerovic E. Cardioprotective effects of isoflurane in a rat model of stress-induced cardiomyopathy (takotsubo) Int. J. Cardiol. 2014;176:815–821. doi: 10.1016/j.ijcard.2014.08.025. [DOI] [PubMed] [Google Scholar]
- 29.Günes D.N., Kayacelebi A.A., Hanff E., Lundgren J., Redfors B., Tsikas D. Metabolism and distribution of pharmacological homoarginine in plasma and main organs of the anesthetized rat. Amino Acids. 2017;49:2033–2044. doi: 10.1007/s00726-017-2465-7. [DOI] [PubMed] [Google Scholar]
- 30.Tews J.K., Harper A.E. Induction in rats of lysine imbalance by dietary homoarginine. J. Nutr. 1986;116:1910–1921. doi: 10.1093/jn/116.10.1910. [DOI] [PubMed] [Google Scholar]
- 31.Derave W., Marescau B., Vanden Eede E., Eijnde B.O., De Deyn P.P., Hespel P. Plasma guanidino compounds are altered by oral creatine supplementation in healthy humans. J. Appl. Physiol. 2004;97:852–857. doi: 10.1152/japplphysiol.00206.2004. [DOI] [PubMed] [Google Scholar]
- 32.Stanescu S., Belanger-Quintana A., Fernandez-Felix B.M., Ruiz-Sala P., Del Valle M., Garcia F., Arrieta F., Martinez-Pardo M. Interorgan amino acid interchange in propionic acidemia: The missing key to understanding its physiopathology. Amino Acids. 2022 doi: 10.1007/s00726-022-03128-6. [DOI] [PMC free article] [PubMed] [Google Scholar]
- 33.Ookhtens M., Kaplowitz N. Role of the Liver in Interorgan Homeostasis of Glutathione and Cyst(e)ine. Semin. Liver. Dis. 1998;18:313–329. doi: 10.1055/s-2007-1007167. [DOI] [PubMed] [Google Scholar]
- 34.Shelly C.L. Glutathione synthesis. Biochim. Biophys. Acta. 2013;1830:3143–3153. doi: 10.1016/j.bbagen.2012.09.008. [DOI] [PMC free article] [PubMed] [Google Scholar]
- 35.Hanff E., Ruben S., Kreuzer M., Bollenbach A., Kayacelebi A.A., Das A.M., von Versen-Höynck F., von Kaisenberg C., Haffner D., Ückert S., et al. Development and validation of GC-MS methods for the comprehensive analysis of amino acids in plasma and urine and applications to the HELLP syndrome and pediatric kidney transplantation: Evidence of altered methylation, transamidination, and arginase activity. Amino Acids. 2019;51:529–547. doi: 10.1007/s00726-018-02688-w. [DOI] [PubMed] [Google Scholar]
- 36.Hadwiger M.E., Park S., Torchia S.R., Lunte C.E. Simultaneous determination of the elimination profiles of the individual enantiomers of racemic isoproterenol using capillary electrophoresis and microdialysis sampling. J. Pharm. Biomed. Anal. 1997;15:621–629. doi: 10.1016/S0731-7085(96)01896-1. [DOI] [PubMed] [Google Scholar]
- 37.Felig P., Wahren J., Räf L. Evidence of inter-organ amino-acid transport by blood cells in humans. Proc. Natl. Acad. Sci. USA. 1973;70:1775–1779. doi: 10.1073/pnas.70.6.1775. [DOI] [PMC free article] [PubMed] [Google Scholar]
- 38.Thorn B., Dunstan R.H., Macdonald M.M., Borges N., Roberts T.K. Evidence that human and equine erythrocytes could have significant roles in the transport and delivery of amino acids to organs and tissues. Amino Acids. 2020;52:711–724. doi: 10.1007/s00726-020-02845-0. [DOI] [PMC free article] [PubMed] [Google Scholar]
- 39.Baskal S., Dimina L., Tsikas S.A., Mosoni L., Remond D., Mariotti F., Tsikas D. Lysine and homoarginine are closely interrelated metabolites in the rat. Amino Acids. 2022 doi: 10.1007/s00726-022-03158-0. [DOI] [PMC free article] [PubMed] [Google Scholar]
- 40.Felten M.L., Cosson C., Charpentier J., Paradis V., Benhamou D., Mazoit J.X., Edouard A.R. Effect of isoproterenol on the cardiac troponin I degradation and release during early TNFalpha-induced ventricular dysfunction in isolated rabbit heart. J. Cardiovasc. Pharmacol. 2004;44:532–538. doi: 10.1097/00005344-200411000-00004. [DOI] [PubMed] [Google Scholar]
- 41.McConnell B.K., Popovic Z., Mal N., Lee K., Bautista J., Forudi F., Schwartzman R., Jin J.P., Penn M., Bond M. Disruption of protein kinase A interaction with A-kinase-anchoring proteins in the heart in vivo: Effects on cardiac contractility, protein kinase A phosphorylation, and troponin I proteolysis. J. Biol. Chem. 2009;284:1583–1592. doi: 10.1074/jbc.M806321200. [DOI] [PMC free article] [PubMed] [Google Scholar]
- 42.Drews O., Tsukamoto O., Liem D., Streicher J., Wang Y., Ping P. Differential regulation of proteasome function in isoproterenol-induced cardiac hypertrophy. Circ. Res. 2010;107:1094–1101. doi: 10.1161/CIRCRESAHA.110.222364. [DOI] [PMC free article] [PubMed] [Google Scholar]
- 43.Al-U’datt D., Allen B.G., Nattel S. Role of the lysyl oxidase enzyme family in cardiac function and disease. Cardiovasc. Res. 2019;115:1820–1837. doi: 10.1093/cvr/cvz176. [DOI] [PubMed] [Google Scholar]
- 44.Tanaka T., Yamaguchi J., Shoji K., Nangaku M. Anthracycline inhibits recruitment of hypoxia-inducible transcription factors and suppresses tumor cell migration and cardiac angiogenic response in the host. J. Biol. Chem. 2012;287:34866–34882. doi: 10.1074/jbc.M112.374587. [DOI] [PMC free article] [PubMed] [Google Scholar]
- 45.Sasani A., Hornig S., Grzybowski R., Cordts K., Hanff E., Tsikas D., Böger R., Gerloff C., Isbrandt D., Neu A., et al. Muscle phenotype of AGAT- and GAMT-deficient mice after simvastatin exposure. Amino Acids. 2020;52:73–85. doi: 10.1007/s00726-019-02812-4. [DOI] [PubMed] [Google Scholar]
- 46.Balestrino M., Adriano E. Presence of guanidinoacetate may compensate creatine absence and account for less statin-induced muscle damage in GAMT-deficient compared to AGAT-deficient mice. Amino Acids. 2020;52:667–669. doi: 10.1007/s00726-020-02838-z. [DOI] [PubMed] [Google Scholar]
- 47.Neu A., Hornig S., Sasani A., Isbrandt D., Gerloff C., Tsikas D., Schwedhelm E., Choe C.-U. Creatine, guanidinoacetate and homoarginine in statin-induced myopathy. Amino Acids. 2020;52:1067–1069. doi: 10.1007/s00726-020-02865-w. [DOI] [PMC free article] [PubMed] [Google Scholar]
- 48.Fert-Bober J., Giles J.T., Holewinski R.J., Kirk J.A., Uhrigshardt H.L., Crowgey E.L., Andrade F., Bingham C.O., Park J.K., Halushka M.K., et al. Citrullination of myofilament proteins in heart failure. Cardiovasc. Res. 2015;108:232–242. doi: 10.1093/cvr/cvv185. [DOI] [PMC free article] [PubMed] [Google Scholar]
- 49.Bernard A.C., Fitzpatrick E.A., Maley M.E., Gellin G.L., Tsuei B.J., Arden W.A., Boulanger B.R., Kearney P.A., Ochoa J.B. Beta adrenoceptor regulation of macrophage arginase activity. Surgery. 2000;127:412–418. doi: 10.1067/msy.2000.104115. [DOI] [PubMed] [Google Scholar]
- 50.Barksdale A.R., Bernard A.C., Maley M.E., Gellin G.L., Kearney P.A., Boulanger B.R., Tsuei B.J., Ochoa J.B. Regulation of arginase expression by T-helper II cytokines and isoproterenol. Surgery. 2004;135:527–535. doi: 10.1016/j.surg.2003.10.007. [DOI] [PubMed] [Google Scholar]
- 51.Giordano E., Hillary R.A., Vary T.C., Pegg A.E., Sumner A.D., Caldarera C.M., Zhang X.Q., Song J., Wang J., Cheung J.Y., et al. Overexpression of ornithine decarboxylase decreases ventricular systolic function during induction of cardiac hypertrophy. Amino Acids. 2012;42:507–518. doi: 10.1007/s00726-011-1023-y. [DOI] [PMC free article] [PubMed] [Google Scholar]
- 52.Lin Y., Wang L.N., Xi Y.H., Li H.Z., Xiao F.G., Zhao Y.J., Tian Y., Yang B.F., Xu C.Q. L-arginine inhibits isoproterenol-induced cardiac hypertrophy through nitric oxide and polyamine pathways. Basic. Clin. Pharmacol. Toxicol. 2008;103:124–130. doi: 10.1111/j.1742-7843.2008.00261.x. [DOI] [PubMed] [Google Scholar]
- 53.Tipnis U.R., He G.Y., Li S., Campbell G., Boor P.J. Attenuation of isoproterenol-mediated myocardial injury in rat by an inhibitor of polyamine synthesis. Cardiovasc. Pathol. 2000;9:273–280. doi: 10.1016/S1054-8807(00)00038-7. [DOI] [PubMed] [Google Scholar]
- 54.Tipnis U.R., Frasier-Scott K., Skiera C. Isoprenaline induced changes in ornithine decarboxylase activity and polyamine content in regions of the rat heart. Cardiovasc. Res. 1989;23:611–619. doi: 10.1093/cvr/23.7.611. [DOI] [PubMed] [Google Scholar]
- 55.Alesutan I., Feger M., Tuffaha R., Castor T., Musculus K., Buehling S.S., Heine C.L., Kuro-O M., Pieske B., Schmidt K., et al. Augmentation of phosphate-induced osteo-/chondrogenic transformation of vascular smooth muscle cells by homoarginine. Cardiovasc. Res. 2016;110:408–418. doi: 10.1093/cvr/cvw062. [DOI] [PubMed] [Google Scholar]
- 56.Matthews D.E. Review of Lysine Metabolism with a Focus on Humans. J. Nutr. 2020;150((Suppl. 1)):2548S–2555S. doi: 10.1093/jn/nxaa224. [DOI] [PubMed] [Google Scholar]
- 57.Li J.B., Jefferson L.S. Effect of isoproterenol on amino acid levels and protein turnover in skeletal muscle. Am. J. Physiol. 1977;232:E243–E249. doi: 10.1152/ajpendo.1977.232.2.E243. [DOI] [PubMed] [Google Scholar]
- 58.Smriga M., Ando T., Akutsu M., Furukawa Y., Miwa K., Morinaga Y. Oral treatment with L-lysine and L-arginine reduces anxiety and basal cortisol levels in healthy humans. Biomed. Res. 2007;28:85–90. doi: 10.2220/biomedres.28.85. [DOI] [PubMed] [Google Scholar]
- 59.Kondoh T., Kameishi M., Mallick H.N., Ono T., Torii K. Lysine and arginine reduce the effects of cerebral ischemic insults and inhibit glutamate-induced neuronal activity in rats. Front. Integr. Neurosci. 2010;4:18. doi: 10.3389/fnint.2010.00018. [DOI] [PMC free article] [PubMed] [Google Scholar]
- 60.Smriga M., Torii K. l-Lysine acts like a partial serotonin receptor 4 antagonist and inhibits serotonin-mediated intestinal pathologies and anxiety in rats. Proc. Natl. Acad. Sci. USA. 2003;100:15370–15375. doi: 10.1073/pnas.2436556100. [DOI] [PMC free article] [PubMed] [Google Scholar]
- 61.Dallons M., Delcourt M., Schepkens C., Podrecca M., Colet J.M. A Comparative Study of Rat Urine 1H-NMR Metabolome Changes Presumably Arising from Isoproterenol-Induced Heart Necrosis Versus Clarithromycin-Induced QT Interval Prolongation. Biology. 2020;9:98. doi: 10.3390/biology9050098. [DOI] [PMC free article] [PubMed] [Google Scholar]
- 62.Atzler D., Schönhoff M., Cordts K., Ortland I., Hoppe J., Hummel F.C., Gerloff C., Jaehde U., Jagodzinski A., Böger R.H., et al. Oral supplementation with L-homoarginine in young volunteers. Br. J. Clin. Pharmacol. 2016;82:1477–1485. doi: 10.1111/bcp.13068. [DOI] [PMC free article] [PubMed] [Google Scholar]
- 63.Schönhoff M., Weineck G., Hoppe J., Hornig S., Cordts K., Atzler D., Gerloff C., Böger R., Neu A., Schwedhelm E., et al. Cognitive performance of 20 healthy humans supplemented with L-homoarginine for 4 weeks. J. Clin. Neurosci. 2018;50:237–241. doi: 10.1016/j.jocn.2018.01.035. [DOI] [PubMed] [Google Scholar]
- 64.Choe C.U., Atzler D., Wild P.S., Carter A.M., Böger R.H., Ojeda F., Simova O., Stockebrand M., Lackner K., Nabuurs C., et al. Homoarginine levels are regulated by L-arginine: Glycine amidinotransferase and affect stroke outcome: Results from human and murine studies. Circulation. 2013;128:1451–1461. doi: 10.1161/CIRCULATIONAHA.112.000580. [DOI] [PubMed] [Google Scholar]
Associated Data
This section collects any data citations, data availability statements, or supplementary materials included in this article.
Supplementary Materials
Data Availability Statement
The study did not report any data.