

Abstract
Myocardial infarction (MI) is a leading cause of death worldwide, largely because efficient interventions to restore cardiac function after MI are currently lacking. Here, we characterize vascular aberrancies induced by MI, and propose to target acquired endothelial cell (EC) changes to normalize vessels and promote cardiac repair after MI. Single-cell transcriptome analyses of MI-associated ECs indicates that ECs acquire mesenchymal gene signature that result in phenotypic and functional changes and lead to vessel abnormalities. We identify a PDGF/NF-κB/HIF-1α axis that induces Snail expression and mesenchymal phenotypes in ECs under hypoxia, altogether causing aberrant vascularization. EC-specific knockout of PDGFR-β, pharmacological PDGFR inhibition or nanoparticle-based targeted PDGFR-β siRNA delivery in mice attenuates vascular abnormalities in the infarcted tissue and improves cardiac repair after MI. These findings illustrate a mechanism controlling aberrant neovascularization after ischemia, and suggest that targeting PDGF/Snail-mediated endothelial plasticity may offer opportunities for normalizing vasculature and treating ischemic heart diseases.
Editor summary:
Huang et al. show that MI-associated vasculature is structurally and functionally abnormal, which impedes vessel function and cardiac repair in mice. Analyses of the transcriptome of the cardiac endothelium after MI identify a PDGF/NF-kB/HIF-1a/Snail axis responsible for mesenchymal transformation of endothelial cells, and show that genetic ablation or targeted disruption of PDGF signaling normalizes vasculature and improves cardiac function recovery after MI.
INTRODUCTION
Acute myocardial infarction (MI) is one of the leading causes of mortality and morbidity in humans worldwide. Formation of new blood vessels, i.e., neovascularization, leads to blood re-perfusion in the infarcted tissue, and is, therefore, fundamental to cardiac repair and function recovery after MI 1. Therapeutic stimulation of neovascularization has been exploited in last three decades, but the benefit has been small and transient in ischemic heart diseases 2–6. As a potential reason for insufficient recovery and therapeutic difficulties, newly formed vasculatures under an ischemic condition, induced either intrinsically by hypoxia or therapeutically by pro-angiogenic factors, could be associated with vessel abnormalities, e.g., tortuous structure with leakiness and excessive outgrowth and sprouting that have been well characterized in cancerous settings 7,8, which may compromise vessel delivery function and likely impede cardiac repair after MI.
Cell plasticity in endothelial cells (ECs) has been well characterized during embryonic development 9,10. In pathological settings including cardiac, renal, and liver fibrosis, ossifying myositis, pulmonary hypotension, and cerebral cavernous malformation, ECs can undergo endothelial mesenchymal transition (Endo-MT) de novo to generate fibroblasts and stem-like cells 10–12. Recent transcriptome analyses by multispectral endothelial lineage tracing show that mouse ECs exhibit proliferative nature and undergo clonal expansion in the settings of MI, and interestingly these ECs express Endo-MT markers in a time-dependent manner and acquire transient mesenchymal activation 13–15, suggesting that endothelial plasticity may be temporally associated with new vessel growth. Here, we show that MI-associated vasculature is characterized by prominent vessel abnormalities that are associated with robust endothelial plasticity toward partial Endo-MT. We reveal that ECs acquire platelet-derived growth factor (PDGF)/Snail-mediated genetic programming to induce mesenchymal activation but retain endothelial identity and functions, enhancing cell proliferation and migration and disrupting cell-cell adhesion, leading to aberrant neovascularization. Our study suggests that vessel normalization by targeting PDGF-dependent endothelial plasticity may provide a promising strategy for treating ischemic heart diseases.
RESULTS
MI-associated aberrant vascularity
We initially took advantage of a light sheet fluorescence imaging system to analyze vessel function and structure at a whole organ level with Cdh5-CreERT2;Rosa-LSL-tdTomato mice in which tdTomato expression is driven under endothelial cell (EC)-specific promoter Cdh5. MI was induced by ligation of left anterior descending (LAD) coronary artery, followed by lectin perfusion. Strikingly, our analysis revealed that vasculatures in MI area, albeit robustly formed particularly in the board zone, were poorly perfused (Fig. 1a,b), and exhibited a chaotic structure, showing undefined vascular hierarchy (Fig. 1c) with reduced vessel diameter and enhanced branching (Fig. 1d). Moreover, immunofluorescence analysis showed that capillary ECs in MI tissue exhibited abnormal structure, appearing tortuous and disorganized morphology, compared to well organized vasculature in normal left ventricle (LV) (Extended Data Fig. 1a). In accordance with these findings, MI-associated vasculature showed reduced coverage with NG-2+ pericytes and collagen IV, suggesting vessel immaturation in infarcted tissue (Extended Data Fig. 1b,c). These results indicate functional and structural abnormalities in MI-associated vasculature.
Fig. 1. Single-cell RNAseq analysis reveals dynamic endothelial plasticity in MI tissue, associated with vessel aberrancy.
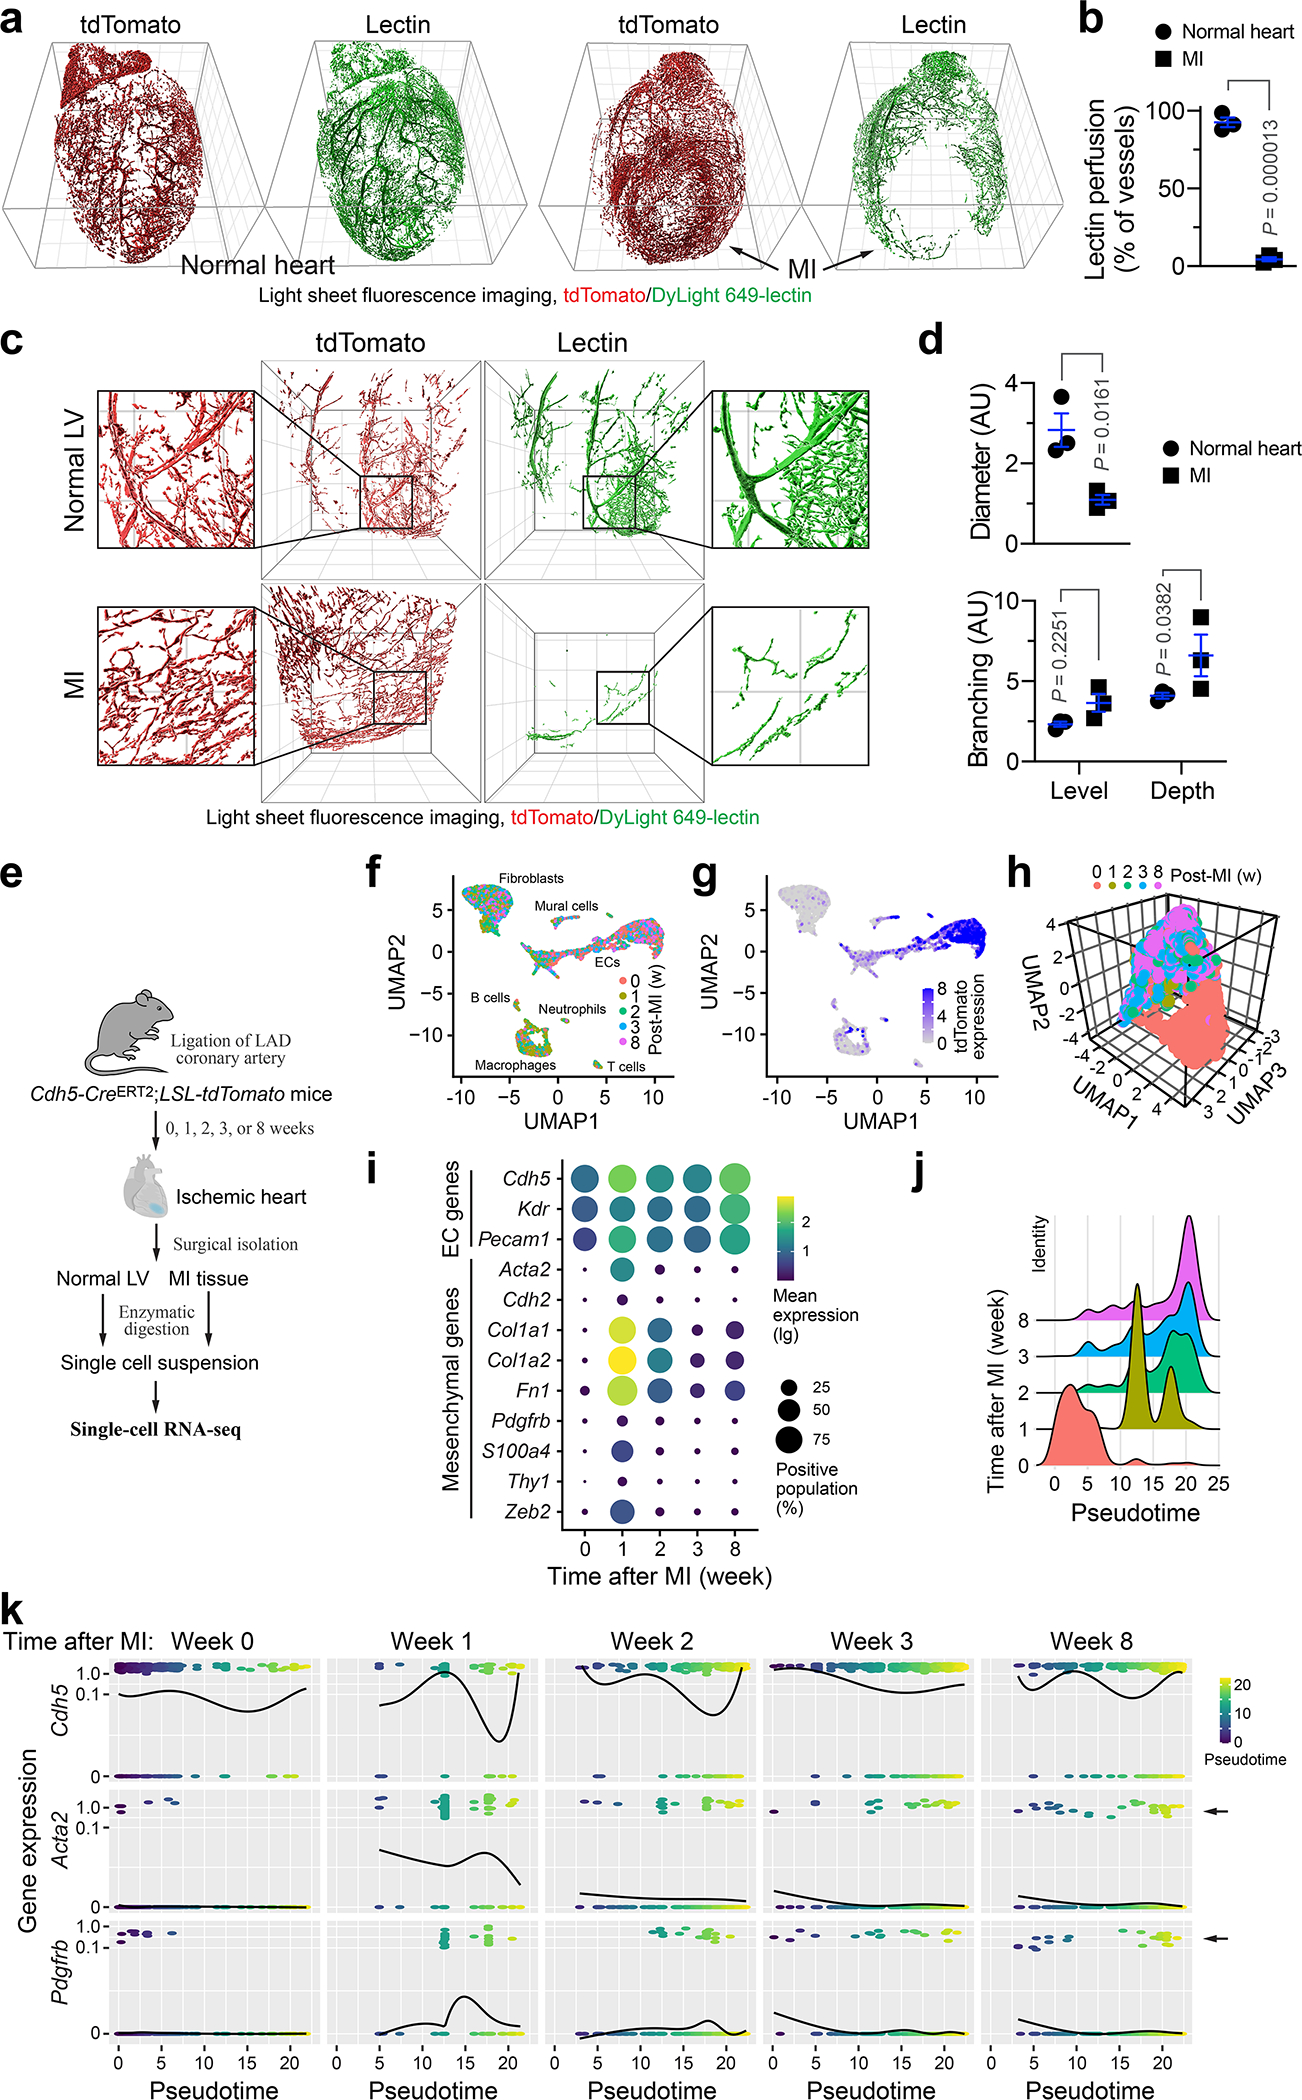
Cdh5-CreERT2;LSL-tdTomato mice were subjected to MI surgery or sham operation. a-d, Mice were intravenously perfused with DyLight 649 labeled-lectin 3 weeks after surgery, and hearts were analyzed by light sheet fluorescence imaging. a,b, Whole-heart imaging. a, Representative images. Grid indicates 1 mm. b, Quantitative results for lectin perfusion in MI area or corresponding normal LV region (n = 3 mice, mean ± SEM). Statistical analysis by two-tailed Student’s t test. c,d, Imaging at MI area or corresponding normal LV region. c, Representative images. Grid indicates 500 μm. d, Quantitative results for vessel diameter and branching (n = 3 mice, mean ± SEM). Statistical analysis by two-tailed Student’s t test (top) and two-way ANOVA (bottom). e-k, Cells derived from MI or LV tissue were analyzed by single-cell RNAseq. e, Schematic approach. f,g, Uniform manifold approximation and projection (UMAP) analysis of transcriptome gene signature in (f) all cells and (g) tdTomato+ cells. h, UMAP analysis of tdTomato+ cells. i, Expression of EC markers and mesenchymal genes in tdTomato+ cells. j,k, TdTomato+ cells were subjected to pseudotime analysis. j, Cells were subjected to cell trajectory construction. k, Gene expression kinetics as a function of pseudotime. Arrows indicate cell populations that express mesenchymal genes Acta2 and Pdgfrb.
Robust endothelial plasticity in MI-associated ECs
To explore the mechanism underlying vascular aberrancy, we investigated the transcriptome alteration in MI-associated ECs by single-cell RNAseq analysis of Cdh5-CreERT2;Rosa-LSL-tdTomato mice (Fig. 1e). Nonlinear dimensionality reduction by uniform manifold approximation and projection (UMAP) analysis of the whole transcriptome gene signature assigned the single cells into several transcriptionally distinct clusters (Fig. 1f), with tdTomato+ EC-derived cells identified and characterized as VE-cadherin+, vascular endothelial growth factor receptor (VEGFR)-2+, and CD31+ cells (Fig. 1g–i). Notably, tdTomato+ ECs expressed mesenchymal-associated markers α-smooth muscle actin (α-SMA, Acta2), N-cadherin (Cdh2), collagen 1 (Cal1a1 and Col1a2), fibronectin (Fn1), PDGFR-β (Pdgfrb), fibroblast-specific protein-1 (FSP-1, S100A4), CD90 (Thy1), and Zeb2 in a time-dependent manner, reaching peaks at week 1 after MI with 20%–70% ECs expressing these mesenchymal genes, followed by a gradual decrease (Fig. 1i). Interestingly, compared with expression of mesenchymal genes, such as Acta2, S100A4, and Col1a1, in a small portion (1–3%) of control normal cardiac ECs, 5–20% MI ECs collected 3 or 8 weeks after MI still expressed some of these genes, suggesting a low-level mesenchymal activation retained for 8 weeks, after a transient and robust activation in the first week (Fig. 1i). Furthermore, pseudotime analysis verified time-dependent cell plasticity in these cells (Fig. 1j), and interestingly showed time-dependent courses of α-SMA and PDGFR-β expression, peaked at week 1 after MI, and sustained in a small cell population during weeks 2–8 after MI, while a small portion of ECs progressed toward expression reduction of EC-specific gene Cdh5 (VE-cadherin) during 1–8 weeks after MI (Fig. 1k), suggesting a temporally regulated trajectory of EC lineage progress to mesenchymal states. Consistent with these findings, a substantial population of ECs in MI area, but not normal ECs, expressed mesenchymal proteins FSP-1 (Fig. 2a).
Fig. 2. ECs acquire mesenchymal phenotypes under MI conditions.
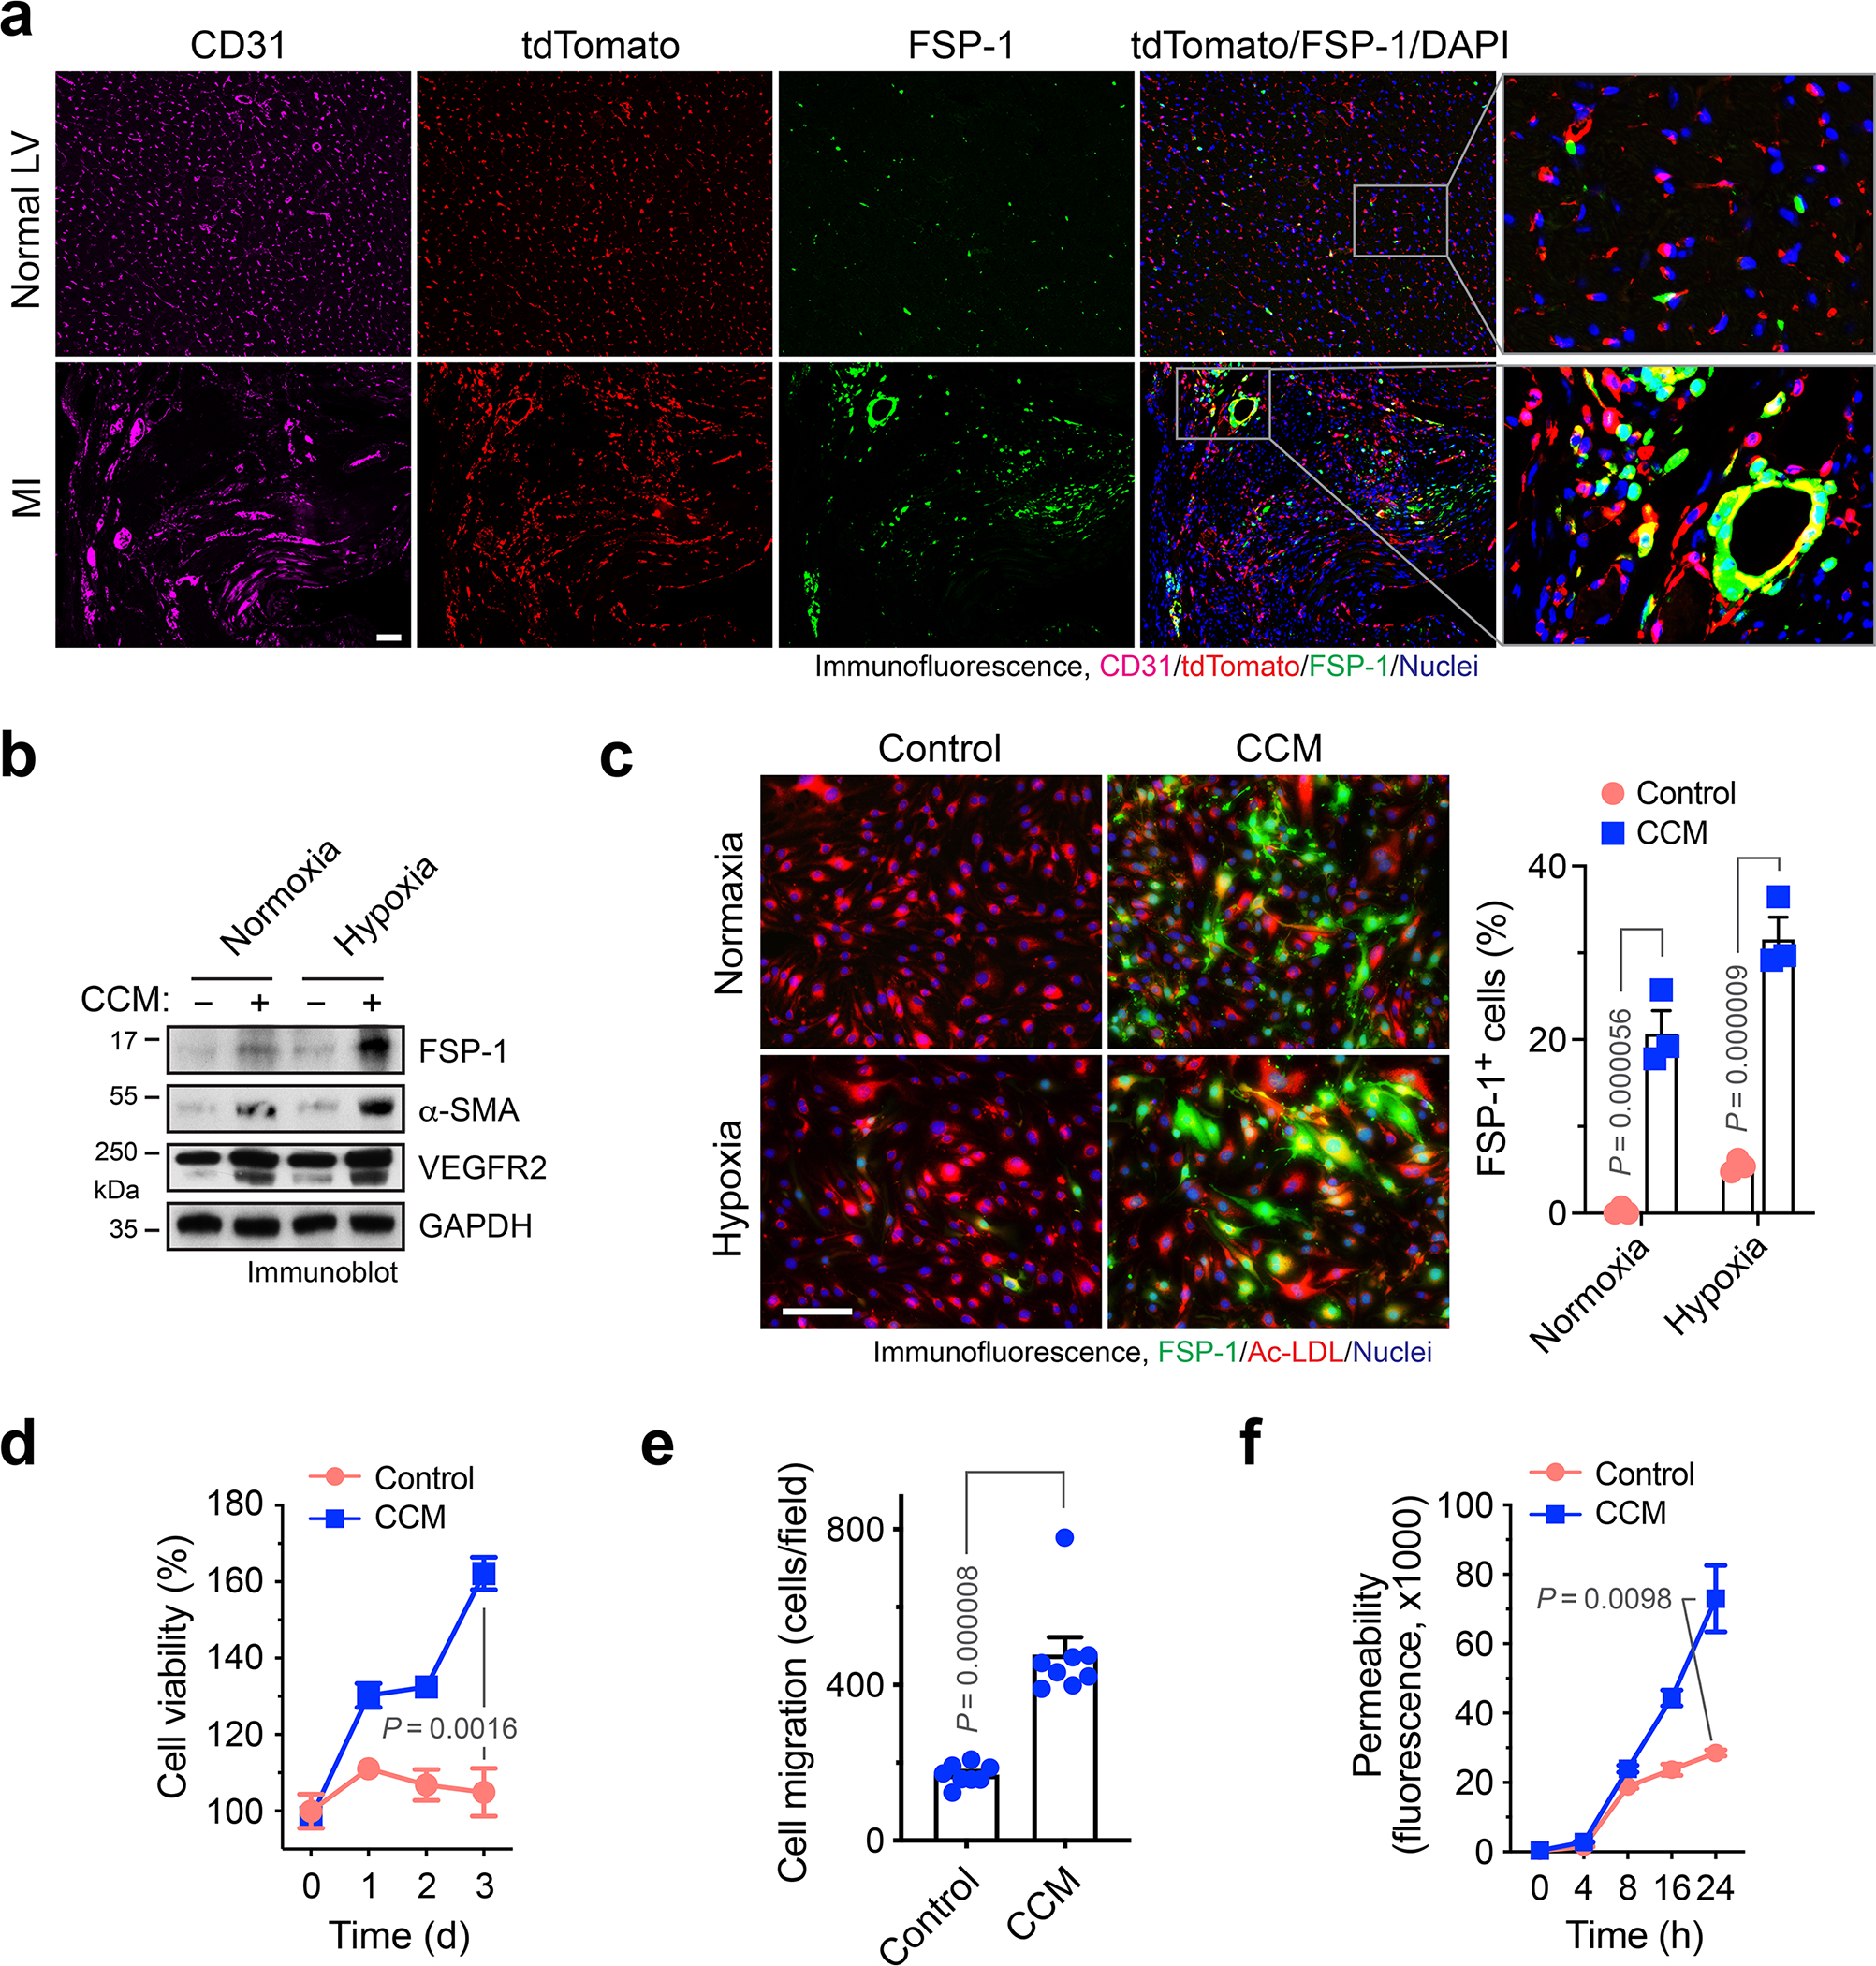
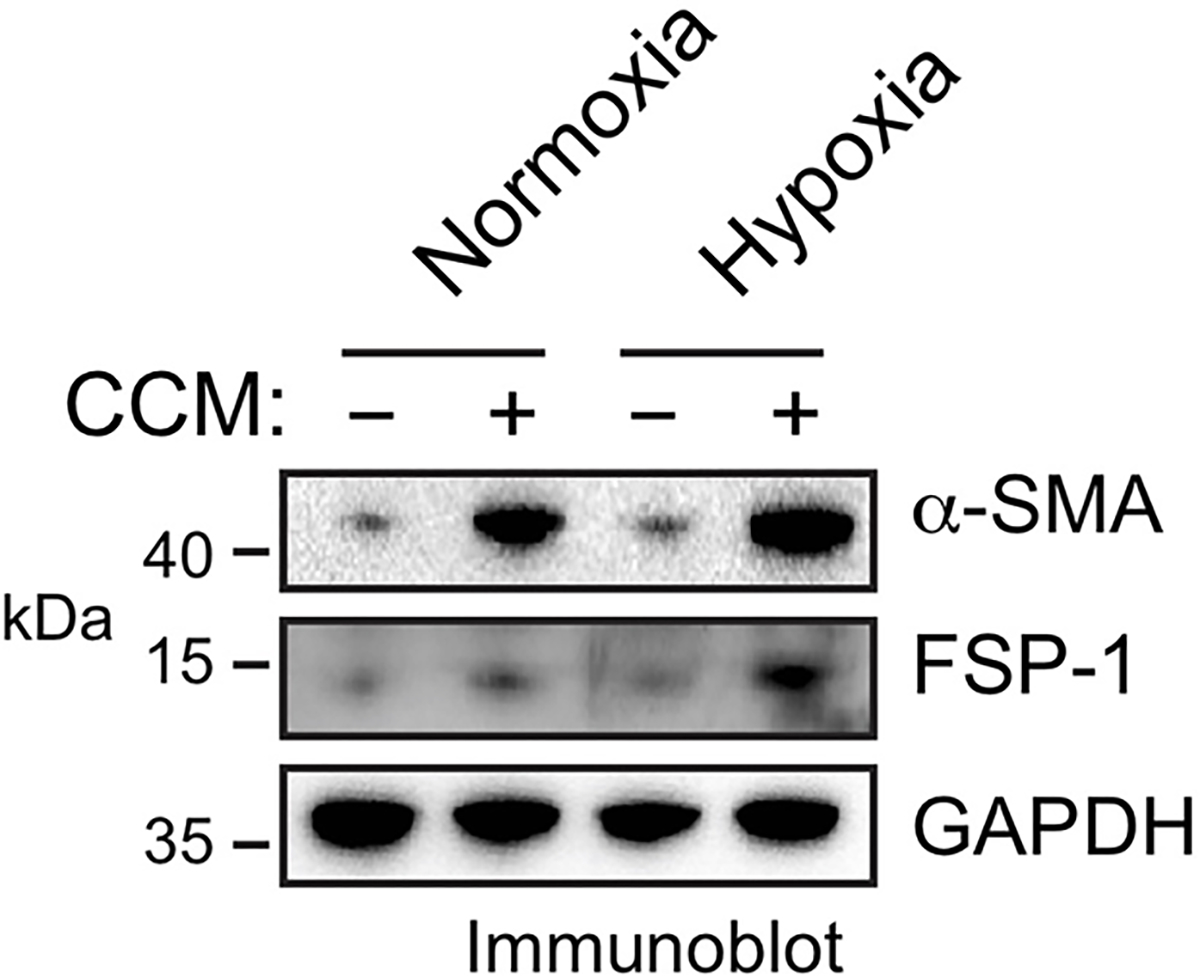
a, Cdh5-CreERT2;LSL-tdTomato mice were subjected to MI surgery or sham operation. Hearts were excised 3 weeks after surgery. Tissue sections were immunostained with anti-FSP-1 and anti-CD31 antibodies. Representative images in normal LV and infarct zone are shown (n = 3 mice). Bars indicate 100 μm. b-f, Mouse cardiac-conditioned medium (CCM) were harvested from primary cardiac fibroblasts and HL-1 cardiomyocytes cultured under hypoxia (1% O2). Mouse cardiac ECs were treated with CCM under normoxia or hypoxia for 2 days, and cultured in normal medium. b, EC lysates were immunoblotted. This experiment was repeated independently twice with similar results. c, ECs were incubated with Dil-Ac-LDL, followed by immunofluorescence analysis with anti-FSP-1 antibody. Left, representative images. Bar indicates 50 μm. Right, quantified results (n = 3 EC samples, mean ± SEM). Statistical analysis by two-way ANOVA. d, EC viability under hypoxia was determined by cell viability analysis (n = 3 EC samples, mean ± SEM). Statistical analysis by two-tailed Student’s t test. e, EC migration was analyzed using transwell (n = 8 EC samples, mean ± SEM). Statistical analysis by two-tailed Student’s t test. f, EC monolayer permeability was analyzed by measuring the fluorescence of diffused FITC-dextran across transwell membrane (n = 3 EC samples, mean ± SEM). Statistical analysis by two-tailed Student’s t test.
ECs acquire mesenchymal phenotypes under MI conditions
Considering tumor ECs undergo endothelial mesenchymal transition (Endo-MT) via cell plasticity to enhance cell proliferation and migration and reduce cell-cell adhesion 16,17, our findings suggest that ECs may acquire similar mesenchymal phenotypes to induce vessel abnormalities after MI. To test it, the effects of cardiac-conditioned medium (CCM) on mesenchymal gene expression and cell functions were analyzed in normal cardiac microvascular ECs. CCM was harvested from culture medium of mouse cardiac HL-1 myocytes and primary cardiac fibroblasts under hypoxia. Exposure of ECs to CCM induced marked increases in FSP-1 and α-SMA expression under hypoxia, or to a lesser extent, under normoxia (Fig. 2b). Similar effects were induced by treatment with CCM harvested from primary mouse cardiomyocytes (Extended Data Fig. 2). Furthermore, immunofluorescence analysis showed that CCM induced FSP-1 expression in more than 30% of ECs under hypoxia and caused a cell morphology shift from the characteristic cobblestone appearance to fibroblast-like, spindle-shaped cells with spikes (Fig. 2c), suggesting a potential lineage alteration. However, these treated cells still expressed VEGFR2 (Fig. 2b) and were able to uptake Ac-LDL that acts as a proxy and a functional readout for ECs (Fig. 2c), suggesting that key endothelial identity and function are retained in these treated cells, even after EC acquires mesenchymal gene signature. Furthermore, CCM maintained/stimulated cell proliferation under hypoxia (Fig. 2d), increased cell migration (Fig. 2e), and enhanced monolayer permeability (Fig. 2f). Together, these data suggest that ECs acquire mesenchymal phenotypes to induce vessel abnormalities under MI conditions.
Robust endothelial plasticity after MI
To explore the regulatory mechanism that controls EC plasticity, we performed bulk deep RNAseq in sorted ECs derived from MI and healthy LV tissues, based on Tie2-Cre;Rosa-LSL-tdTomato-mediated endothelial lineage tracing. Considering non-EC myeloid cells may also express Tie2 18, we sorted tdTomato+F4/80− cells by flow cytometry to exclude F4/80+ macrophage population (Fig. 3a). The amount of yielded RNA (0.5 – 5.0 ng/mouse from sorted F4/80−tdTomato+ cells) was not sufficient for conventional RNAseq analysis, and the extracted RNA was therefore subjected to linear RNA amplification prior to RNAseq. Dimensionality reduction by principal component (PC) analysis of the gene expression showed a lineage switch in MI-associated ECs, compared to normal ECs (Fig. 3b). Global analysis of whole transcriptome indicated an increase in expression of about 1/4 of all genes as well as a decrease in expression of fewer genes (Fig. 3c,d). Interestingly, RNAseq analysis showed substantial up-regulation (> 10 folds) of mesenchymal genes including S100a4 (FSP-1), Acta2 (α-SMA), Cdh2 (N-cadherin), Pdgfra/b (PDGF receptor-α/β), and Met (c-Met) in MI ECs, compared with normal ECs (Fig. 3e), and upregulated expression of S100a4 and Acta2 was verified by RT-PCR analysis (Extended Data Fig. 3). These findings confirm robust endothelial plasticity to acquire mesenchymal-like transcriptional activation in MI ECs.
Fig. 3. Linear RNA amplification and transcriptome analysis identifies PDGF as a critical regulator of endothelial plasticity and dysfunctions under MI.
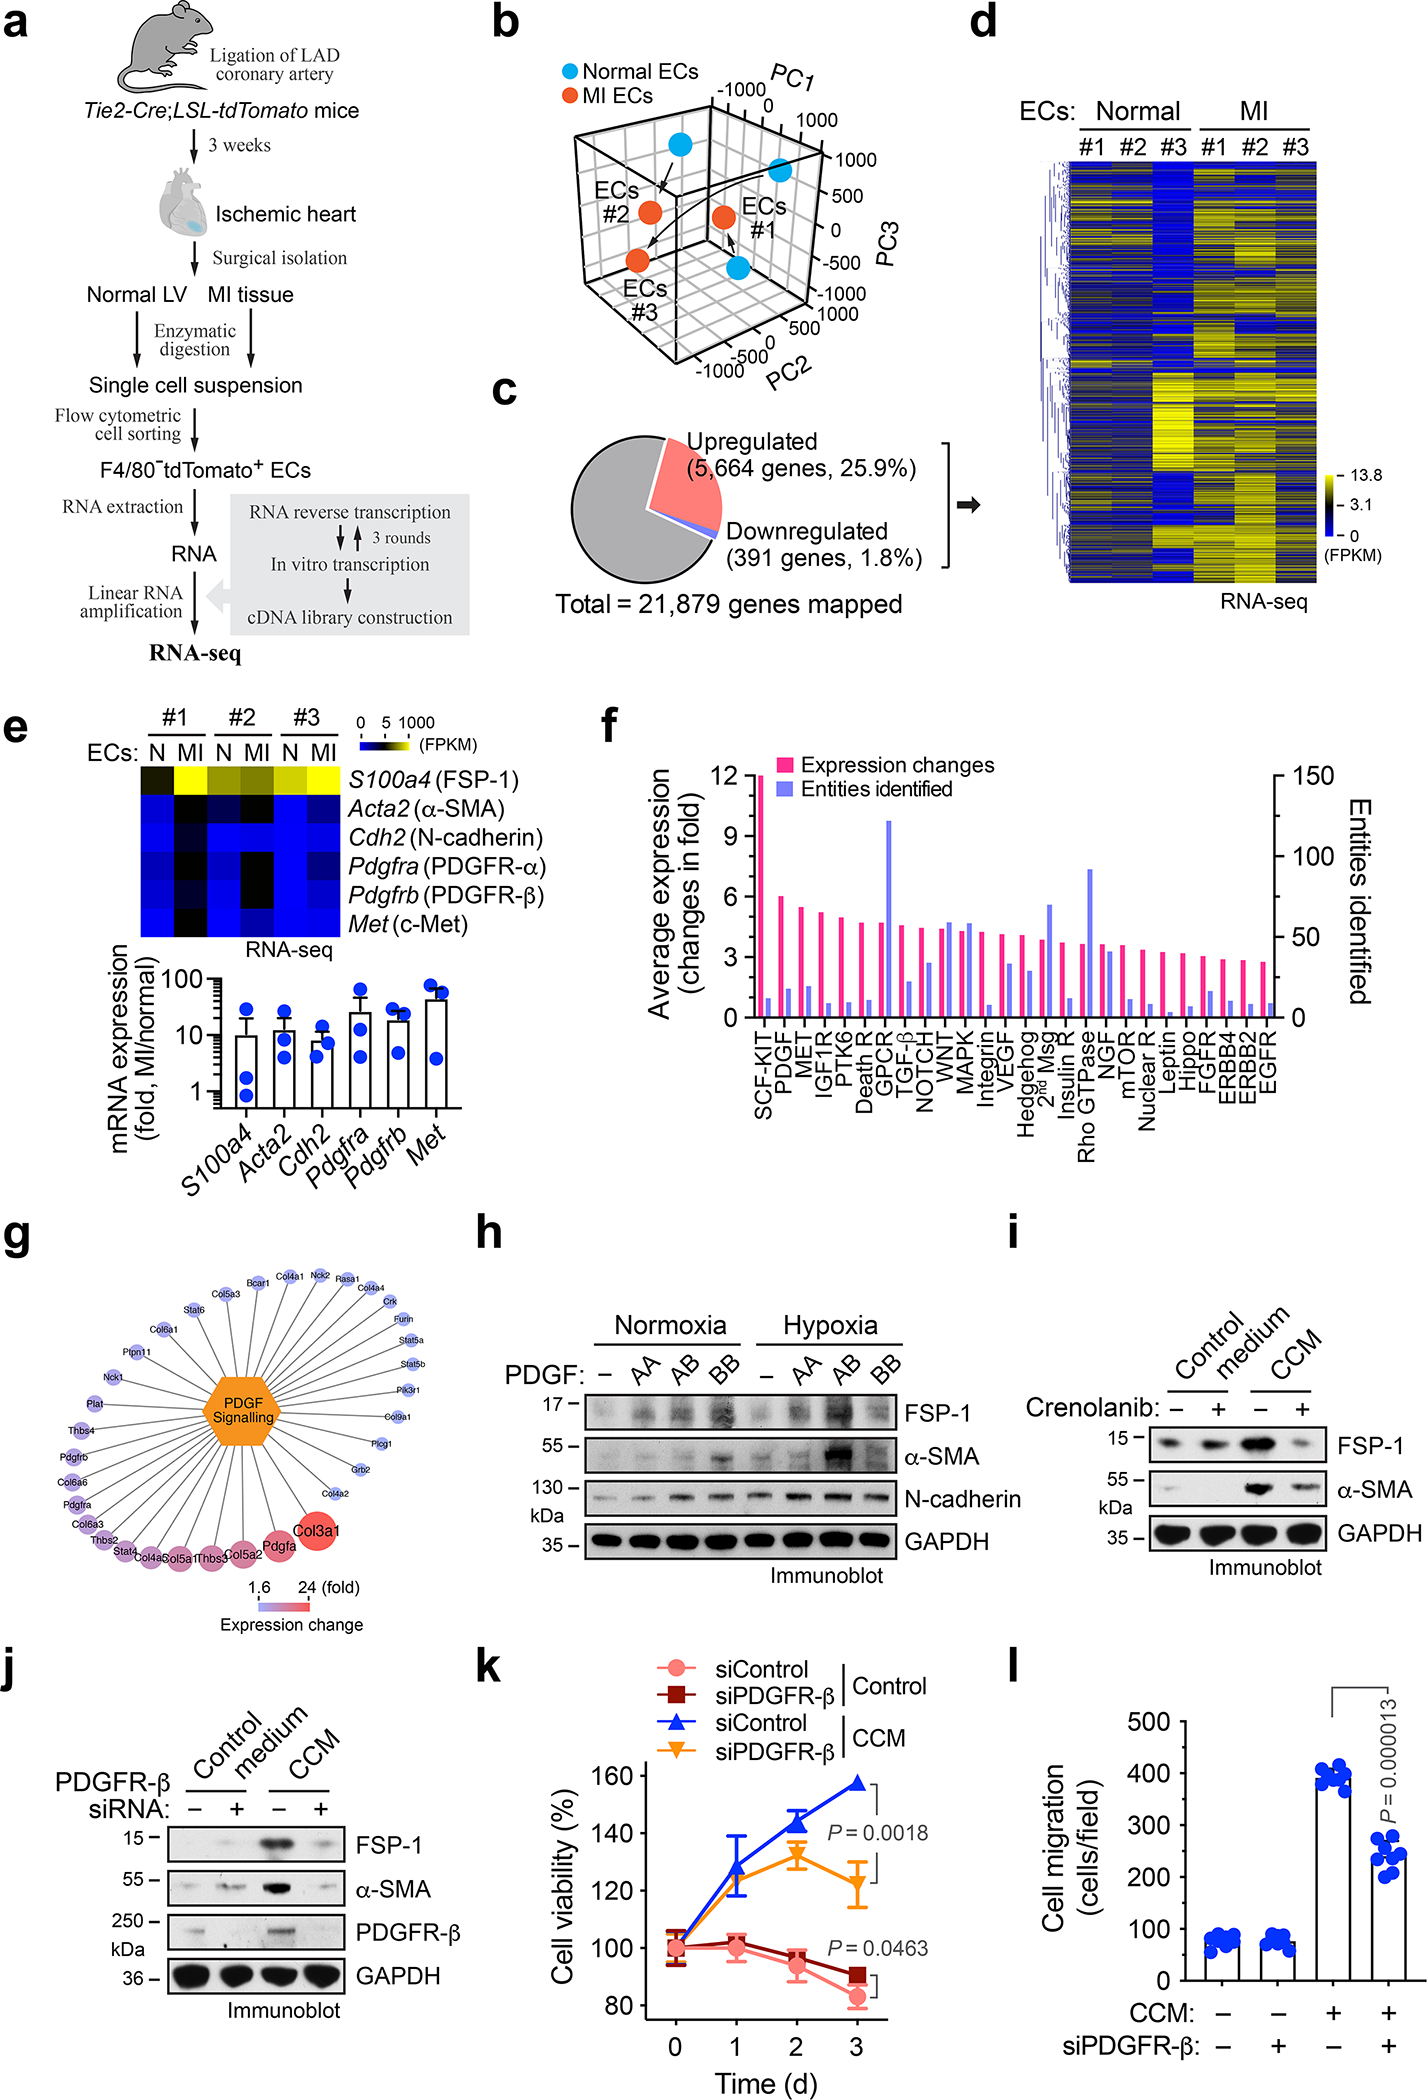
a-g, MI was induced in Tie2-Cre;LSL-tdTomato mice. ECs were isolated from mouse normal LV and MI tissues. RNA was extracted and subjected to linear amplification and RNA-seq analysis (n = 3 mice). a, Experimental procedure. b, All mapped genes were analyzed by principal component (PC) analysis. c,d, Genes with average expression change >60% were determined. c, Global transcriptome gene expression changes. d, Heatmap of clustered genes with changed expression. e, Fold of mesenchymal gene expression in MI-associated ECs compared to normal ECs. Top, heat map. Bottom, quantified results (n = 3 mice, mean ± SEM). f, Bioinformatic analysis of upregulated genes in MI-associated ECs. Gene ontology and pathway set analysis of the upregulated genes. g, Identified upregulated genes in PDGF pathway. h, Human cardiac microvascular ECs were treated with 100 ng/ml PDGF-AA, PDGF-AB, or PDGF-BB under normoxia or hypoxia. Cell lysates were immunoblotted. i, Mouse cardiac microvascular ECs pre-treated with crenolanib or control 0.1% DMSO were incubated with CCM or control medium for 2 days. Cell lysates were immunoblotted. j-l. Mouse cardiac ECs were treated with siRNA targeting PDGFR-β or control scrambled sequence, followed by incubation with CCM or control medium for 2 days. j, EC lysates were immunoblotted. h-j, These experiments were repeated independently twice with similar results. k,l, ECs were cultured back in normal medium. k, Cell viability under hypoxia was determined (n = 3 EC samples, mean ± SD). Statistical analysis by two-tailed Student’s t test. l, Cell migration was analyzed by using transwell (n = 8 EC samples, mean ± SD). Statistical analysis by two-tailed Student’s t test.
PDGF induces mesenchymal-like activation under hypoxia
We analyzed the up-regulated genes identified by RNAseq in MI ECs. Our results showed that about 14% of these genes were associated with pathway regulation, and further gene ontology and pathway enrichment analysis identified the top regulated pathways including Scf-Kit, PDGF, and c-Met (Fig. 3f). Among the ligands including stem cell factor (SCF), PDGF, and hepatocyte growth factor (HGF) that activate these pathways, PDGF-AB induced the most robust expression of FSP-1, α-SMA, and N-cadherin in ECs (Extended Data Fig. 4). Consistently, our RNAseq analysis of MI ECs revealed a marked increase in expression of PDGF pathway-associated genes (Fig. 3g). Based on these findings, we focused our studies on PDGF-mediated mechanism. PDGF is a dimeric glycoprotein that can be composed of two A subunits (PDGF-AA), two B subunits (PDGF-BB), or one of each (PDGF-AB) 19. We tested the effects of these ligands on mesenchymal-like transcriptional activation. Our data showed that PDGF-AB induced expression of FSP-1, α-SMA, and N-cadherin in human cardiac microvascular ECs, particularly under hypoxia (Fig. 3h). Furthermore, pharmacological inhibition of PDGFR with crenolanib or siRNA-mediated PDGFR-β knockdown abrogated CCM-induced FSP-1 and α-SMA expression (Fig. 3i,j). Likewise, PDGFR-β knockdown markedly reduced CCM-stimulated EC survival and proliferation under hypoxia (Fig. 3k), and attenuated CCM-induced EC migration (Fig. 3l). These findings suggest a critical role of PDGF for mesenchymal transcriptional activation and dysfunction in ECs under MI conditions.
PDGF activates NF-κB/HIF-1α/Snail
Epithelial-mesenchymal transition (EMT), a similar cellular process to endothelial plasticity, has been well characterized as mediated through multiple transcriptional factors including Snail, Slug, Tcf3, Twist1/2, and Zeb1/2 20–22. We analyzed their expression in MI-associated ECs. RNAseq analysis revealed robust expression of Snail, Slug, Twist1, Zeb1/2 in MI ECs, particularly showing a substantial increase in Snail expression, compared with the corresponding normal ECs (Fig. 4a). Upregulated expression of Snail and Twist1 in MI ECs was verified by RT-PCR analysis (Extended Data Fig. 3). Interestingly, PDGF-AB selectively upregulated expression of Snail, but not Slug, Tcf3, Zeb1, or Sip1 expression under hypoxia in human cardiac ECs (Fig. 4b), suggesting a potential role of Snail in EC plasticity. Likewise, siRNA-mediated Snail knockdown abrogated PDGF-AB-induced FSP-1 expression in ECs (Fig. 4c), indicating that PDGF induces mesenchymal transcriptional activation through Snail.
Fig. 4. PDGF regulates EC plasticity under hypoxia via NF-κB- and HIF-1α- dependent Snail expression.
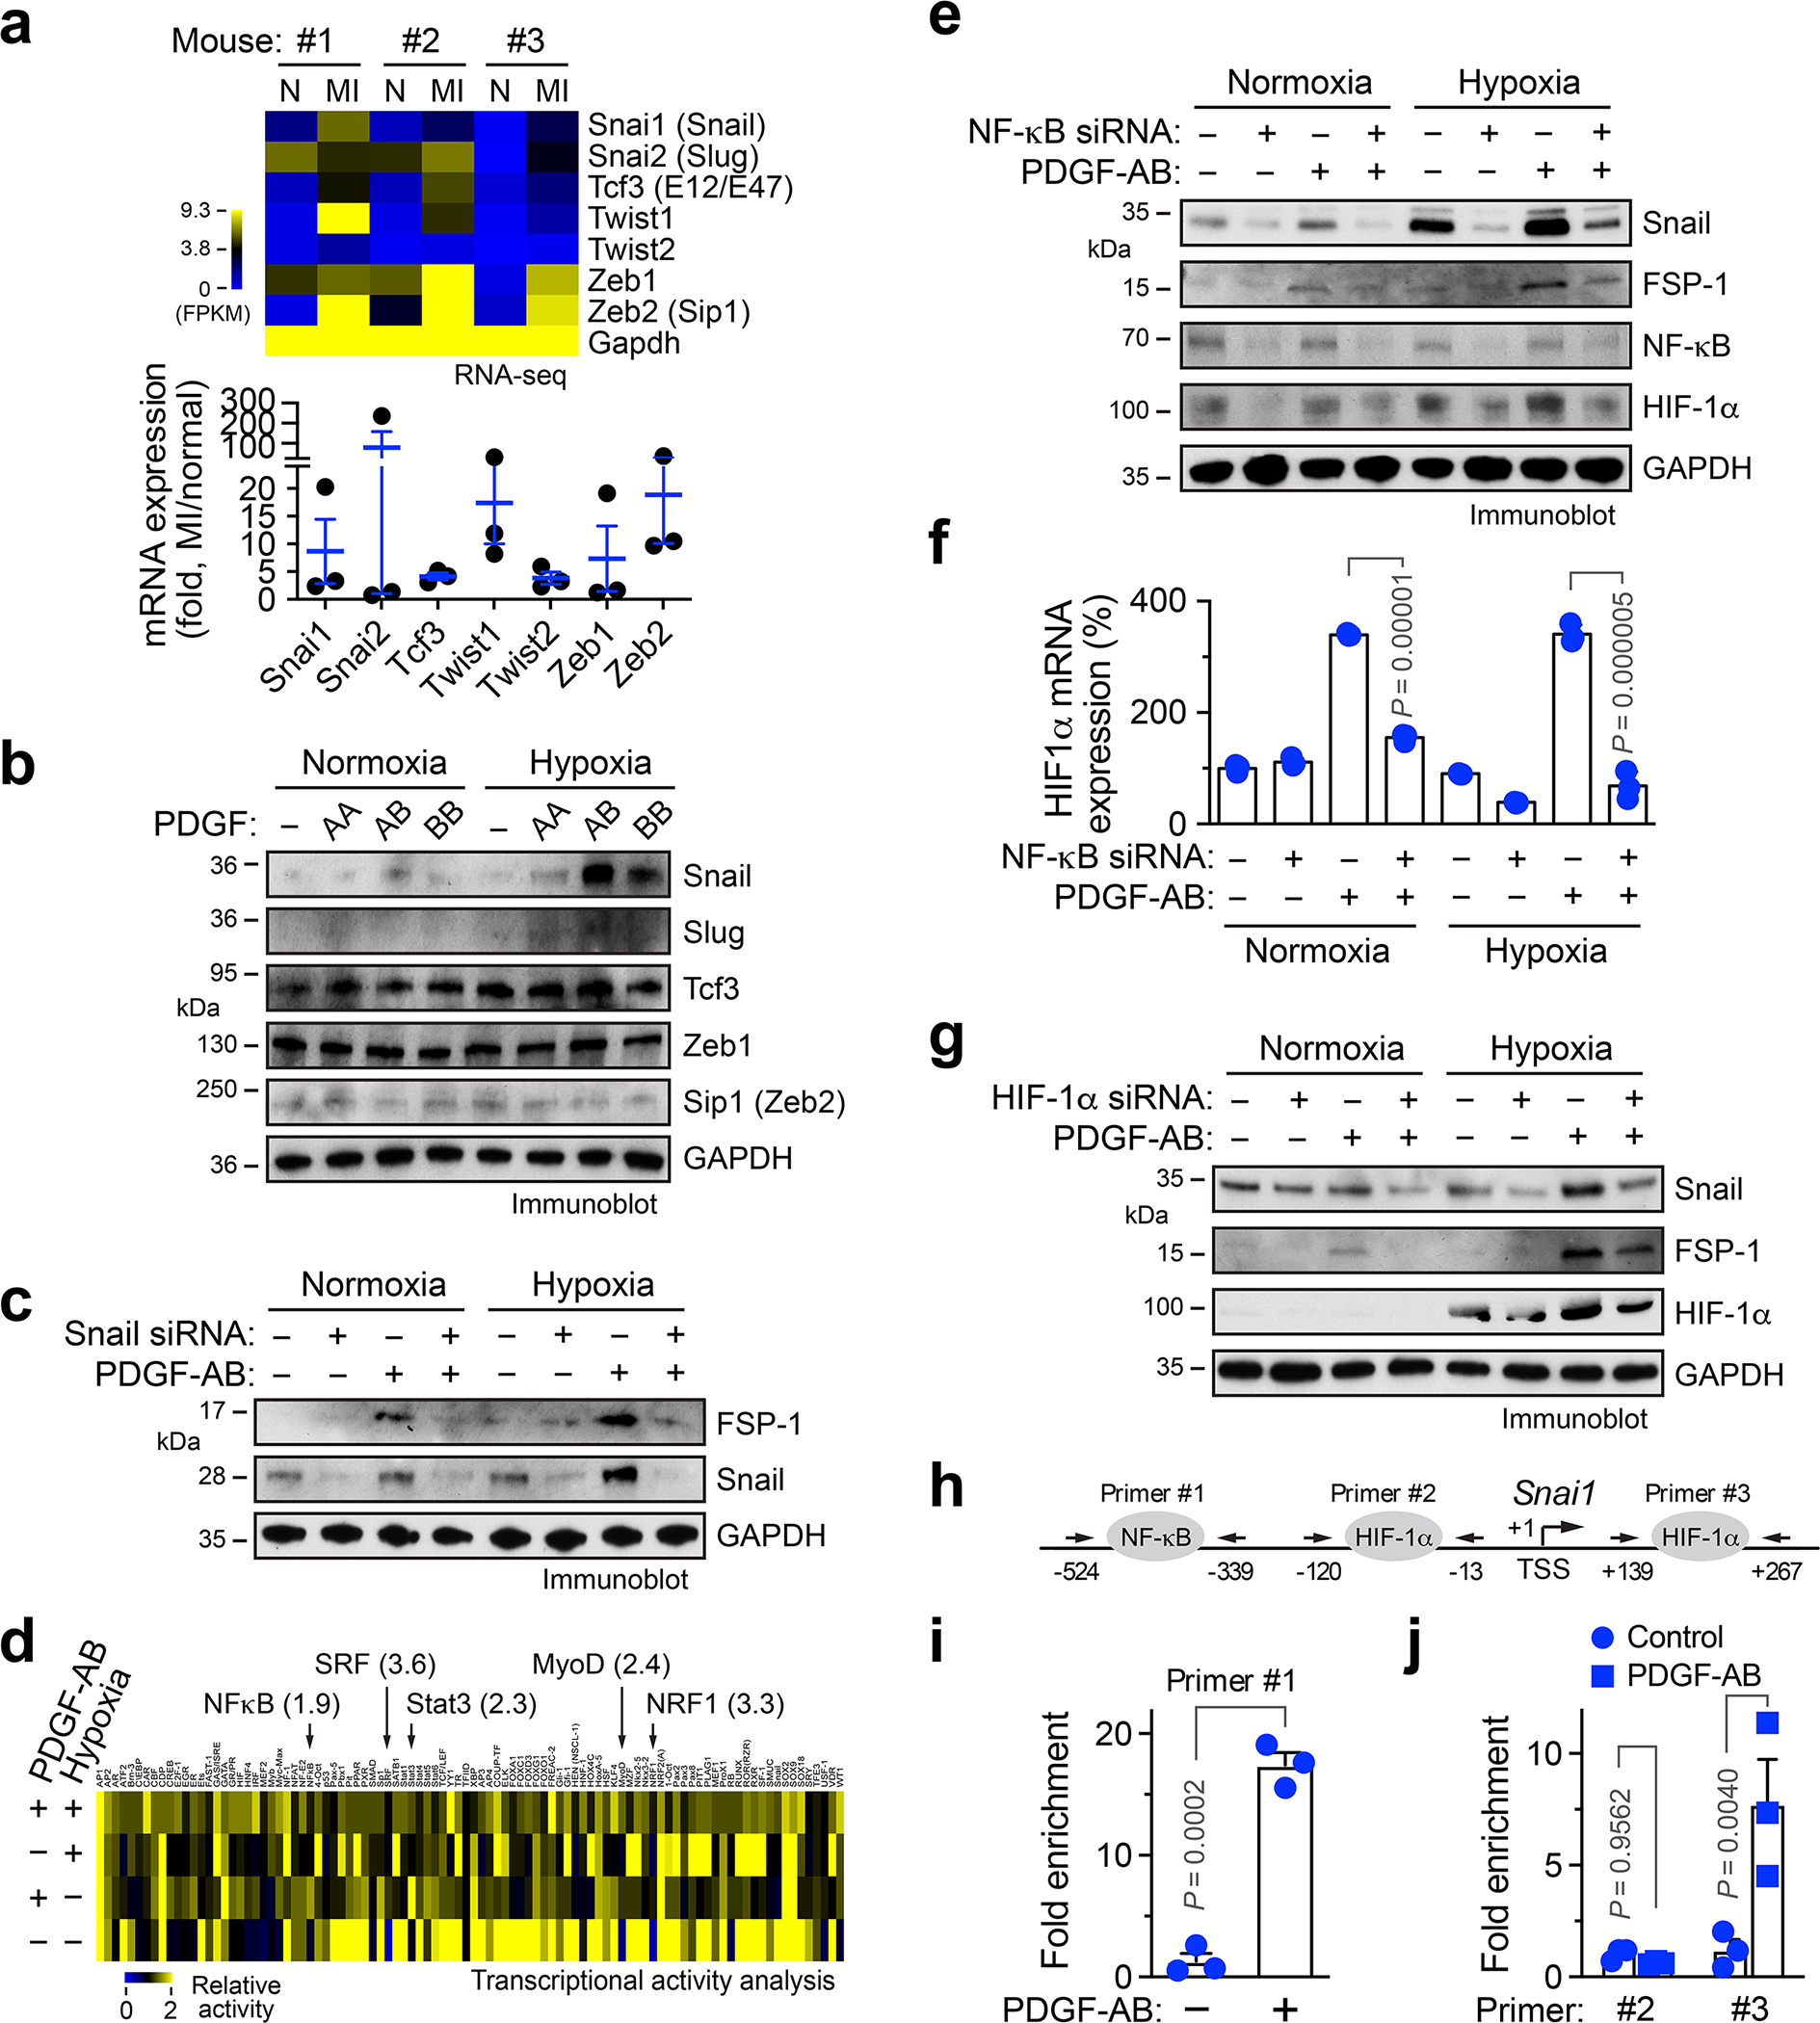
a, ECs were isolated from normal mouse LV and MI tissues, and subjected to RNA-seq analysis. Gene expression of EMT-related transcriptional factors was determined. Upper, heatmap. Bottom, quantified results (n = 3 mice, mean ± SEM). b, Human cardiac microvascular ECs were treated with 100 ng/ml PDGF-AA, PDGF-AB, or PDGF-BB under normoxia or hypoxia. Cell lysates were immunoblotted. c, Human ECs were transfected with siRNA targeting Snail or control scrambled sequence, followed by treatment with PDGF-AB. Cell lysates were immunoblotted. b,c, These experiments were repeated independently twice with similar results. d, Human ECs were treated with PDGF-AB under normoxia or hypoxia, followed by multiplex transcriptional activity assay. e,f, Human ECs were pretreated with siRNA targeting NF-κB or control sequence, and incubated with PDGF-AB under normoxia or hypoxia. e, Cell lysates were immunoblotted. This experiment was repeated independently twice with similar results. f, RNA was analyzed by RT-PCR. Results were normalized with GAPDH levels (n = 3 EC samples, mean ± SEM). Statistical analysis by two-way ANOVA. g, Human ECs were pretreated with siRNA targeting HIF-1α or control sequence, and incubated with PDGF-AB under normoxia or hypoxia. Cell lysates were immunoblotted. This experiment was repeated independently twice with similar results. h-j, Human ECs were treated with PDGF-AB under (i) normoxia or (j) hypoxia, followed by ChIP analysis with different Snail primers after immunoprecipitation with (i) anti-NF-kB or (j) anti-HIF-1a antibody (n = 3 EC samples, mean ± SEM). Statistical analysis by (i) two-tailed Student’s t test or (j) two-way ANOVA.
We investigated the mechanism for PDGF-induced Snail expression. Our multiplex transcriptional factor activity analysis showed that PDGF-AB activates several transcriptional factors, with top 5 including NF-κB, SRF, Stat3, MyoD, and NRF1 in cardiac ECs, while PDGF-AB or hypoxia reduced DNA-binding activities of most other tested transcriptional factors (Fig. 4d). Similar to our previous work showing that PDGF-AB activates NF-κB signaling pathway in brain tumor ECs 23, siRNA-mediated NF-κB knockdown abrogated PDGF-AB-induced Snail and FSP-1 expression under hypoxia, or to a lesser extent, under normoxia (Fig. 4e). HIF-1α is a master transcriptional factor that regulates hypoxia-induced cellular processes. Interestingly, PDGF-AB stimulated HIF-1α mRNA and protein expression in ECs (Fig. 4e,f). Moreover, siRNA-mediated HIF-1α knockdown inhibited PDGF-AB-induced Snail and FSP-1 expression under hypoxia (Fig. 4g), suggesting a critical role of HIF-1α for PDGF-induced mesenchymal transcriptional activation, in addition to NF-κB. Notably, NF-κB knockdown inhibited PDGF-AB-induced HIF-1α expression under normoxia and hypoxia (Fig. 4e,f), suggesting that PDGF-AB activates NF-κB to induce HIF-1α expression. Furthermore, chromatin immunoprecipitation (ChIP) analysis showed that both NF-κB and HIF-1α were able to bind to Snail promoter, in a PDGF-inducible manner (Fig. 4h–j). Together, these findings suggest that PDGF activates NF-κB to induce Snail expression, and in addition, NF-κB-mediated HIF-1α transcription further enhances Snail expression under hypoxia.
PDGF/Snail suppresses VE-cadherin expression under hypoxia
A hallmark of EMT is the down-regulation of E-cadherin by transcriptional repression to reinforce the destabilization of adherens junctions in epithelial cells 22. Our data show that PDGF-AB robustly down-regulates VE-cadherin expression under hypoxia in ECs (Fig. 5a). Moreover, Snail knockdown rescued VE-cadherin expression in PDGF-AB-treated ECs under hypoxia (Fig. 5b). Consistent with the critical role of Snail for VE-cadherin downregulation, PDGF-AB induced Snail binding to VE-cadherin promoter (Fig. 5c), collectively suggesting that Snail binds to VE-cadherin promoter and suppresses its expression in a PDGF-inducible mechanism in ECs. To determine the contribution of this mechanism to EC plasticity and cell functions, VE-cadherin was enforced to re-express in PDGF-treated ECs by lentiviral transduction with active CRISPR/sgRNA (Fig. 5d). Re-expression of VE-cadherin inhibited expression of mesenchymal proteins FSP-1 and N-cadherin (Fig. 5d) and attenuated cell proliferation (Fig. 5e) and monolayer permeability (Fig. 5f) induced by PDGF treatment under hypoxia. Together, these results identify a PDGF-AB/NF-κB/HIF-1α/Snail-mediated signaling axis that suppresses VE-cadherin expression and induces endothelial plasticity in an ischemic setting, by which enhanced EC motility and proliferation as well as disrupted cell-cell adhesion lead to vascular aberrancy (Fig. 5g).
Fig. 5. PDGF induces Snail binding to VE-cadherin promoter, leading to VE-cadherin down-expression and mesenchymal phenotypes in ECs.
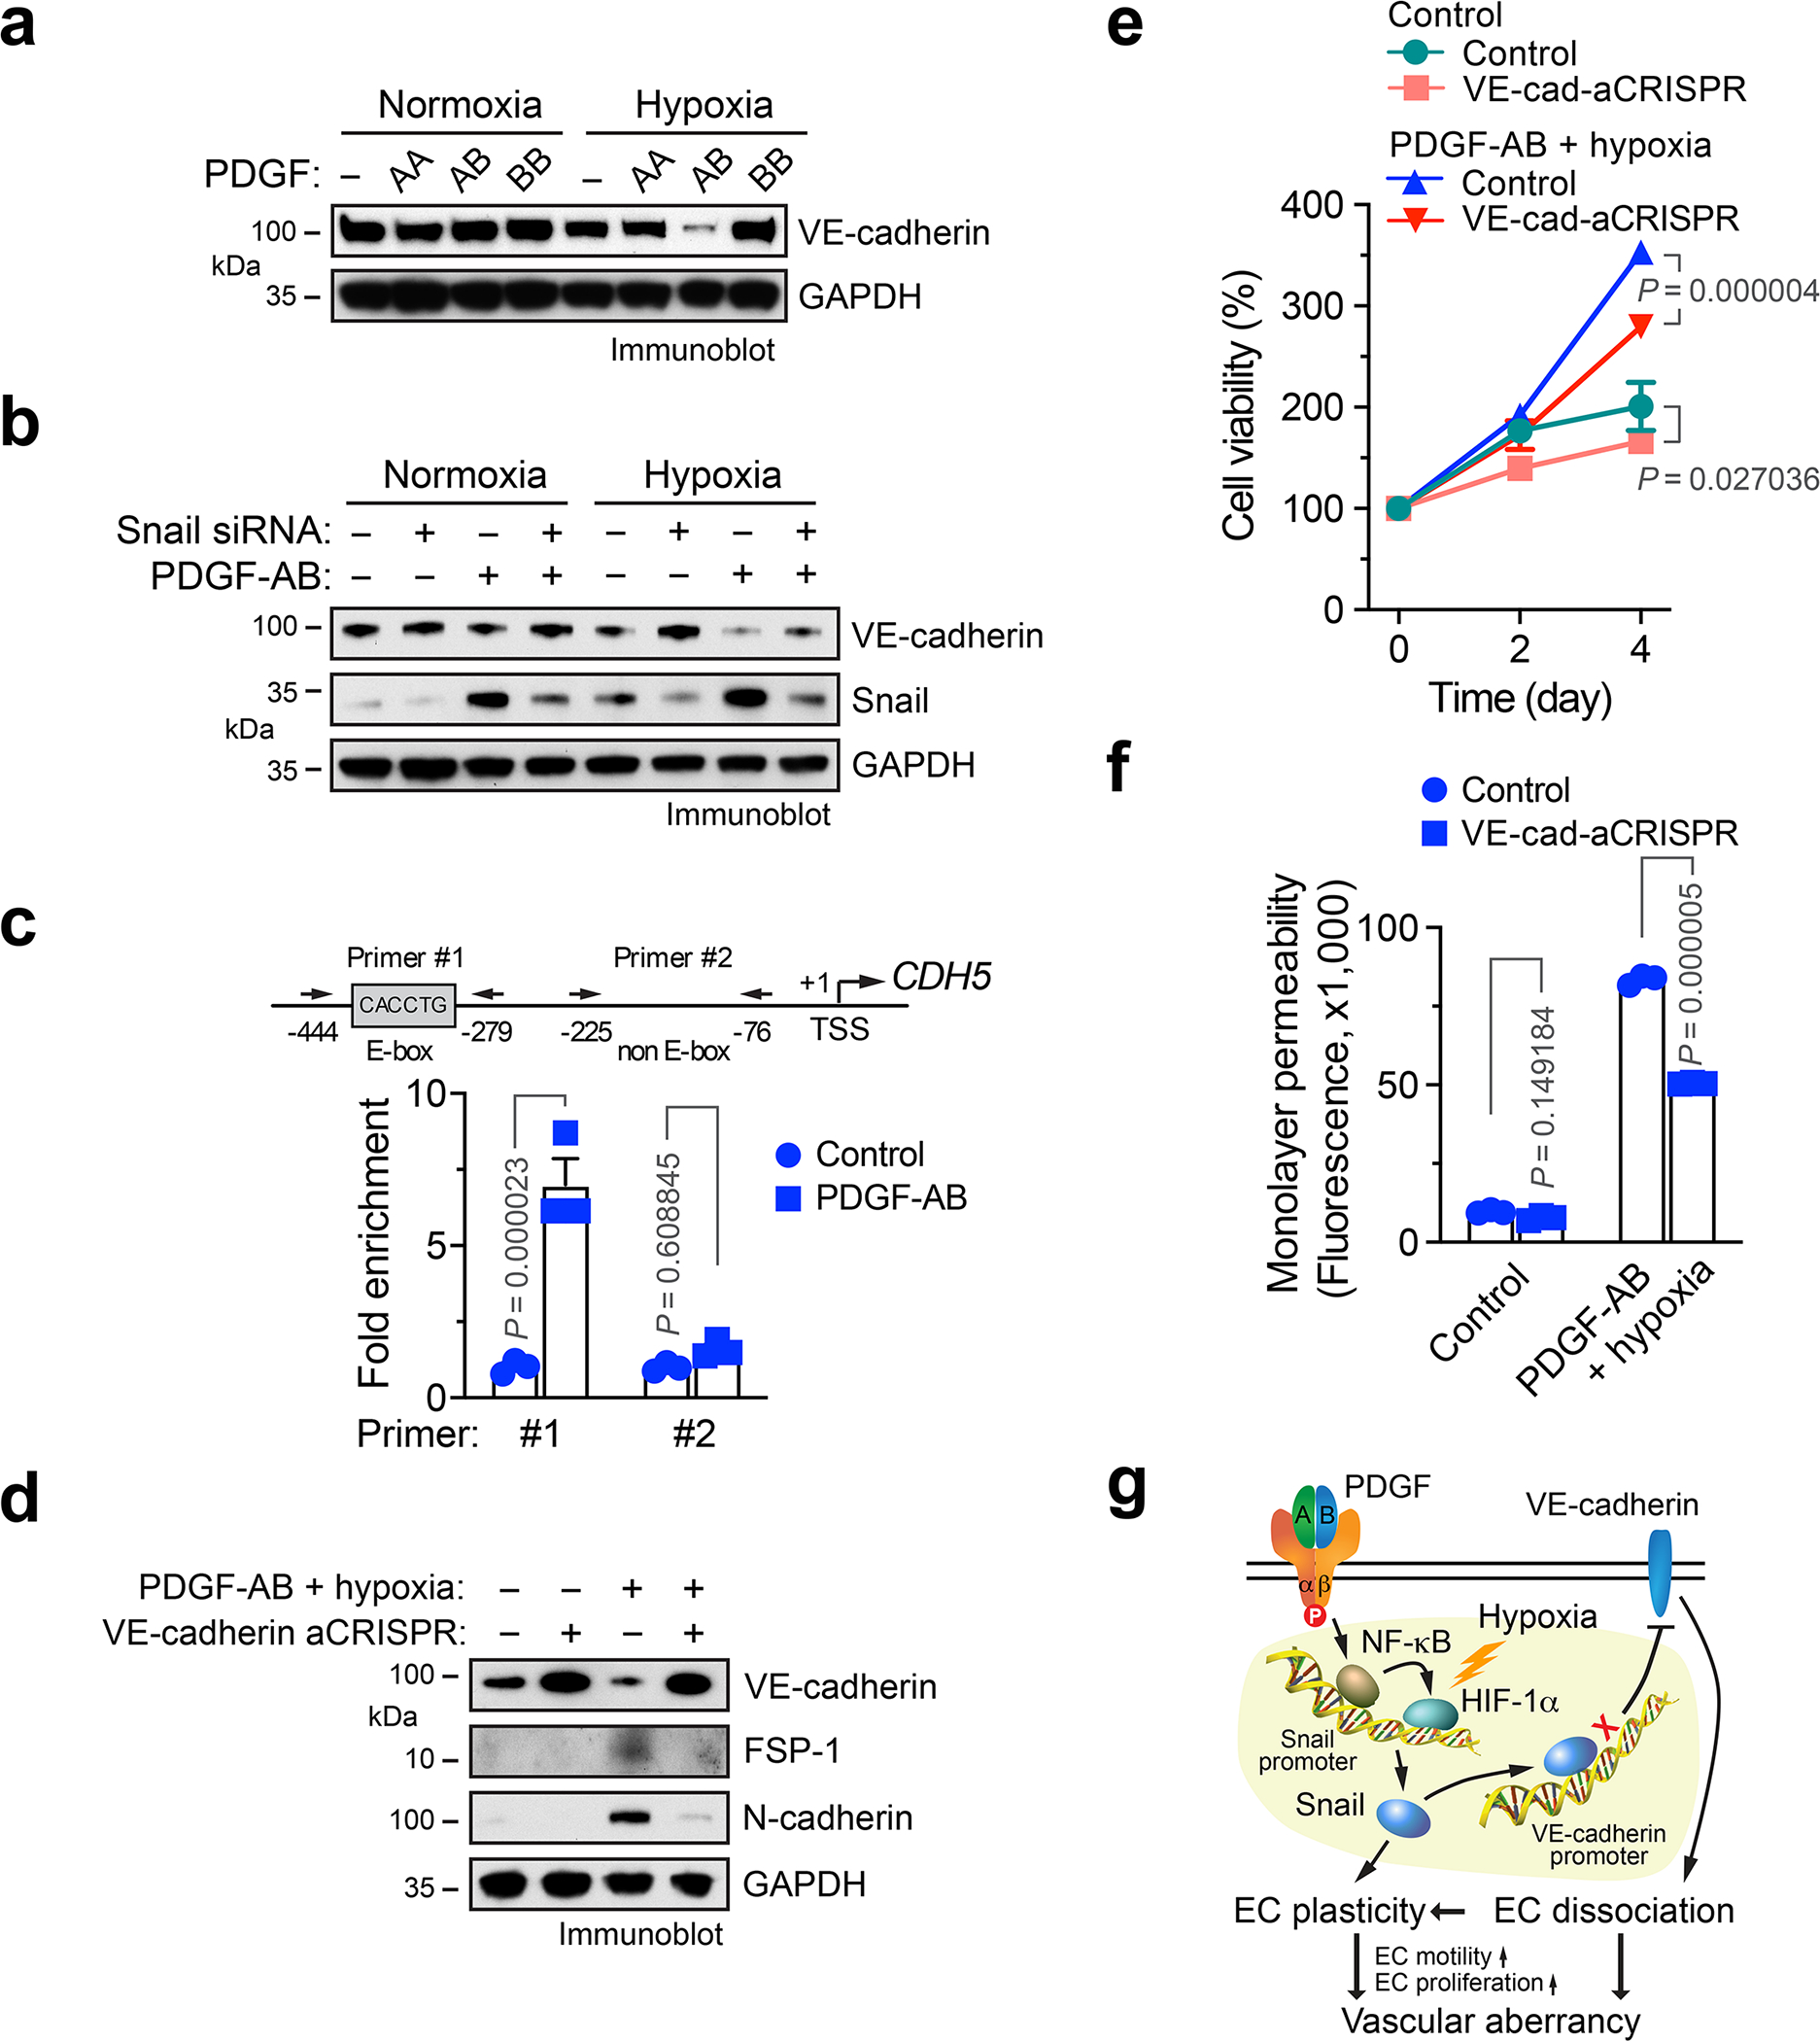
a, Human cardiac microvascular ECs with 100 ng/ml PDGF-AA, PDGF-AB, or PDGF-BB under normoxia or hypoxia. Cell lysates were immunoblotted. b, Human ECs were transfected with siRNA targeting Snail or control scrambled sequence, followed by treatment with PDGF-AB. Cell lysates were immunoblotted. a,b, These experiments were repeated independently twice with similar results. c, Human ECs were treated with or without PDGF-AB under hypoxia, followed by ChIP analysis with anti-Snail antibody (n = 3 EC samples, mean ± SEM). Statistical analysis by two-way ANOVA. d-f, Human ECs were transduced to express active sgRNA/CRISPR targeting VE-cadherin or control sequence, followed by treatment with PDGF-AB under hypoxia. d, Cell lysate was immunoblotted. This experiment was repeated independently twice with similar results. e,f, Cells were subjected to (e) proliferation (n = 3 EC samples, mean ± SEM) and (f) permeability (n = 3 EC samples, mean ± SEM, 20 h after loading fluorescence dye) analyses. Statistical analysis by two-way ANOVA. g, A schematic model. Under a MI condition, PDGF induces NF-κB-dependent Snail expression in ECs, which is further enhanced by hypoxia via HIF-1α. Snail induces EC plasticity by mesenchymal transcriptional activation. In addition, Snail binds to VE-cadherin promoter, suppressing VE-cadherin transcription, facilitating EC plasticity that stimulates EC proliferation and migration, leading to vessel abnormalities.
PDGFR-β knockout in ECs normalizes neovasculature after MI
We next tested the in vivo role of PDGF-mediated endothelial plasticity in cardiac repair and function recovery after MI. We generated EC-specific PDGF receptor-β (PDGFR-β) knockout mice by crossing Pdgfrbfl/fl mice with Cdh5-CreERT2 mice (Fig. 6a). PDGFR-β was selected to be targeted because of its well-established developmental role for blood vessel formation and early hematopoiesis, while PDGFR-β signaling is critical for gastrulation and the development of the cranial and cardiac neural crest, gonads, and other organs 19. Efficient EC-specific PDGFR-β knockout and functional inhibition were verified by immunoblot analysis of isolated ECs and whole heart tissues (Fig. 6b and Extended Data Fig. 5a). Interestingly, Pdgfrb deletion in ECs did not apparently affect basal angiogenesis in normal hearts (Extended Data Fig. 5b) or normal heart function (Fig. 6c,d), suggesting a dispensable role of endothelial PDGFR-β in physiological angiogenesis and normal tissue functions23.
Fig. 6. PDGFR-β deletion in ECs normalizes vasculature and improves cardiac function recovery after MI.
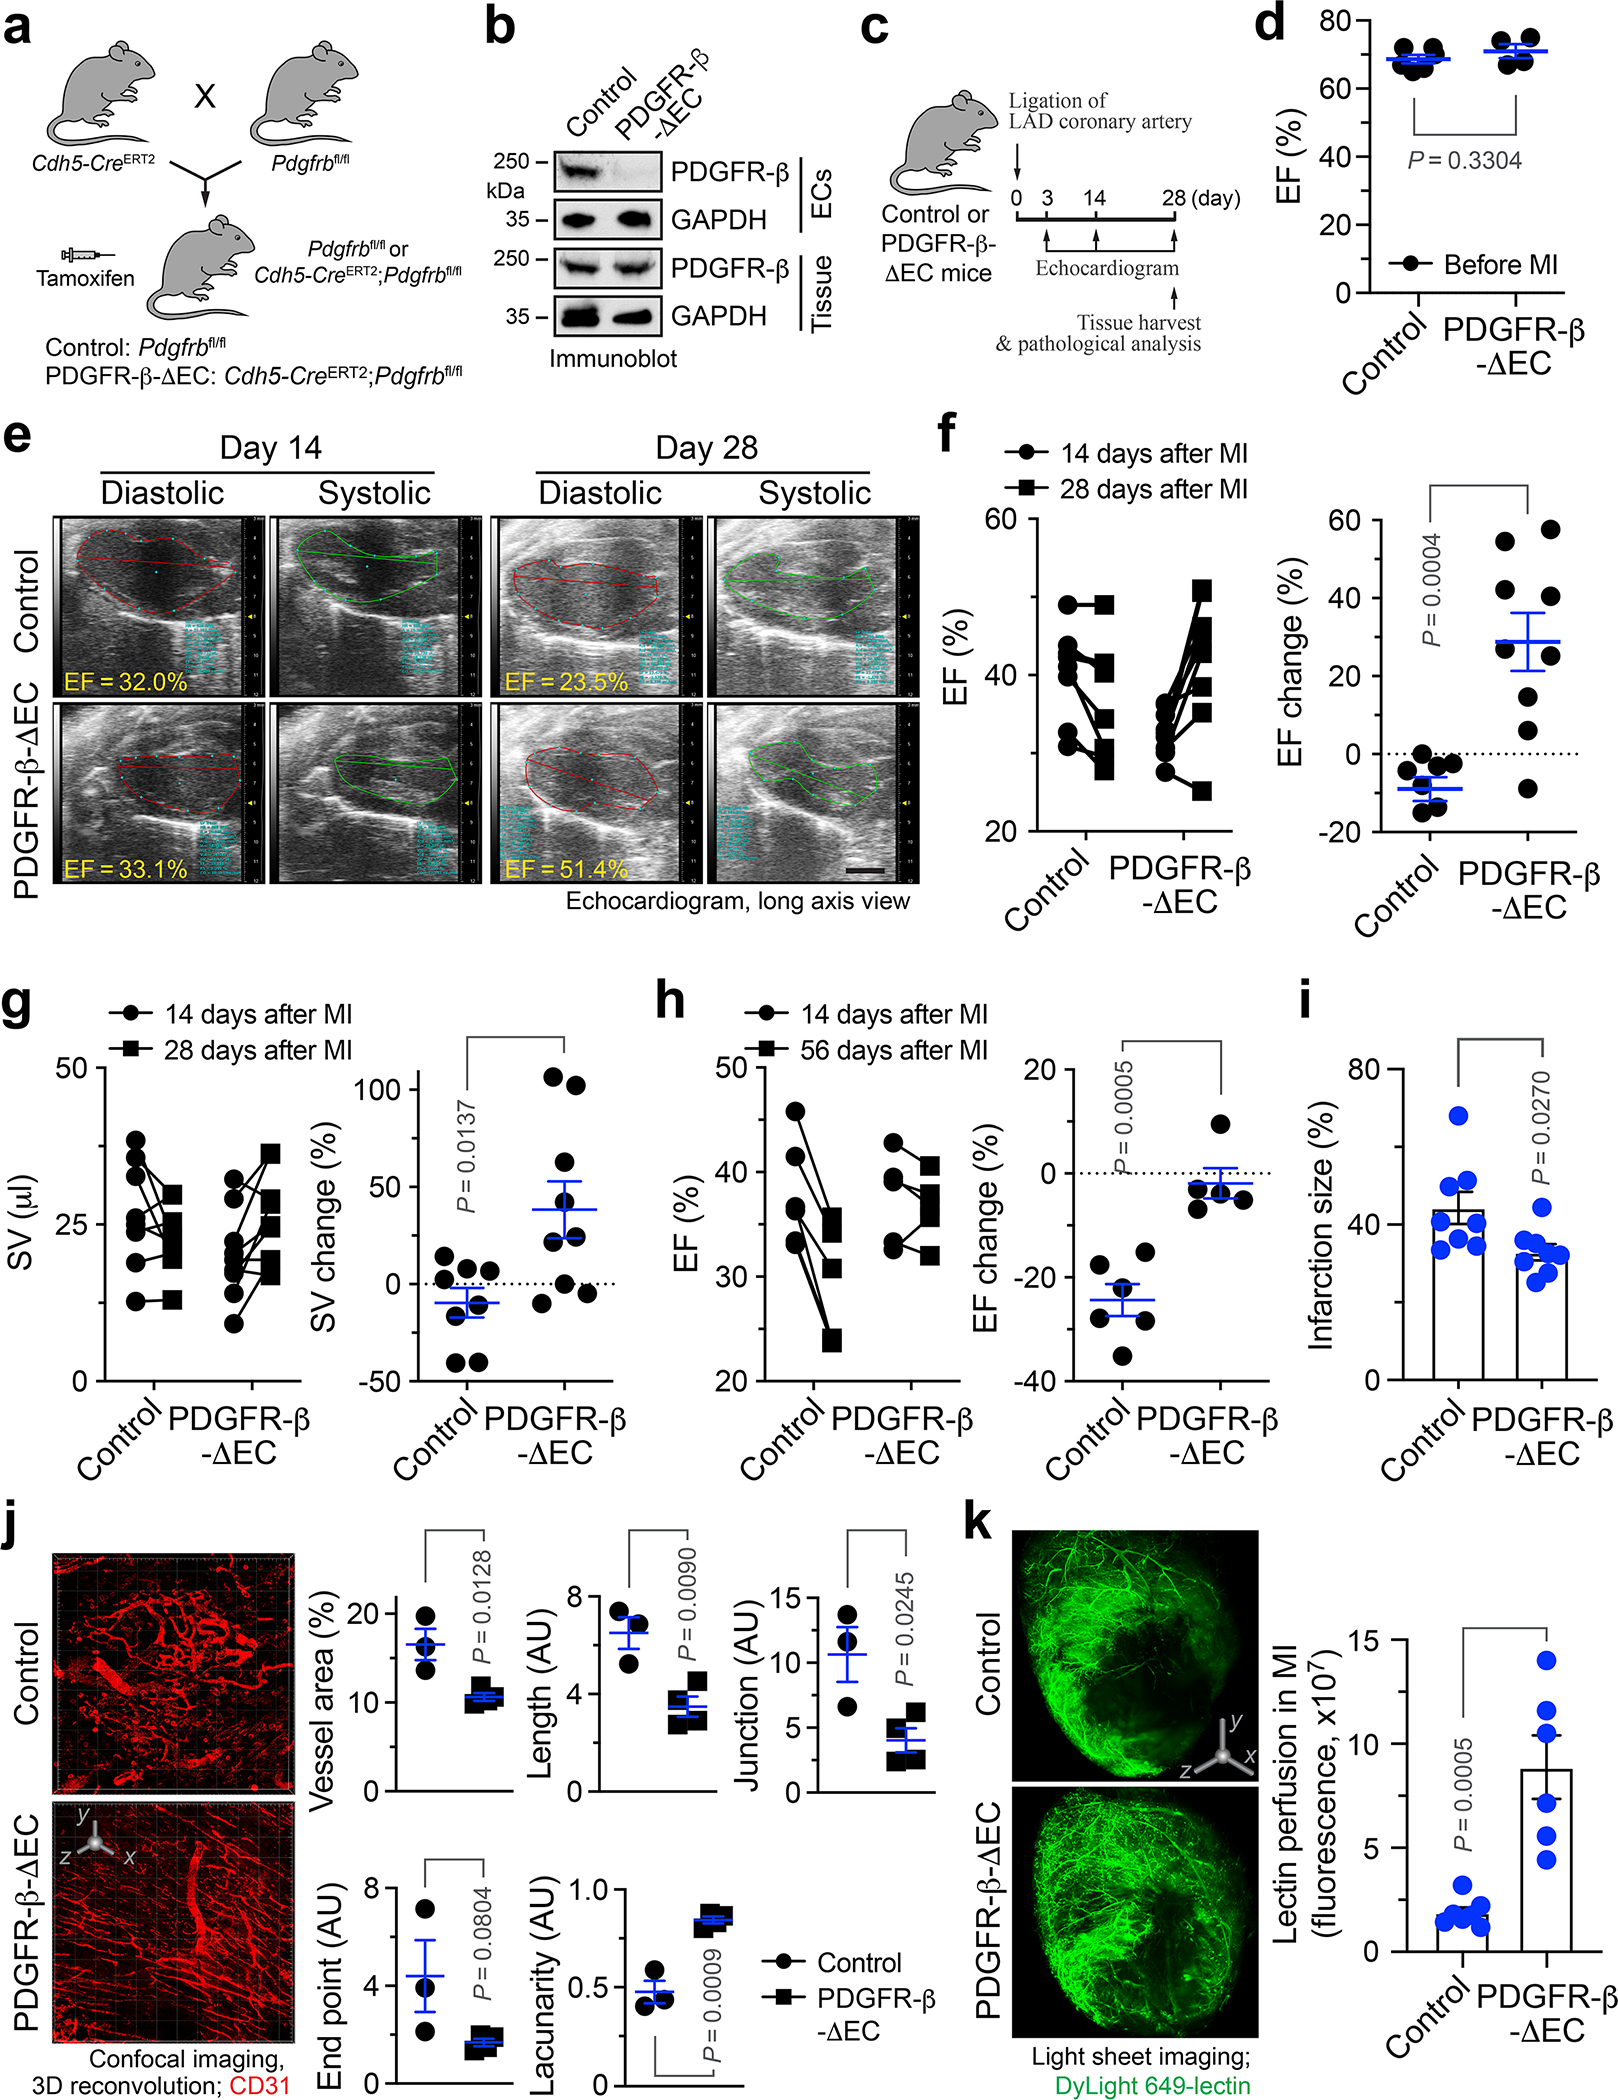
a, Breeding strategy for generation of control and PDGFR-β-ΔEC mice. b, Aortic ECs were isolated. Lysates from ECs and cardiac tissue lysate were immunoblotted. This experiment was repeated independently twice with similar results. c-k, MI was induced in control and PDGFR-β-ΔEC mice. c, Schematic approach. d-h, Mice were analyzed by echocardiography. EF was measured (d) before MI (mean ± SEM, n = 6 mice for control group, and n = 4 mice for PDGFR-β-ΔEC group), (e-g) at days 14 and 28 or (h) at days 14 and 56 after MI. e, Representative echocardiogram images. Scale bar: 2 mm. f,g, Left, EF and SV values in individual mice. Right, % of EF and SV changes from days 14 to 28 (mean ± SEM, n = 8 mice for control group, and n = 9 mice for PDGFR-β-ΔEC group). Statistical analysis by two-tailed Students’ t test. h, Left, EF values in individual mice. Right, % of EF changes from days 14 to 56 (mean ± SEM, n = 6 mice for control group, and n = 5 mice for PDGFR-β-ΔEC group). Statistical analysis by two-tailed Students’ t test. i, Cardiac tissues were collected at day 28, and infarction size was analyzed (mean ± SEM, n = 8 mice). Statistical analysis by two-tailed Students’ t test. j, 21 days after MI, MI tissue was harvested and immunostained with anti-CD31 antibody, followed by 3-D confocal scanning. Left, representative images in infarct zone. 3D scale bar: 50 μm. Right, quantified results (mean ± SEM, n = 3 mice for control group, and n = 4 mice for PDGFR-β-ΔEC group). Statistical analysis by two-tailed Students’ t test. AU, arbitrary unit. k, 28 days after MI, mice were perfused with DyLight 649-lectin, and cardiac tissues were analyzed by light sheet fluorescence imaging. Left, representative images. 3D scale bar: 1 mm. Right, quantitative results (mean ± SEM, n = 7 mice for control group, and n = 6 mice for PDGFR-β-ΔEC group). Statistical analysis by two-tailed Student’s t test.
We next challenged these mice with MI surgery. Cardiac function was determined by long-axis echocardiogram. Notably, EC-specific PDGFR-β knockout significantly improved cardiac function recovery after MI, as evidenced by a 28.8% increase in ejection fraction (EF) from day 14 to day 28 after MI in PDGFR-β-knockout mice, in contrast to a slight EF decrease (−9.0%) during the same period in control mice (Fig. 6e,f). Similarly, stroke volume (SV) was increased by 38.3% in PDGFR-β-knockout mice, compared to a −9.6% decrease in control mice (Fig. 6g). Echocardiogram showed that PDGFR-β knockout markedly enhanced myocardial contractility in the infarct border zone (Extended Data Movie 1). The beneficial effects of PDGFR-β knockout on cardiac functions were sustained to 8 weeks after MI (Fig. 6h). Moreover, PDGFR-β knockout reduced infarction size in the hearts (Fig. 6i). Importantly, 3-D confocal imaging analysis showed that PDGFR-β deletion in ECs substantially attenuated vessel abnormalities in the MI tissues, as indicated by apparently normalized vasculature, reduced vessel area, length, and junction, and increased lacunarity (Fig. 6j). Likewise, PDGFR-β knockout promoted cardiac perfusion (Fig. 6k). In addition, PDGFR-β deletion in ECs did not affect vascular density in the border zone (Extended Data Fig. 6). Consistent with these findings, immunofluorescence studies showed that PDGFR-β deletion moderately attenuated the densities of total vessels and Ki-67+ proliferative ECs in MI tissues (Extended Data Fig. 7a–c). Moreover, genetic ablation of PDGFR-β reduced Snail and FSP-1 expression in MI-associated ECs (Extended Data Fig. 7d,e).
PDGFR-β knockout in ECs improves cardiac repair after MI
Furthermore, PDGFR-β knockout in ECs promoted cardiac perfusion improved cardiac repair after MI, as indicated by smaller infarct size (Fig. 6i), better organized structure, and more cardiomyocytes survival in the infarct zone (Fig 7a,b). Interestingly, these survived cardiomyocytes were associated with normalized vasculature in the MI tissue of PDGFR-β- knockout mice, but not with aberrant vasculature in the MI tissue of WT mice (Fig. 7c). Our single-nuclei RNAseq analysis of MI-associated tissues confirmed that PDGFR-β deletion reduced Snail expression in ECs in a time-dependent manner (Extended Data Fig. 8), and showed that genetic ablation of PDGFR-β robustly stimulated cardiomyocyte expression of proliferation-associated genes including Ccna2, Pcna, Top2a, and Mcm6, particularly at day 14 after MI (Fig. 7d,e), suggesting time-dependent positive effects on cardiomyocyte proliferation. Furthermore, PDGFR-β knockout in ECs substantially inhibited the expression of pro-apoptotic Bax but promotes the expression of anti-apoptotic Bcl2 in cardiomyocytes at day 14 after MI (Fig. 7f), suggesting time-dependent anti-apoptotic effects on myocytes. Immunofluorescence analysis verified enhanced numbers of PCNA+ cardiomyocytes in PDGFR-β-knockout mice (Fig. 7g) and reduced cardiomyocyte apoptosis in the infarct heart (Fig. 7h). In addition, PDGFR-β knockout in ECs also temporally stimulates cardiomyocyte metabolism, as evidenced by time-dependent increases in the expression of metabolism-associated genes (Extended Data Fig. 9). These findings collectively suggest that PDGF-mediated endothelial plasticity drives vessel abnormalities, leading to impeded cardiac repair and function recovery after MI.
Fig. 7. Endothelial-specific deletion of PDGFR-β promotes tissue repair and cardiomyocyte function after MI.
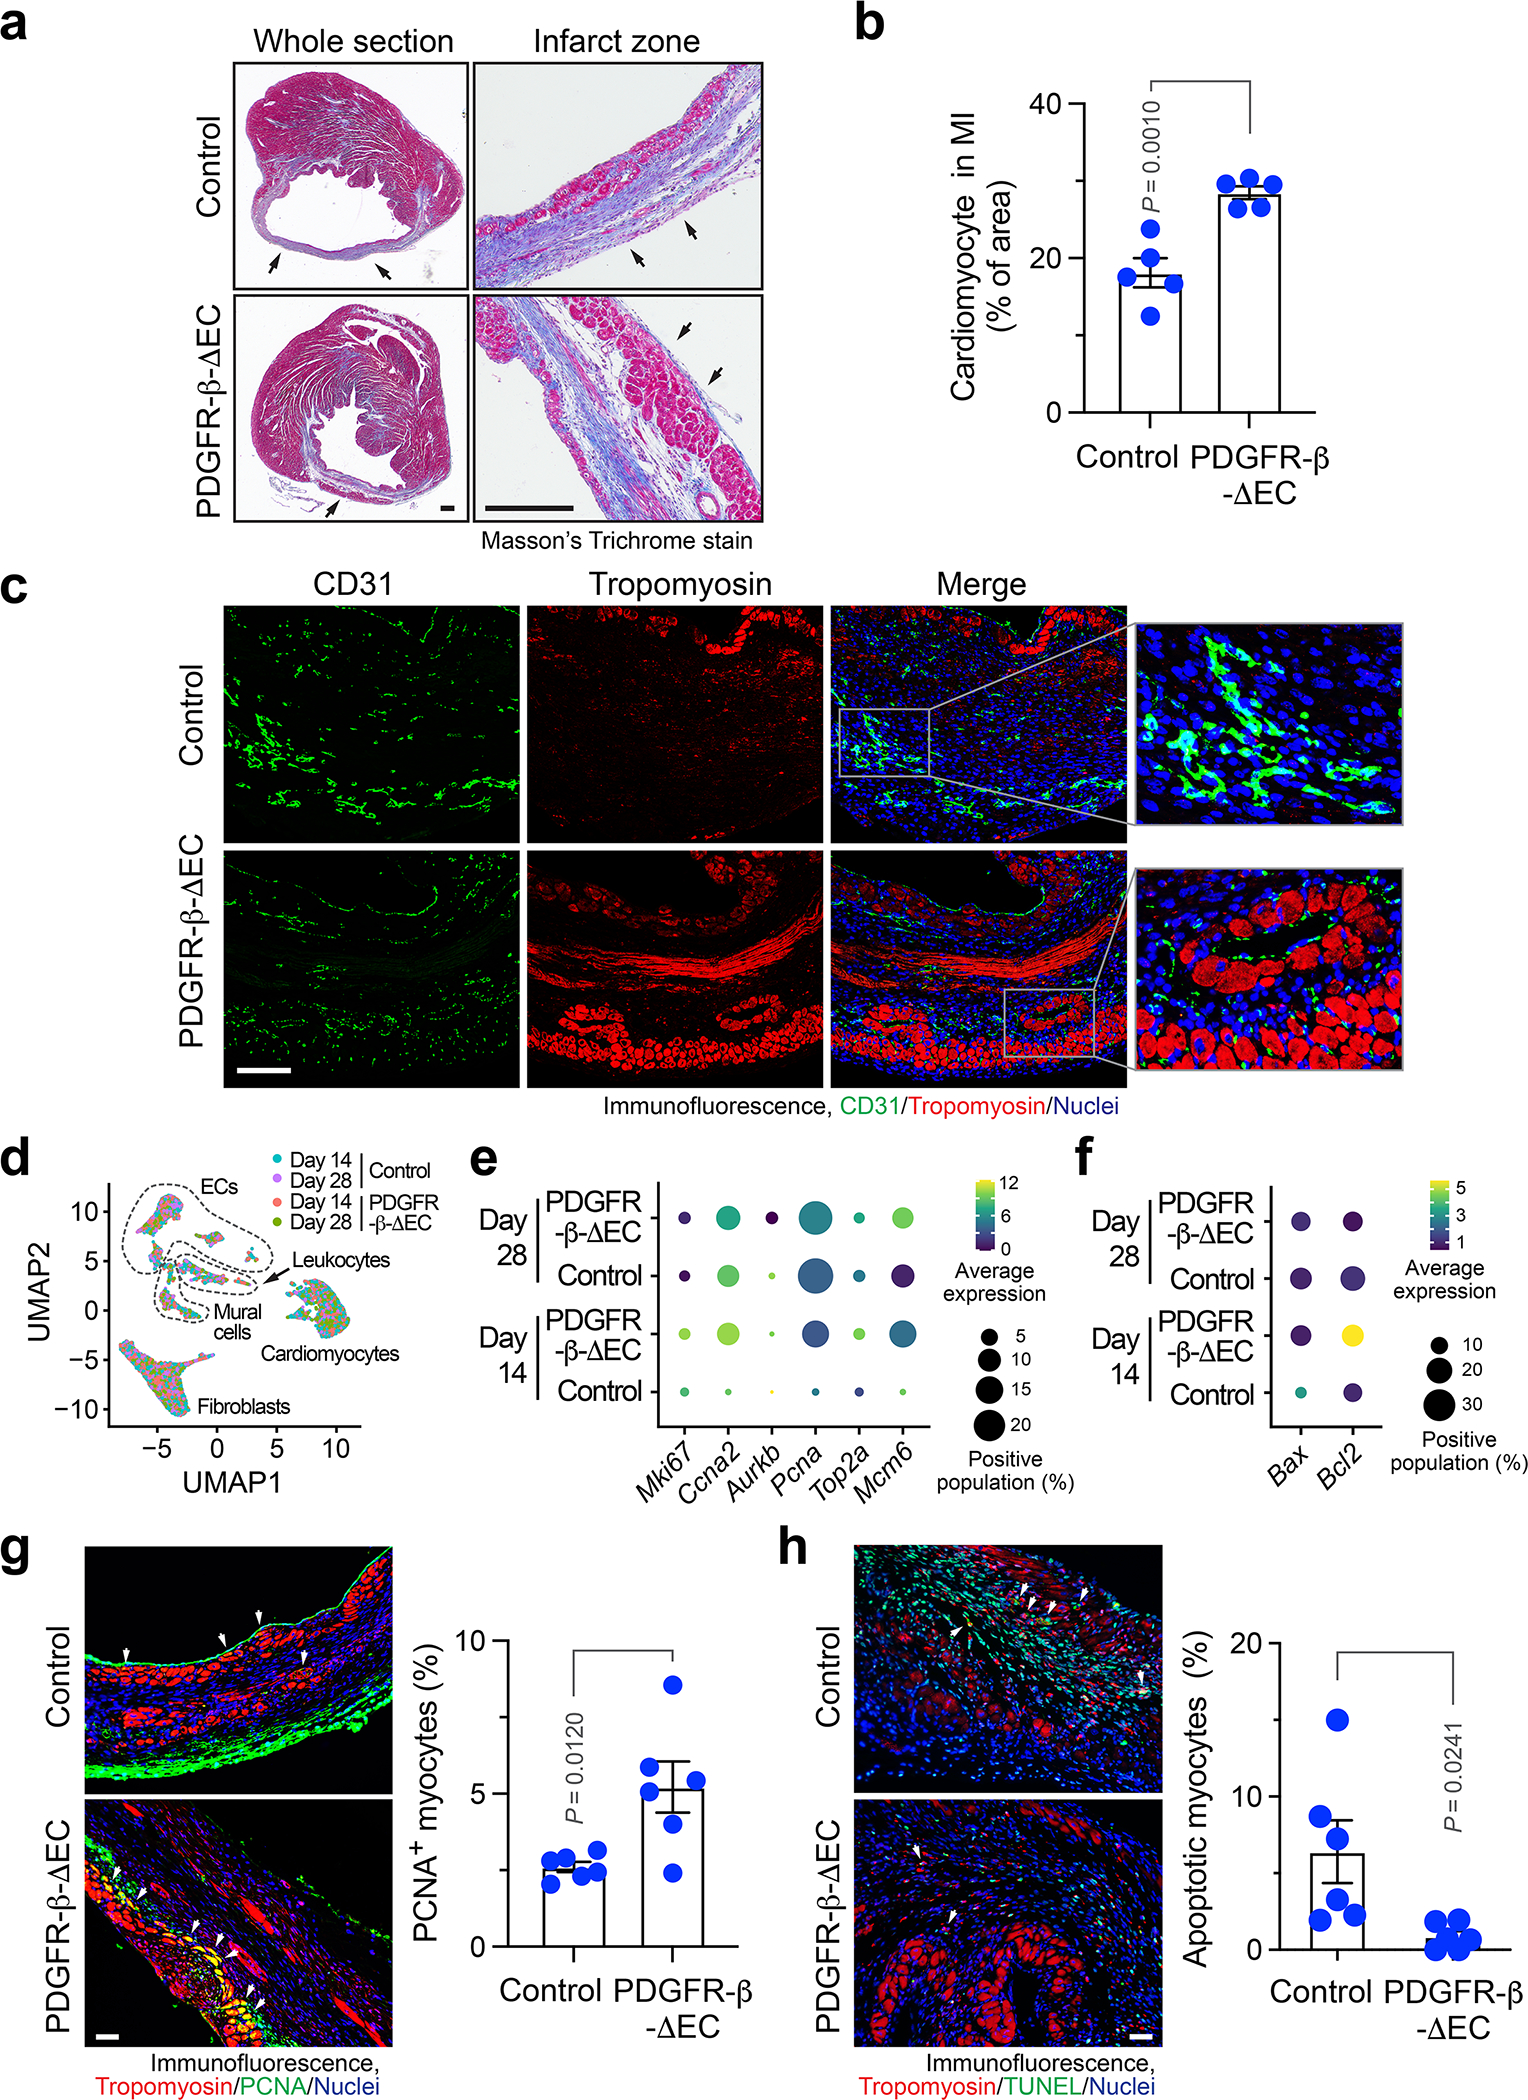
MI was induced in control and PDGFR-β-ΔEC mice. a,b, 21 days after MI induction, cardiac tissues were collected. Sections were stained with Masson’s trichrome stain. a, Representative images. Scale bar: 500 μm. Arrows indicate epicardium. b, Quantified cardiomyocyte area (mean ± SEM, n = 5 mice). Statistical analysis by unpaired two-tailed Students’ t test. c, 7 days after MI, MI tissue was harvested. Tissue sections were immunostained with anti-CD31 and anti-tropomyosin antibodies. Representative immunofluorescence images in infarct zone are shown (n = 3 mice). Scale bar: 100 μm. d-f, 14 and 28 days after MI, MI tissue was harvested, and analyzed by single-nuclei RNAseq. d, UMAP analysis of transcriptome gene signature. e,f, Expression of (e) proliferation- and (f) apoptosis-associated genes in cardiomyocytes. g,h, 14 days after MI induction, cardiac tissues were collected. g, Sections were stained with anti-tropomyosin and anti-PCNA antibodies. Left, representative images in infarct zone are shown. Scale bar: 100 μm. Arrows indicate PCNA+ cardiomyocytes. Right, quantified results (mean ± SEM, n = 6 mice). Statistical analysis by two-tailed Students’ t test. h, Sections were stained with anti-tropomyosin antibody and TUNEL. Left, representative images in infarct zone are shown. Scale bar: 100 μm. Arrows indicate apoptotic TUNEL+ cardiomyocytes. Right, quantified results (mean ± SEM, n = 6 mice). Statistical analysis by two-tailed Students’ t test.
PDGFR inhibition enhances cardiac function recovery after MI
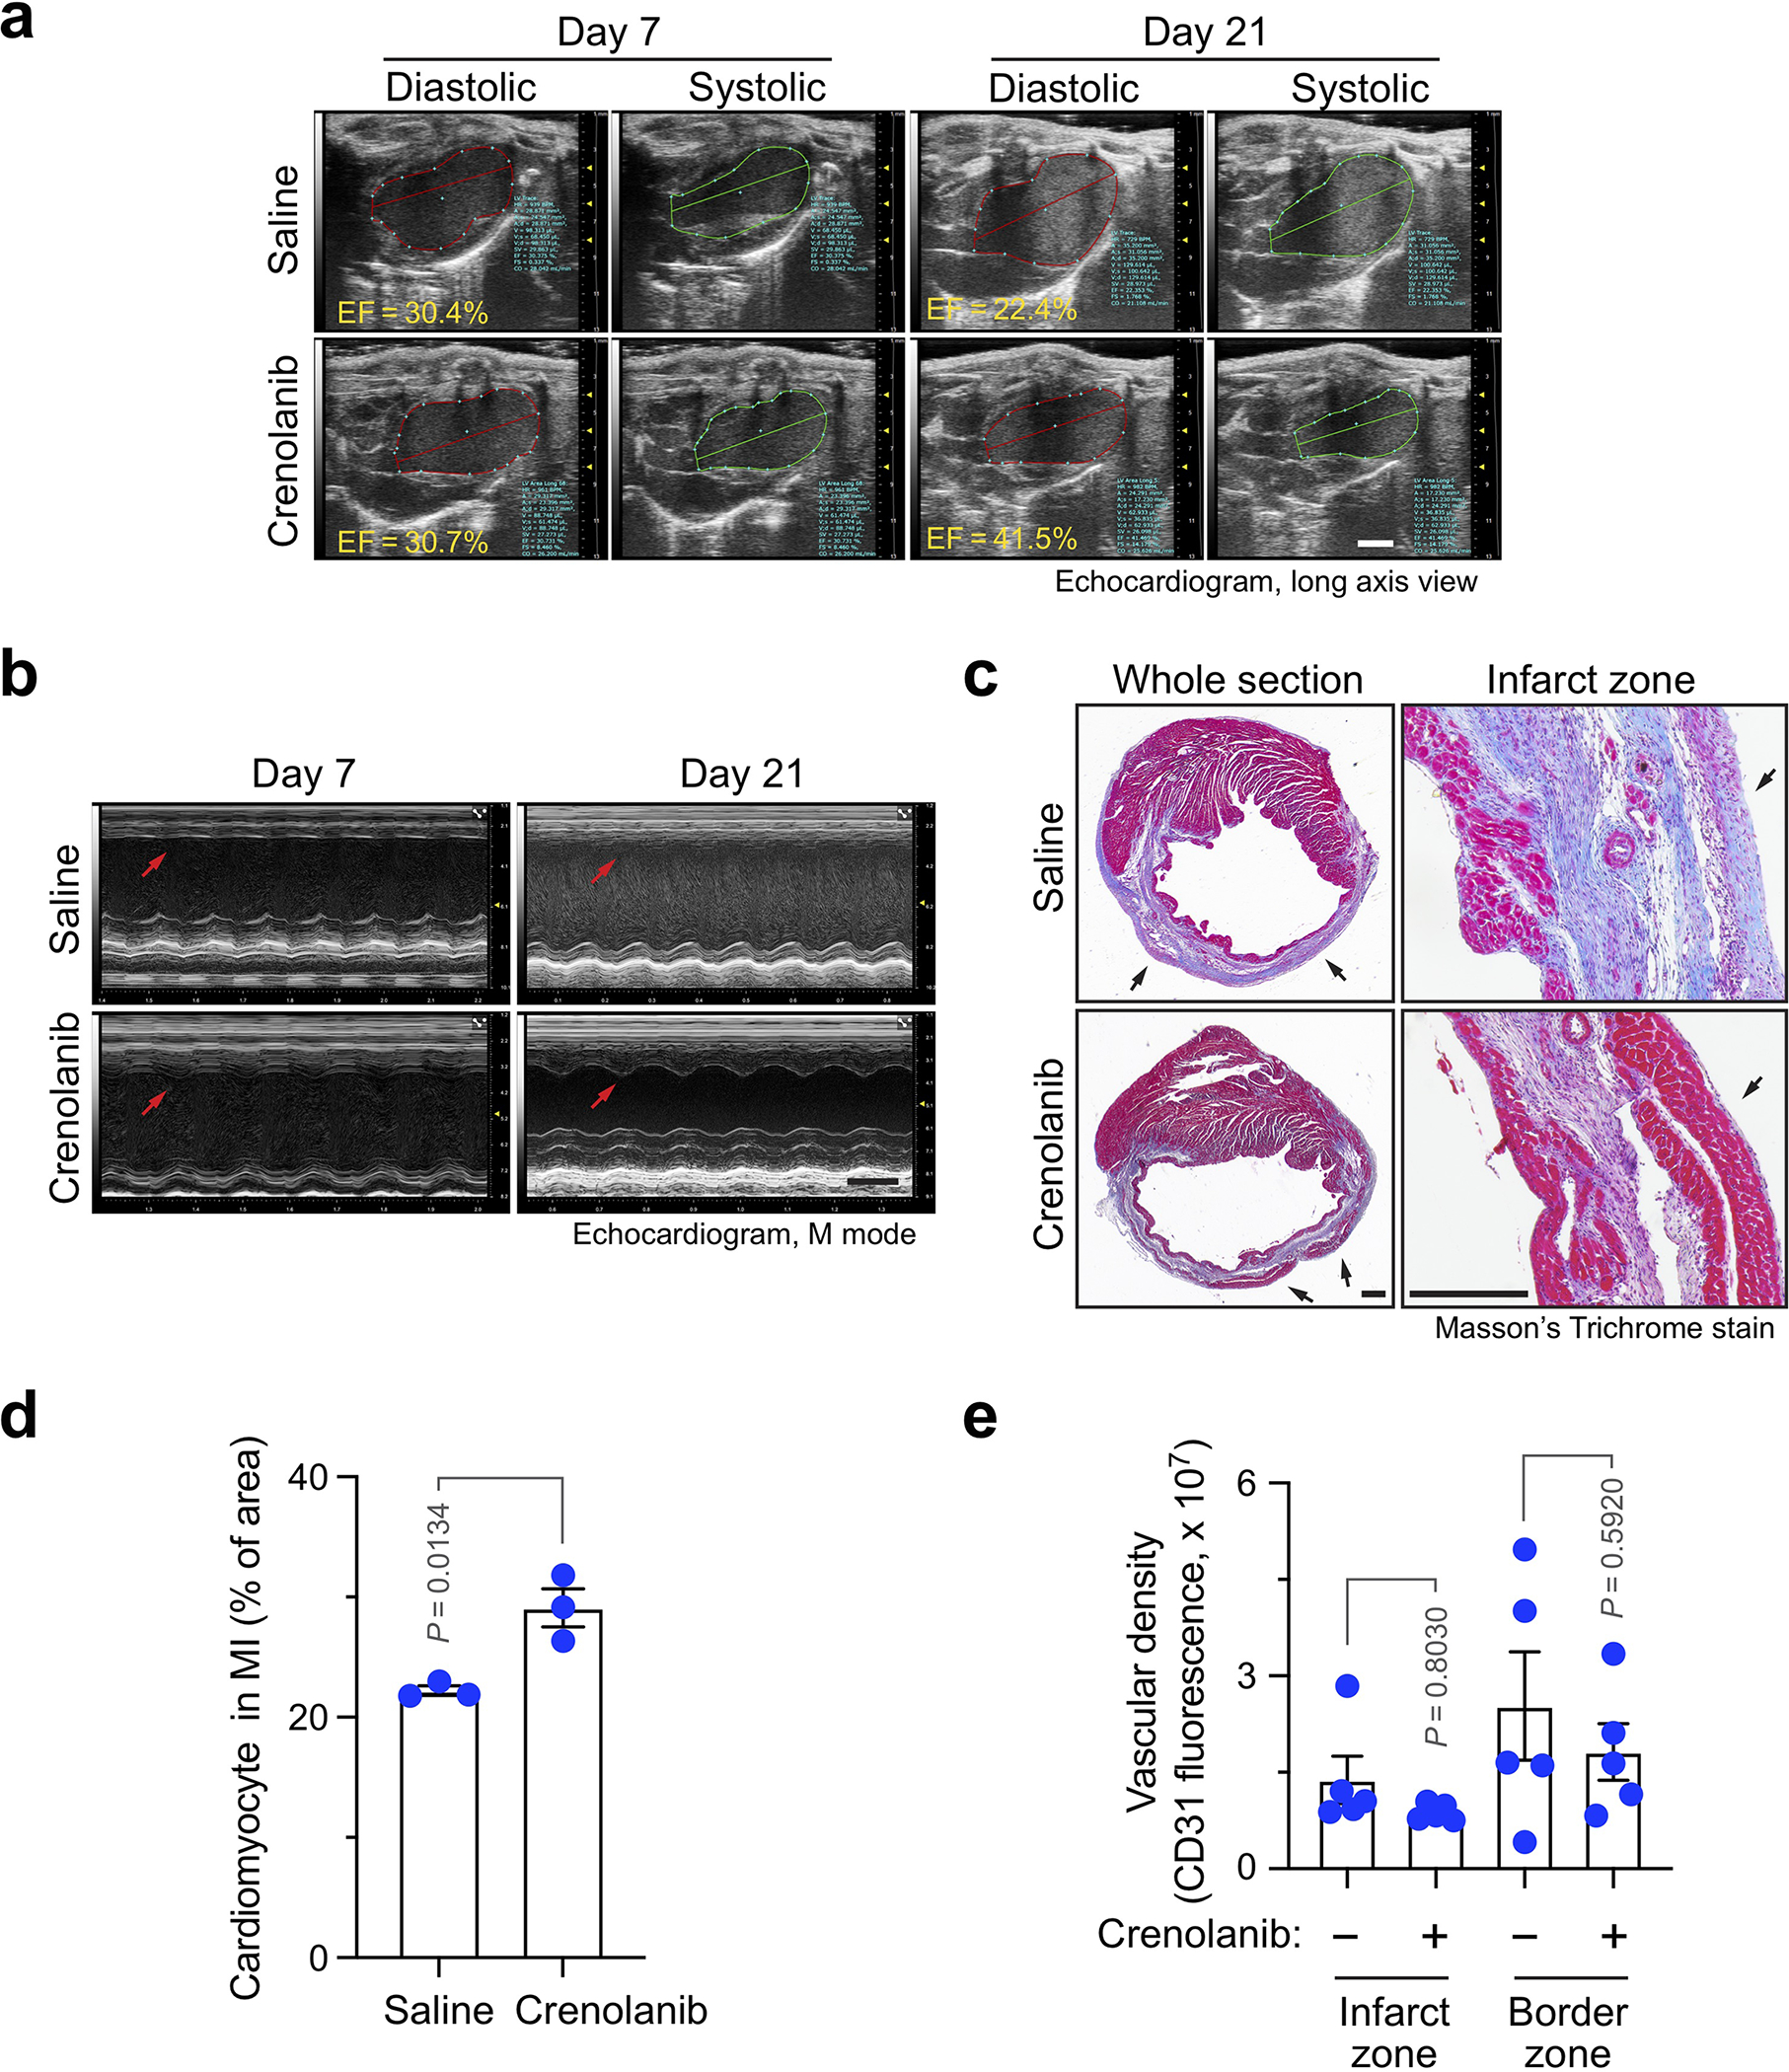
To test PDGFR as a target for vessel normalization therapy, MI was induced in mice, followed by administration with saline or pharmacological PDGFR inhibitor crenolanib (Fig. 8a). Considering a role of PDGF for pericyte coverage during the late phase of neovascularization, treatment was daily rendered during the first three weeks after MI to avoid disrupting vascular maturation in the later phase. Notably, crenolanib significantly enhanced cardiac function recovery at day 21 after MI, as evidenced by an EF increase (by +14.5%) in crenolanib-treated mice, compared with an EF decrease (by −16.7%) in saline-treated mice during that period (Fig. 8b, and Extended Data Fig. 10a). Moreover, MI induced left ventricular wall motion (WM) abnormalities, as indicated by weak WM at day 7 after MI; crenolanib, but not saline, partially restored the anterior WM at day 21 after MI (Extended Data Fig. 10b). Consistent with the improved cardiac function recovery after MI, crenolanib enhanced cardiac repair after MI (Extended Data Fig. 10c,d) but did not affect vascular density in infarct zone and border zone (Extended Data Fig. 10e).
Fig. 8. Pharmacological inhibition or nanoparticle-mediated targeting of PDGFR improves cardiac function recovery after MI.
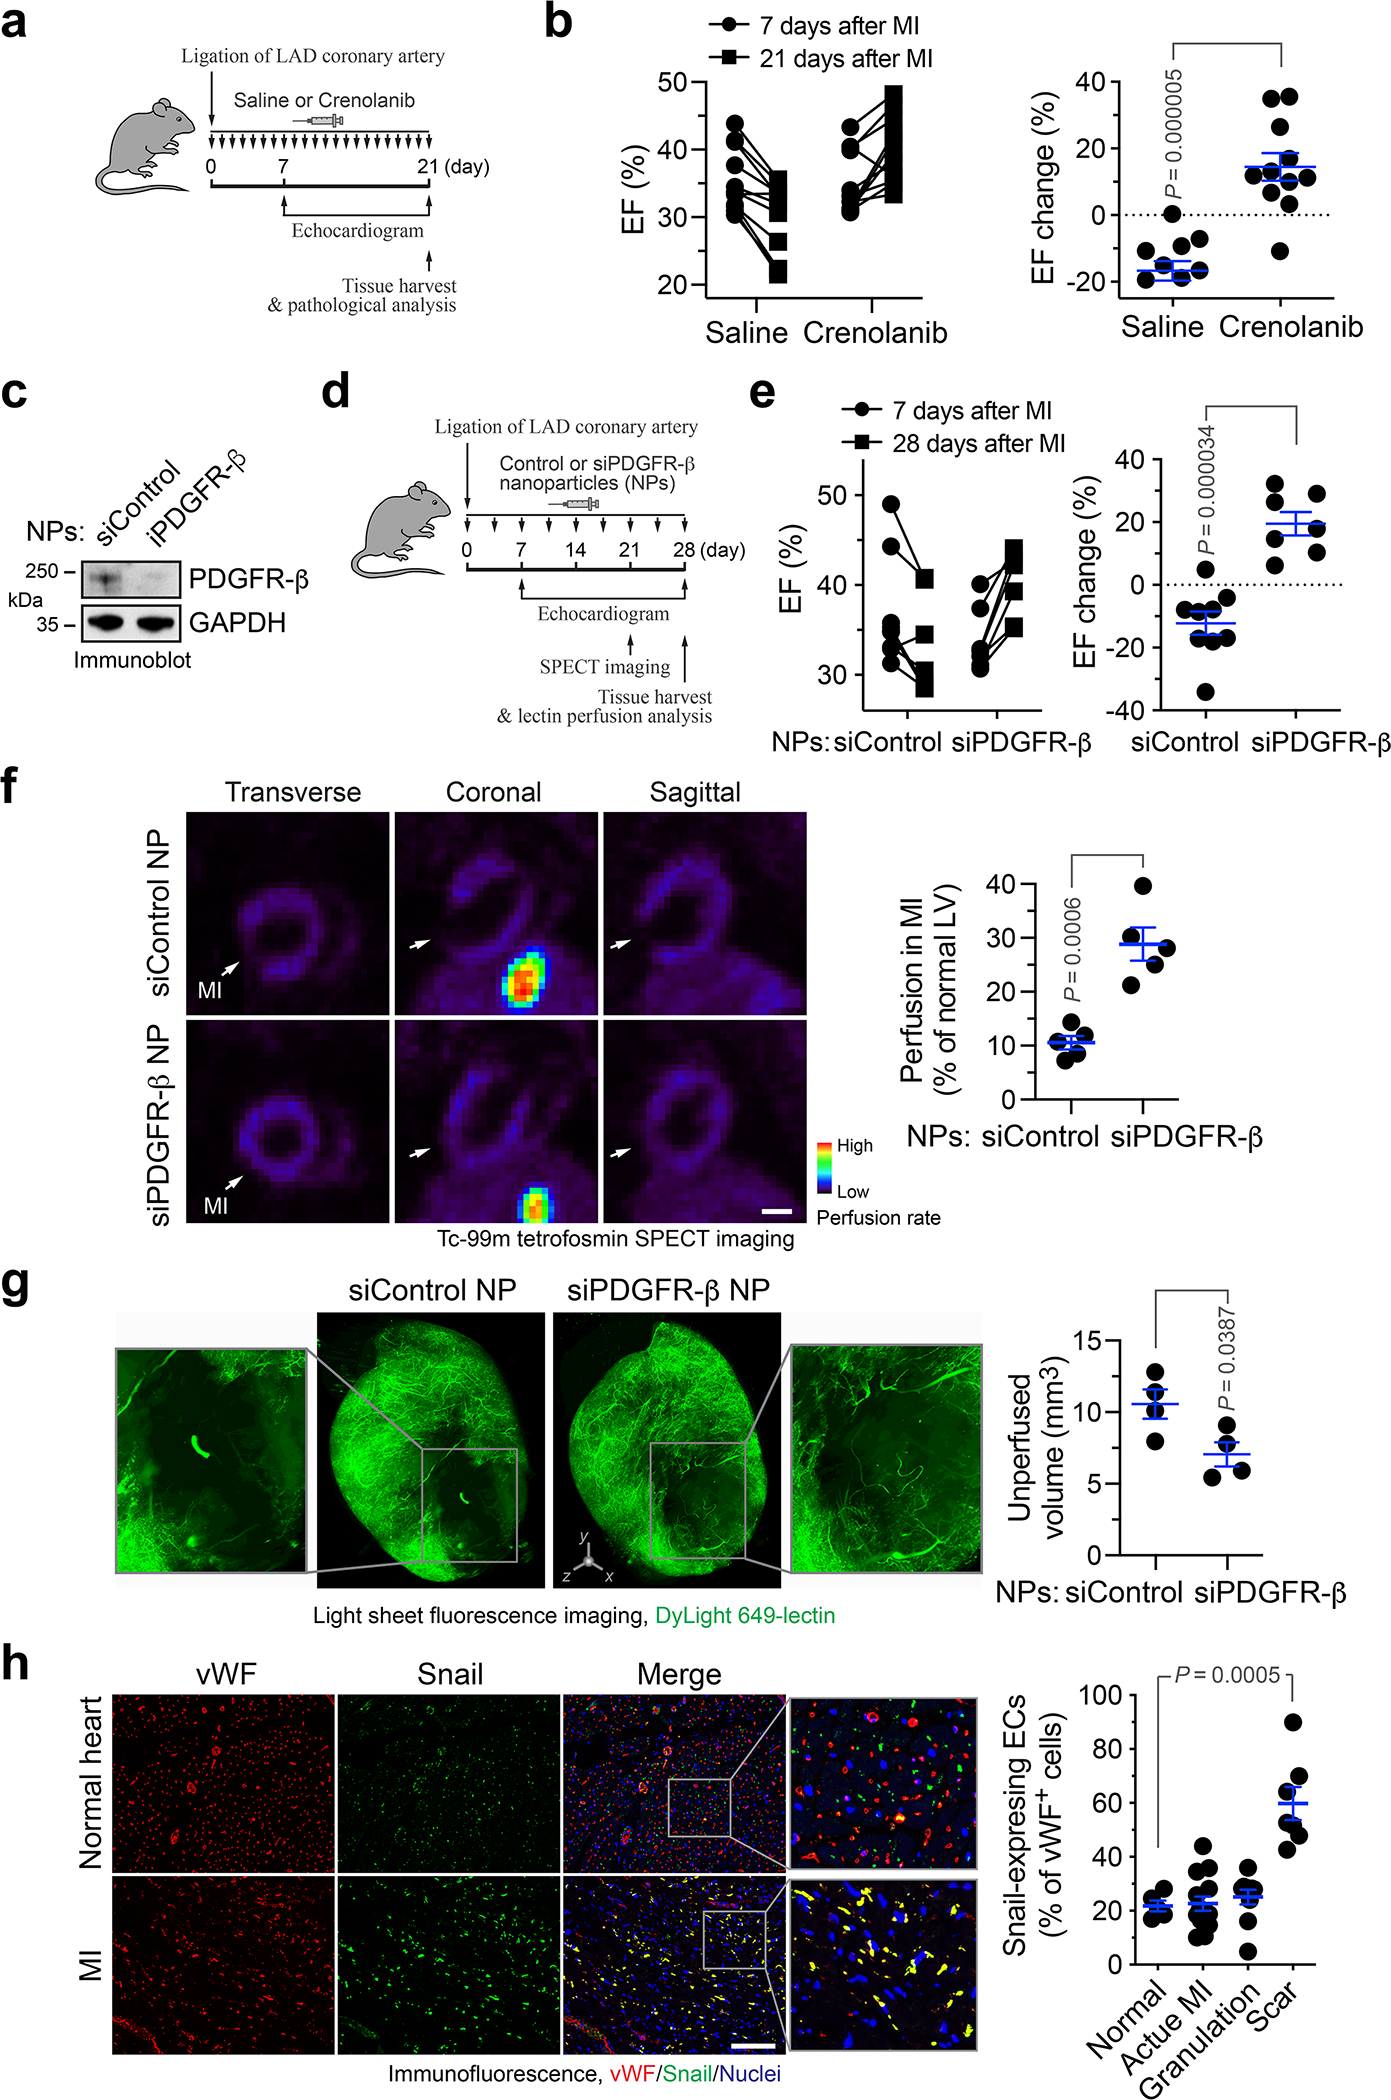
a,b, MI was induced in mice, followed by administration with saline or 15 mg/kg crenolanib. a, Schematic approach. b, Cardiac function was analyzed by long-axis echocardiogram (n = 11 mice). Left, EF values in individual mice. Right, % of EF changes from day 7 to 21 (mean ± SEM). Statistical analysis by two-tailed Students’ t test. c, Mouse cardiac microvascular ECs were pretreated with mouse cardiac-conditioned medium (CCM) and treated with siControl or siPDGFR-β NPs, followed by immunoblot analysis. This experiment was repeated independently twice with similar results. d-e, MI was induced in mice, followed by administration of siRNA nanoparticles (NPs). d, Schematic approach. e, Cardiac function was analyzed by long-axis echocardiogram (n = 9 mice for siControl NP group, and n = 7 mice for siPDGFR-β NP group). Left, EF values in individual mice. Right, % of EF changes from days 7 to 28 (mean ± SEM). Statistical analysis by two-tailed Students’ t test. f, Mice were subjected to cardiac SPECT scanning. Left, representative images. Bar, 1 mm. Right, quantified results of perfusion rate in MI region (mean ± SEM, n = 5 mice). Statistical analysis by two-tailed Students’ t test. g, Mice were perfused with DyLight 649-conjugated lectin 28 days after MI induction, and subjected to light sheet fluorescence imaging. Left, representative images. 3D scale bar, 0.5 mm. Right, quantified results of unperfusion volume in cardiac tissues (mean ± SEM, n = 4 mice). Statistical analysis by unpaired two-tailed Students’ t test. h, Human heart sections from healthy controls (n = 5 humans), or cardiac patients with pathological diagnosis of acute MI (n = 14 patients), granulation tissue (n = 10 patients) and scar-containing tissue (n = 7 patients), were immunostained with anti-vWF and -Snail antibodies. Snail-expressing ECs in vWF+ ECs were counted and quantified (mean ± SEM). Statistical analysis by two-tailed Students’ t test.
We finally tested experimental therapy with a polymer-lipid nanoparticle-based system for targeted delivery of PDGFR-β siRNA into ECs (Fig. 8c,d) 24,25, which is not expected to disrupt PDGF-mediated pericyte function and vessel maturation. Treatment of MI-bearing mice with nanoparticle containing PDGFR-β siRNA (siPDGFR-β NP) showed similar therapeutic efficacy, compared with crenolanib (Fig. 8e). siPDGFR-β NP markedly improved vessel function, as indicated by an about 2-fold increase in MI tissue perfusion detected by SPECT (Fig. 8f) and by a ~30% decrease in un-perfused volume of MI tissues detected by lectin perfusion (Fig. 8g). Collectively, these data show that PDGFR inhibition or targeted PDGFR-β ablation in ECs improves tissue perfusion and repair and promotes cardiac function recovery after MI.
In addition, we tested endothelial plasticity in infarcted or healthy cardiac tissue from human subjects. Immunofluorescence analysis of the tissue sections showed Snail expression in MI-associated vWF+ ECs, particularly in scar-containing MI tissues (Fig. 8h), suggesting robust Endo-MT in MI-associated human ECs in accordance with our results with mouse studies.
DISCUSSION
Neovascularization is crucial for tissue repair after ischemia. As such, pro-angiogenic therapy that targets VEGF, placental growth factor (PlGF), and basic fibroblast growth factor (bFGF) to promote neovascularization in the ischemic tissue has been extensively exploited in clinic by gene-, protein-, and cell-based treatments, but the therapeutic efficacy is limited 2–6. Likewise, ischemia itself induces angiogenesis through HIF-1α-dependent expression of VEGF 26–28, but fails to efficiently generate re-perfusion and improve cardiac function recovery. Conceptually, angiogenic factors, such as VEGF, stimulate EC migration and proliferation to enhance sprouting angiogenesis; however, they could also induce vessel abnormalities and instability, e.g., vascular leakiness and dilation 29,30. Based on these findings and our results, we suggest that the difficulties and failures in pro-angiogenic therapy could be explained by non-productive neovascularization, i.e., the induced angiogenesis, albeit robust, is defective, due to structural and functional abnormalities in the newly formed vasculature. Our work defines MI-associated aberrant vascularity and suggests that vessel normalization may join therapeutic angiogenesis as promising strategies for improving cardiac repair after MI.
We propose endothelial plasticity as a potential target for vessel normalization therapy in MI. Our recent studies indicate that tumor-associated ECs acquire mesenchymal phenotypes to enhance cell proliferation and migration, thereby promoting vessel sprouting and outgrowth and inducing vascular abnormalities in glioma, and these cells retain their EC functions in the cancer microenvironment 16. Likely due to a similar hypoxic, inflammatory microenvironment in the infarcted cardiac tissue, MI-associated ECs undergo Endo-MT to generate aberrant vasculature that could not efficiently deliver oxygen, nutrients, and possibly circulating stem cells to fuel cardiac repair after MI. Our work suggests that acquisition of genetic reprogramming to express a mesenchymal gene signature in ECs enhances their ability to proliferate, migrate, and dissociate, and thereby leads to non-productive angiogenesis, possibly affecting most of fast-growing MI-associated capillaries, which serves as a target for vessel normalization therapy in MI. Considering a dispensable role of PDGFR-β-mediated endothelial plasticity for developmental angiogenesis 23, targeting Endo-MT may represent a safe, selective strategy for vessel normalization therapy.
Previous work suggests that Endo-MT significantly contributes to de novo fibroblast generation during cardiac fibrosis 11. However, our single-cell transcriptome study shows that ECs keep their endothelial identity but acquire mesenchymal and proliferative gene signatures three weeks after MI, serving as evidence for partial Endo-MT and suggesting that a major function of endothelial plasticity is to enhance EC mitosis and motility and to induce vessel abnormalities during this period. Notably, we show that inhibition of Endo-MT by PDGFR-β knockout in ECs does not affect collagen deposition after MI, indicating that Endo-MT does not significantly contribute to fibroblast generation in this time frame. Consistent with our findings, a previous study using laser capture microdissection shows that Cdh5-Cre-traced ECs express Endo-MT-associated genes after MI, suggesting that partial Endo-MT may be associated with EC clonal expansion and ischemia-induced vessel growth 13. Interestingly, a recent report shows slight increases in expression of Endo-MT markers in Pdgfb-Cre-traced, MI-associated ECs one week after MI, but no EC subpopulations with switched lineage are detectable in the infarct tissue 14, suggesting that Endo-MT is a dynamic process subjected to temporal regulation. Consistent with a more recently published elegant work showing a transient mesenchymal activation in cardiac ECs after MI15, our study shows robust mesenchymal gene expression after MI, which reaches a peak at 1 week after MI, followed by a gradual decrease to a lower level for 3 weeks, contributing to EC dysfunction and vessel abnormalities. We suggest that the retained mesenchymal activation, albeit in small portion of ECs (5–20%, Fig. 1i), could disrupt vessel integrity, as teamwork of entire ECs is required for vascular homeostasis.
The regulatory mechanisms underlying Endo-MT remain largely unclear. Endothelial plasticity could be mediated through FGF, transforming growth factor (TGF)-β, bone morphogenetic protein (BMP), HGF/c-Met, and Notch pathways 12,16,31–33. Consistent with this work, we previously identified a Snail-mediated mechanism controlling Endo-MT in brain ECs under cancer conditions, namely, PDGF induces NF-κB-dependent Snail expression, leading to VEGFR-2 downregulation and EC resistance to anti-VEGF treatment 23. Here our study reveals that ischemia or hypoxia serves as a trigger to amplify NF-κB-mediated Snail expression through a NF-κB/HIF-1a/Snail mechanism, driving robust Snail expression and sequent Endo-MT and aberrant vascularization after MI. It has been well established that Snail plays a key role for EMT in tumor cells 21,34, as Snail binds to the promoter region of cadherins, suppressing their transcription and facilitating EMT in epithelial cells 35,36. Supportive of our work, NF-κB and HIF-1α contributes to regulation of Snail expression during EMT 37–40. Regarding Endo-MT, recent studies suggest that Snail is critical for endothelial plasticity induced by hypoxia, TGF-β treatment, or shear stress 41–43. Consistent with our work, previous studies suggest that Snail acts as a transcriptional suppressor of VE-cadherin in trophoblast cells or ECs under cancer conditions 44,45. Our work shows that VE-cadherin downregulation induces Endo-MT, suggesting a critical role for destabilization of VE-cadherin-mediated adherens junctions plays in endothelial plasticity regulation.
PDGF has a multifaceted role in cardiac repair after MI, acting mainly through spatiotemporal regulation of angiogenesis and fibrosis. PDGFs, particularly PDGF-BB, stimulates EC proliferation and enhances vessel functionality with maturation by promoting pericyte recruitment to the newly formed vessels 46–48. Our work suggests that excessive PDGF-AB, possibly derived from hypoxic cardiomyocytes and fibroblasts, induces Endo-MT-mediated vessel abnormalities in an ischemic microenvironment. As such, we show that PDGF inhibition normalizes vasculature and improve cardiac function recovery after MI. Consistent with our findings, previous work shows that imatinib, a pharmacological inhibitor of PDGFR, ABL, and c-Kit, does not affect vascular density but moderately improves cardiac function after MI in rats 49. Moreover, antibody-based PDGFR-β blockade does not reduce capillary density in the injured tissue after a transient ischemia followed by reperfusion, but it impedes vascular maturation likely due to impaired pericyte coverage 50, implicating that MI therapy by PDGF inhibition requires temporal optimization to avoid disturbing vessel maturation in the later phase of cardiac repair. In addition, considering the role of PDGFs as mitogens for fibroblasts, PDGFR inhibition may inhibit cardiac interstitial fibrosis to improve ventricular dysfunction 49. To be noted, our work shows that PDGFR-β knockout in ECs robustly improves cardiac repair and functional recovery after MI, suggesting a major beneficial effect of PDGF inhibition via vessel normalization.
In summary, we characterize MI-associated vascular aberrancy, which is driven by endothelial plasticity. We identify a PDGF/NF-κB/HIF-1α/Snail axis that induces VE-cadherin down-expression, mesenchymal-like transcriptional activation, and vessel abnormalities. Notably, genetic ablation or targeted disruption of PDGF signaling normalizes vasculature and improves cardiac function recovery after MI. As such, vessel normalization by targeting PDGF/Snail-mediated endothelial plasticity may offer exciting opportunities to treat ischemic heart diseases.
METHODS
Mice
Cdh5-CreERT2;Rosa-LSL-tdTomato and Tie2-Cre;Rosa-LSL-tdTomato mice were generated by crossing Rosa-LSL-tdTomato mice (Jackson Lab) with Tie2-Cre mice (Jackson Lab) and Cdh5-CreERT2 mice (generated by Ralf Adams, Max Planck) 51. Cdh5-CreERT2; Pdgfrbfl/fl mice were generated by crossing Pdgfrbfl/fl mice (Jackson Lab) with Cdh5-CreERT2 mice. For mice with Cdh5-CreERT2 background, animals (2 weeks old) were intraperitoneally injected with 0.1 ml of 5 mg/ml tamoxifen daily for consecutive 5 days. All animals were housed at room temperature with a 12-light/12-dark cycle and fed a standard chow diet ad libitum with free access to water in the Association for the Assessment and Accreditation of Laboratory Animal Care-accredited animal facility of the University of Pennsylvania. All experiments with mice were performed in accordance with a protocol approved by the Institutional Animal Care and Use Committee (IACUC) at the University of Pennsylvania.
MI induction
MI was induced by ligation of left anterior descending (LAD) coronary artery as we described previously 52. In brief, mice (half male and half female, 6–8 weeks old) were given buprenorphine SR (1 mg/kg) 1 h before surgery and then anesthetized by injection of 100 mg/kg of ketamine and 10 mg/kg of xylazine. Mice were endotracheal intubated and ventilated at 100 breaths per minute using a rodent ventilator (Kent Scientific). After sternotomy, proximal LAD was ligated with 8–0 Prolene thread, and the ligation verified by blanching and dysfunction of the anterior wall. For sham operation, the suture was passed around the coronary artery but not ligated. Mice were under isoflurane (1–3%) to maintain an adequate anesthesia during surgery.
Echocardiography
For LV function evaluation by echocardiography, as recommended by American Society of Echocardiography 53, we performed LV volumetric measurements using two-dimensional (2D) LV long-axis view with a Vevo 2100 imaging system (VisualSonics) and an ultra-high frequency linear array transducer (MicroScan MS400 18–38 MHz transducer, VisualSonics). Ejection fraction (EF) and stroke volume (SV) were analyzed using Vevo Lab 3.2.0 software (VisualSonics). Echo imaging was performed on mice 7, 14, 21, 28, or 56 days after MI surgery. In some experiments, M-mode images were obtained to show the motion of LV anterior wall. After LAD ligation, mice were subjected to echocardiography to monitor consistence of infarction, and mice with similar EF (30% - 50%) at day 3 (for control vs PDGFR-β-Δ-EC mice) or 7 (for PDGFR inhibition) were chosen for further analyses.
Single-cell RNAseq analysis
MI was induced in Cdh5-CreERT2;Rosa-LSL-tdTomato mice. 0, 1, 2, 3, and 8 weeks after the MI surgery or sham operation, mice were euthanized and perfused with PBS supplemented with EDTA, and hearts were harvested. Infarcted tissue was dissected under a stereomicroscope, and digested with DNase (1 mg/ml, Sigma D4527) in papain digestion medium [23.6 mg papain (Worthington Biochem, APL), 4.5 mg EDTA, and 4.5 mg L-Cysteine (Sigma, C7352) in 25 ml EBSS (Sigma, E2888)]. Single cell suspension was prepared after filtering with a mesh strainer (100-μm pores). Cells were treated and analyzed following a manufacturer’s V3 library protocol (10x Genomics) and single-cell RNA-seq at the next-generation sequencing core at the University of Pennsylvania. Data were analyzed using CellRanger software 6.1.2 and a pipeline that produces sparse numerical matrices for each sample, with gene-level counts of unique molecular identifiers (UMI) identified for all single cells passing default quality control metrics. These gene expression matrices were processed with Seurat 4.0 and Monocle3 R package 54. For single cell trajectory construction and pseudotime measurement, cells with EC lineage were subsetted from the original dataset and then further re-clustered and processed. Choice of root node was based on the local maximum of EC marker expression, which was determined by the spatial distribution of expressing cells and the gradient of expression.
Single-nuclei RNAseq analysis
Cardiac tissues were excised from Cdh5-CreERT2;Pdgfrbfl/fl and Pdgfrbfl/fl mice, cut into small pieces, and homogenized using a tissue grinder (Sigma, D8938) in isolation buffer (0.32 M sucrose, 5 mM CaCl2, 3 mM MgAC2, 0.1 mM EDTA, 0.1% Triton X-100, and 10 mM Tris-HCl pH 8.0) supplemented with cOmplete protease inhibitor cocktail (Sigma, 11697498001). Tissues were processed with homogenizers pestle A for 15 strokes and pestle B for 25 strokes to release the nuclei, followed by filtration with a 40-μm Flowmi cell strainer (SPBel-Art, H13680–0040), centrifugation at 500 × g for 5 min at 4 °C, and washing with 0.01% BSA in PBS. The nuclei were counted and diluted to 700–1,200 nuclei/μl and analyzed followed by a 3’ GEX library protocol (10x Genomics, V3.1) for single-nuclei RNA-seq at the next-generation sequencing core at the Children’s Hospital of Philadelphia. Data were analyzed using CellRanger software 6.1.2 (10x Genomics) and a pipeline that produces sparse numerical matrices for each sample, with gene-level counts of unique molecular identifiers (UMI) identified for all single cells passing default quality control metrics. These gene expression matrices were processed with Seurat 4.0 and Monocle3 R package 54.
Cardiac EC isolation, RNA amplification and RNAseq analysis
MI surgery or sham operation were performed in Tie2-Cre;Rosa-LSL-tdTomato mice (6–8 weeks old). 3 weeks after the surgery, infarcted tissues or normal LV were harvested. Single-cell suspension was prepared as described above. Cells were incubated with anti-F4/80 antibody (Miltenyl Biotec, #130–102-327), and tdTomato+F4/80− cells were sorted by using a flow cytometer (BD FACS Aria). RNA was extracted using TRIzol (Thermo Fisher, 15596026) according to the manufacturer’s instructions, followed by RNA purification using a RNeasy Plus Mini Kit (Qiagen). Three rounds mRNA amplification was performed as we previously described 55. In brief, cDNA was obtained by reverse transcription with Superscript III (Thermo Fisher, 18080044), and a second complementary cDNA strand was synthesized by DNA polymerase (10 U/μl, Thermo Fisher, 18010025), followed by in vitro RNA transcription using a MEGASCRIPT T7 KIT (Thermo Fisher, AMB13345) and RNA purification using a MEGACLEAR KIT (Thermo Fisher, AM1908). After three rounds of mRNA amplification, quality control was validated using a RNA Nano assay chips with a 2100 Bioanalyzer (Agilent). The library was constructed according to a TruSeq protocol (Agilent), followed by sequencing (100 PE, about 10 megabyte reads for each sample) with a HiSeq 2500 Illumina sequencer at the Children’s Hospital of Philadelphia core facility.
Isolation and culture of mouse ECs
Mouse aorta ECs were isolated and cultured as we previously described 16. In brief, thoracic aorta was isolated from 3-week-old mice. Aortic rings were embedded in Matrigel-coated dishes and cultured for 5 days. After the rings were removed, remaining cells were incubated with 2 U/ml Dispase I (Gibco, 17105–041) for 20 min at 37 °C. After centrifugation at 500 × g for 10 min, the cell pellets were washed with PBS, and cultured in ECM complete medium (ScienCell, 1001).
Isolation and culture of mouse cardiomyocytes
Neonatal C57/B6 mouse pups (P1-P3) were euthanized. Hearts were excised and minced into small pieces in PBS supplemented with 20 mM BDM (Millipore, 31550) on ice., followed by digestion with 1.5 mg/ml collagenase/dispase enzyme mixture (Sigma, 10269638001) in L-15 medium (Thermo, 11415064) supplemented with 20 mM BDM at 37 °C for 30 min. The single cell suspension was filtered with a 100-μm strainer, spun down at 300 rpm for 5 min, and resuspended in culture medium (L-15 medium supplemented with 10 mM HEPES and 5% FBS). After cells were incubated in a gelatin-coated culture dish at 37 °C for 3 h to allow cardiac fibroblasts and endothelial cells to adhere to the culture dish, the supernatant was collected and cultured in the culture medium containing 10 μM Ara-C (Sigma, C6645). Primary cardiomyocytes were cultured for 5–7 days with medium change every 3 days.
Tissue protein extraction
The heart tissues from Cdh5-CreERT2;Pdgfrbfl/fl and Pdgfrbfl/fl mice were collected and homogenized in PBS with proteinase inhibitor cocktail (Roche, 11697498001), followed by tissue lysis with NP-40 buffer.
Preparation of cardiac-conditioned medium (CCM)
Mouse cardiac muscle HL-1 cells were cultured in Claycomb medium (Sigma, 51800C) supplemented with 10% FBS (Sigma, F2442), 0.1 mM norepinephrine (Sigma, A0937–1G), and 2 mM L-glutamine (Sigma, G7513). Primary mouse cardiomyocytes were cultured in L-15 medium (Thermo, 11415064). supplemented with 10 mM HEPES and 5% FBS. Cells at 90% confluence were exposed to hypoxia (1% O2) or normoxia for 48 h. Mouse primary cardiac fibroblasts (ScienCell) were cultured in Claycomb medium. Culture medium was centrifuged at 5,000 × g for 30 min to remove cellular debris, and the supernatant was collected.
Cell culture and treatment
Human primary cardiac microvascular ECs (ScienCell and Cell Biologics) were maintained in Endothelial Cell Medium (ECM, ScienCell), and used between passages 2 and 5. All cells were checked and showed no mycoplasma contamination. Cells were treated with recombinant human PDGF-AA (100 ng/ml, Peprotech, 100–13A), PDGF-AB (100 ng/ml, Peprotech, 100–00AB), PDGF-BB (100 ng/ml, Peprotech, 100–14B), or crenolanib (5 nM, ChemieTek, CP-868596).
siRNA treatment
ECs at 50% confluence were transfected with control non-targeting siRNA (Qiagen, 1027280) or siRNAs targeting Snail (Thermo Fisher, s13185), NF-κB (Cell Signaling, 6261), HIF-1α (Thermo Fisher, 42840), or PDGFR-β (Thermo Fisher, s10242) using Lipofectamine 2000 (Thermo Fisher, 11668–019) in serum-free Opti-MEM medium (GIBCO, 31985–070) for 8 h, followed by recovery with serum-supplemented medium for 24 h.
CRISPR sgRNA treatment
Human primary cardiac ECs were treated with a dCas9 activation system (Addgene, 61422, 61426) and a CDH5 SAM guide RNA 5’-AGCCAGCCCAGCCCTCACAA-3’. ECs at 50% confluence were transduced with lentivirus encoding non-targeting control sgRNA or Cdh5 SAM sgRNA with 8 μg/ml polybrene and spun at 2,000 × g for 2 h at room temperature. After centrifugation, cells were cultured in fresh ECM medium.
Cell viability assay
Treated ECs were trypsinized and seeded on 96-well plates at a density of 1,000 cells/well, and allowed to attach for 4 h. Cell viability was determined by Cell-Titer assay (Promega, G7571) according to the manufacturer’s instruction. Luminescence was detected by using a luminescent plate reader (Synergy H4 Hybrid, BioTek).
Cell migration assay
Treated ECs were seeded 5 × 10⁴ cells/well on 8 μm-pore insert membranes (Falcon, 353097) in a 24-well plate and allowed to attach for 4 hr. Cell migration was induced by adding 5% FBS in the bottom chamber. After 4-h induction, cells on the top of membrane were swiped off with cotton swabs. Cells were fixed in methanol for 10 min and stained with Toluidine Blue O (Sigma, 198161) for 5 min. Images were taken in 3–4 fields each well, and stained cells were counted.
In vitro vascular permeability assay
Treated ECs were seeded on transwell inserts with 0.4 μm pore membrane (Costar, 3413) in a 24-well plate, and cultured overnight to reach confluence. Cells were incubated with ECM without phenol red. FITC-dextran (MW = 70,000 Da, Santa Cruz, SC-263323, 10 μg/ml) was added to the top chamber. The medium from the lower chamber was collected, and fluorescence was measured with excitation wavelength at 485 nm and emission at 530 nm.
Dil-Ac-LDL absorption assay
Treated ECs were incubated with Dil-Ac-LDL (10 μg/ml, Alfa Aesar, J65597) in serum-free medium containing 3% BSA for 5 h at 37 °C. Cells were fixed with 3% paraformaldehyde, and stained with anti-FSP-1 antibody (1:100, Millipore, 07–2274) and Alexa Fluor 488-conjugated IgG. The slides were mounted with DAPI-containing mounting medium (Vector, H-1200), and imaged with an AxioImager microscope (Zeiss) equipped with AxioCam 506 monochrome CCD camera (Zeiss).
Immunoblot analysis
Cells were lysed with a NP-40 lysis buffer containing protease inhibitor cocktail (Roche, 11697498001), followed by measurement of total protein concentration. A total 20 μg protein of the lysates was resolved by 4–15% precast SDS-PAGE gel (Bio-Rad). After transfer, PVDF membranes were blotted with anti-GAPDH (Cell Signaling, 5174), anti-FSP-1 (Millipore, 07–2274), anti-VEGFR-2 (Cell Signaling, 9698), anti-N-cadherin (Cell Signaling, 13116), anti-α-SMA (Abcam, ab5694), anti-NF-κB (Cell Signaling, 8242), anti-Snail (Cell Signaling, 3879S), anti-Slug (Cell Signaling, 9585S), anti-TCF3 (Cell Signaling, 2883), anti-Zeb1 (Cell Signaling, 3396), anti-Sip1 (BETHYL, A302–474A-T), anti-HIF1α (Cayman Chemical, 10006421), anti-VE-Cadherin (Cell Signaling, 2500), anti-PDGFR-β (Cell Signaling, 3169), anti-Akt (Cell Signaling, 4685), anti-phospho-Akt (Cell Signaling, 9271), anti-Erk1/2 (Cell Signaling, 4695), and. anti-phospho-Erk1/2 (Cell Signaling, 4376) antibodies at 1:1,000 dilution. Proteins were detected with HRP-conjugated antibodies specific for either rabbit or mouse IgG (Bio-Rad), followed by ECL development (GE Healthcare, RPN2232).
Real-time RT-PCR analysis
The total RNA was extracted with TRIzol (Invitrogen) and subjected to reverse transcription with SuperScript III First-Strand Synthesis SuperMix (Life Technologies). Real-time PCR was performed in a 20-μl reaction volume using Fast SYBR® Green Master Mix (Applied Biosystems) and primers: HIF1A (FP: 5’ -CATAAAGTCTGCAACATGGAAGGT-3’, RP: 5’ -ATTTGATGGGTGAGGAATGGGTT-3’), and GAPDH (FP: 5’- GAGTCAACGGATTTGGTCGT-3’, RP: 5’- GACAAGCTTCCCGTTCTCAG-3’).
Multiplex transcriptional factor activity analysis
ECs were starved in DMEM/F12 medium supplemented with 2% BSA overnight and treated with 100 ng/mL PDGF-AB under normoxia or 1% O2 hypoxia for 6 h. Nuclear lysate was prepared with a NE-PER™ Nuclear Extraction kit (Thermo Fisher, 78833). Nuclear protein was subjected to transcriptional activity assay with a TF Activation Profiling Plate Array II kit (Signosis, FA-1002) according to manufacture instructions.
Chromatin-immunoprecipitation (ChIP) assay
Treated human cardiac microvascular ECs were subjected to ChIP analysis with a Magna ChIP Kit (Millipore, 17–610). Briefly, the cells were fixed with 1% formaldehyde. The cells were scraped and lyzed in nuclear buffer, followed by 6 cycles of continuously sonication for 8 × 2 seconds. The samples were incubated with anti-NF-κB (1:100, Cell Signaling, 8242), anti-HIF-1α (1:100, Cell Signaling, 14179), or anti-Snail (1:100, R&D systems, AF3639) antibody, and with magnetic beads overnight at 4 °C. Normal IgG was used as a negative control. The immunoprecipitants were separated by magnetic rack and washed. The DNA fragments were released by incubation with proteinase K at 62 °C for 2 h. Real-time PCR was performed using Fast SYBR Green Master Mix (Applied Biosystems) with following primers: NF-κB_Snail_FP, GTGTCCCTTTCCTCGCTTC; NF-κB_Snail_RP, GGTGGTCTGAGCGCTTCT; HIF1_Snail_FP #1, GGAGACGAGCCTCCGATT; HIF1_Snail_RP #1, GCCGCCAACTCCCTTAAGTA; HIF1_Snail_FP #2, GCGAGCTGCAGGACTCTAAT; HIF1_Snail_RP #2, GTGACTCGATCCTGGCTCA; Snail_Cdh5 FP #1, GGGTGGACAAGCACCTTAAA; Snail_Cdh5_RP #1, CAGCTCTGGGACTCTGAACC; Snail_Cdh5_FP #2, CCTCTGTGGAGACAGCCATC; Snail_Cdh5_RP #2, CTCCCCTTCAGGTTTTCCAG 41,44.
Immunofluorescence and histology
Mouse tissues sections and human cardiac specimens from healthy controls or subjects with MI (BioCat, MYO1301) were de-paraffinized and rehydrated, and subjected to antigen retrieval in Target Retrieve Solution (DAKO, S1699) at 95 °C for 20 min. Sections were blocked with 5% horse serum and incubated with anti-CD31 (1:100, Cell Signaling, 3528, for human tissue), anti-CD31 (1:100, Dianova, DIA-310, for mouse tissue), anti-FSP-1 (1:100, Millipore, 07–2274), anti-α-SMA (1:100, Abcam, ab5694), anti-Tropomyosin 1 (1:100, Abcam, ab55915), anti-Snail (Millopore, MABE167), anti-collagen I (1:100, Mybiosouce, MB176360), anti-Troponin T antibody (1:100, Thermo-Fisher, MS295P1), anti-PCNA (1:100, Santa Cruz, sc-56), or anti-vWF (1:100, Dako, A0082) antibody overnight at 4 °C. For TUNEL assay, sections were stained using a TUNEL kit (Thermo-Fisher, C10617) following the manufacturer’s protocol. For cell culture staining, the cells were fixed with 4% paraformaldehyde for 15 min and permeabilized with 1% Triton X-100 for 5 min. Cells were blocked with 5% horse serum for 1 h at room temperature, and incubated with anti-FSP-1 (1:100, Millipore, 07–2274) overnight at 4 °C. Sections were stained with Alexa Fluor 488-, 568-, or 647- conjugated secondary IgGs (1:500, Life Technologies) for 1 h and Alexa Fluor 488-labeled phalloidin (1:100, Invitrogen, A12379) for 20 min at room temperature. Images were acquired with an AxioImager microscope (Zeiss) equipped with AxioCam 506 monochrome CCD camera (Zeiss) and Zen software (Zeiss). For histological study, tissue sections were stained with Masson’s trichrome dyes, and imaged with an AxioLab microscope (Zeiss) equipped with AxioCam HRC CCD camera (Zeiss) and Zen software (Zeiss).
Measurement of MI size
MI size was measured as we described previously52. In brief, 28 days after LAD ligation, cardiac tissues were excised, embedded, and serially cut at 8 μm from the apex to the level just below the coronary artery ligation site. Alternative sections were stained with Masson trichrome dye. The infarcted area was measured by planimetry using Image J software (NIH). Parameters were calculated using the equations: % infarct size = epicardial infarct length/epicardial LV circumferences × 100.
Lectin perfusion and tissue clearing
MI surgery or sham operation were performed in mice (6–8 weeks old). Mice were euthanized and perfused with 4% paraformaldehyde in PBS. The normal or infarcted heart was harvested and fixed in 4% paraformaldehyde at 4 oC overnight. After PBS washing, the tissue was embedded in hydrogel solution. Tissue was cleared by electrophoresis at 1.5-Ampere current at 37 oC for 48 hours or until visually clear in an X-CLARITY™ system following a published protocol 56. For lectin perfusion, anesthetic mice were administrated with DyLight 649-lectin (11 μg per mouse, Vector Laboratories, DL-1178) via retro-orbital injection, followed by dye circulation for 5 min. After euthanasia, the chest cavity of the mice was opened, followed by transcardial perfusion and successively with 1% EDTA in PBS, 1% paraformaldehyde, 10 μg/ml lectin in PBS for 3 min, and 4% paraformaldehyde. The hearts were excised, fixed in 4% paraformaldehyde at 4 oC overnight, and subjected for tissue clearing.
Confocal imaging
After tissue clearing, 200-μm thick sections of normal or infarcted mouse heart was mounted in 88% Histodenz (Sigma, D2158) in PBS-RIMS buffer with refractive index of 1.46. Series of images within 100-μm depth were scanned by a TCS SP8 confocal microscope (Leica). 3D images and movies were processed with IMARIS software, and analyzed using NIH AngioTool software.
Light sheet fluorescence imaging
After tissue clearing, whole heart tissue was immersed in RI 1.46 RIMS buffer overnight. Images were acquired with a Lightsheet Z.1 imager (Zeiss). 3D images and movies were processed and analyzed with Imaris 9.6 software (Oxford Instruments).
SPECT scan
Single-photon emission computerized tomography (SPECT) was performed using MiLabs U-SPECT+ system. Treated mice were intraperitoneally injected under anesthesia with Tc-99m tetrofosmin (General Electric) according to the manufacture’s instruction, followed by SPECT scan at different layers. Images were analyzed using AMIDE 10.9 software.
Nanoparticle formulation and treatment
Polymer-lipid nanoparticles were generated as previously described 24,25. Briefly, C15 alkyl epoxides were reacted with PEI600 at 90 degrees Celsius in 100% ethanol for 48–72 h at a 14:1 molar ration. The resulting compound was purified via HPLC on a silica column in dichloromethane, and then dissolved in 100% ethanol with a polyethylene glycol (PEG)-lipid conjugate. In vivo siRNA targeting mouse PDGFR-β (Thermo, 4457302) or a control sequence (Thermo, 4457289) was dissolved in citrate buffer and then mixed in a microfluidic device with the previously described ethanol phase at a 2.5:1 flow rate ratio to form polymer-lipid nanoparticles 57. Mice were subjected to MI induction, and administrated intraperitoneally with 1 mg/kg nanoparticles twice every week.
Statistics and reproducibility
Unpaired two-tailed Student’s t test (for two groups) and ANOVA (for more two groups) test were performed by using Prism 9.3 software for statistical analyses between groups, and P < 0.05 was considered to represent a statistically significant difference. No statistical method was used to predetermine sample size. The Investigators were not blinded to allocation during experiments and outcome assessment.
Data availability
RNA-seq data have been deposited in NCBI’s Gene Expression Omnibus under the accession number GSE163772, while the Single-cell and single-nuclei RNA sequencing analysis of mouse cardiac tissues with MI have been deposited in the same publicly available databank under the accession numbers GSE163956 and GSE193290, respectively. The data supporting the findings of this study are available within the paper and its Supplementary Information. Source data are provided with this paper.
Extended Data
Extended Data Fig. 1. Aberrant vascularization characterizes infarcted cardiac tissue.
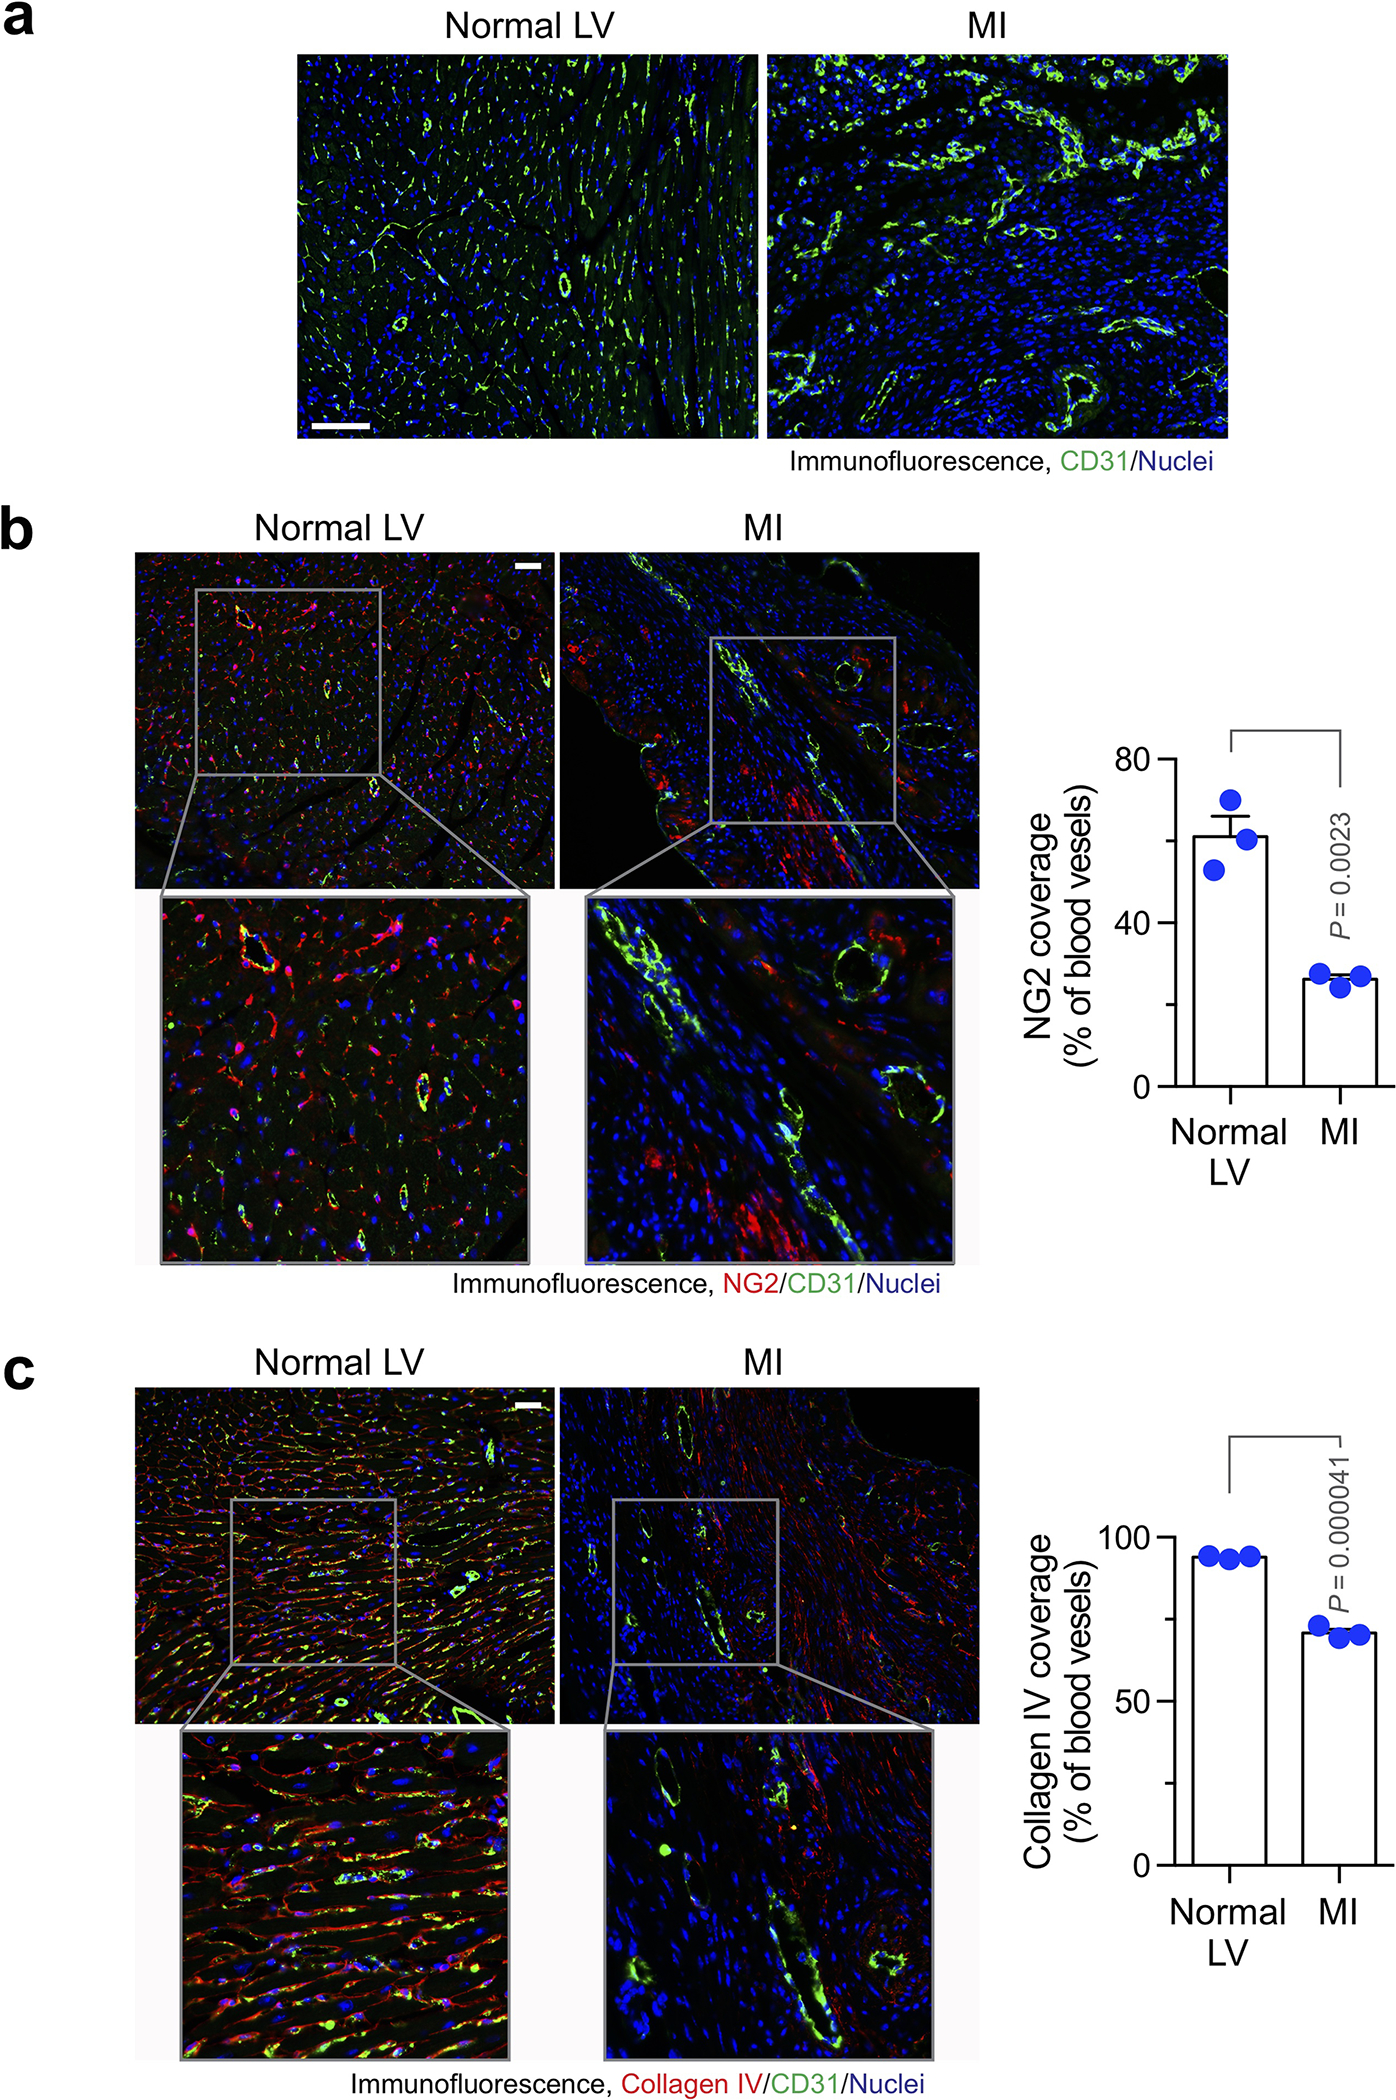
Mice were subjected to MI surgery or sham operation. Hearts were excised 3 weeks after surgery. Tissue sections were immunostained with (a) anti-CD31 antibody, (b) anti-NG2 and anti-CD31 antibodies, or (c) anti-collagen IV and anti-CD31 antibodies. a, Representative images in normal tissue and infarct zone are shown (n = 3 mice). Bars indicate 100 μm. b,c, Left, representative images in normal tissue and infarct zone are shown. Right, quantified results (mean ± SEM, n = 3 mice). Statistical analysis by unpaired two-tailed Students’ t test. Bars indicate 100 μm.
Extended Data Fig. 2. Cardiomyocyte-conditioned medium induces FSP-1 and α-SMA expression in ECs.
Mouse cardiac-conditioned medium (CCM) were harvested from primary mouse cardiomyocytes cultured under hypoxia (1% O2). Mouse cardiac microvascular ECs were treated with CCM under normoxia or hypoxia for 2 days. Cell lysates were immunoblotted. These experiments were repeated independently twice with similar results.
Extended Data Fig. 3. Expression of mesenchymal genes in MI-associated ECs.
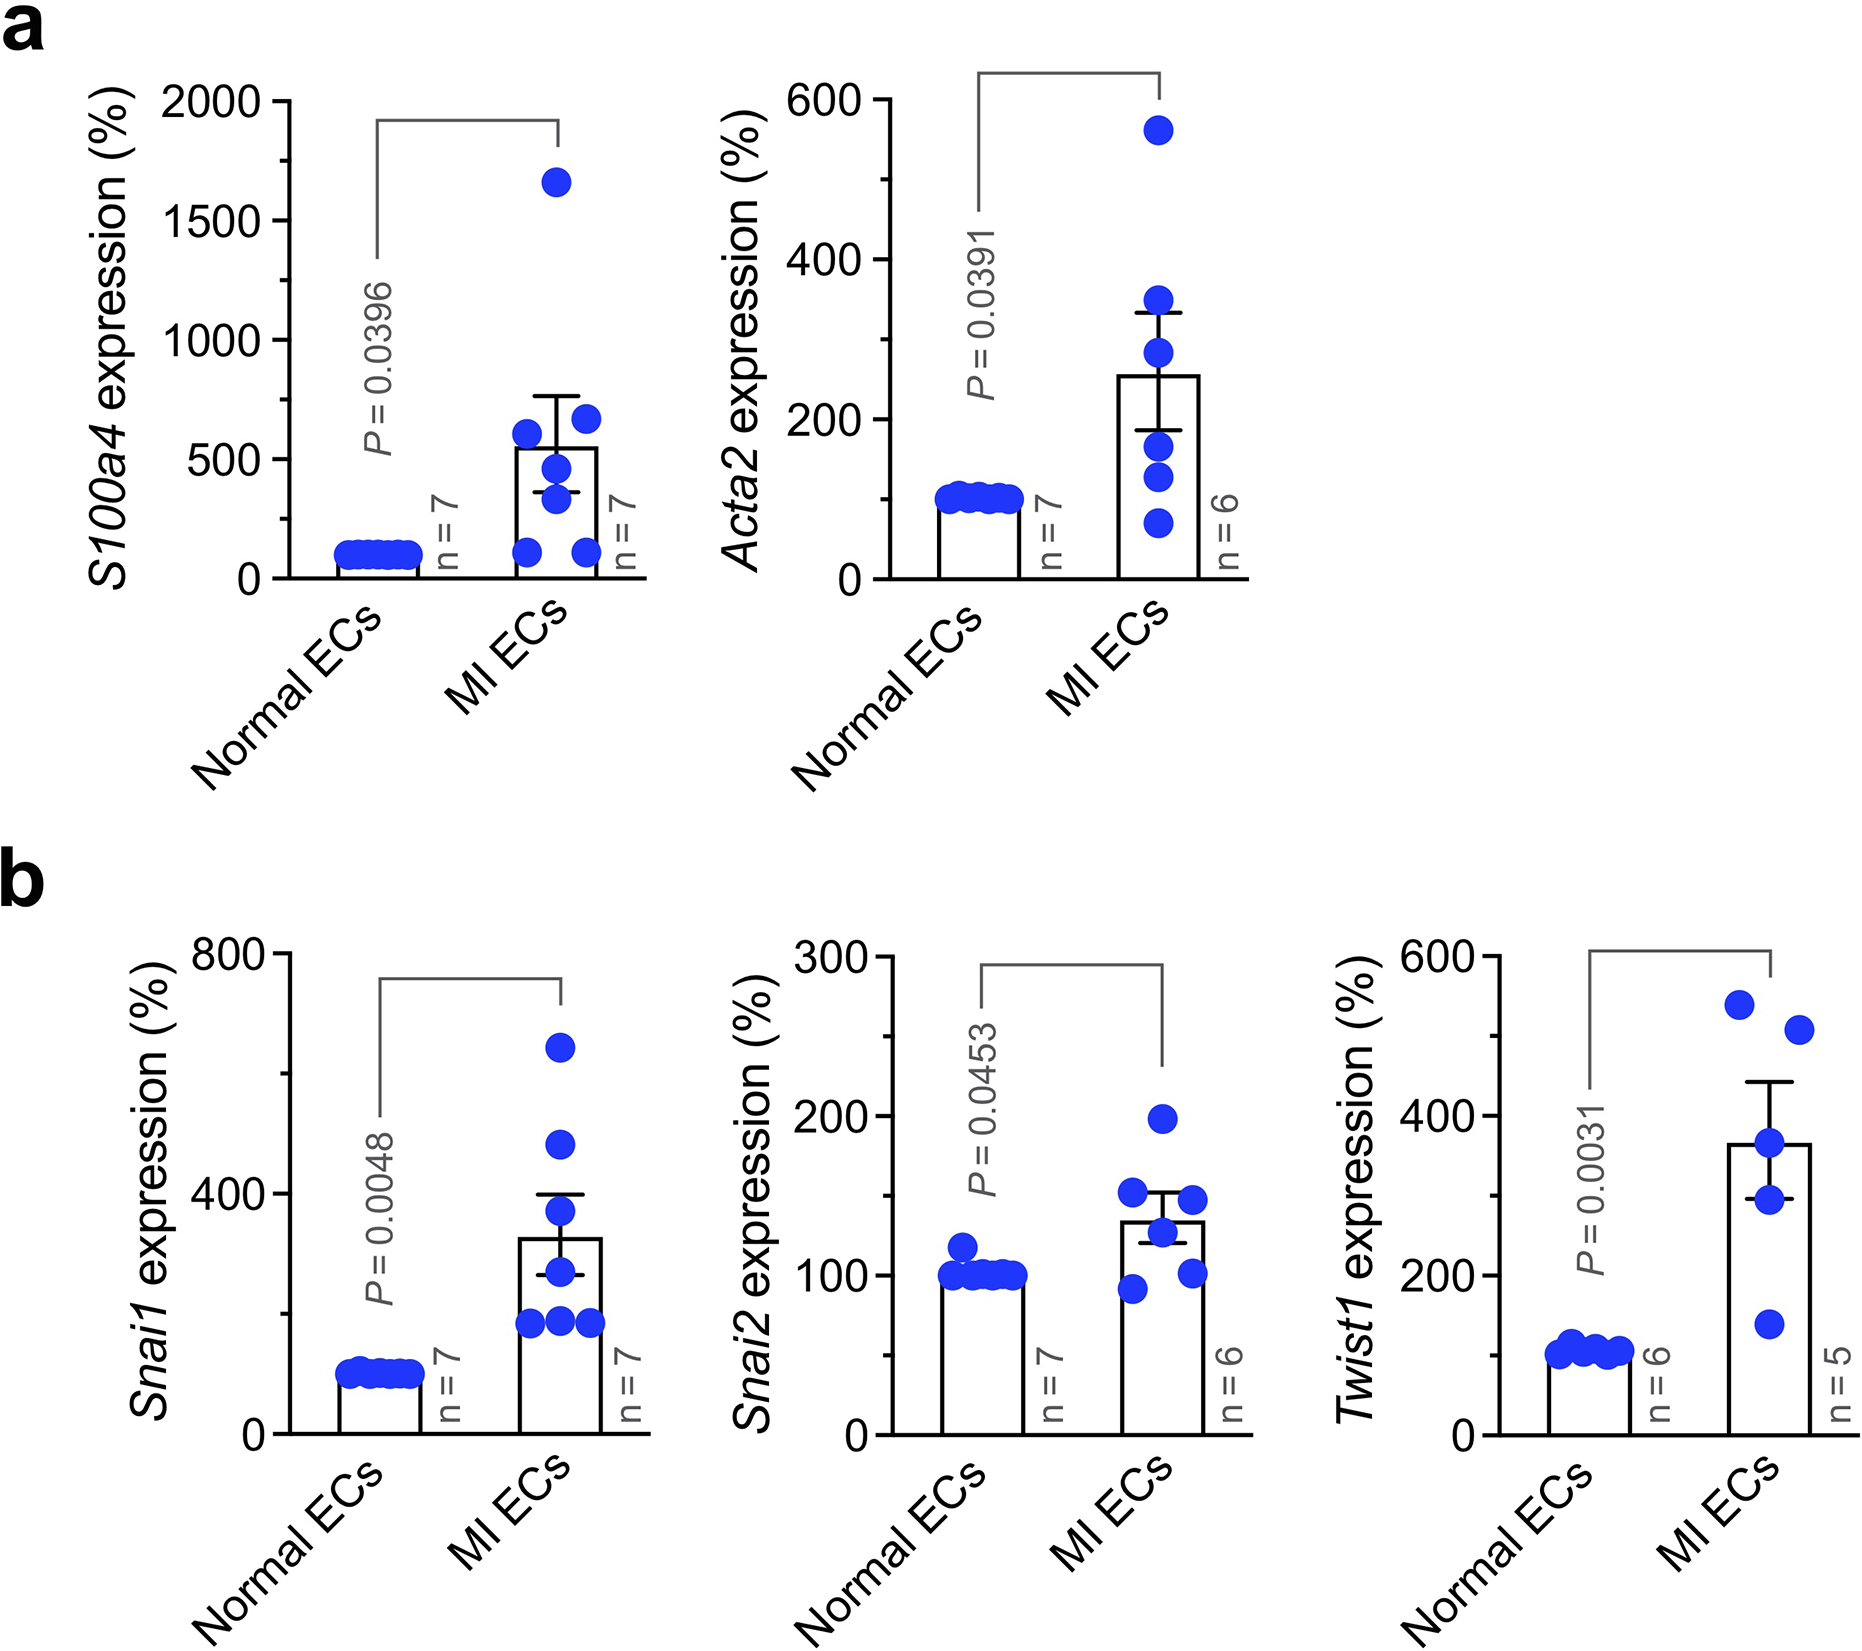
MI was induced in wild-type mice. Three weeks after MI induction, ECs were isolated from normal LV and MI tissues. RNA was extracted and subjected to RT-PCR analysis (mean ± SEM, n = 5–7 mice, specific n indicated in the graphs). Statistical analysis by unpaired two-tailed Students’ t test. Expression of (a) S100A4 (FSP-1) and Acta2 (α-SMA), and (b) Snai1 (Snail), Snai2 (Slug), and Twist1 was normalized with GAPDH expression levels.
Extended Data Fig. 4. PDGF-AB induces expression of mesenchymal proteins in ECs.

Human cardiac microvascular ECs were treated with 100 ng/ml SCF, PDGF-AB, or HGF for 2 days under hypoxia. Cell lysates were immunoblotted. These experiments were repeated independently twice with similar results.
Extended Data Fig. 5. PDGFR-β knockout inhibits PDGF-AB-induced phosphorylation of Erk1 and Akt1 in ECs and does not affect vascular density in normal hearts.
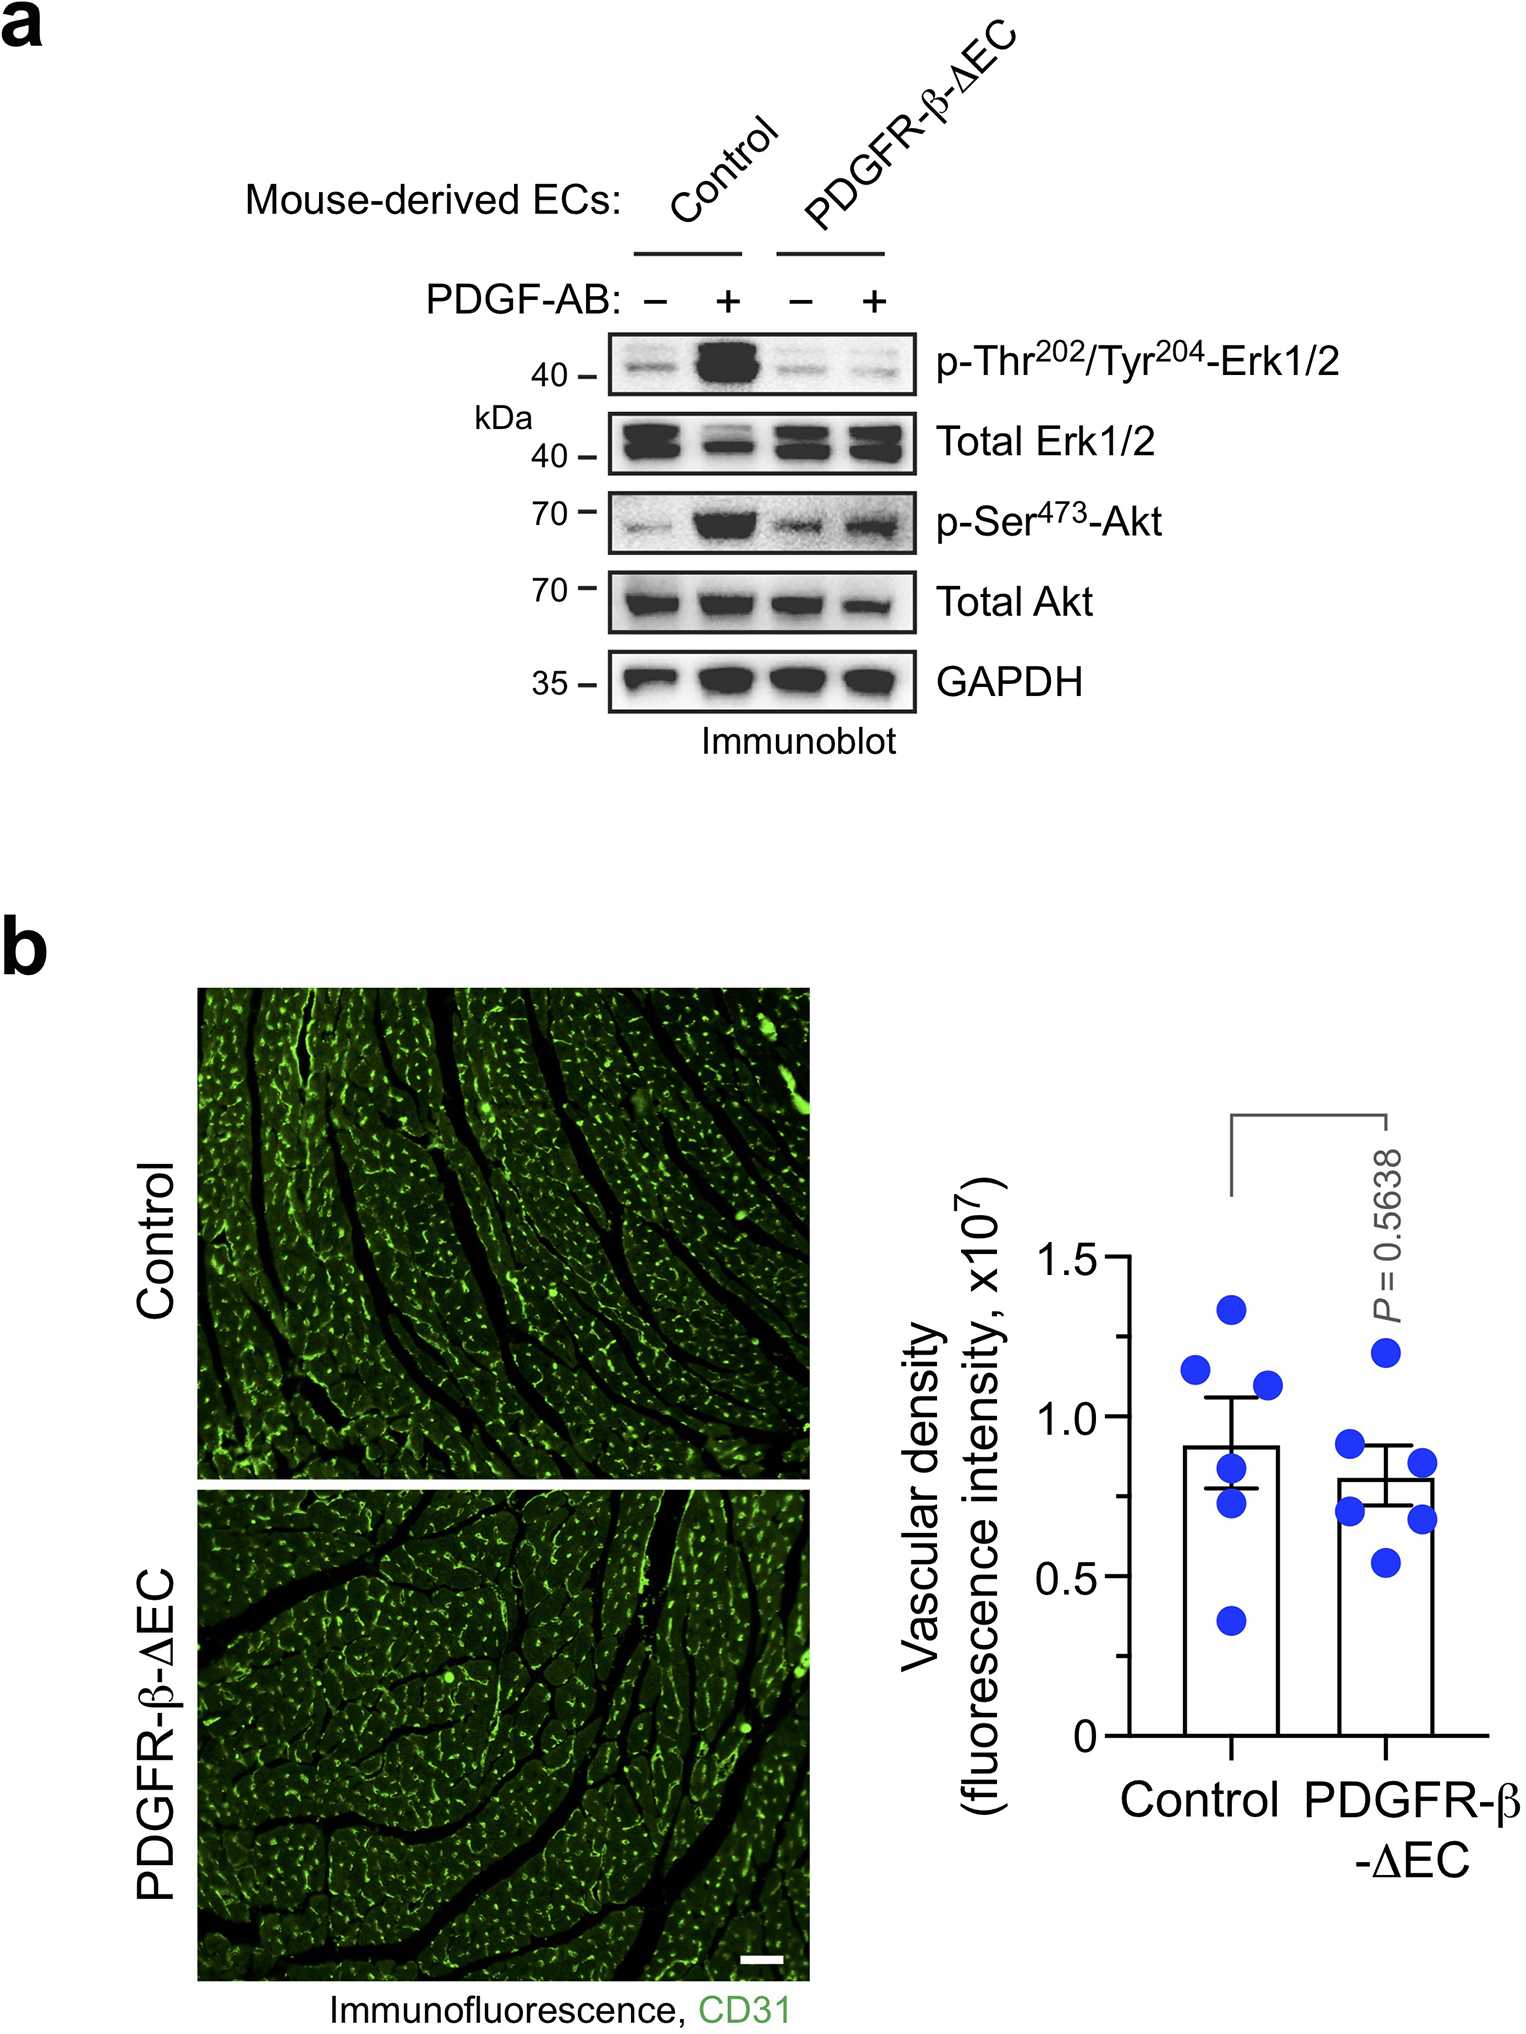
a, Aortic ECs were isolated from tamoxifen-treated Cdh5-CreERT2;Pdgfrbfl/fl (PDGFR-β-ΔEC) and Pdgfrbfl/fl (control) mice. Cells were treated with 100 ng/ml PDGF-AB for 10 min, followed by immunoblot analysis. These experiments were repeated independently twice with similar results. b,Left ventricles were collected from PDGFR-β-ΔEC and control mice. Cardiac sections were stained with anti-CD31 antibody and analyzed by immunofluorescence. Left, representative images are shown. Scale bar: 200 μm. Right, quantified results (mean ± SEM, n = 6 mice). Statistical analysis by unpaired two-tailed Students’ t test.
Extended Data Fig. 6. PDGFR-β knockout in ECs does not increase vascular density in infarct zone and border zone.
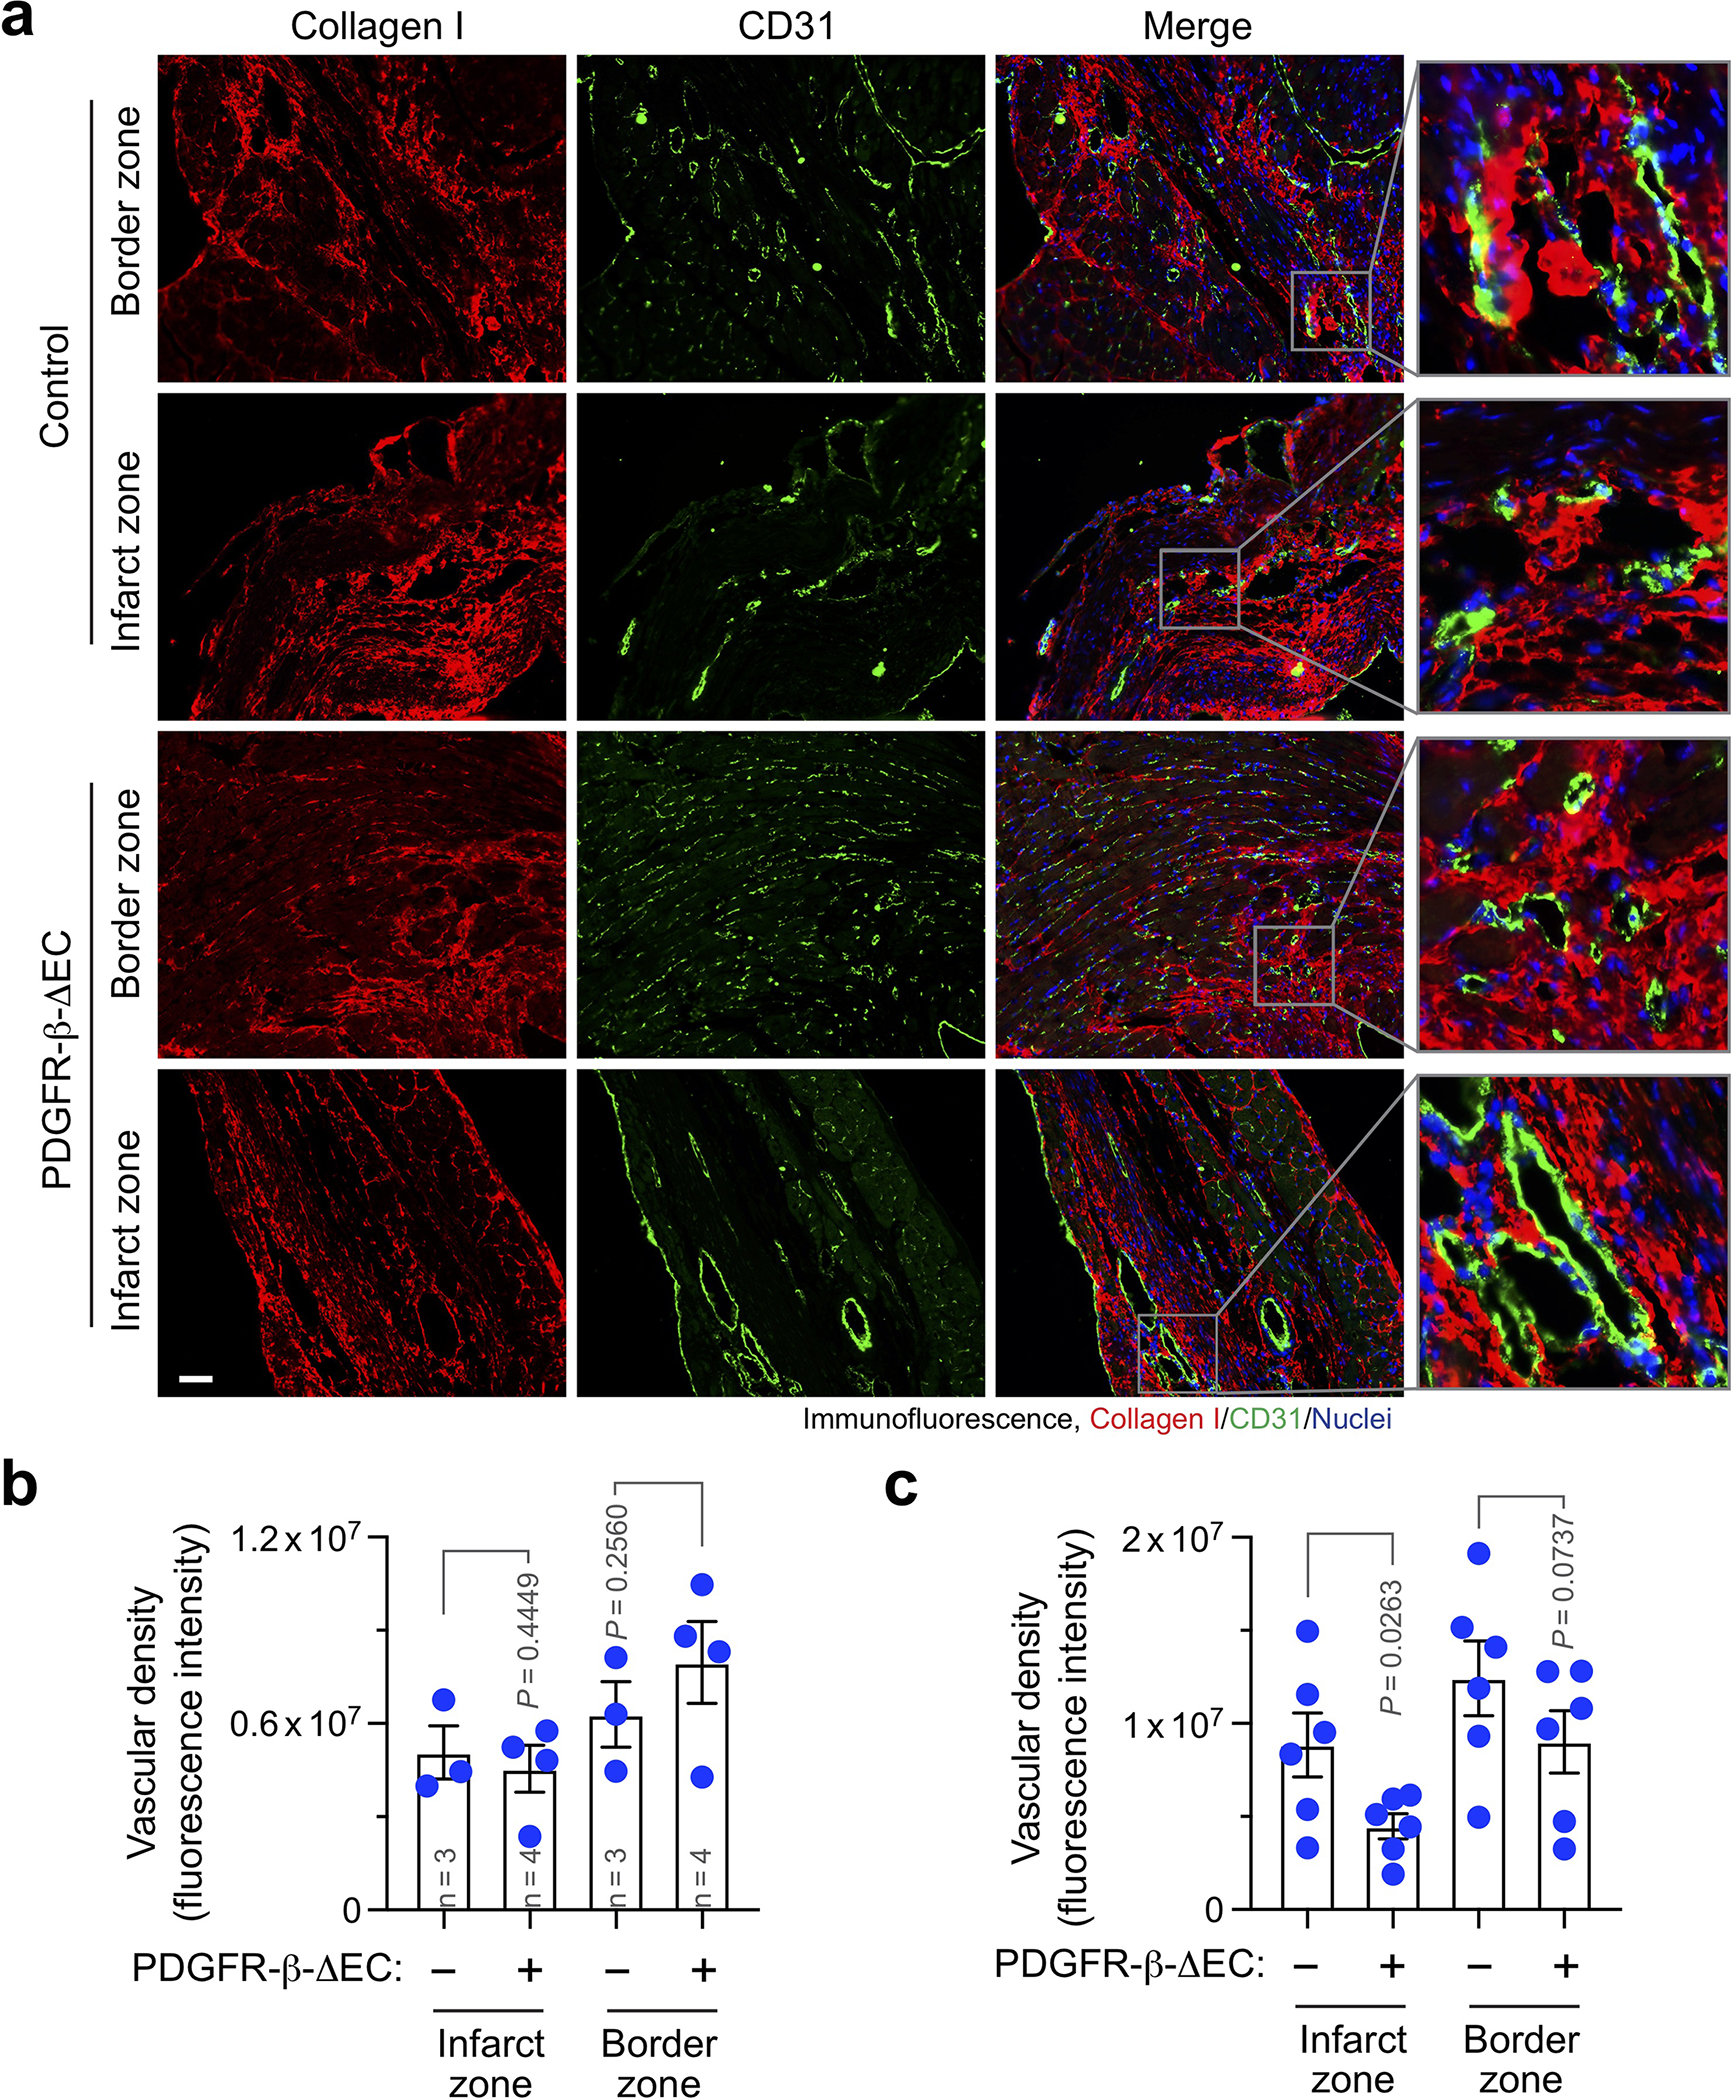
MI was induced in control and PDGFR-β-ΔEC mice. (a,b) 4 or (c) 8 weeks after MI induction, cardiac tissues were collected. Sections were stained with anti-collagen I and anti-CD31 antibodies, followed by immunofluorescence analysis. a, Representative images are shown (n = 6 mice). Scale bar: 100 μm. b,c, Vascular density was quantified (mean ± SEM). b, n = 3–4 mice, specific n indicated in the graphs. c, n = 6 mice. Statistical analysis by two-way ANOVA Fisher’s test.
Extended Data Fig. 7. PDGFR-β knockout reduces vascular density and inhibits Ki67, Snail and FSP-1 expression in MI- associated ECs.
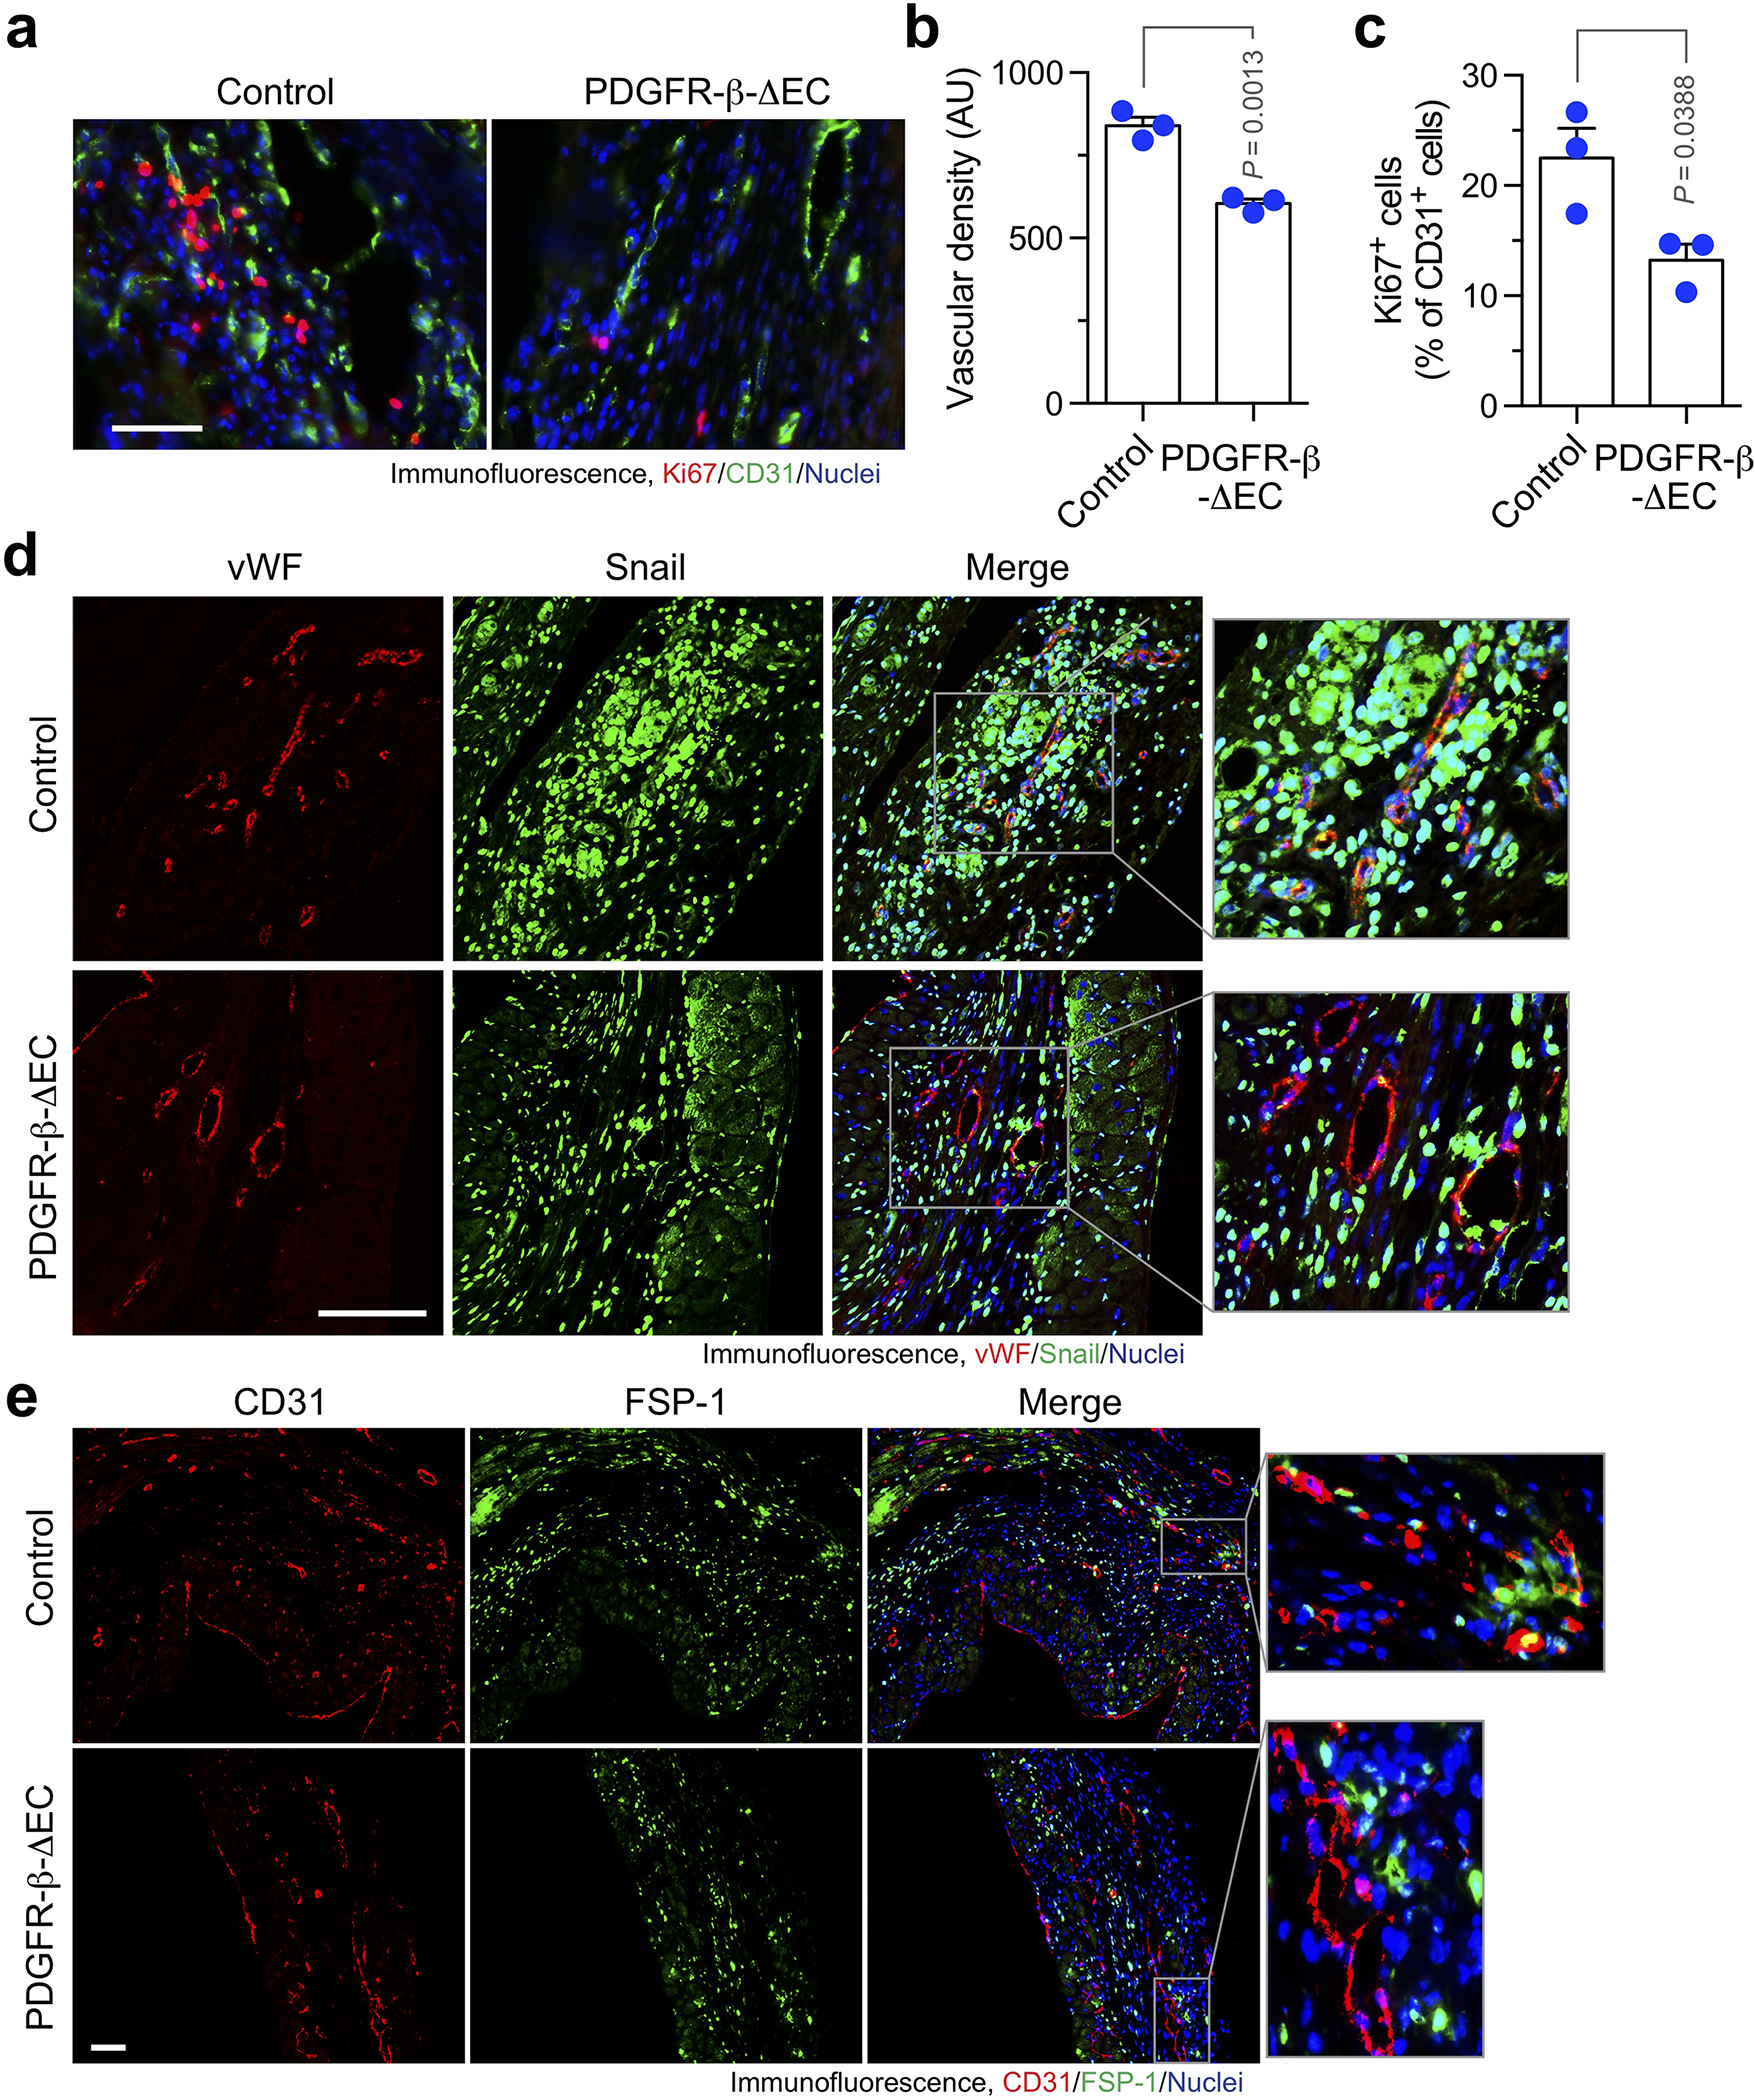
MI was induced in WT and PDGFR-β-ΔEC mice. Hearts were excised 3 weeks after surgery. MI tissue sections were immunostained with (a-c) anti-Ki67 and anti-CD31, (d) anti-vWF and anti-Snail, or (e) anti-CD31 and anti-FSP-1 antibodies. a, Representative immunofluorescence images in infarct zone are shown (n = 3 mice). Scale bar: 100 μm. b,c, quantified results (mean ± SEM, n = 3 mice). b, Density of CD31+ cells. AU, arbitrary unit. c, Ki67 expression in CD31+ cells. Statistical analysis by unpaired two-tailed Students’ t test. d,e, Representative immunofluorescence images in infarct zone are shown (n = 5 mice). Scale bar: 100 μm.
Extended Data Fig. 8. PDGFR-β knockout reduces Snail expression in MI-associated ECs.
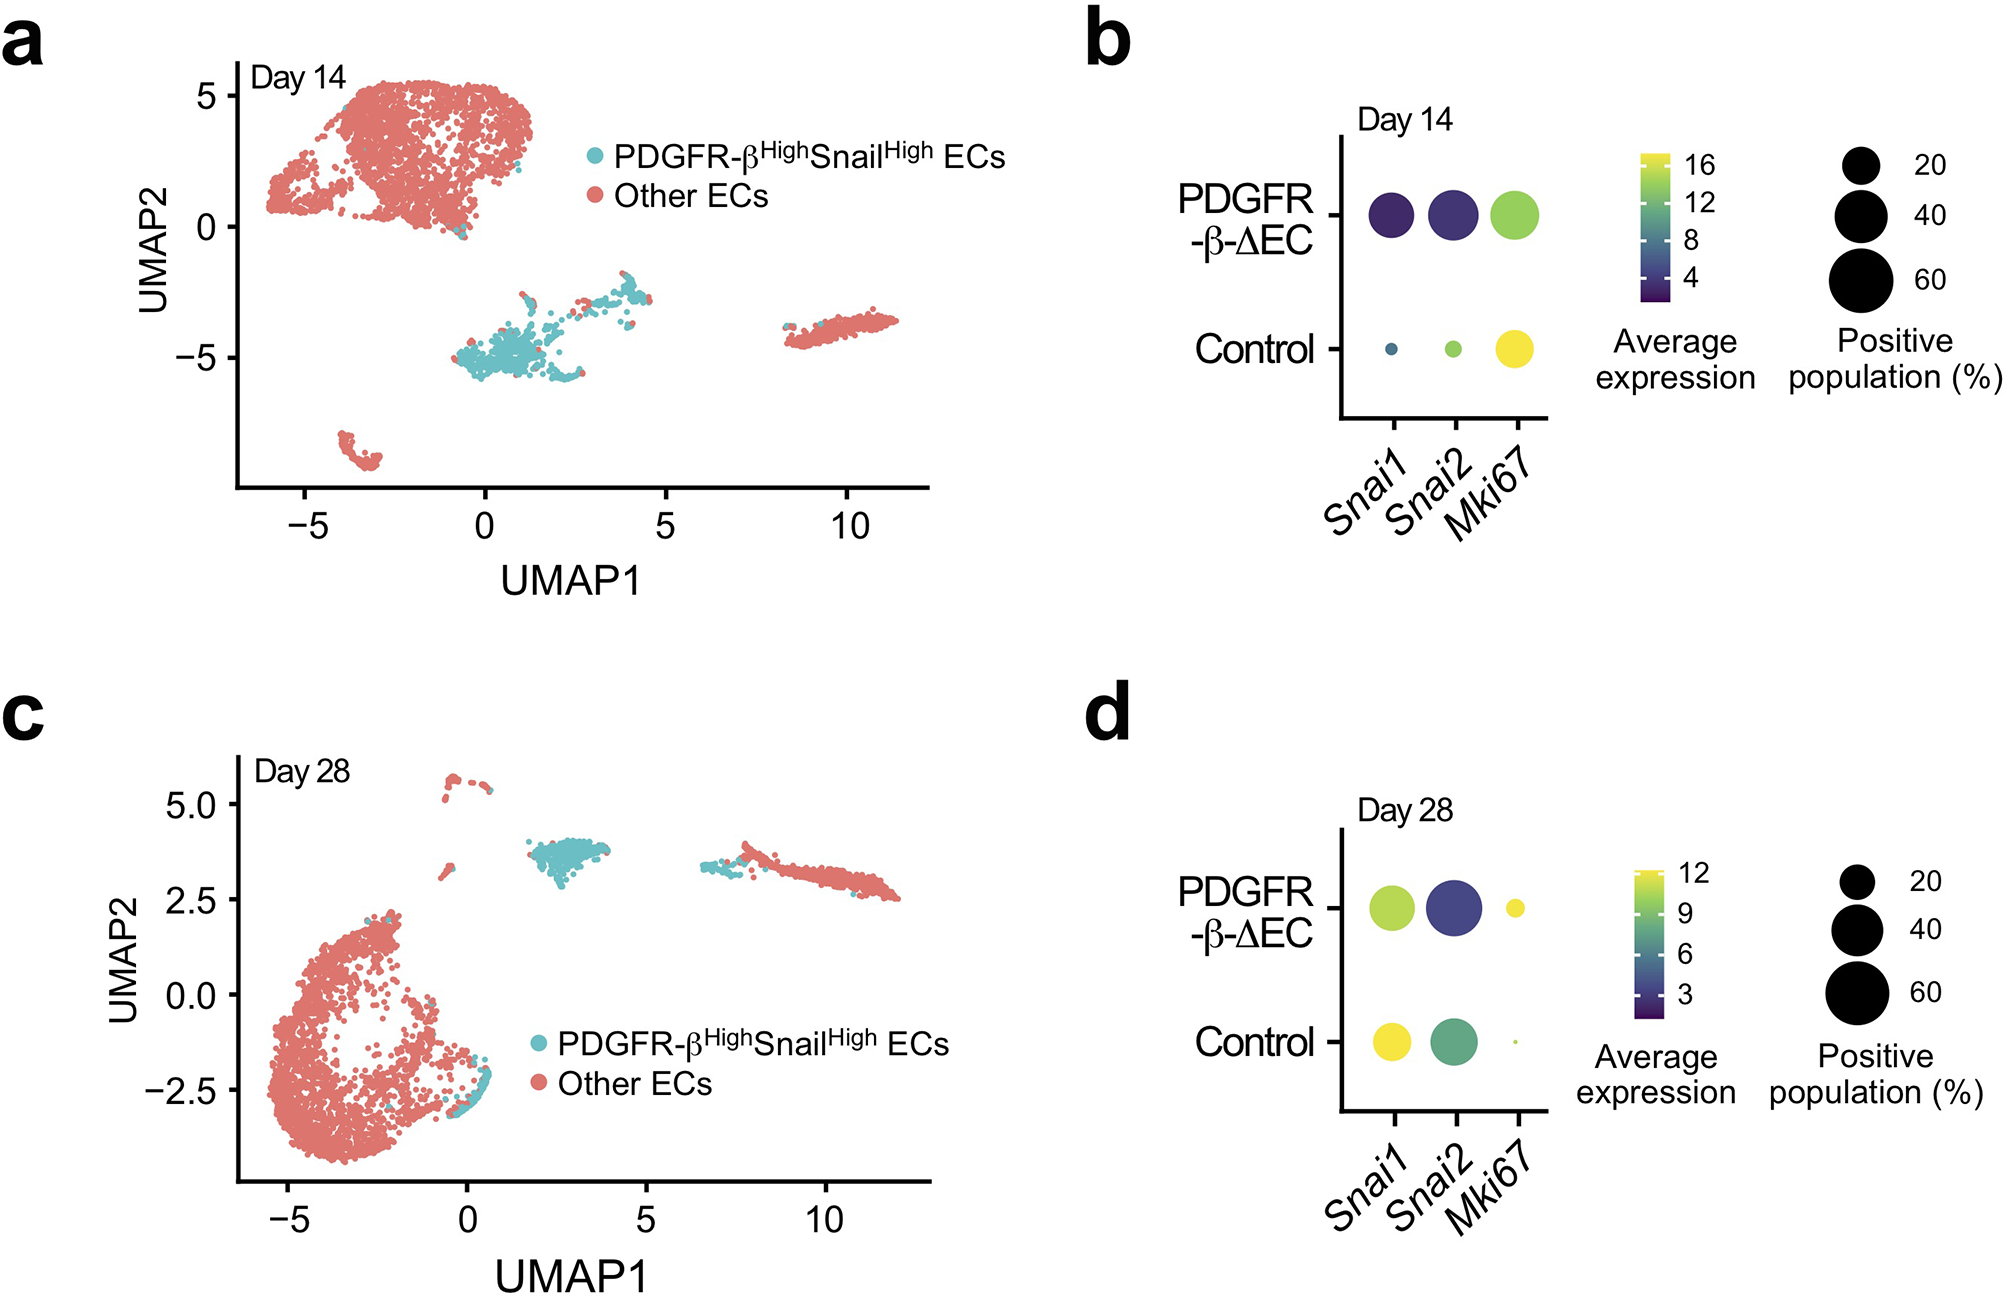
MI was induced in WT and PDGFR-β-ΔEC mice. (a,b) 14 and (c,d) 28 days after MI induction, MI tissue sections were collected and subjected to single-nuclei RNA sequencing analysis (total = 4 mice). Uniform manifold approximation and projection (UMAP) analysis of transcriptome gene signature in ECs. (a,c) UMAP analysis of ECs. (b,d) Expression of Snail, Slug, and Ki67 in ECs.
Extended Data Fig. 9. PDGFR-β knockout in ECs alters expression of metabolism-associated genes in myocytes.
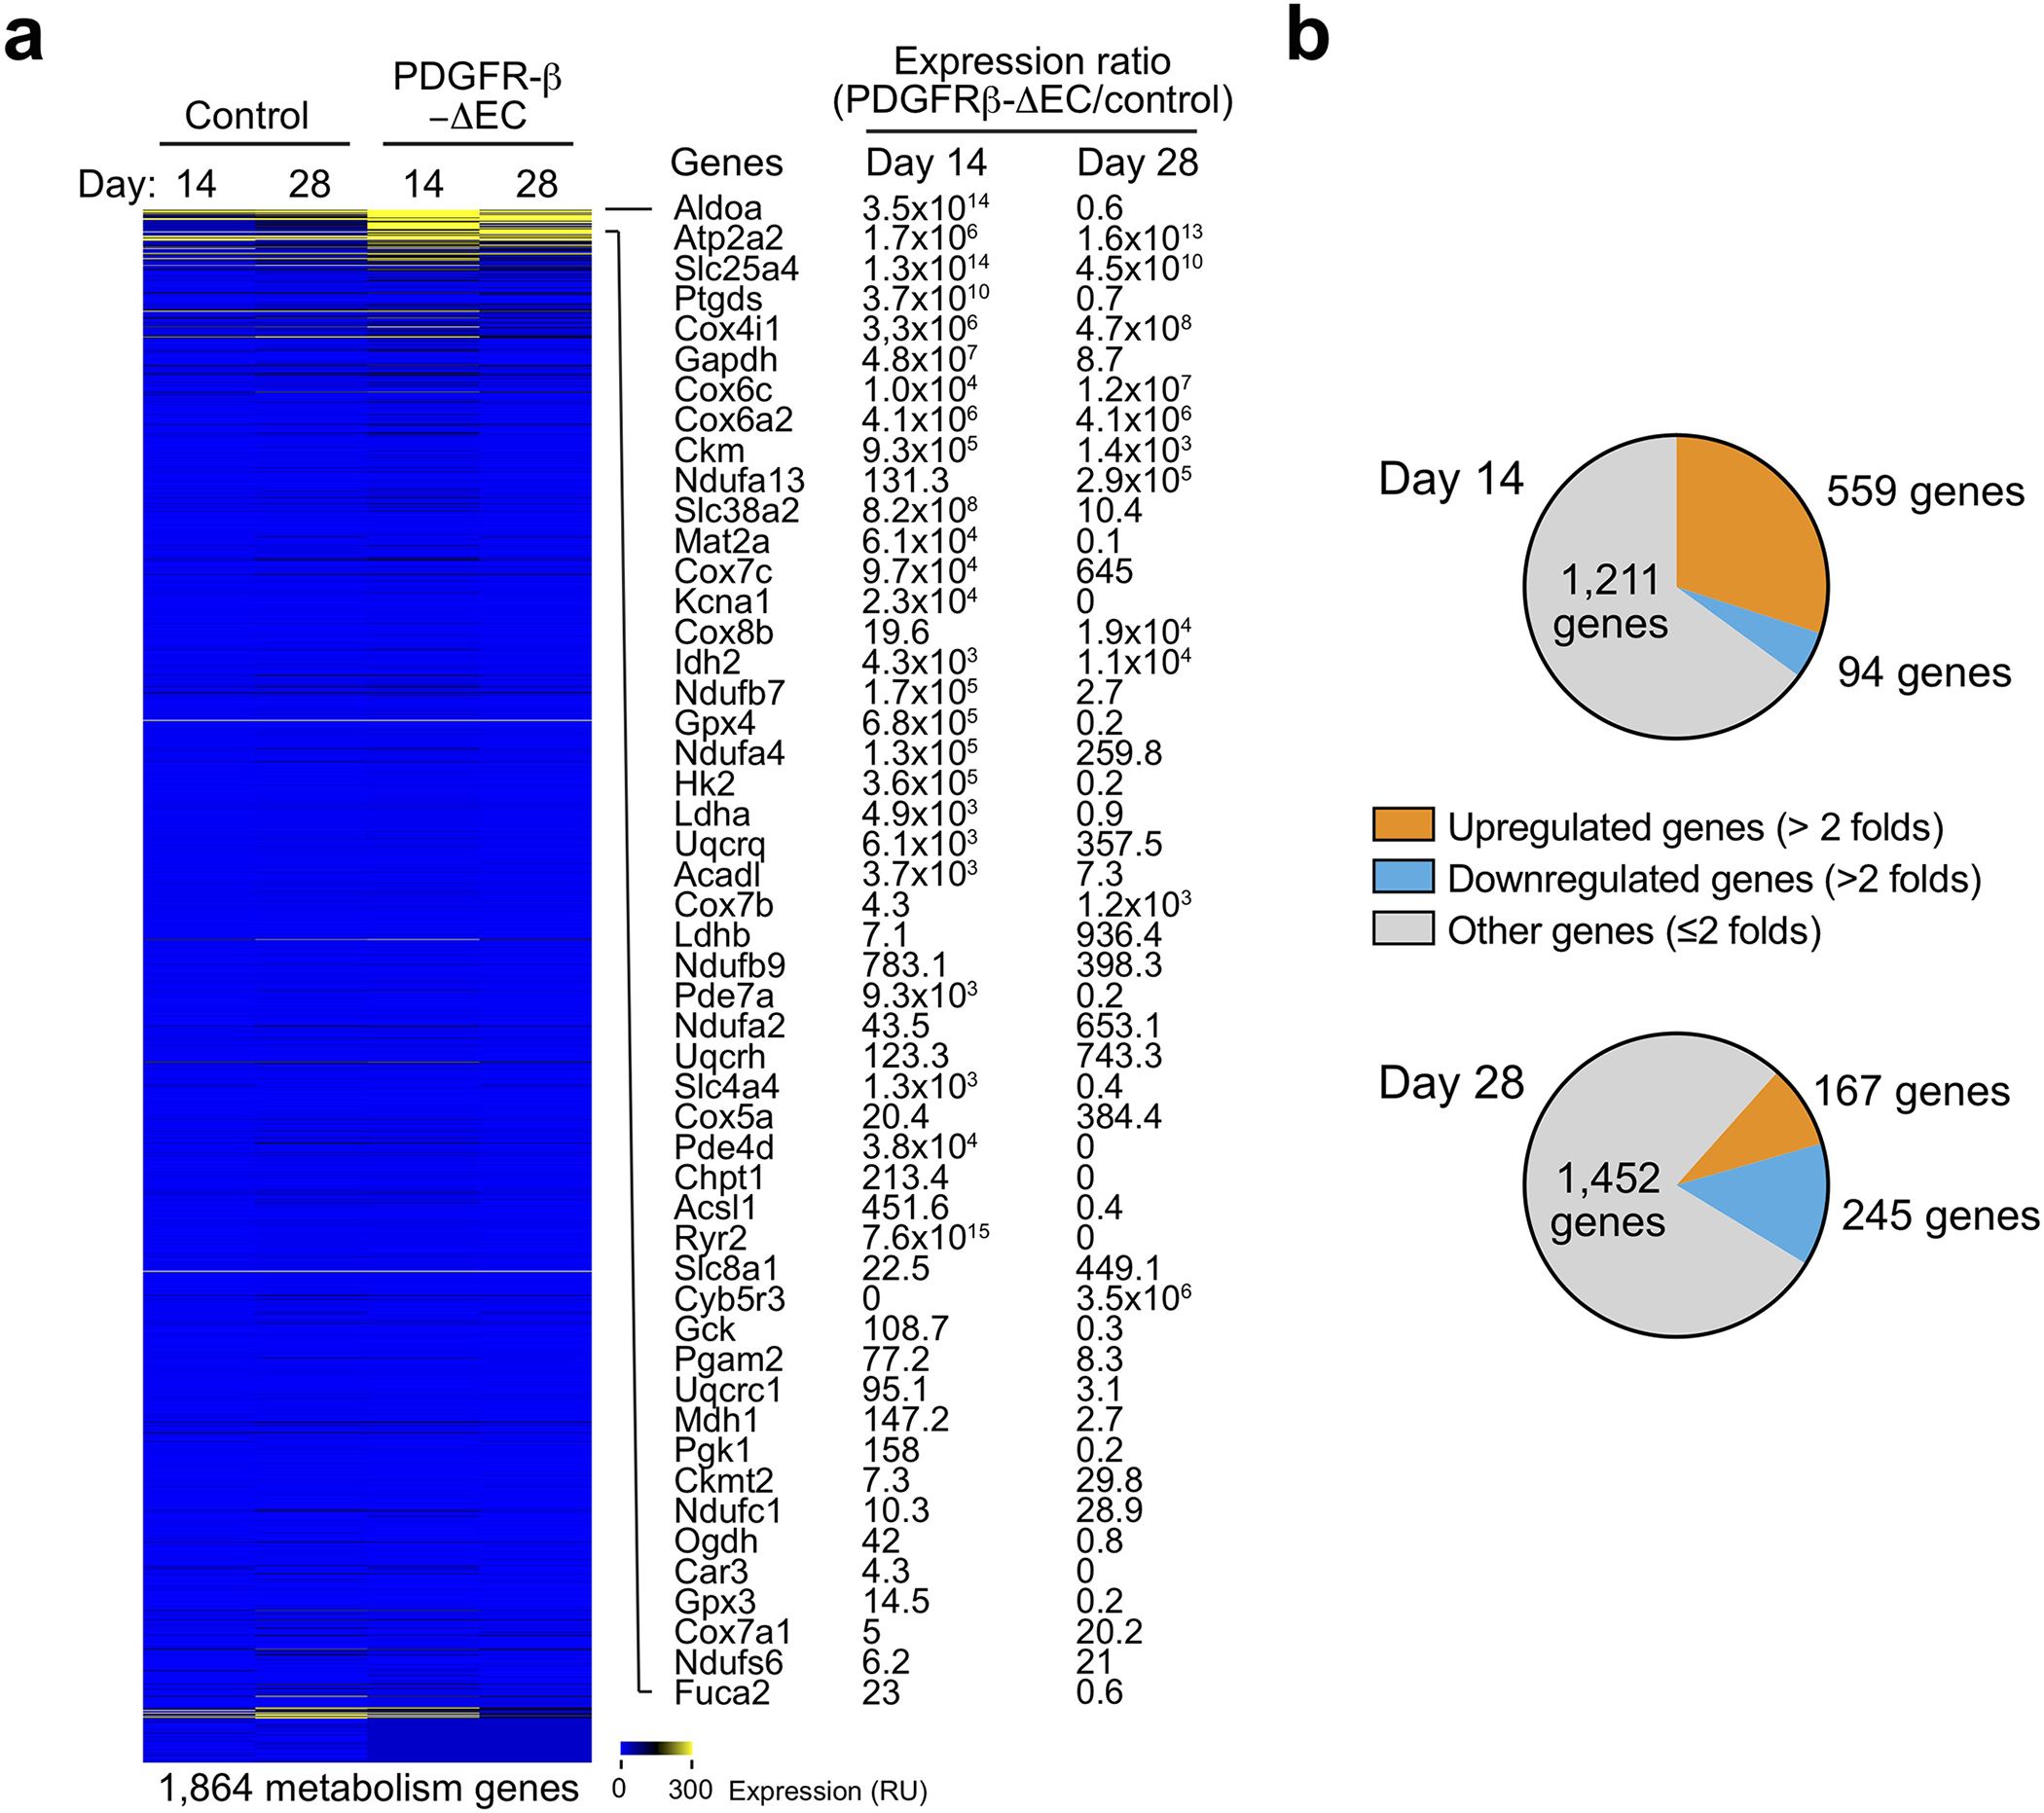
MI was induced in WT and PDGFR-β-ΔEC mice. 14 and 28 days after MI induction, MI tissue sections were collected and subjected to single-nuclei RNA sequencing analysis (total = 4 mice). Expression of metabolism-associated genes were analyzed. a, Heatmap of mapped genes. b, Global changes in gene expression at days 14 and 28 after MI induction.
Extended Data Fig. 10. PDGFR inhibition improves cardiac function recovery and promotes tissue repair after MI.
MI was induced in mice, followed by administration with saline or 15 mg/kg crenolanib. a,b, Cardiac function was analyzed by echocardiogram (n = 11 mice). Representative images are shown. a, Long-axis echocardiogram analysis. Scale bar: 2 mm. b, M mode echocardiogram analysis. Scale bar: 2 mm. Arrows indicate myocardial anterior walls. c,d, Heart tissues were harvested 3 weeks after MI induction. Cardiac sections were stained with Masson’s trichrome stain. c, Representative images are shown (n = 4 mice). Scale bar: 500 μm. Arrows indicate epicardium. d, Quantified cardiomyocyte area (mean ± SEM, n = 4–5 mice). Statistical analysis by unpaired two-tailed Students’ t test. e, Heart tissues were harvested 3 weeks after MI induction. Cardiac sections were stained with an anti-CD31 antibody and analyzed by immunofluorescence imaging. Vascular density was quantified (mean ± SEM, n = 5 mice). Statistical analysis by two-way ANOVA.
Supplementary Material
Acknowledgments
We are grateful to James Eberwine (Penn Pharmacology), Jonathan Schug (Penn Next-Generation Sequencing Core), Andrea Stout (Penn CDB Microscope Core), and Eric Blankemeyer (Penn Small Animal Imaging Core) for assistance with RNA linear amplification, single-cell RNAseq, light sheet fluorescence imaging, and SPECT analysis, respectively. This work was supported in part by American Heart Association (AHA) Innovative Project Award IPA34170252 (to Y.F.), National Institutes of Health (NIH) grants R01HL155198 (to Y.F. and Y.G.) and R01NS094533, R01NS106108 and R01CA241501 (to Y.F.), American Association for Cancer Research (AACR) Judah Folkman Award (to Y.F.), AHA Scientist Development Grant SDG9050018 and Grant-in-Aid GRNT3365002 (to Y.G.), and AHA Predoctoral Fellowship (to D.Z.). L.P. is supported by the Office of the Assistant Secretary of Defense for Health Affairs through the Peer Reviewed Medical Research Program (W81XWH2010042 and W81XWH2010089). M.J.M. acknowledges support from a Burroughs Wellcome Fund Career Award at the Scientific Interface (CASI), a NIH Director’s New Innovator Award (DP2 TR002776), NIH grants R01CA241661, R37CA244911, and R01DK123049, an Abramson Cancer Center (ACC)-School of Engineering and Applied Sciences (SEAS) Discovery Grant (P30CA016520), and an AACR-Bayer Innovation and Discovery Grant (18–80–44-MITC).
Footnotes
Declaration of Interests
The authors declare no competing interests.
Reviewer recognition statement:
Nature Cardiovascular Research thanks the anonymous reviewers for their contribution to the peer review of this work.
REFERENCES
- 1.Ware JA & Simons M Angiogenesis in ischemic heart disease. Nat Med 3, 158–164 (1997). [DOI] [PubMed] [Google Scholar]
- 2.Harada K, et al. Vascular endothelial growth factor administration in chronic myocardial ischemia. Am J Physiol 270, H1791–1802 (1996). [DOI] [PubMed] [Google Scholar]
- 3.Banai S, et al. Angiogenic-induced enhancement of collateral blood flow to ischemic myocardium by vascular endothelial growth factor in dogs. Circulation 89, 2183–2189 (1994). [DOI] [PubMed] [Google Scholar]
- 4.Henry TD, et al. The VIVA trial: Vascular endothelial growth factor in Ischemia for Vascular Angiogenesis. Circulation 107, 1359–1365 (2003). [DOI] [PubMed] [Google Scholar]
- 5.Stewart DJ, et al. VEGF gene therapy fails to improve perfusion of ischemic myocardium in patients with advanced coronary disease: results of the NORTHERN trial. Mol Ther 17, 1109–1115 (2009). [DOI] [PMC free article] [PubMed] [Google Scholar]
- 6.Rajagopalan S, et al. Regional angiogenesis with vascular endothelial growth factor in peripheral arterial disease: a phase II randomized, double-blind, controlled study of adenoviral delivery of vascular endothelial growth factor 121 in patients with disabling intermittent claudication. Circulation 108, 1933–1938 (2003). [DOI] [PubMed] [Google Scholar]
- 7.Potente M, Gerhardt H & Carmeliet P Basic and therapeutic aspects of angiogenesis. Cell 146, 873–887 (2011). [DOI] [PubMed] [Google Scholar]
- 8.Goel S, et al. Normalization of the vasculature for treatment of cancer and other diseases. Physiol Rev 91, 1071–1121 (2011). [DOI] [PMC free article] [PubMed] [Google Scholar]
- 9.Kovacic JC, Mercader N, Torres M, Boehm M & Fuster V Epithelial-to-mesenchymal and endothelial-to-mesenchymal transition: from cardiovascular development to disease. Circulation 125, 1795–1808 (2012). [DOI] [PMC free article] [PubMed] [Google Scholar]
- 10.Piera-Velazquez S & Jimenez SA Endothelial to Mesenchymal Transition: Role in Physiology and in the Pathogenesis of Human Diseases. Physiol Rev 99, 1281–1324 (2019). [DOI] [PMC free article] [PubMed] [Google Scholar]
- 11.Zeisberg EM, et al. Endothelial-to-mesenchymal transition contributes to cardiac fibrosis. Nat Med 13, 952–961 (2007). [DOI] [PubMed] [Google Scholar]
- 12.Maddaluno L, et al. EndMT contributes to the onset and progression of cerebral cavernous malformations. Nature 498, 492–496 (2013). [DOI] [PubMed] [Google Scholar]
- 13.Manavski Y, et al. Clonal Expansion of Endothelial Cells Contributes to Ischemia-Induced Neovascularization. Circ Res 122, 670–677 (2018). [DOI] [PubMed] [Google Scholar]
- 14.Li Z, et al. Single-cell transcriptome analyses reveal novel targets modulating cardiac neovascularization by resident endothelial cells following myocardial infarction. Eur Heart J (2019). [DOI] [PMC free article] [PubMed] [Google Scholar]
- 15.Tombor LS, et al. Single cell sequencing reveals endothelial plasticity with transient mesenchymal activation after myocardial infarction. Nature Communications 12, 681 (2021). [DOI] [PMC free article] [PubMed] [Google Scholar]
- 16.Huang M, et al. c-Met-mediated endothelial plasticity drives aberrant vascularization and chemoresistance in glioblastoma. J Clin Invest 126, 1801–1814 (2016). [DOI] [PMC free article] [PubMed] [Google Scholar]
- 17.Fan Y Vascular Detransformation for Cancer Therapy. Trends Cancer 5, 460–463 (2019). [DOI] [PMC free article] [PubMed] [Google Scholar]
- 18.De Palma M, et al. Tie2 identifies a hematopoietic lineage of proangiogenic monocytes required for tumor vessel formation and a mesenchymal population of pericyte progenitors. Cancer Cell 8, 211–226 (2005). [DOI] [PubMed] [Google Scholar]
- 19.Andrae J, Gallini R & Betsholtz C Role of platelet-derived growth factors in physiology and medicine. Genes Dev 22, 1276–1312 (2008). [DOI] [PMC free article] [PubMed] [Google Scholar]
- 20.Acloque H, Adams MS, Fishwick K, Bronner-Fraser M & Nieto MA Epithelial-mesenchymal transitions: the importance of changing cell state in development and disease. J Clin Invest 119, 1438–1449 (2009). [DOI] [PMC free article] [PubMed] [Google Scholar]
- 21.Kalluri R & Weinberg RA The basics of epithelial-mesenchymal transition. J Clin Invest 119, 1420–1428 (2009). [DOI] [PMC free article] [PubMed] [Google Scholar]
- 22.Lamouille S, Xu J & Derynck R Molecular mechanisms of epithelial-mesenchymal transition. Nat Rev Mol Cell Biol 15, 178–196 (2014). [DOI] [PMC free article] [PubMed] [Google Scholar]
- 23.Liu T, et al. PDGF-mediated mesenchymal transformation renders endothelial resistance to anti-VEGF treatment in glioblastoma. Nat Commun 9, 3439 (2018). [DOI] [PMC free article] [PubMed] [Google Scholar]
- 24.Khan OF, et al. Endothelial siRNA delivery in nonhuman primates using ionizable low-molecular weight polymeric nanoparticles. Sci Adv 4, eaar8409 (2018). [DOI] [PMC free article] [PubMed] [Google Scholar]
- 25.Krohn-Grimberghe M, et al. Nanoparticle-encapsulated siRNAs for gene silencing in the haematopoietic stem-cell niche. Nat Biomed Eng 4, 1076–1089 (2020). [DOI] [PMC free article] [PubMed] [Google Scholar]
- 26.Hoeben A, et al. Vascular endothelial growth factor and angiogenesis. Pharmacol Rev 56, 549–580 (2004). [DOI] [PubMed] [Google Scholar]
- 27.Forsythe JA, et al. Activation of vascular endothelial growth factor gene transcription by hypoxia-inducible factor 1. Mol Cell Biol 16, 4604–4613 (1996). [DOI] [PMC free article] [PubMed] [Google Scholar]
- 28.Oladipupo S, et al. VEGF is essential for hypoxia-inducible factor-mediated neovascularization but dispensable for endothelial sprouting. Proc Natl Acad Sci U S A 108, 13264–13269 (2011). [DOI] [PMC free article] [PubMed] [Google Scholar]
- 29.Nagy JA, Dvorak AM & Dvorak HF VEGF-A and the induction of pathological angiogenesis. Annu Rev Pathol 2, 251–275 (2007). [DOI] [PubMed] [Google Scholar]
- 30.Carmeliet P & Jain RK Principles and mechanisms of vessel normalization for cancer and other angiogenic diseases. Nat Rev Drug Discov 10, 417–427 (2011). [DOI] [PubMed] [Google Scholar]
- 31.Potenta S, Zeisberg E & Kalluri R The role of endothelial-to-mesenchymal transition in cancer progression. Br J Cancer 99, 1375–1379 (2008). [DOI] [PMC free article] [PubMed] [Google Scholar]
- 32.Chen PY, et al. Endothelial-to-mesenchymal transition drives atherosclerosis progression. J Clin Invest 125, 4514–4528 (2015). [DOI] [PMC free article] [PubMed] [Google Scholar]
- 33.Dejana E, Hirschi KK & Simons M The molecular basis of endothelial cell plasticity. Nat Commun 8, 14361 (2017). [DOI] [PMC free article] [PubMed] [Google Scholar]
- 34.Thiery JP Epithelial-mesenchymal transitions in tumour progression. Nat Rev Cancer 2, 442–454 (2002). [DOI] [PubMed] [Google Scholar]
- 35.Peinado H, Olmeda D & Cano A Snail, Zeb and bHLH factors in tumour progression: an alliance against the epithelial phenotype? Nat Rev Cancer 7, 415–428 (2007). [DOI] [PubMed] [Google Scholar]
- 36.Nieto MA The snail superfamily of zinc-finger transcription factors. Nat Rev Mol Cell Biol 3, 155–166 (2002). [DOI] [PubMed] [Google Scholar]
- 37.Bachelder RE, Yoon SO, Franci C, de Herreros AG & Mercurio AM Glycogen synthase kinase-3 is an endogenous inhibitor of Snail transcription: implications for the epithelial-mesenchymal transition. J Cell Biol 168, 29–33 (2005). [DOI] [PMC free article] [PubMed] [Google Scholar]
- 38.Pires BR, et al. NF-kappaB Is Involved in the Regulation of EMT Genes in Breast Cancer Cells. PLoS One 12, e0169622 (2017). [DOI] [PMC free article] [PubMed] [Google Scholar]
- 39.Zhu Y, et al. HIF-1alpha regulates EMT via the Snail and beta-catenin pathways in paraquat poisoning-induced early pulmonary fibrosis. J Cell Mol Med 20, 688–697 (2016). [DOI] [PMC free article] [PubMed] [Google Scholar]
- 40.Zhang L, et al. Hypoxia induces epithelial-mesenchymal transition via activation of SNAI1 by hypoxia-inducible factor −1alpha in hepatocellular carcinoma. BMC Cancer 13, 108 (2013). [DOI] [PMC free article] [PubMed] [Google Scholar]
- 41.Xu X, et al. Snail Is a Direct Target of Hypoxia-inducible Factor 1alpha (HIF1alpha) in Hypoxia-induced Endothelial to Mesenchymal Transition of Human Coronary Endothelial Cells. J Biol Chem 290, 16653–16664 (2015). [DOI] [PMC free article] [PubMed] [Google Scholar]
- 42.Kokudo T, et al. Snail is required for TGFbeta-induced endothelial-mesenchymal transition of embryonic stem cell-derived endothelial cells. J Cell Sci 121, 3317–3324 (2008). [DOI] [PubMed] [Google Scholar]
- 43.Mahmoud MM, et al. Shear stress induces endothelial-to-mesenchymal transition via the transcription factor Snail. Sci Rep 7, 3375 (2017). [DOI] [PMC free article] [PubMed] [Google Scholar]
- 44.Cheng JC, Chang HM & Leung PC Transforming growth factor-beta1 inhibits trophoblast cell invasion by inducing Snail-mediated down-regulation of vascular endothelial-cadherin protein. J Biol Chem 288, 33181–33192 (2013). [DOI] [PMC free article] [PubMed] [Google Scholar]
- 45.Lopez D, Niu G, Huber P & Carter WB Tumor-induced upregulation of Twist, Snail, and Slug represses the activity of the human VE-cadherin promoter. Arch Biochem Biophys 482, 77–82 (2009). [DOI] [PubMed] [Google Scholar]
- 46.Ishikawa F, et al. Identification of angiogenic activity and the cloning and expression of platelet-derived endothelial cell growth factor. Nature 338, 557–562 (1989). [DOI] [PubMed] [Google Scholar]
- 47.Benjamin LE, Hemo I & Keshet E A plasticity window for blood vessel remodelling is defined by pericyte coverage of the preformed endothelial network and is regulated by PDGF-B and VEGF. Development 125, 1591–1598 (1998). [DOI] [PubMed] [Google Scholar]
- 48.Battegay EJ, Rupp J, Iruela-Arispe L, Sage EH & Pech M PDGF-BB modulates endothelial proliferation and angiogenesis in vitro via PDGF beta-receptors. J Cell Biol 125, 917–928 (1994). [DOI] [PMC free article] [PubMed] [Google Scholar]
- 49.Liu C, et al. Platelet-derived growth factor blockade on cardiac remodeling following infarction. Mol Cell Biochem 397, 295–304 (2014). [DOI] [PubMed] [Google Scholar]
- 50.Zymek P, et al. The role of platelet-derived growth factor signaling in healing myocardial infarcts. J Am Coll Cardiol 48, 2315–2323 (2006). [DOI] [PubMed] [Google Scholar]
- 51.Wang Y, et al. Ephrin-B2 controls VEGF-induced angiogenesis and lymphangiogenesis. Nature 465, 483–486 (2010). [DOI] [PubMed] [Google Scholar]
- 52.Gong Y, Zhao Y, Li Y, Fan Y & Hoover-Plow J Plasminogen regulates cardiac repair after myocardial infarction through its noncanonical function in stem cell homing to the infarcted heart. J Am Coll Cardiol 63, 2862–2872 (2014). [DOI] [PMC free article] [PubMed] [Google Scholar]
- 53.Lang RM, et al. Recommendations for cardiac chamber quantification by echocardiography in adults: an update from the American Society of Echocardiography and the European Association of Cardiovascular Imaging. Eur Heart J Cardiovasc Imaging 16, 233–270 (2015). [DOI] [PubMed] [Google Scholar]
- 54.Qiu X, et al. Single-cell mRNA quantification and differential analysis with Census. Nat Methods 14, 309–315 (2017). [DOI] [PMC free article] [PubMed] [Google Scholar]
- 55.Liu T, et al. Circulating Glioma Cells Exhibit Stem Cell-like Properties. Cancer Res 78, 6632–6642 (2018). [DOI] [PMC free article] [PubMed] [Google Scholar]
- 56.Yang B, et al. Single-cell phenotyping within transparent intact tissue through whole-body clearing. Cell 158, 945–958 (2014). [DOI] [PMC free article] [PubMed] [Google Scholar]
- 57.Billingsley M, et al. Ionizable Lipid Nanoparticle Mediated mRNA Delivery for Human CAR T Cell Engineering. Nano Lett (2020). [DOI] [PMC free article] [PubMed] [Google Scholar]
Associated Data
This section collects any data citations, data availability statements, or supplementary materials included in this article.
Supplementary Materials
Data Availability Statement
RNA-seq data have been deposited in NCBI’s Gene Expression Omnibus under the accession number GSE163772, while the Single-cell and single-nuclei RNA sequencing analysis of mouse cardiac tissues with MI have been deposited in the same publicly available databank under the accession numbers GSE163956 and GSE193290, respectively. The data supporting the findings of this study are available within the paper and its Supplementary Information. Source data are provided with this paper.