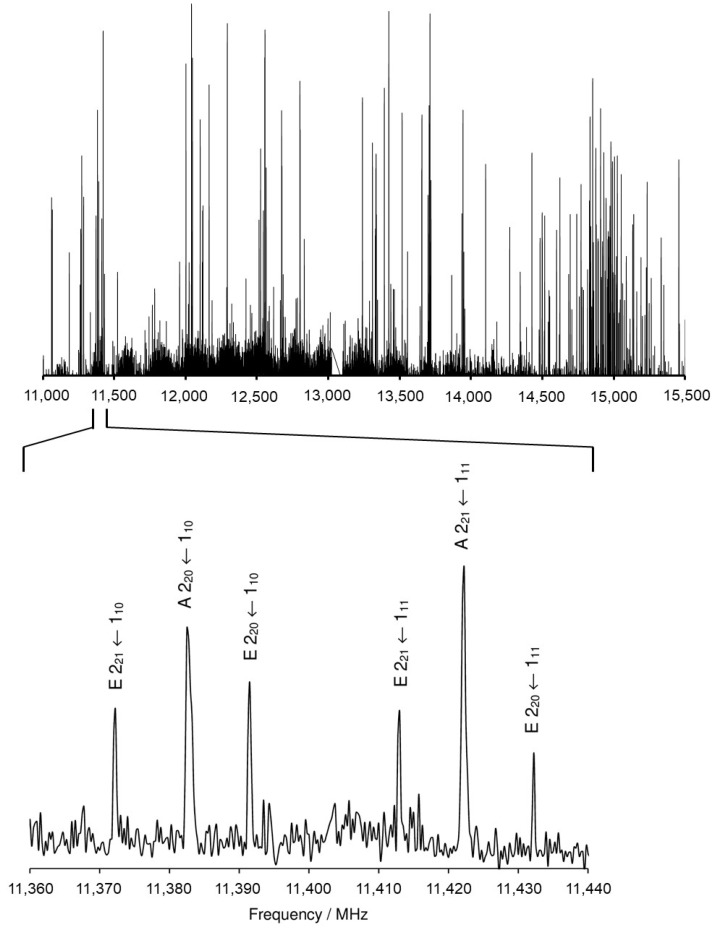
Figure 2.
The survey spectrum of MHO recorded from 11,000 MHz to 15,500 MHz. A portion of the scan from 11,360 MHz to 11,440 MHz is illustrated in an enlarged scale where assigned lines are labeled with their corresponding quantum numbers J, Ka, Kc and torsional species (A or E). They all belong to conformer I. The intensities are in arbitrary units and a logarithmic scale.

