Figure 6.
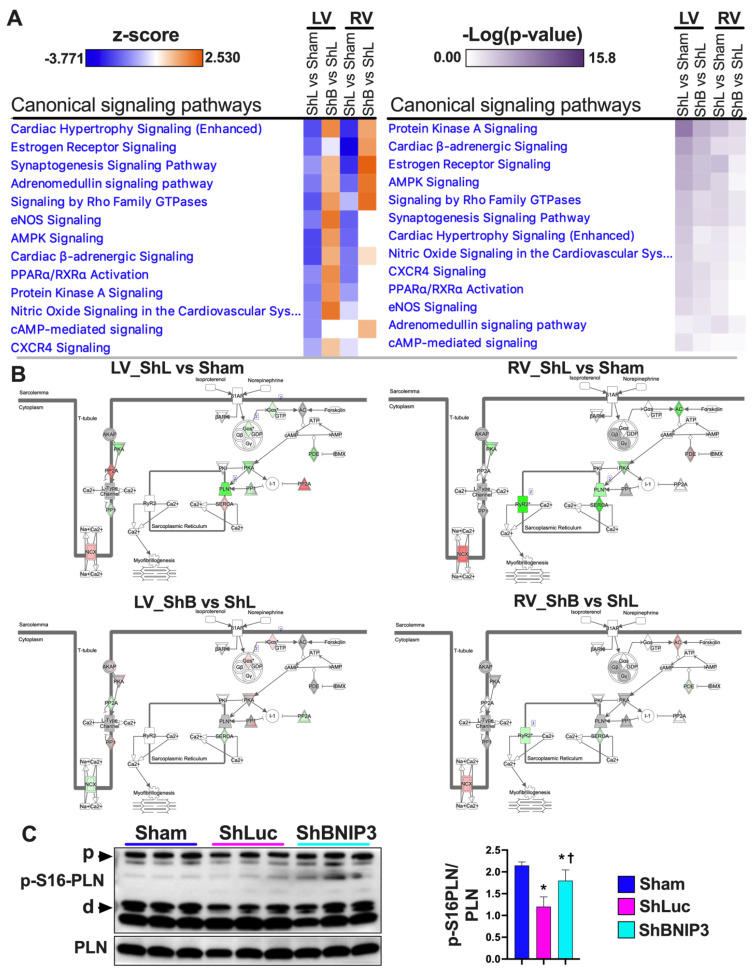
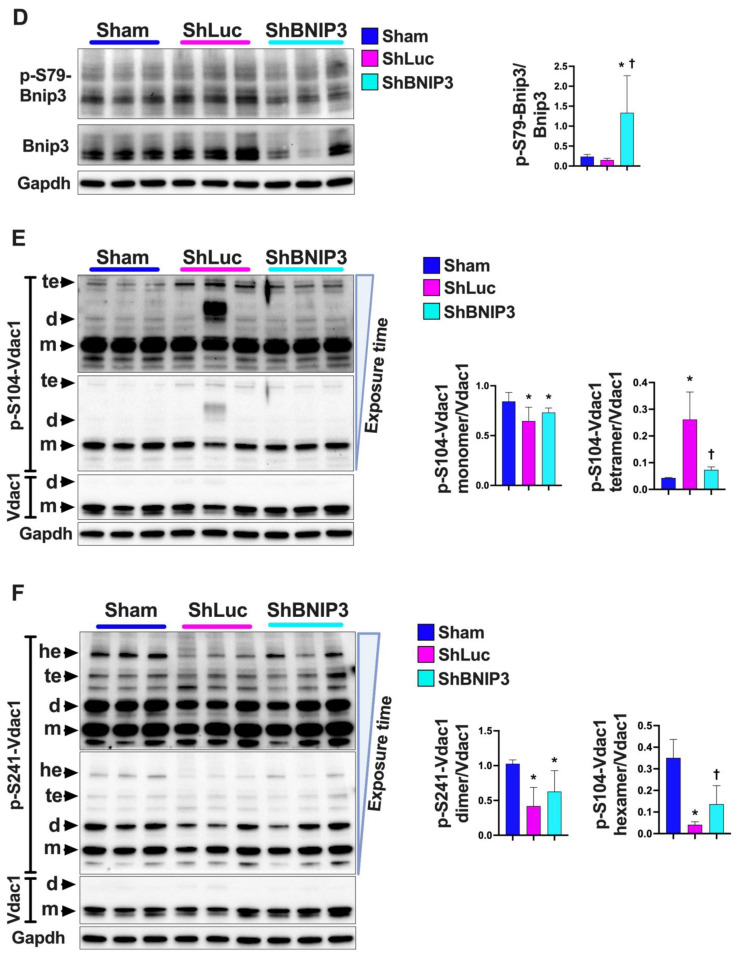
Validation of the LV and RV phosphoproteomic findings. (A). Heat maps of the Canonical signaling pathways that were enriched by −Log10 p-value in the phosphoproteomic datasets. The orange and blue color intensities represent the z-score-based extent of upregulation/activation or downregulation/inhibition, respectively. The heat maps were generated in IPA after “Core Analyses” of each of the two-group comparisons, which were then compared with each other in IPA’s “Comparison Analyses” function. (B). Cardiac β-adrenergic signaling network of the phosphoproteins/phosphosites in ShLuc vs. Sham (upper panel) and ShBNIP3 vs. ShLuc (lower panel) in LV (left) and RV (right) phosphoproteomic datasets. The network highlights phosphoproteins/phosphosites that were differentially downregulated (green) or upregulated (red) or were unchanged (grey) in the two-group comparisons, and those that were not identified (white) in the LV and RV phosphoproteomic datasets. The darker the green or red color, the higher the degree of decrease or increase in relative expression, respectively. (C). Western blot validating the change in phospholamban (PLN) phosphorylation at serine 16 residue (p-S16-PLN) in Sham, ShLuc, and ShBNIP3 experimental groups, * p < 0.05 vs. Sham and † p < 0.05 vs. ShLuc. (D–F). Western blot validating the change in BNIP3 and VDAC1 phosphorylation at serine 79 (p-S79-BNIP3), serine 104 (p-S104-VDAC1) and serine 241 (p-S241-VDAC1) residues, respectively, in Sham, ShLuc, and ShBNIP3 experimental groups, * p < 0.05 vs. Sham and † p < 0.05 vs. ShLuc. Abbreviations: p, pentamer; m, monomer; d, dimer; te, tetramer; he, hexamer.


