Abstract
Pseudomonas aeruginosa PAO1 produces two chemically distinct types of lipopolysaccharides (LPSs), termed A-band LPS and B-band LPS. The A-band O-side chain is electroneutral at physiological pH, while the B-band O-side chain contains numerous negatively charged sites due to the presence of uronic acid residues in the repeat unit structure. Strain PAO1 (A+ B+) and three isogenic LPS mutants (A+ B−, A− B+, and A− B−) were studied to determine the contribution of the O-side-chain portion of LPS to metal binding by the surfaces of gram-negative cells. Transmission electron microscopy with energy-dispersive X-ray spectroscopy was used to locate and analyze sites of metal deposition, while atomic absorption spectrophotometry and inductively coupled plasma-mass spectrometry were used to perform bulk quantitation of bound metal. The results indicated that cells of all of the strains caused the precipitation of gold as intracellular, elemental crystals with a d-spacing of 2.43 Å. This type of precipitation has not been reported previously for gram-negative cells and suggests that in the organisms studied gold binding is not a surface-mediated event. All four strains bound similar amounts of copper (0.213 to 0.222 μmol/mg [dry weight] of cells) at the cell surface, suggesting that the major surface metal-binding sites reside in portions of the LPS which are common to all strains (perhaps the phosphoryl groups in the core-lipid A region). However, significant differences were observed in the abilities of strains dps89 (A− B+) and AK1401 (A+ B−) to bind iron and lanthanum, respectively. Strain dps89 caused the precipitation of iron (1.623 μmol/mg [dry weight] of cells) as an amorphous mineral phase (possibly iron hydroxide) on the cell surface, while strain AK1401 nucleated precipitation of lanthanum (0.229 μmol/mg [dry weight] of cells) as apiculate, surface-associated crystals. Neither iron nor lanthanum precipitates were observed on the cells of other strains, which suggests that the combination of A-band LPS and B-band LPS produced by a cell may result in a cell surface which promotes the formation of metal-rich precipitates. We therefore propose that the negatively charged sites located in the O-side chains are not directly responsible for the binding of metallic ions; however, the B-band LPS molecule as a whole may contribute to overall cell surface properties which favor the precipitation of distinct metal-rich mineral phases.
Bacteria express a wide variety of complex molecules on their surfaces, which, at physiological pH values, contain numerous charged chemical groups (such as phosphoryl, carboxyl, and amino groups) that usually give the cell surface a net anionic (negative) charge density (15). Since the cell surface is in direct contact with the environment, the charged groups within the surface layers are able to interact with ions or charged molecules present in the external milieu. As a result, metal cations can become electrostatically attracted and bound to the cell surface (3, 4, 26).
Numerous studies have examined the metal ion-cell wall interactions of gram-positive bacteria (particularly members of the genus Bacillus) (3, 4, 6, 9). The sites responsible for metal binding in this organism are probably the carboxyl sites within the peptidoglycan, as well as the phosphoryl groups of the teichoic and teichuronic acid secondary polymers (3, 4, 6, 9). Although it appears that most of the metal-binding capacity of gram-positive organisms is generated by the thick peptidoglycan layer, it is unlikely that the same layer provides the same binding capacity in a gram-negative organism, since gram-negative peptidoglycan is much thinner than gram-positive peptidoglycan and is shielded by an outer membrane (7, 12). However, the lipopolysaccharide (LPS) layer can be highly anionic and extends beyond the outer membrane proteins; this layer has been implicated as the major source of metal binding in gram-negative bacteria (5, 10).
One of the most-studied gram-negative organisms (with respect to metal binding) is Escherichia coli K-12, probably because it is a common laboratory strain and its LPS is well-characterized. In this organism, exogenous metal ions bind primarily to the polar head groups of phospholipids and LPS in the outer membrane (5, 29). Ferris and Beveridge (11) demonstrated that the phosphoryl residues in these molecules were the most probable binding sites for metal cations in the E. coli K-12 outer membrane. Unfortunately, E. coli K-12 does not produce an O-polysaccharide side chain, so the contribution of this portion of LPS to gram-negative bacterial metal binding has not been examined in detail yet.
The LPS of Pseudomonas aeruginosa PAO1 does contain an O-side chain and is also well-characterized (1, 18). This LPS is composed of two chemically and antigenically distinct forms, termed A-band LPS and B-band LPS (28). B-band LPS is responsible for determining the serotype specificity of a strain, while A-band LPS is a more conserved structure that is found in most P. aeruginosa strains and is referred to as “common antigen” (21). The core regions are composed primarily of neutral sugars but do contain some negatively charged sites (e.g., on the 2-keto-3-deoxyoctulosonic acid residues, as well as several phosphate groups in the inner core). Sulfate groups have also been found in the core region of A-band LPS. The A-band LPS O-side chain is neutrally charged and is composed of up to 20 trisaccharide repeating units consisting of d-rhamnose linked by α1→2 and α1→3 bonding in each trimeric unit (1). In contrast, the B-band LPS O-side chain of strain PAO1 is composed of a trisaccharide repeating unit consisting of two residues of an amino derivative of manuronic acid and one residue of N-acetyl-d-fucosamine (18) and varies in length from 30 to 50 repeat units (20). It therefore contains more electronegative (i.e., carboxyl) sites than the A-band LPS O-side chain contains.
A number of isogenic mutant strains have been isolated which are deficient in either one or both of the LPS types. Strain AK1401 (2) does not express B-band LPS (i.e., its phenotype is A+ B−). Strain rd7513 (23) is an A-band-deficient mutant derived from strain AK1401 (i.e., its phenotype is A− B−). Finally, strain dps89 (17) is a revertant strain of rd7513 which expresses B-band LPS but not A-band LPS (i.e., its phenotype is A− B+). Using these mutants in conjunction with the wild-type strain PAO1 (A+ B+) in this study, we attempted to define the role of the O-side-chain portion of LPS in metal binding by gram-negative bacteria.
MATERIALS AND METHODS
Metals.
The four metal salts used in this study were AuCl3 (Sigma Chemical Co., St. Louis, Mo.), Cu(NO3)2 · 3H2O, Fe(NO3)3 · 9H2O, and La(NO3)3 · 6H2O (all from Fisher Scientific, Unionville, Ontario, Canada). Metal solutions were prepared by dissolving the metal salts in ultrapure deionized water (UDW) (18 MΩ · cm). When possible, all materials (glassware, plasticware, centrifuge tubes, etc.) were acid leached in 50% (vol/vol) HNO3 for at least 24 h prior to use and then rinsed in UDW.
Bacterial strains and culture conditions.
The bacterial strains used are described in Table 1. Cultures were maintained on Trypticase soy agar slants at 22°C. Cells were grown in Trypticase soy broth at 22°C on a rotating shaker at 125 rpm.
TABLE 1.
Bacterial strains and surface characteristics
Sodium dodecyl sulfate-polyacrylamide gel electrophoresis and Western immunoblotting.
LPS from the four strains were prepared as described by Hitchcock and Brown (14). For Western immunoblot analysis, electrophoresis of LPS samples was carried out as described previously (19, 21). The bands were then transferred onto nitrocellulose sheets by electrophoresis at 100 V for 60 min, and immunoblots were prepared by using a modification of the method originally described by Towbin et al. (30). Following transfer, the blots were rinsed briefly in Tris-buffered saline (TBS) (0.9% [wt/vol] NaCl, 10 mM Tris; pH 7.4) and placed in blocking buffer (3% skim milk in TBS) for 60 min at 22°C. They were then rinsed briefly in TBS and reacted with either monoclonal antibody N1F10 (anti-A-band LPS monoclonal antibody) (21) or monoclonal antibody MF15-4 (anti-B-band LPS monoclonal antibody) (19) for 60 min at 22°C and then overnight at 4°C. The bound monoclonal antibodies were then reacted with 0.05% (vol/vol) horseradish-conjugated goat anti-mouse antibody (in TBS) for 2 h at 22°C. The bands were finally developed for 30 min in TBS containing 25 μg of 4-chloro-1-naphthol per ml and 0.01% (vol/vol) H2O2. Development was stopped by repeatedly rinsing the blots in UDW.
Preparation of samples for metal-binding analyses.
Cells were grown to the mid-exponential phase (optical density at 600 nm, 0.2), and 5-ml portions of each cell suspension were transferred to sterile centrifuge tubes and centrifuged at 6,000 × g for 10 min. The supernatant fluid was removed, and the cell pellets were resuspended in 1-ml portions of UDW and transferred to sterile 1.5-ml microcentrifuge tubes. The cells were then washed three times in 1 ml of UDW with centrifugation at 16,000 × g for 1 min for each wash.
The washed cells were resuspended in 1 ml of a 1 mM metal solution for 15 min at 22°C. Following incubation with the metal, the cells were centrifuged at 16,000 × g for 1 min, and the supernatant solutions (still containing some metal) were removed, acidified with either 0.2% (vol/vol) HNO3 (copper-, iron-, or lanthanum-treated samples) or 0.2% (vol/vol) HCl (gold-treated samples), and stored at −20°C. The cell pellets were then washed four times in UDW, and the supernatant fluid from each wash was acidified and stored as described above. Finally, the cell pellets were dried at 60°C, their dry weights were determined, and then the cell pellets were resuspended in 1-ml portions of either concentrated (71%, vol/vol) HNO3 or concentrated (35%, vol/vol) HCl. These acid-treated samples were then heated to 100°C until only viscous pastes remained in the bottoms of the tubes. The pastes were then dissolved in 1 ml (final volume) of 0.2% (vol/vol) HNO3 or 0.2% (vol/vol) HCl. The amounts of metal in these samples represented the amounts of metal bound by the cells during the 15-min incubation period. These amounts, when combined with the amounts recovered from the fractions which were saved after incubation, should equal the total amounts of metal present in 1-ml portions of the original metal stock solutions used to treat the cells.
Three replicates consisting of three samples each were prepared, in addition to controls which consisted of cells which were not treated with any metal (cellular controls) and samples of metal solutions which were allowed to precipitate chemically for 15 min at 22°C (acellular controls). The analysis of variance test was used to test the significance of the differences between replicates, while the two-tailed t test was used to test the significance of the differences between the average amounts of metal bound by different strains.
Atomic absorption spectrophotometry and inductively coupled plasma-mass spectrometry.
Samples which contained gold, copper, or iron were analyzed to determine their metal contents by using a Perkin-Elmer model 2380 atomic absorption spectrophotometer operating in the graphite furnace mode with a model HGA-400 heated graphite atomizer. The apparatus was calibrated to the manufacturer’s specifications for each metal and was standardized by using Baker Instra-Analyzed atomic spectral standards (J. T. Baker Chemical Co., Phillipsburg, N.J.). This method has detection limits of 0.761, 1.574, and 1.791 nM for gold, copper, and iron, respectively (27). Triplicate readings were obtained for each sample, and the averages and standard deviations are reported below.
Unfortunately, this apparatus could not be calibrated for detection of lanthanum. Therefore, the lanthanum samples were analyzed at the Geoscience Laboratories (Ministry of Northern Development and Mines) in Sudbury, Ontario, Canada, by using a Perkin-Elmer model Elan 5000 inductively coupled plasma-mass spectrometer. This method has a detection limit of 0.004 nM for lanthanum (27). As described above for atomic absorption spectrophotometry, triplicate readings were obtained for each sample and averaged.
TEM and EDS.
To examine thin sections, cells were prepared and treated as described above and then processed for transmission electron microscopy (TEM) and energy-dispersive X-ray spectroscopy (EDS) as described previously (3, 4), except no electron microscopy stains (such as uranyl acetate, osmium tetroxide, or lead citrate) were used; thus, any contrast observed in the sections was due solely to the metal bound by the cells during treatment. Non-metal-treated control samples were prepared in the same way.
All electron micrographs were taken with a Philips model EM300 TEM operating at 60 kV with a liquid nitrogen cold trap in place. EDS and selected area electron diffraction (SAED) were performed with a Philips model EM400T TEM operating at 100 kV with a liquid nitrogen cold trap in place. This machine was coupled to a Link Analytical model LZ-5 X-ray detector which allowed EDS spectra to be collected over 100 s (live count time) when a beam diameter of approximately 400 nm at 100 kV was used.
RESULTS
Polyacrylamide gel electrophoresis and Western immunoblotting.
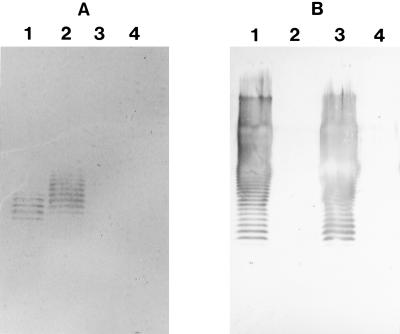
As shown in Fig. 1, LPSs from both strain PAO1 (A+ B+) and strain AK1401 (A+ B−) reacted with the anti-A-band LPS monoclonal antibody, while LPSs from both strain PAO1 (A+ B+) and strain dps89 (A− B+) reacted with the anti-B-band LPS monoclonal antibody. LPS from strain rd7513 (A− B−) did not react with either monoclonal antibody.
FIG. 1.
Western immunoblots of LPS antigens reacted with anti-A-band LPS monoclonal antibody (A) and anti-B-band LPS monoclonal antibody (B). Lane 1, strain PAO1 (A+ B+); lane 2, strain AK1401 (A+ B−); lane 3, strain dps89 (A− B+); lane 4, strain rd7513 (A− B−). The blots confirmed that each strain produced the correct LPS chemotype.
Analysis of controls.
Figure 2 shows a typical example of a thin section of a control (untreated) cell. The cells exhibited little, if any, electron density compared to the surrounding embedding resin and consequently were very difficult to distinguish. EDS of the surfaces of these cells failed to generate energy peaks corresponding to energy peaks of any metal other than iron (presumably from iron in the growth medium). However, oxygen, phosphorus, and chlorine were common. Although the cell shown in Fig. 2 is a strain PAO1 (A+ B+) cell, thin sections of cells of all of the other strains exhibited similar electron densities, and the cells produced similar X-ray spectra (data not shown). Some strains reacted similarly following metal treatment, and below we first describe the findings which were common to all strains and then describe the results which were exceptional.
FIG. 2.
Transmission electron micrograph of a thin section of an untreated strain PAO1 cell. The cell (whose surface is indicated by arrows) is difficult to distinguish from the embedding resin due to the lack of electron-dense elements in the sample. Bar = 200 nm. (Inset) EDS spectrum obtained from an untreated PAO1 cell, showing peaks for oxygen, phosphorus, chlorine, iron, and copper. The first four peaks correspond to elements present in the sample. The large copper peaks were generated by the supporting grid. Similar results were obtained for all four strains.
Analysis of copper binding.
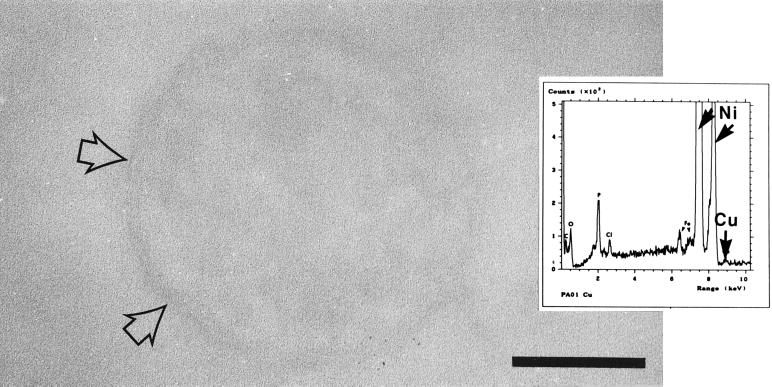
Copper-treated cells of all strains were very similar in appearance to the control cells (Fig. 3). Since copper does not easily precipitate from solution and since it reacts stoichiometrically with exposed reactive surface groups, the level of metal binding is relatively low, and binding sites are difficult to identify by TEM. The bacterial surfaces were occasionally more sharply defined than the control cell surfaces, but in general, the contrast between the bacterial surfaces and the embedding resin was poor. The X-ray peaks generated by copper-treated cells corresponded to the X-ray peaks generated by control cells, although a very small copper peak was sometimes observed. The amount of copper bound by each of the strains is shown in Table 2. No significant differences in the amounts of copper bound by the strains were found. Furthermore, no chemical precipitation of copper during the 15-min treatment period was detected.
FIG. 3.
Transmission electron micrograph of a copper-treated strain PAO1 cell. Compared to the control, this cell was easier to distinguish as copper bound to it and provided contrast at the cell surface (arrows). Bar = 200 nm. (Inset) EDS spectrum generated by a copper-treated cell. The expected position of the copper peak is indicated, although the peak itself is small. The large nickel peaks were generated by the supporting grid, and all of the other peaks (O, P, Cl, and Fe) were also present in controls. Similar results were obtained for all four strains.
TABLE 2.
Amount of copper bounda
| Prepn | Amt of copper bound (μmol/mg [dry wt] of cells)
|
|||
|---|---|---|---|---|
| Replicate 1b | Replicate 2 | Replicate 3 | Mean | |
| P. aeruginosa PAO1 (A+ B+) | 0.215 ± 0.025 | 0.232 ± 0.016 | 0.206 ± 0.019 | 0.218 ± 0.013 |
| P. aeruginosa AK1401 (A+ B−) | 0.207 ± 0.041 | 0.214 ± 0.036 | 0.244 ± 0.047 | 0.222 ± 0.020 |
| P. aeruginosa dps89 (A− B+) | 0.230 ± 0.006 | 0.203 ± 0.013 | 0.206 ± 0.028 | 0.213 ± 0.015 |
| P. aeruginosa rd7513 (A− B−) | 0.233 ± 0.037 | 0.211 ± 0.013 | 0.213 ± 0.033 | 0.219 ± 0.012 |
| Acellular controlc | 0 | 0 | 0 | 0 |
Whole cells were treated with a 1 mM solution of Cu(NO3)2 · 3H2O for 15 min at 22°C.
Data are values from separate measurements of three whole-cell–metal interactions.
Amount of metal which precipitated chemically during the 15-min treatment period.
Analysis of iron binding.
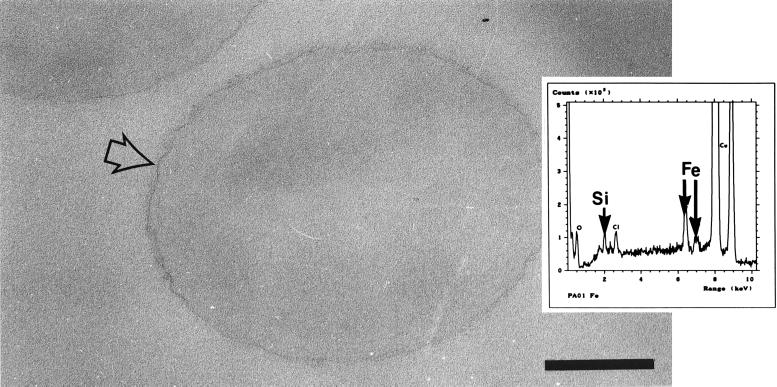
Quantitation of bound iron by atomic absorption spectrophotometry revealed that three of the four strains (PAO1 [A+ B+], AK1401 [A+ B−], and rd7513 [A− B−]) bound equal amounts of the metal, while strain dps89 (A− B+) bound significantly more (Table 3). Thin sections of cells of strains PAO1, AK1401, and rd7513 exhibited increased electron densities (compared to controls) that were localized at the cell surface (Fig. 4). In addition, the outer membranes typically appeared to be ruffled as a result of iron treatment. Analysis of the electron-dense surfaces of these cells by EDS resulted in spectra which were similar to the spectra of the controls, except the iron peak was slightly larger and, interestingly, there was also a silicon peak.
TABLE 3.
Amount of iron bounda
| Prepn | Amt of iron bound (μmol/mg [dry wt] of cells)
|
|||
|---|---|---|---|---|
| Replicate 1b | Replicate 2 | Replicate 3 | Mean | |
| P. aeruginosa PAO1 (A+ B+) | 1.097 ± 0.127 | 1.077 ± 0.142 | 1.044 ± 0.187 | 1.073 ± 0.027 |
| P. aeruginosa AK1401 (A+ B−) | 1.043 ± 0.148 | 1.067 ± 0.168 | 1.026 ± 0.106 | 1.045 ± 0.021 |
| P. aeruginosa dps89 (A− B+) | 1.681 ± 0.107 | 1.571 ± 0.125 | 1.618 ± 0.253 | 1.623 ± 0.055d |
| P. aeruginosa rd7513 (A− B−) | 1.038 ± 0.037 | 1.022 ± 0.208 | 1.052 ± 0.026 | 1.037 ± 0.015 |
| Acellular controlc | 0 | 0 | 0 | 0 |
Whole cells were treated with a 1 mM solution of Fe(NO3)3 · 9H2O for 15 min at 22°C.
Data are values from separate measurements of three whole-cell–metal interactions.
Amount of metal which precipitated chemically during the 15-min treatment period.
The value for dps89 is significantly different from all other values, as determined by the two-tailed t test.
FIG. 4.
Transmission electron micrograph of an iron-treated strain PAO1 cell. The iron bound to the cell surface, providing increased electron density. In addition, the cell surface appeared to be ruffled in some areas (arrow). Bar = 200 nm. (Inset) EDS spectrum for the surface of an iron-treated cell, showing large iron peaks and the presence of silicon (probably from the glassware), which suggested that binding of the metal was accompanied by binding of silicon. Similar results were obtained for all of the strains except dps89.
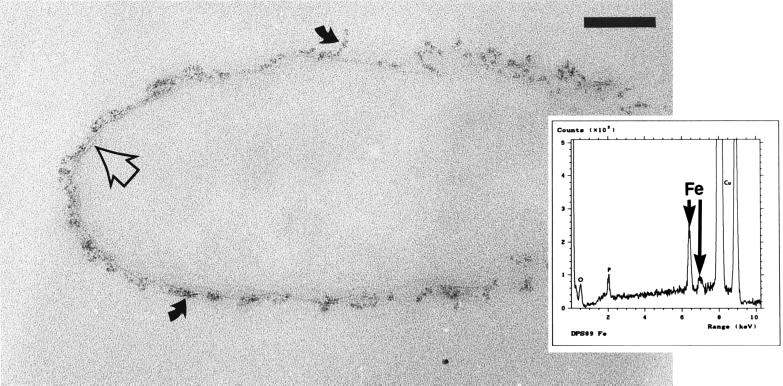
However, iron treatment of strain dps89 (A− B+) resulted in macroscopically visible changes to the cells. Within 2 min following addition of the iron solution the cells began to floc and sediment out of suspension. Furthermore, centrifugation of the cells resulted in a cell pellet which was yellow-orange instead of the characteristic white-pink color (data not shown). Microscopic analysis of iron-treated dps89 (A− B+) cells clearly showed that the dps89 iron binding differed from the iron binding in the other three strains (Fig. 5). Electron-dense precipitates of different thicknesses were present around the surfaces of the cells, and in some instances the faces of membrane bilayers were visible. SAED of the precipitates failed to generate a diffraction pattern, indicating that the precipitates were amorphous. However, EDS analysis revealed that the precipitates generated strong iron peaks.
FIG. 5.
Thin section of an iron-treated strain dps89 cell. The iron bound to such an extent that membranes were sometimes visible (open arrow), and amorphous precipitates (solid arrows) formed on the cell surface. Bar = 100 nm. (Inset) EDS spectra of the precipitates confirmed that they were iron rich. The lack of other high-atomic-number elements suggested that the precipitate might be an iron hydroxide. These results were obtained only for strain dps89.
Analysis of gold binding.
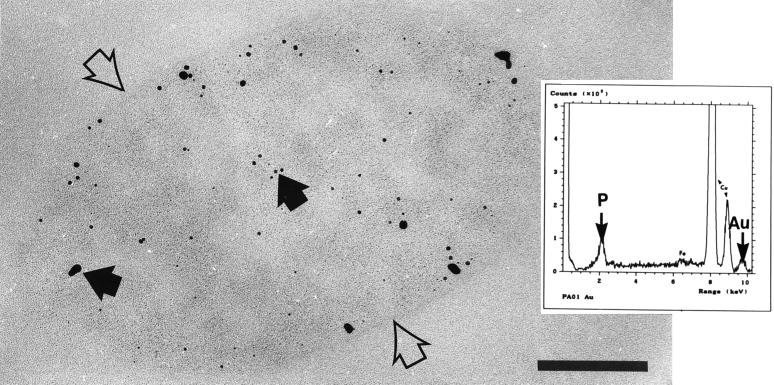
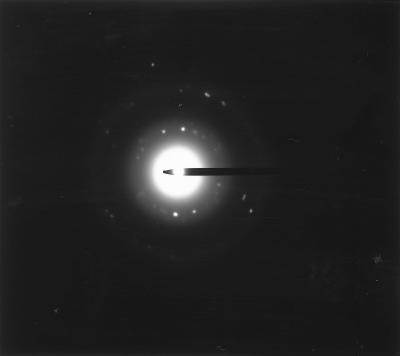
Table 4 shows the amounts of gold bound by the different strains. It appeared that strains PAO1 (A+ B+) and rd7513 (A− B−) bound equal amounts of gold and that strains AK1401 (A+ B−) and dps89 (A− B+) also bound equal amounts, although the amounts of gold bound by strains AK1401 and dps89 were greater than the amounts bound by strains PAO1 and rd7513. However, electron microscopy of gold-treated cells of all four strains revealed that the gold did not bind to the cell surface, as the iron and copper had. Rather, the gold appeared to precipitate within the cytoplasm of the cells as electron-dense, colloidal aggregates (Fig. 6). The sizes, shapes, and locations of the precipitates in the cytoplasm were all random. EDS spectra generated by the precipitates contained few peaks other than the peaks corresponding to gold and phosphorus, while SAED of the aggregates produced diffraction patterns with lattice or d- spacings of approximately 2.43 Å, which are indicative of metallic gold (Fig. 7).
TABLE 4.
Amount of gold bounda
| Prepn | Amt of gold bound (μmol/mg [dry wt] of cells)
|
|||
|---|---|---|---|---|
| Replicate 1b | Replicate 2 | Replicate 3 | Mean | |
| P. aeruginosa PAO1 (A+ B+) | 0.430 ± 0.009 | 0.388 ± 0.050 | 0.417 ± 0.019 | 0.412 ± 0.022 |
| P. aeruginosa AK1401 (A+ B−) | 0.532 ± 0.058 | 0.562 ± 0.032 | 0.522 ± 0.056 | 0.539 ± 0.021d |
| P. aeruginosa dps89 (A− B+) | 0.592 ± 0.016 | 0.524 ± 0.017 | 0.527 ± 0.055 | 0.548 ± 0.038d |
| P. aeruginosa rd7513 (A− B−) | 0.410 ± 0.035 | 0.446 ± 0.010 | 0.425 ± 0.061 | 0.427 ± 0.018 |
| Acellular controlc | 0 | 0 | 0 | 0 |
Whole cells were treated with a 1 mM solution of AuCl3 for 15 min at 22°C.
Data are values from separate measurements of three whole-cell–metal interactions.
Amount of metal which precipitated chemically during the 15-min treatment period.
The values for AK1401 and dps89 are significantly different from the values for rd7513 and PAO1.
FIG. 6.
Thin section of a gold-treated strain PAO1 cell. The cell (whose surface is indicated by open arrows) is filled with numerous electron-dense precipitates of different sizes (solid arrows). Bar = 200 nm. (Inset) EDS analysis of the electron-dense precipitates produced only a peak for gold and a broadening of the phosphorus peak (which overlapped a secondary gold peak). Similar results were obtained for all four strains.
FIG. 7.
SAED pattern obtained from the intracellular gold precipitates. The diffraction pattern indicated that the precipitates were crystalline and had a lattice d-spacing value of 2.43 Å, which is similar to the d-spacing value of metallic gold (2.36 Å).
Analysis of lanthanum binding.
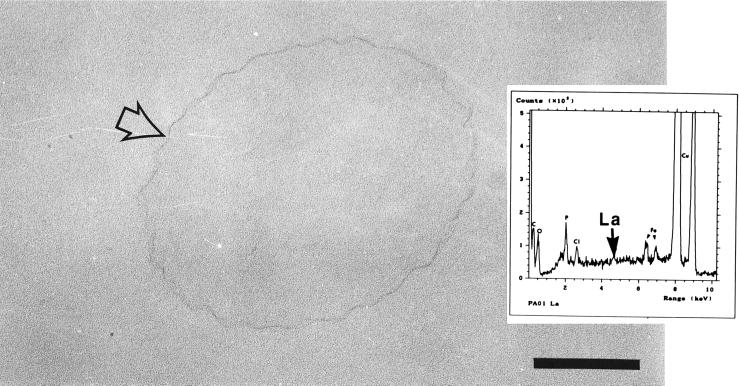
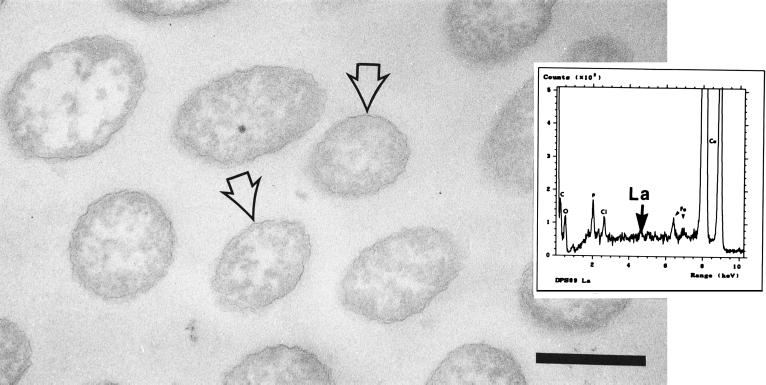
The inductively coupled plasma-mass spectrometry data (Table 5) revealed that of the four strains examined, strain AK1401 (A+ B−) bound the most lanthanum, followed by dps89 (A− B+); smaller amounts were bound by strains PAO1 (A+ B+) and rd7513 (A− B−), which bound similar amounts. Once again, the differences in metal binding among the strains were apparent when TEM was used. Lanthanum-treated strain PAO1 (A+ B+) and rd7513 (A− B−) cells exhibited greater cell surface electron densities than the controls (Fig. 8); however, EDS spectra contained only minor energy peaks corresponding to lanthanum. In contrast, lanthanum-treated dps89 (A− B+) cells showed good contrast, with the lanthanum binding not only to the surfaces of the cells but also to sites within the cytoplasm, giving the cells a conventionally stained appearance (Fig. 9). However, EDS analysis of lanthanum-treated dps89 (A− B+) cells failed to detect significant energy peaks corresponding to lanthanum.
TABLE 5.
Amount of lanthanum bounda
| Prepn | Amt of lanthanum bound (μmol/mg [dry wt] of cells
|
|||
|---|---|---|---|---|
| Replicate 1b | Replicate 2 | Replicate 3 | Mean | |
| P. aeruginosa PAO1 (A+ B+) | 0.041 ± 0.004 | 0.043 ± 0.004 | 0.033 ± 0.006 | 0.039 ± 0.005d |
| P. aeruginosa AK1401 (A+ B−) | 0.240 ± 0.026 | 0.210 ± 0.028 | 0.236 ± 0.007 | 0.229 ± 0.016d |
| P. aeruginosa dps89 (A− B+) | 0.052 ± 0.005 | 0.057 ± 0.004 | 0.066 ± 0.012 | 0.058 ± 0.007d |
| P. aeruginosa rd7513 (A− B−) | 0.031 ± 0.004 | 0.033 ± 0.006 | 0.038 ± 0.004 | 0.034 ± 0.004d |
| Acellular controlc | 0 | 0 | 0 | 0 |
Whole cells were treated with a 1 mM solution of La(NO3)3 · 6H2O for 15 min at 22°C.
Data are values from separate measurements of three whole-cell–metal interactions.
Amount of metal which precipitated chemically during the 15-min treatment period.
The values for PAO1 and dps89 are significantly different from each other, and the value for AK1401 is significantly different from all other values. The values for PAO1 and rd7513 are not significantly different from one another.
FIG. 8.
Thin section of a lanthanum-treated strain PAO1 cell. Binding of the metal resulted in increased electron density and a pronounced ruffling of the cell surface (arrow). Bar = 200 nm. (Inset) EDS spectrum derived from a lanthanum-treated cell. The expected position of lanthanum in the spectrum is indicated. Similar results were obtained for strains PAO1 (A+ B+) and rd7513 (A− B−).
FIG. 9.
Thin section of lanthanum-treated strain dps89 (A− B+) cells. The cells were difusely stained by the lanthanum, although the surfaces appeared to be more electron dense and were also ruffled (arrows). Bar = 0.5 μm. (Inset) EDS spectra, showing that little lanthanum was present.
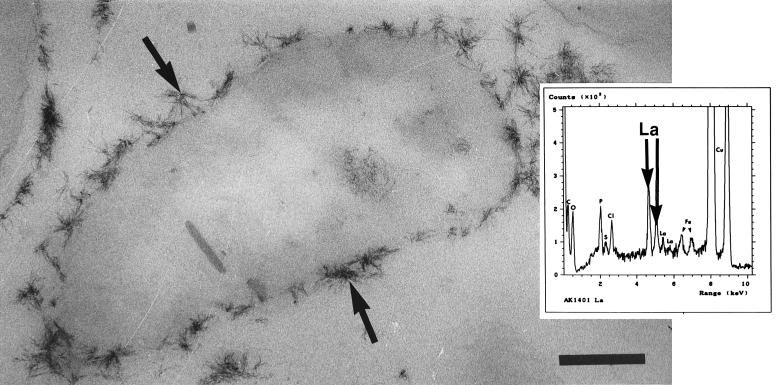
Finally, the appearance of thin sections of strain AK1401 (A+ B−) cells, which bound significantly more lanthanum than cells of the other three strains, was different. The cells were surrounded by clumps of electron-dense apiculate precipitates which varied in size and projected outward from the cell surface (Fig. 10). EDS of the precipitates generated several strong energy peaks corresponding to lanthanum. In addition, the lanthanum-rich precipitates weakly diffracted the electron beam (data not shown). Treatment of each strain with lanthanum resulted in a ruffling of the cell surface which was similar to, but more pronounced than, the ruffling observed with iron treatment.
FIG. 10.
Thin section of a lanthanum-treated strain AK1401 (A+ B−) cell. This cell had electron-dense apiculate precipitates (arrows) which extended outward from the cell surface. Bar = 200 nm. (Inset) EDS spectrum generated from the precipitates. Several lanthanum peaks are evident, which confirmed that this metal was abundant in the precipitates.
DISCUSSION
Metal binding and the subsequent fine-grained mineral development on bacterial surfaces are complex issues. Bacteria have many ionizable groups on their surfaces, and metal ions can have complex reactivities; all such chemical interactions are influenced by pH, redox potential, environmental electrolytes, and cell gradients. In this study we attempted to simplify environmental factors by suspending bacteria in single-metal solutions. The metals were chosen because of their binding and precipitation characteristics; iron forms amorphous hydrated precipitates, lanthanum forms more anhydrous microcrystals, and gold forms metallic colloids (3). Copper does not form surface precipitates in our system. Because P. aeruginosa PAO1 had two separate types of LPS on its surface (28) and because we had isogenic LPS mutants (17), we could control LPS expression, thereby altering the surface charge in order to establish how this charge influences metal binding and precipitation.
Because copper did not form precipitates, the amount of copper taken up by the cells was small. The lack of abiotic chemical precipitation by the acellular controls indicated that copper ions were removed from solution only when bacterial cells were added to the system. However, analysis of the atomic absorption data revealed that there were no significant differences in the amounts of copper bound by the strains (Table 2). In addition, all of the copper-treated cells appeared to be similar in thin section; the metal apparently bound to the cell surface, which resulted in slight increases in electron density. These findings were at first surprising. Intuitively, we hypothesized that either strain PAO1 (A+ B+) or strain dps89 (A− B+) would bind more copper, since these strains have more negatively charged sites in their outer membranes (as a result of the B-band LPS). Since this was not the case (the B− strains bound equal amounts of copper), it is probable that the O-side chains did not affect the extent of copper binding. Perhaps the copper was preferentially bound by other sites (such as phosphoryl groups) within the core-lipid A regions of the LPS (which are common to all strains), while sites within the B-band O-side chain were thermodynamically unfavorable for binding.
However, our findings suggest that the explanations for the remaining three metals examined are somewhat different. Atomic absorption data clearly indicated that three of the four strains (PAO1 [A+ B+], AK1401 [A+ B−], and rd7513 [A− B−]) bound equal amounts of iron. This finding was supported by the fact that these three strains appeared to be similar to each other when thin sections were examined; the cell surfaces exhibited increased electron density compared to the respective controls (Fig. 4). The increased iron EDS signals of the electron-dense areas confirmed that the sites where iron binding occurred were limited to the cell surfaces. Since these findings were obtained for three of the four strains and since the ligand affinity of the Fe3+ ion is greatest for phosphate and polyphosphate groups (8), it seemed reasonable to suggest that the major binding sites were common to all of the cells tested and that these sites might be the phosphoryl groups of the core-lipid A molecules in the LPS.
However, the iron binding of the fourth strain, dps89 (A− B+), was significantly greater (approximately 1.5 times greater) than the iron binding of the other strains. This was apparent as iron treatment caused the cells to clump together and take on a yellow-orange color. The initial pH values of the iron stock solutions were typically ∼3. At these values, the predominant precipitate formed would be an insoluble, amorphous (hydrated) iron hydroxide, Fe(OH)3 (8). Once cells were added, the pH increased, and the production of precipitates by dps89 (A− B+) cells was clearly revealed by TEM. (An increase in pH also occurred in the other metal systems once the cells were added.) Most dps89 cells were surrounded by precipitates which produced significant iron signals when the preparations were analyzed by EDS. In addition, these precipitates did not diffract the electron beam, suggesting that they had an amorphous structure. We propose that the precipitates observed on the surfaces of dps89 were indeed iron hydroxide. Since oxygen and hydrogen are light elements which only produce low-energy X-rays (less than 200 eV), only the iron portion of the precipitate would be expected to produce an easily discernible EDS signal. Indeed, the precipitates produced clustered low-electron-volt spectra, as expected for low-atomic-number elements, such as H and O (Fig. 5). Therefore, the observed clumping of cells may have been due to iron hydroxide precipitates which cross-linked or entrapped neighboring cells, causing them to floc and sediment, like iron-treated cell walls of Bacillus subtilis (25).
Interestingly, peaks corresponding to silicon were also sometimes observed in the EDS spectra. The source of the silicon was probably the glassware in which the cells were grown. It is likely that if present, silicate ions (SiO32−), like OH− ions, are incorporated into an iron precipitate as it grows. Iron precipitates are especially efficient at this incorporation, and Urrutia and Beveridge (31, 32) have found that silicon can be deposited on cell surfaces through amine ion bridging, in which a multivalent metal ion (such as iron) cross-links silicate anions to carboxylate or phosphate groups on the cell surface via electrostatic interaction. This is presumably the mechanism by which silicon was incorporated into the iron precipitates generated in the present study.
One of the four strains, AK1401 (A+ B−), bound more lanthanum than the other three strains bound. However, in general, lanthanum appeared to bind to the cell surface of each strain, while in the case of dsp89 (A− B+) it appeared that lanthanum was also incorporated into the cytoplasm, which caused the cells to look electron dense, as though they had been conventionally prepared for TEM. This is not entirely surprising, since lanthanum has been used in the past as a TEM stain to provide electron density, particularly for nucleic acids (13). It is likely that this internal binding contributed to the significant increase in the amount of lanthanum detected by inductively coupled plasma-mass spectrometry in this strain compared to strains PAO1 (A+ B+) and rd7513 (A− B−), which bound equal amounts of lanthanum (Table 5) but did not exhibit internal binding (Fig. 8).
Lanthanum binding progressed further with strain AK1401 cells (A+ B−) than with other cells, to the point where cell-associated, lanthanum-rich crystals were observed. These precipitates studded the cell surface and were not present in the cytoplasm. Perhaps binding of lanthanum lowers the free energy required for precipitation of the metal at available sites, promoting growth of the elongated lanthanum crystals. This continued deposition of more and more metal probably accounted for the very large increase in lanthanum binding by strain AK1401 (A+ B−).
Gold was particularly interesting. All strains bound gold intracellularly as colloidal precipitates, a finding which has not been reported previously for gram-negative organisms. EDS of the precipitates generated gold peaks. The electron diffraction pattern generated by these precipitates indicated that they had a highly ordered (crystalline) structure with a lattice d-spacing value of 2.43 Å, which is close to the previously established d-spacing value for elemental gold, 2.36 Å (16). We propose that the Au3+ ions in this system diffuse into the cytoplasm, where they are rapidly reduced to Au0. This rapid reduction produces crystal nuclei, whose sizes eventually exceed the critical size required for the crystals to remain stable (22). More ions are then deposited preferentially onto the growing crystal instead of at other sites. Therefore, any gold which bound to cell surface sites may have been dissociated in order to feed the growing crystals within the cells. This process of crystal growth may explain the lack of surface-associated gold precipitates.
When the results of this study are taken together, several points seem particularly interesting and unexpected. First, the B+ strains (PAO1 and dps89) did not always bind the most metal. As stated previously, we believed that the presence of negatively charged carboxyl sites on the B-band LPS O-side chain would provide a greater potential for metal binding than would sites on the O-side chains of A-band LPS. However, this was not the case. Strain PAO1 (A+ B+) was the least efficient strain at binding the metals tested and always bound the same amount of metal as strain rd7513 (A− B−). Makin and Beveridge (24) have proposed that the main surface-charge-determining groups reside within the core-lipid A regions and may be shielded by the long B-band LPS O-side chains. As a result, the relative cell surface electronegativities of the four strains are actually as follows: rd7513 (A− B−) > AK1401 (A+ B−) > dps89 (A− B+) > PAO1 (A+ B+). If metal binding were a simple function of surface electronegativity, this order would certainly explain why strain PAO1 (A+ B+) did not bind the most metal. However, it would not explain why strain rd7513 (A− B−) always bound the same amount of each metal as strain PAO1 (A+ B+) bound and why the two intermediate strains, AK1401 (A+ B−) and dps89 (A− B+), bound significantly more lanthanum and iron, respectively.
It is tempting to speculate that perhaps the amounts of a metal bound by PAO1 (A+ B+) and rd7513 (A− B−) represent the saturating (or baseline) amounts of the metal which the cells bind prior to precipitation of the metal (since these amounts were always equal and were the lowest of the four strains). Consider the fact that copper has been shown to bind to cells in a stoichiometric manner but not to precipitate (26). This may explain why all of the strains bound the same amount of copper. However, for the other metals, significant differences in binding (greater than the amounts bound by PAO1 and rd7513) were observed. The differences were probably due to the fact that the metals did not just bind stoichiometrically (like copper) but also precipitated. The differences would then have depended on whether a precipitate was formed.
One factor to consider in the promotion of precipitate formation is the relative cell surface hydrophobicity. Makin and Beveridge (24) have reported that the order of relative cell surface hydrophobicity is as follows: AK1401 (A+ B−) > PAO1 (A+ B+) > rd7513 (A− B−) > dps89 (A− B+). This order is particularly interesting when it is combined with the metal-binding affinities and the properties of the different precipitates. In the case of iron, the order of binding by the strains was as follows: dps89 (A− B+) > PAO1 (A+ B+) = rd7513 (A− B−) = AK1401 (A+ B−). Conversely, for lanthanum, the order was AK1401 (A+ B−) > dps89 (A− B+) > PAO1 (A+ B+) = rd7513 (A− B−). Iron precipitates are typically very hydrated (particularly early in their development) and contain reactive charged groups. In contrast, crystals (such as the lanthanum crystals in this study) are highly ordered, less charged, and anhydrous. It is possible that once mineral nucleation has occurred, formation of a highly hydrated precipitate (such as the iron precipitates) is favored on a more hydrophilic surface, while formation of the more anhydrous, less charged lanthanum crystals is favored on a more hydrophobic surface. This would explain why particular precipitates were observed only on certain types of cells. It might also explain why strains PAO1 (A+ B+) and rd7513 (A− B−) bound equal amounts of metal, since their relative surface hydrophobicities are actually more similar to each other than to the relative surface hydrophobicities of the other two strains (24).
In summary, we propose that the negatively charged phosphoryl groups in the core-lipid A region of the LPS (which are common to all four strains) are the most important sites involved in metal binding by P. aeruginosa. Although the O-side chain of B-band LPS does provide a large number of negatively charged carboxyl sites to the surfaces of B+ strains, it appears that these sites do not contribute directly to metal binding as much as we hypothesized previously. Instead, the specific combination of A-band LPS and B-band LPS, which appears to govern (at least in part) the relative cell surface hydrophobicities of the strains (24), may contribute to metal binding more by promoting the formation of metal precipitates with specific physicochemical properties than by simply providing reactive sites to which metal ions can bind.
ACKNOWLEDGMENTS
This work was supported by a Natural Sciences and Engineering Research Council of Canada (NSERC) grant to T.J.B. The electron microscopy was performed at the Guelph Regional NSERC STEM facility, which is partially supported by a NSERC Major Facilities Access grant to T.J.B.
We thank Bob Harris and Dianne Moyles for their invaluable technical assistance and J. S. Lam for providing the isogenic mutants and monoclonal antibodies.
REFERENCES
- 1.Arsenault T L, Hughes D W, MacLean D B, Szarek W A, Kropinski A M B, Lam J S. Structural studies on the polysaccharide portion of “A-band” lipopolysaccharide from a mutant (AK1401) of Pseudomonas aeruginosa strain PAO1. Can J Chem. 1991;69:1273–1280. [Google Scholar]
- 2.Berry D, Kropinski A M. Effect of lipopolysaccharide mutations and temperature on plasmid transformation efficiency in Pseudomonas aeruginosa. Can J Microbiol. 1986;32:436–438. doi: 10.1139/m86-082. [DOI] [PubMed] [Google Scholar]
- 3.Beveridge T J, Murray R G E. Uptake and retention of metals by cell walls of Bacillus subtilis. J Bacteriol. 1976;127:1502–1518. doi: 10.1128/jb.127.3.1502-1518.1976. [DOI] [PMC free article] [PubMed] [Google Scholar]
- 4.Beveridge T J, Murray R G E. Sites of metal deposition in the cell wall of Bacillus subtilis. J Bacteriol. 1980;141:876–887. doi: 10.1128/jb.141.2.876-887.1980. [DOI] [PMC free article] [PubMed] [Google Scholar]
- 5.Beveridge T J, Koval S F. Binding of metals to cell envelopes of Escherichia coli K-12. Appl Environ Microbiol. 1981;42:325–335. doi: 10.1128/aem.42.2.325-335.1981. [DOI] [PMC free article] [PubMed] [Google Scholar]
- 6.Beveridge T J, Forsberg C W, Doyle R J. Major sites of metal binding in Bacillus licheniformis walls. J Bacteriol. 1982;150:1438–1448. doi: 10.1128/jb.150.3.1438-1448.1982. [DOI] [PMC free article] [PubMed] [Google Scholar]
- 7.Beveridge T J. Role of cellular design in bacterial metal accumulation and mineralization. Annu Rev Microbiol. 1989;43:147–171. doi: 10.1146/annurev.mi.43.100189.001051. [DOI] [PubMed] [Google Scholar]
- 8.Cotton F A, Wilkinson G. Advanced inorganic chemistry. A comprehensive text. 4th ed. New York, N.Y: John Wiley and Sons, Inc.; 1980. [Google Scholar]
- 9.Doyle R J, Matthews T H, Streips U N. Chemical basis for selectivity of metal ions by the Bacillus subtilis cell wall. J Bacteriol. 1980;143:471–480. doi: 10.1128/jb.143.1.471-480.1980. [DOI] [PMC free article] [PubMed] [Google Scholar]
- 10.Ferris F G, Beveridge T J. Binding of a paramagnetic metal cation to Escherichia coli K-12 outer membrane vesicles. FEMS Microbiol Lett. 1984;24:43–46. [Google Scholar]
- 11.Ferris F G, Beveridge T J. Site specificity of metallic ion binding in Escherichia coli K-12 lipopolysaccharide. Can J Microbiol. 1986;32:52–55. doi: 10.1139/m86-010. [DOI] [PubMed] [Google Scholar]
- 12.Glauner B, Höltje J-V, Schwarz U. The composition of the murein of Escherichia coli. J Biol Chem. 1988;263:10088–10095. [PubMed] [Google Scholar]
- 13.Hayat M A. Positive staining for electron microscopy. New York, N.Y: Van Nostrand Reinhold Ltd.; 1975. Introduction; pp. 1–8. [Google Scholar]
- 14.Hitchcock P J, Brown T M. Morphological heterogeneity among Salmonella lipopolysaccharide chemotypes in silver-stained polyacrylamide gels. J Bacteriol. 1983;154:269–277. doi: 10.1128/jb.154.1.269-277.1983. [DOI] [PMC free article] [PubMed] [Google Scholar]
- 15.Hughes M N, Poole R K. Metals and micro-organisms. London, United Kingdom: Chapman and Hall; 1989. pp. 9–17. [Google Scholar]
- 16.JCPDS International Centre for Diffraction Data. Mineral powder diffraction file. Washington, D.C: JCPDS International Center for Diffraction Data; 1986. p. 436. [Google Scholar]
- 17.Kadurugamuwa J L, Lam J S, Beveridge T J. Interaction of gentamicin with the A band and B band lipopolysaccharides of Pseudomonas aeruginosa and its possible lethal effect. Antimicrob Agents Chemother. 1993;37:715–721. doi: 10.1128/aac.37.4.715. [DOI] [PMC free article] [PubMed] [Google Scholar]
- 18.Knirel Y A. Polysaccharide antigens of Pseudomonas aeruginosa. Crit Rev Microbiol. 1990;17:273–304. doi: 10.3109/10408419009105729. [DOI] [PubMed] [Google Scholar]
- 19.Lam J S, MacDonald L A, Lam M Y C, Duchesne L G M, Southam G G. Production and characterization of monoclonal antibodies against serotype strains of Pseudomonas aeruginosa. Infect Immun. 1987;55:1051–1057. doi: 10.1128/iai.55.5.1051-1057.1987. [DOI] [PMC free article] [PubMed] [Google Scholar]
- 20.Lam J S, Graham L L, Lightfoot J, Dasgupta T, Beveridge T J. Ultrastructural examination of the lipopolysaccharides of Pseudomonas aeruginosa strains and their isogenic rough mutants by freeze-substitution. J Bacteriol. 1992;174:7159–7167. doi: 10.1128/jb.174.22.7159-7167.1992. [DOI] [PMC free article] [PubMed] [Google Scholar]
- 21.Lam M Y C, McGroarty E J, Kropinski A M, MacDonald L A, Pedersen S S, Høiby N, Lam J S. Occurrence of a common lipopolysaccharide antigen in standard and clinical strains of Pseudomonas aeruginosa. J Clin Microbiol. 1989;27:962–967. doi: 10.1128/jcm.27.5.962-967.1989. [DOI] [PMC free article] [PubMed] [Google Scholar]
- 22.Lewis B. Nucleation and growth theory. In: Pamplin B, editor. Crystal growth. 2nd ed. New York, N.Y: Pergamon Press Ltd.; 1980. pp. 23–64. [Google Scholar]
- 23.Lightfoot J, Lam J S. Molecular cloning of genes involved with expression of A-band lipopolysaccharide, an antigenically conserved form, in Pseudomonas aeruginosa. J Bacteriol. 1991;173:5624–5630. doi: 10.1128/jb.173.18.5624-5630.1991. [DOI] [PMC free article] [PubMed] [Google Scholar]
- 24.Makin S A, Beveridge T J. The influence of A-band and B-band lipopolysaccharide on the surface characteristics and adhesion of Pseudomonas aeruginosa to surfaces. Microbiology. 1996;142:299–307. doi: 10.1099/13500872-142-2-299. [DOI] [PubMed] [Google Scholar]
- 25.Mayers I T, Beveridge T J. The sorption of metals to Bacillus subtilis walls from dilute solutions and simulated Hamilton Harbour (Lake Ontario) water. Can J Microbiol. 1989;35:764–770. [Google Scholar]
- 26.Mullen M D, Wolf D C, Ferris F G, Beveridge T J, Flemming C A, Bailey G W. Bacterial sorption of heavy metals. Appl Environ Microbiol. 1989;55:3143–3149. doi: 10.1128/aem.55.12.3143-3149.1989. [DOI] [PMC free article] [PubMed] [Google Scholar]
- 27.Perkin-Elmer Corporation. The guide to techniques and applications of atomic spectroscopy. Norwalk, Conn: The Perkin-Elmer Corporation; 1995. Atomic spectroscopy detection limits; pp. 4–5. [Google Scholar]
- 28.Rivera M, Bryan L E, Hancock R W E, McGroarty E J. Heterogeneity of lipopolysaccharides from Pseudomonas aeruginosa: analysis of lipopolysaccharide chain length. J Bacteriol. 1988;170:512–521. doi: 10.1128/jb.170.2.512-521.1988. [DOI] [PMC free article] [PubMed] [Google Scholar]
- 29.Strain S M, Fesik S W, Armitage I M. Structure and metal-binding properties of lipopolysaccharide from heptoseless mutants of Escherichia coli studied by 13C and 31P nuclear magnetic resonance. J Biol Chem. 1983;258:13466–13477. [PubMed] [Google Scholar]
- 30.Towbin H, Staehelin T, Gordon J. Electrophoretic transfer of proteins from polyacrylamide gels to nitrocellulose sheets: procedure and some applications. Proc Natl Acad Sci USA. 1979;76:4350–4354. doi: 10.1073/pnas.76.9.4350. [DOI] [PMC free article] [PubMed] [Google Scholar]
- 31.Urrutia M M, Beveridge T J. Mechanism of silicate binding to the bacterial cell wall in Bacillus subtilis. J Bacteriol. 1993;175:1936–1945. doi: 10.1128/jb.175.7.1936-1945.1993. [DOI] [PMC free article] [PubMed] [Google Scholar]
- 32.Urrutia M M, Beveridge T J. Formation of fine-grained silicate minerals and metal precipitates by a bacterial cell surface (Bacillus subtilis) and the implications in the global cycling of silicon. Chem Geol. 1994;116:261–280. [Google Scholar]


