

Abstract
Studies have shown that spatial attention remarkably affects the trial-to-trial response variability shared between neurons. Difficulty in the attentional task adjusts how much concentration we maintain on what is currently important and what is filtered as irrelevant sensory information. However, how task difficulty mediates the interactions between neurons with separated receptive fields (RFs) that are attended to or attended away is still not clear. We examined spike count correlations between single-unit activities recorded simultaneously in the primary visual cortex (V1) while monkeys performed a spatial attention task with two levels of difficulty. Moreover, the RFs of the two neurons recorded were non-overlapping to allow us to study fluctuations in the correlated responses between competing visual inputs when the focus of attention was allocated to the RF of one neuron. While increasing difficulty in the spatial attention task, spike count correlations were either decreased to become negative between neuronal pairs, implying competition among them, with one neuron (or none) exhibiting attentional enhancement of firing rate, or increased to become positive, suggesting inter-neuronal cooperation, with one of the pair showing attentional suppression of spiking responses. Besides, the modulation of spike count correlations by task difficulty was independent of the attended locations. These findings provide evidence that task difficulty affects the functional interactions between different neuronal pools in V1 when selective attention resolves the spatial competition.
Keywords: Rhesus monkey, Spatial attention, Shared variability, Attentional load, Primary visual cortex
Introduction
In recent years, fluctuations between the spiking of pairs of neurons, which reflects shared trial-to-trial variability (also termed spike count correlations or rsc), have been used to study the neuronal mechanisms underlying the processes of several cognitive modalities. Studies have shown that such neuronal correlations can be applied to infer functional connectivity [1–3] and computations of neuronal networks [4–6]. With the advent of multi-electrode recording during the past decade, studies have demonstrated that the pattern of correlation changes can provide more signatures for exploration of the neural mechanisms underlying the processing of various forms of cortical information [7–10] and more constraints to improve theoretical models [11–15], which are difficult to interpret from the responses of individual cortical neurons.
Attentional modulation of firing rate, coherence, and spike count correlations has been revealed at the single-neuron and population levels in many visual areas [16–20]. Earlier studies have shown that attention-related reductions in correlations may remarkably influence the signal-to-noise ratio of population-coding information, which could be attributed to suppression of the correlated noise among spiking responses of visual cortical neurons [20–22]. Reported correlations are typically small and positive, measured from pairs of neighboring neurons with overlapping receptive fields (RFs) which could be considered to be from the same neuronal pool. On the contrary, pairs of neurons with non-overlapping RFs could be considered to be from different pools, which derive negative spike-count correlations. Recent studies in the dorsolateral prefrontal cortex and frontal eye field (FEF) do report findings that negative correlations occur among these neuronal pairs and increase as a function of interneuron distance [23, 24]. These findings suggest that eye-movement-related neurons in micro-columns far apart mainly interact through inhibitory connections. These may play an important role in the allocation of spatial attention and underlie the competitive interactions between neurons containing dissimilar neural representations in visual cortices. According to biased competition theory, one of the influential conceptual frameworks to describe the neural basis of selective visuo-spatial attention [25], selective attention resolves neural competition between the target and distractors with converging evidence from electrophysiology and fMRI studies in visual areas V2 and V4 [26]. The RFs in the primary visual cortex (V1) are too small to directly test the competing effects by placing both target and distractor within them. The neural competition in V1 may be implemented in the negatively-correlated spiking responses between different local populations, which could be biased by spatial attention, but there are still insufficient experimental data to support this hypothesis.
With the manipulation of task difficulty, the effect of attentional enhancement on neuronal activity [27–29], BOLD responses [30], and cognitive behaviors [31] becomes more prominent. However, how it affects the interneuronal correlations between pairs of V1 neurons with non-overlapping RFs driven by competing stimuli remains unknown. The effects on spike count correlations by increasing task difficulty might always be decreased, mediated by a common mechanism, or might be different depending on the attentional modulation of the neuronal pairs.
We simultaneously recorded from well-isolated V1 neurons with non-overlapping RFs, while the monkeys accomplished a spatial attention task under different levels of task difficulty. We found that spike count correlations between neuronal pairs were either decreased to become negative while one of the neurons exhibited attentional enhancement of firing rate, or increased to become positive between pairs with one neuron showing attentional suppression of spiking responses. Our results indicate that whether the interactions between two V1 neurons, holding representations of target and distractor, cooperate or compete with each other depending on the attentional modulation of the neuron’s firing rate. Moreover, functional interactions among V1 neurons from different pools during selective spatial attention were modulated by task difficulty.
Materials and Methods
Experimental Procedures and Surgery
Extracellular recordings were obtained from 2 hemispheres of 2 adult male monkeys (Macaca mulatta; monkey P: 7.5 kg, right hemisphere; monkey S: 9 kg, left hemisphere). Before behavioral training, each animal was implanted with a titanium head post and a scleral eye coil for monitoring eye position by an eye-tracking device (1000 samples/s, ScleraTrak 4000, Crist Instrument Co., Inc., Hagerstown, USA). After the animals learned the task (~6 months), a titanium chamber for holding the microdrive system (Gray Matter Research, Bozeman, USA) with 32 channels of electrodes was implanted above the dura of area V1 in one cerebral hemisphere. We identified area V1 by using stereotaxic coordinates, which were close to the midline (monkey P, right: 15 mm, posterior interaural: 20 mm; monkey S, left: 15 mm, posterior interaural: 20 mm).
The animals were sedated with ketamine (15 mg/kg, intramuscular), and they were given a prophylactic dose of antibiotic (Benzyl penicillin, 5 mg/kg, intramuscular) for intraoperative infection and atropine (0.05 mg/kg, intramuscular) to reduce salivation. Anesthesia was maintained with 2%–3% isoflurane. Antibiotic was administered again 1.5 h after surgery; cephalosporin was given for 5 days postoperatively. All animal surgeries and experimental procedures were compliant with the NIH guidance for the Care and Use of Laboratory Animals and were approved by the Institutional Animal Care and Use Committee of Shanghai Jiao Tong University.
Electrophysiological Recordings
We recorded extracellular neuronal activity from a recording system with 32 electrodes (Gray Matter Research; impedances: 0.3–1.5 MΩ at 1 kHz; 1.6 cm travel length; 1.5 mm between adjacent electrodes) during daily experimental sessions for a few months in each animal. Each electrode was independently controlled by a precision lead screw with 125 µm/turn resolution. Signals collected from each electrode were filtered through a bandpass (300 Hz to 4 kHz). Waveform segments over a threshold were digitized at 40 kHz.
The microdrive system was firmly fixed within the chamber, and the back-ends of electrodes were linked to a connector that allowed simultaneous recording. In a daily experimental session, we adjusted the depth of several electrodes to obtain well-isolated firing activities. Then neuronal responses recorded from these electrodes were evoked by a sequence of Hartley stimuli and spike-triggered averages (STAs) were calculated offline using subspace reverse correlation analysis to map the RF [32]. Whenever the electrode recorded a spike, a stimulus frame presented before the spike was added to the STA, and was later divided by the total number of spikes. If neuronal activity was not related to a stimulus frame, the STA would appear flat and close to zero. Five frames of STAs were traced from −16 ms to −80 ms before the spike, and the frame that exhibited the strongest response was selected. As shown in Fig. 4A–C (lower left panels), red regions show that increases in light at those locations caused the firing rate of the neuron to increase, and blue regions represent areas of the RF where increases in light caused the firing rate of the neuron to decrease. External contour lines were drawn (90%, 70%, 50%, and 30% of maximum response). To measure the extent of the RF, we fitted the RF with a two-dimensional Gabor, which contained the product of a sinusoid with a Gaussian envelope. The length (σy) and width (σx) of the Gaussian envelope determined the RF extent. The total RF extent was estimated as ~4σ along each dimension [33], and we chose the larger value between 4σx and 4σy to be the effective extent of the RF.
Fig. 4.

Responses of three neurons with different effects of attentional modulation (not measured in the same session). A Upper left panel, average waveform of a neuron (dark gray) and the noise (light gray) simultaneously recorded from the same electrode (shading, ±2 median absolute deviations). Lower left panel, the RF of the neuron. Middle panel, PSTHs of an E neuron spiking response when attention is directed to its RF (red solid line; EattN) and to the not significantly modulated neuron (red dashed line; ENatt) during the hard task. Right panel, E neuron spiking responses when attending to its RF (solid blue line) and to the not significantly modulated one (dashed blue line) during the easy task. The bar plots on the lower right corner of the PSTHs show the average firing rate. The responses shown occurred 600 ms before the color change, which included the last cycle of the drifting grating. B, C Examples of an S and an N neuron with the same configurations as in A. The contours of the mapped RFs are scaled to the responses of the excitation sub-region (+, light red) and inhibition (−, light blue) sub-region for each neuron. Scale bars, 1°. Error bars represent ±SEM. *P <0.05, paired t-test.
The monkeys then performed a fixation task in which did not need to attend to either stimulus and received a reward if they kept staring at the fixation point within a 1.5° circular fixation window for 2500 ms. A pair of identical sinusoidal gratings with 8 different directions of movement uniformly spanning 360° covered the RFs of the recorded neurons. We measured the responses to all directions for the direction-selectivity of each unit. To study the attentional modulation of a neuronal response, the direction of drift of each grating was chosen from the 8 directions as the one that evoked the highest firing rate. Occasionally, if suppression caused by flanking orthogonal stimuli was observed during the recording session, these neurons were abandoned.
Our results were from recording sessions in which the animal achieved correct performance of at least 60% during the hard task and at least 80% during the easy task. Data presented here were from 77 recording sessions (monkey P: 40; monkey S: 37). Spike waveforms were sorted offline using spike-sorting software (Offline Sorter, Plexon Inc., Dallas, USA). To quantify the recording quality of the isolated single-unit activity, the waveform shape signal-to-noise ratios (SNRs) and the amplitude signal-to-noise ratios (SNRa) were computed. The SNRs is the ratio of the amplitude of the averaged waveform to the SD of waveform noise:
where is the averaged waveform, is the SD of all entries in . and is the matrix of deviations from the mean waveform as follows:
where is the collection of waveforms with samples.
SNRa is computed as the ratio of the amplitude of the averaged spike waveform to that of the noise as follows:
Neurons were included for further analysis only if their spike waveforms formed well-isolated clusters, had <0.2% short inter-spike-interval (ISI <1 ms) violations in the ISI distributions, SNRs >2.4 and SNRa >1.2.
The averaged horizontal distance between the two electrodes recording from a pair of neurons was 6.22 mm (minimum, 3.35 mm; maximum, 7.50 mm). Rarely, suppression caused by flanking orthogonal stimuli was found, and these neurons (n = 3) were omitted from our data sets. We selected 88 pairs from a total of 169 neurons (18 were analyzed twice in more than one pair) for further analysis. The centers of RFs were in the lower-left quadrant at an average eccentricity of 5.7° for monkey P and in the lower-right quadrant at an average eccentricity of 5° for monkey S.
Visual Stimuli
Stimuli were presented on a liquid crystal display (AOC, Inc., Wuhan, China) with a 120-Hz frame rate and resolution of 1920 × 1080 pixels. Monkeys were seated 57 cm from the screen. For RF mapping, we used custom software (written in MATLAB using Psychtoolbox-3, http://psychtoolbox.org/; MATLAB, MathWorks Inc., Natick, USA) to display the Hartley stimuli [33], which were sequences of static gratings (1.35° × 1.35°) differing in orientation and spatial frequency and could be extended to larger size by a scale factor. For the spatial attention task, we used custom software (written in MATLAB using the NIMH MonkeyLogic 2 Toolbox, https://monkeylogic.nimh.nih.gov/) to present sinusoidal gratings drifting in the neuron’s preferred direction (temporal frequency, 2 cycles/s; spatial frequency, 0.5 cycles/degree; contrast, 90%), execute all of our paradigms, and monitor the animals’ behavior.
In each session, task difficulty was manipulated by varying the saliency of the color change, defined as the value of the red channel (8-bit RGB format, range: 8–100), so that the changed color could be either hard or easy to detect. The animals were required to perform the task in blocks with difficulty swapping between easy and hard. The changed color was always at the trough of the grating with the luminance at the peak of the grating kept constant at 178 cd/m2. The initial numbers of red value for easy and hard task were set according to the performance curves of each animal. The value of the red channel was chosen in the 8–15 range for the hard task and 80–100 for the easy task for each daily session. The current accuracy of two tasks was calculated and displayed on the control screen during a recording session. The red value was adjusted in a small range (±5) to maintain a stable performance (accuracy: easy, >80%; hard, >70%) so that the animals could tell the difference between the hard and easy tasks and put more effort into the hard task. The color change at the trough of the grating could be very subtle and the extent of change depended on the subject’s training experience and day-to-day variability.
Spatial Attention Task
We trained monkeys to perform a visual detection task in which spatial attention was manipulated. The trial started when the monkey fixated on a small spot in a virtual 1.6°–2.0° circular fixation window in the center of the screen for 100 ms. A buzz was given as an indicator for the monkey to prepare stable fixation to the spot. Then a thin red ring appeared for 400 ms as a cue to indicate the spatial location to be attended; its diameter was 3° and nearly 2–3 times larger than that of the neuronal RF. After the cue vanished, gratings were presented at four different locations with identical eccentricity. Following a uniformly randomized viewing period (1500, 2000, or 2500 ms), the grating at the cued location changed color. A trial was aborted as soon as the monkeys’ fixation position deviated by >0.5° at any time during the trial. The monkey was rewarded for making a quick saccade to the target within 500 ms and maintaining fixation within another 3° circular window up to 300 ms. The cue was kept at the same spatial location for at least 20 trials, then another location was cued.
The amount of reward was decided by the reaction time and viewing period according to the following piecewise linear equation:
where V is the volume of reward juice in mL, Ta is the adjusted time in ms according to the viewing period (Ta = 850, 900, or 950 ms), Tr is the reaction time in ms, and J is the delivery speed of the juice pump (0.5 × 10⁻³ mL/ms).
In each trial, three stimuli appeared at different locations in the contralateral hemifield (positions Up, Middle, and Down in Fig. 1A). The fourth stimulus was in the ipsilateral hemifield (position Opposite in Fig. 1A). All four stimuli were equidistant from the fixation point, and the positions Up and Down were also equidistant from the position Middle. The RF of each unit of a neuronal pair was fully covered by either the Middle or Down stimulus. Once the directions of 2 stimuli that drove the neurons strongly were selected, the directions of the other two stimuli (Up and Opposite) were chosen to be either the same if the best directions of the recorded pair matched, or randomly selected and different from one another if not. Drifting gratings (at least 3° between their centers, diameter: 2.4°–2.6°) were presented to separately cover the non-overlapping RFs of recorded V1 neurons. Animals were required to detect a subtle or obvious color change of the target, which appeared with equal probability at four locations of the presented stimuli during a task. The monkey was rewarded with a few drops of juice for successfully making a saccade to the target stimulus within 500 ms after its appearance.
Fig. 1.

Behavioral task. A The color change detection task. Two rhesus monkeys were trained to fixate on a small white spot within a 1.6° window at the beginning each trial. After 100 ms of stable fixation, a thin red ring was displayed for 400 ms as the cue, which was the spatial location the monkeys should attend to covertly. Four sine gratings appeared simultaneously at different positions (Up, Middle, Down, and Opposite) with the preferred drifting directions. Each of the RFs of a pair of neurons recorded was covered by the stimulus at the positions Middle and Down, respectively. Following a uniformly randomized period of time (1.5–2.5 s), the color of the target grating at the cued location changed (either easy or hard to detect), and the animals were rewarded for success in detecting the color change and making a quick saccade to the target within 500 ms. B Performance curves across training sessions for both monkeys. Each point represents the average proportion of correct detections (based on daily sessions: n = 16, Monkey P: squares; n = 16, Monkey S: triangles) as a function of the red channel value (RGB format) of the target stimulus. Solid gray lines indicate curves fitted by the logistic function. The proportion correct at an equal value of the red channel (Monkey S, n = 3, Valid: 0.50; Invalid: 0.32) in test experiments in which color change occurred at the cued (circle) or non-cued (ring) position. The nature of task difficulty manipulation is illustrated by the pictograms below the horizontal axis, but not the actual color level used during the training and recording sessions.
Data Analysis
We included data only from correct response trials and excluded those with errors including no fixation, fixation break, early response (made a saccade before color change), incorrect response (made a saccade to the wrong target), and target break (managed to make a saccade to the target but failed to maintain fixation for 300 ms). Neuronal activity was analyzed for experimental sessions in which monkeys completed at least 20 correct trials for each attention condition (minimum of 160 correct trials total, averaged across 32 trials per condition).
In the data set, we studied 169 neurons under different attention conditions and task difficulties from two monkeys (monkey P: 80; monkey S: 89). We quantified the effect of attentional modulation on spiking responses during easy and hard tasks as follows. First, the response in a 500-ms time window preceding the color change was calculated by the peristimulus time histogram (PSTH) (10 ms bin, the last complete cycle of the drifting grating; Fig. 1A) and fitted with a Gaussian function. The general Gaussian model used for curve fitting is given by:
where is the amplitude, is the centroid, is the peak width, is the minimum number of terms to fit (1 ≤ ≤ 8) as long as the goodness of fit (R2) reaches 0.95.
The time interval at which the Gaussian was half its maximum amplitude was determined. Because the width varied across cells, the mean count of the PSTH bins included in this interval was used as the visual response recorded under each level of task difficulty and attended location. This statistical procedure was strict and appropriate to measure the attentional modulations and reduce the statistical error compared with using a fixed time window, which would generate an inaccurate number of significantly modulated neurons [28]. The method applied was suitable not only for perfect simple cells but also for complex cells, since their firing rates were also modulated by drifting gratings. We analyzed the response linearity (F1/F0) of the recorded cells. Simple neurons were defined as F1/F0 >1 while complex neurons were defined as F1/F0 <1 [34].
To quantify the effect of attentional modulation on neuronal firing rates, we calculated the attentional ratio of firing rate (ARFR): (I − O)/(I + O), where I represents average firing rate while the focus of attention was inside the RF, and O represents the mean spike count while the focus of attention was outside its RF, directed to the RF of the other neuron in the pair. We then calculated the multiplicative attentional ratio of firing rate (MARFR = ARFR1 × ARFR2) of the pairs, to explore whether the sign of attentional modulation (enhanced or suppressed) on each neuron’s firing rate influenced their spike count correlation.
Spike count correlations were calculated as the Pearson’s correlation coefficient of the spiking responses from a pair of neurons to repeated presentations of the same stimuli. We determined the spike counts during 1 s before the color change as the spiking response of a neuron in each trial. For each stimulus condition during easy and hard tasks, spiking responses from each unit were transformed into z-scores (the normalized ratio of deviation from the mean/SD). Since the spike count correlations were sensitive to outliers, data points >3 SD were removed [35, 36].
Statistical Analysis
Unless stated otherwise, data are presented as the mean ± SEM. One-sample and paired t-tests were used to test that for significant spiking response differences between easy and hard tasks with respect to: proportion correct, reaction time, and spike count correlations in different conditions of attention. The two-tailed Student’s t-test was applied to test for significant differences in attentional ratios with increasing task difficulty. The Wilcoxon test was applied to test significant attentional modulation of neuronal firing rates before color change. The Mann–Whitney test was used to test for differences in neurons’ attentional modulation between the easy and hard tasks. The χ2-test was used to compare the number of attention-modulated neurons between the easy and hard tasks. Pearson’s correlation coefficient was computed to estimate the correlations between spike counts of neuronal pairs. P <0.05 was considered to be a statistically significant difference.
Results
We simultaneously recorded pairs of well-isolated V1 neurons from two rhesus monkeys as they performed a color-change detection task. Single-unit activities were recorded by using an implantable microdrive system with 32 electrodes, each of which was capable of independent bidirectional control. The design of the system allowed us to improve the stability of the recording and the isolation of neuronal activity from noise. We were able to carefully study the neurons’ RF structure (reverse correlation analysis) and response linearity (F1/F0), and found no systematic bias in the distributions (simple cells, n = 70; complex cells, n = 99). We also measured the neurons’ directional selectivity to drifting gratings, to choose the optimal stimulus parameters to evoke robust responses.
Color Detection Task and Behavioral Performance
Both monkeys were trained to perform a detection task in which the spatial attention and task difficulty were manipulated. Each trial in the recording sessions was initiated after the monkeys held fixation on a small white spot in the center of the screen. Stimuli were presented at four locations, one of which was cued by a red ring at the beginning of each trial (Fig. 1A). The stimuli were drifting gratings with identical spatial frequency, temporal frequency, contrast, size, and equidistance from the fixation point, but preferred directions of movement (corresponding to the response attributes of the pair of neurons studied). Three of the stimuli were positioned in the contralateral hemifield (positions Up, Middle, and Down in Fig. 1A), and the fourth was placed in the ipsilateral hemifield (position Opposite in Fig. 1A). After a randomized period of time (1500–2500 ms), the color of the cued grating changed, and the monkey was rewarded for making a saccade to the target within 500 ms (more reward was delivered with a shorter reaction time). One of the positions was cued, to which the monkey directed its attention, either inside or outside of the recorded neurons’ RFs. The task difficulty was adjusted by the saliency of the target (the value of the red channel in RGB color format, Fig. 1B). We used blocked trials to train the monkeys to increasing their effort during the hard task to maximize the reward (i.e., if the first trial was difficult to detect, the monkeys knew that the following trials would also be difficult and they would need to increase their effort to maximize the reward). We cued a spatial location that was different from the location where the grating changed color (10% of invalid trials) in some experiments. The cue affected the behavioral performance in these experiments: targets were much more likely to be detected in the correctly cued trials rather than in the incorrectly cued trials (valid vs invalid, P = 2.99 × 10⁻³, n = 3, paired t-test on the proportion correct across sessions, monkey S; Fig. 1B), indicating that the animals did pay attention to the cued spatial location. Since invalid trials may act as hints for monkeys that there are possible color changes in non-cued locations, which may cause confusion and prevent them from maintaining attentional focus on the target, we did not include invalid trials in the neurophysiological analysis.
The two levels of task difficulty were distinct and adjusted if necessary on each recording day to avoid adaptation, especially to the hard stimuli. Overall, monkeys performed better in the easy than the hard task in the experimental sessions (monkey P: easy, 81.72% ± 1.43%, hard, 74.24% ± 1.95%, P = 7.83 × 10⁻⁶, n = 40; monkey S: easy, 88.78% ± 0.78%, hard, 81.27% ± 1.03%, P = 2.68 × 10⁻⁹; n = 37, paired t-test; Fig. 2A). The reaction times in correct trials during the easy task were also significantly shorter than during the hard task (monkey P: easy, 253.66 ± 1.87 ms, hard, 302.55 ± 2.26 ms, P = 5.37 × 10⁻²³, n = 40; monkey S: easy, 258.87 ± 1.82 ms, hard, 328.22 ± 2.13 ms, P = 6.27 × 10⁻³⁰, n = 37; paired t-test; Fig. 2D).
Fig. 2.

Task difficulty and psychophysical performance. A Average proportion correct during easy (blue) and hard (red) tasks across recording sessions (Monkey P: n = 40; Monkey S: triangles, n = 37). B The performance of both monkeys improved in accuracy during the first 2 easy trials compared with the average level in easy task. C Histogram of the differences in accuracy between the first 2 easy trials and the average in the easy task across all recording sessions. Performance in the first 2 trials was better than the average level of the easy task in 70% of sessions. D Average reaction time during easy (blue) and hard (red) tasks across recording sessions. E, F Both monkeys also improved their performance in reaction time during the first 2 easy trials compared with the average level in the easy task across 71% of sessions. Error bars represent ±SEM. *P <0.05, paired t-test.
To directly measure the actual change in effort for detecting the subtle color change during the hard task, we compared the averaged performance with that in the first 2 correct trials during the easy task across all sessions. For the 77 experimental sessions, both monkeys made fewer mistakes to achieve at least 2 correct trials at the beginning of easy task in 55 of 77 sessions (71.4%, monkey P: 88.18% ± 2.64% vs 81.72% ± 1.43%, P = 2.57 × 10⁻³, n = 40; monkey S: 90.61% ± 0.77% vs 88.78% ± 0.78%, P = 2.14 × 10⁻³, n = 37; paired t-test; Fig. 2B, C). Their reaction times in the first 2 easy trials right after the hard task were also shorter than the average level of for the task in 54 of 77 sessions (70.1%, monkey P: 245.61 ± 3.00 ms vs 253.66 ± 1.87 ms, P = 0.0268, n = 40; monkey S: 256.70 ± 1.68 ms vs 258.87 ± 1.82 ms, P = 0.0153, n = 37, paired t-test; Fig. 2E, F). These results suggested that the state of the animals to accomplish the task differed in the hard and easy tasks, leading to more effort, on average, to maximize rewards during the hard task. We conclude that the increased task difficulty demanded more cognitive resources to complete the task.
Neurophysiological Recordings and Example Neurons
We recorded from the semi-chronically implanted microdrive system with 32 glass/tungsten electrodes (1.5-mm spacing) in V1. Each of the 32 microelectrodes in the tangential microdrive system was independently controlled by a precision lead screw. Two layers of bone cement and several bone screws were applied to the outside of the chamber to firmly hold the implant; this provided reliable impact resistance and stable recording quality (averaged recording duration, 1.2 h). We used the waveform shape signal-to-noise ratio (SNRs) [37] and amplitude signal-to-noise ratio (SNRa) to calculate the recording quality. On average, the SNRs of 169 neurons across all sessions was 5.71 (Fig. 3A). The mean SNRa was 3.71, showing that the signal amplitude was nearly 4 times larger than that of noise (signal: 208.18 ± 8.98 µV, noise: 57.23 ± 1.85 µV; P = 1.398 × 10−39, n = 169, paired t-test).
Fig. 3.

Parameters of electrophysiological recordings. A Histogram of the recording quality as the shape of the signal-to-noise ratio (SNRs) across all sessions (arrowhead, mean of the distribution). B Location of the fixation point (black circle) and averaged centers of RFs mapped in the lower visual fields: recorded from 6 electrodes in monkey P (squares) and from 23 electrodes in monkey S (triangles).
Our primary analyses were based on pairs of single units recorded from the electrodes in daily experimental sessions with each animal. To be conservative, it was impossible to distinguish whether the cell was the same one recorded on subsequent days. We recorded from a total of 80 neurons from monkey P and 89 from monkey S. The recordings in each monkey were from one hemisphere. The centers of RFs recorded from each electrode were stable across recording sessions, at eccentricities 4°–6° in the lower visual field (in Fig. 3B, monkey P: left, circle; monkey S: right, square). We selected pairs of recorded neurons whose half of the sum of RF extent was smaller than the distance between the RF centers, so that their RFs did not overlap and far enough apart (distance between RF centers: 2.41° ± 0.52°; extent of RF: 1.11° ± 0.44°, min = 0.35°, max = 2.04°). During each session, we optimized the direction of movement and position of stimuli for a recorded pair of neurons. The RFs of the chosen neuronal pair were each covered by two drifting gratings with corresponding preferred directions.
The attentional modulation of the spiking responses of V1 neurons to drifting gratings was examined both during easy and hard tasks in the last complete temporal cycle preceding the color change. Consistent with previous results [28], the attentional effect on the spiking responses became significantly prominent with increased task difficulty. Twenty-three neurons (monkey P: 11; monkey S: 12) exhibited spiking response enhancement when the focus of attention was inside versus outside the RF during the hard task; these are referred to as E neurons (Fig. 4A). The averaged ARFR of E neurons was significantly larger during the hard task (ARFREasy = 0.097 ± 0.017, ARFRHard = 0.168 ± 0.021; P = 0.008, Mann–Whitney test). The other 22 neurons (monkey P: 10; monkey S: 12) exhibited spiking response suppression when the focus of attention was inside versus outside the RFs during the hard task; these are referred to as S neurons (Fig. 4B). The neurons that did not show a significantly different firing rate when the spatial attention was inside or outside their RFs during the hard task, are referred to as N neurons (no significant modulation of the spiking response by attention; Fig. 4C).
Forty-five out of 169 neurons in V1 were significantly modulated by spatial attention during the hard task, and only 26 neurons were significantly modulated during the easy task (P = 0.017, χ2-test, Fig. 5A, B). The two monkeys did not differ in the percentage of significantly attention-modulated neurons during the hard task (monkey P: 26.3% vs monkey S: 27.0%, P = 0.916, χ2-test). We examined the difference in attentional ratios of firing rate (ARFRHard − ARFREasy) among the attention-modulated neurons during the hard task (n = 45) between the two levels of difficulty. The pronounced effect of increasing task difficulty was a spiking response enhancement for E neurons (21 of 23 had a larger ARFR during the hard versus the easy task, P = 1.51 × 10⁻⁷, n = 23, paired t-test; Fig. 5C) and spiking response suppression for S neurons (21 of 22 had a smaller ARFR during the hard versus the easy task, P = 3.31 × 10⁻⁶, n = 22, paired t-test; Fig. 5D). The attentional modulation of firing rate was modest in area V1 comparing to that found in higher cortical areas, which is in accordance with the results of previous studies [18, 28, 38].
Fig. 5.

Attentional modulation during hard and easy tasks. A, B The total number of significantly attention-modulated neurons (enhanced: orange, suppressed: purple) is much higher during the hard task than the easy task (easy: 26, hard: 45, P = 0.0168, χ2 test). C, D Distribution of the attentional ratio difference between the hard and easy tasks. The attentional ratios during the hard task show a significant increase among enhanced neurons and a significant decrease among suppressed neurons (E: P = 1.51 × 10⁻⁷, n = 23; S: P = 3.31 × 10⁻⁶, n = 22, t-test). Only 2 neurons exhibit sign flips (black). Arrowheads, mean difference in attentional ratios.
Neurons that exhibited opposite signs of ARFR were excluded from further analyses (E: 1; S: 1). The neuronal pairs fell into six groups EN: (monkey P: 10; monkey S: 10), SN (monkey P: 8; monkey S: 8), NN (monkey P: 21; monkey S: 24), EE (monkey P: 1; monkey S: 0), ES (monkey P: 0; monkey S: 2) and SS (monkey P: 1; monkey S: 1). We further analyzed the spike count correlations of the first three types (, , and ), 81 pairs in total.
Task Difficulty Affects Correlations Depending on the Type of Neuronal Pair
To determine whether the task difficulty could account for the attention-related changes in functional interactions between V1 neurons, spike count correlations of all pairs were calculated across attended stimuli and found to be weakly positive during the easy task, but they decreased to around zero during the hard task. The contribution of task difficulty to the decreasing correlations had a pronounced effect (easy vs hard, 0.038 ± 0.021 vs −0.018 ± 0.020; n = 81, P = 3.65 × 10⁻³, paired t-test, Fig. 6A). The distribution of RFs of attention-modulated neurons was similar at the two positions (Middle vs Down, E: 12 vs 11; S: 12 vs 10). We found that the correlations for three types of pair did not significantly differ between two the attention positions with the same level of task difficulty (Middle vs Down, EN, easy: P = 0.847; hard: P = 0.162, n = 20;SN, easy: P = 0.713; hard: P = 0.211, n = 16; NN, easy: P = 0.610; hard: P = 0.100, n = 45, paired t-test).
Fig. 6.
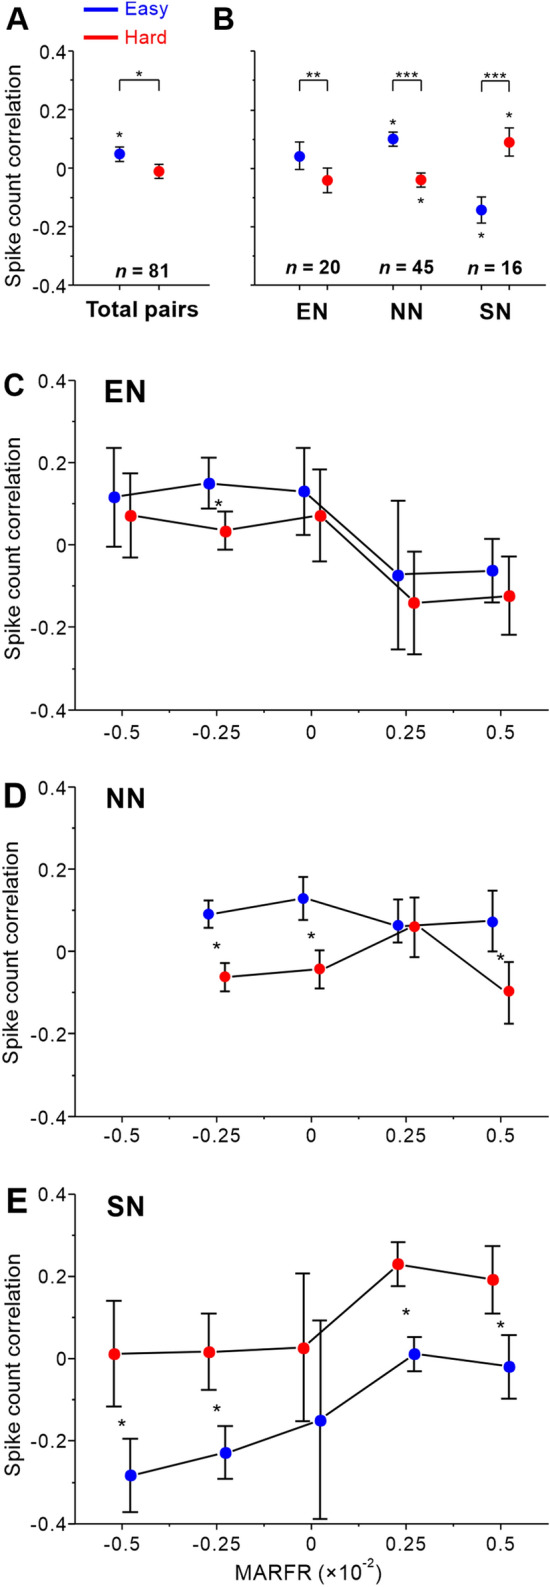
The difficulty-related changes in spike count correlations depend on attentional modulation of the pairs. A Spike count correlations during the hard task decrease across all pairs. B Significant difficulty-related changes in spike count correlations among EN, SN, and NN pairs when one of their RFs is attended. C–E The task difficulty either increased or decreased correlations among pairs depending on MARFR. Individual values of correlations from all recording sessions of two monkeys averaged as a function of MARFR. The bins do not overlap with a width of 2.5 × 10⁻². The correlations are significantly affected by task difficulty or significantly different from zero (transformed in z-score values, *P <0.05, **P <0.01, and ***P <0.001, t-test). Error bars represent ±SEM.
We then tested how task difficulty affected the spike count correlations among different groups of neuronal pairs between easy and hard tasks. There was a significant decrease in correlations for EN pairs (easy: 0.042 ± 0.046, hard: −0.042 ± 0.042; P = 5.33 × 10⁻³; n = 20, paired t-test). Significant increases in correlations of SN pairs from the easy to hard task were found (easy: −0.138 ± 0.045, hard: 0.077 ± 0.049; P = 2.69 × 10⁻⁷; n = 16, paired t-test; Fig. 6B). We did not find correlations significantly larger or smaller than zero among EN pairs during either the easy or the hard task (easy, P = 0.184, hard, P = 0.165, n = 20, one-sample t-test), but we found negative correlations significantly smaller than zero during the easy task and positive correlations significantly larger than zero during the hard task among SN pairs (easy, P = 0.002, hard, P = 0.035, n = 16, one-sample t-test). For NN pairs, similar to EN pairs, decreases in correlations were found to be significant when the task was hard (easy: 0.098 ± 0.025, hard: −0.040 ± 0.024; P = 2.03 × 10⁻⁷; n = 45, paired t-test; Fig. 6B). Consistent with a previous study examining the visual cortex, [8, 10, 29, 39] our results showed that averaged correlations were in the range from −0.2 to 0.2 and that the task difficulty affected correlations depending on the type of neuron pair.
We used MARFR (multiplicative attentional ratio of firing rate, see Materials and Methods for details) to demonstrate how task difficulty influenced spike count correlations among pairs of neurons with different attentional modulation of firing rate (Fig. 6C–E). Pairs of neurons with a positive MARFR indicated competitive attentional modulation of firing rate and those with a negative MARFR tended to show cooperative attentional modulation of firing rate when the task was hard. Thus, the results showed that the modulation of spike count correlations by task difficulty was associated with the attentional modulation of the ring rates of neuronal pairs. We found different patterns of change in spike count correlations among EN, NN, and SN pairs. For EN pairs, task difficulty had slight effects on decreasing the correlations between neurons from cooperation to competition, while the average value shifted from positive to negative (Fig. 6C). The spike count correlations among NN pairs were significantly smaller during the hard task, but there was no tendency to rise or decline under the same level of difficulty along the MARFR axis (Fig. 6D). What is more, correlations among SN pairs significantly increased when the task was hard and tended to rise with a larger MARFR value.
To investigate the effect of task difficulty on spike count correlations among neuronal pairs and whether this was related to the relationship between the focus of attention and the RF, we calculated spike count correlations for EattN and SattN pairs when attending (att) to the RFs of attention-modulated neurons, and those that were not significantly modulated, ENatt and SNatt. The data from monkeys P and S were combined because the results were similar. We found that task difficulty had distinct effects on the two types of pairs. For EN, task difficulty was associated with a significant decrease in spike count correlations during the hard task when attending to the RFs of the E neurons, but not to that of the N neurons (EattN: easy, 0.027 ± 0.060, hard, −0.044 ± 0.049, P = 9.12 × 10⁻³, n = 20; ENatt: easy, 0.057 ± 0.071, hard, −0.040 ± 0.071, P = 0.052, n = 20; paired t-test; Fig. 7A). SN pairs had an opposite effect in which the correlations were significantly larger during the hard than the easy task when the focus of attention was allocated to one of the RFs of the pair (SattN: easy, −0.142 ± 0.060, hard, 0.093 ± 0.066, P = 3.78 × 10⁻⁶, n = 16; SNatt: easy, −0.140 ± 0.060, hard, 0.087 ± 0.064, P = 3.64 × 10⁻⁴, n = 16; paired t-test; Fig. 7B). We noted a shift of correlation from positive to negative for EN pairs and that from negative to positive for SN pairs when task difficulty increased, but only SN pairs had correlations significantly less than zero during the easy task (EattN easy, P = 0.331, hard, P = 0.193, ENatt easy, P = 0.217, hard, P = 0.288; SattN easy, P = 0.021, hard, P = 0.103, , easy, P = 0.023, hard, P = 0.108; one-sample t-test). As NN pairs did not contain significantly attention-modulated neurons, we calculated the spike count correlations when attending to the Middle (M) or Down (D) position during easy and hard tasks and found a similar phenomenon: spike count correlations significantly decreased when task difficulty increased (NMattND: easy, 0.108 ± 0.035, hard, −0.006 ± 0.033, P = 6.62 × 10⁻⁴, n = 45; NMNDatt: easy, 0.089 ± 0.035, hard, −0.075 ± 0.034, P = 5.19 × 10⁻⁵, n = 45; paired t-test; Fig. 7C). While correlations in the easy task were significantly positive, correlations were significantly negative when attending to Down (NMattND easy, P = 1.64 × 10⁻³, hard, P = 0.433; NMNDatt easy, P = 8.04 × 10⁻³, hard, P = 0.017; n = 45, one-sample t-test).
Fig. 7.

The difficulty-related changes in spike count correlations do not depend on the attended location. A Spike count correlations of pairs with one attention-enhanced neuron during easy (blue) and hard (red) tasks when attention is directed to their RFs (solid, attention-modulated) or another RF (hollow, not significantly modulated). B Spike count correlations of pairs with neurons not significantly attention-modulated showing significant difficulty-related changes when attending to one of the neurons’ RF. Subscript character (M or D) denotes which stimulus covered the RF of the neuron. C Spike count correlations of pairs with one attention-suppressed neurons during easy and hard tasks when attention is directed to their RFs or other RFs. Asterisks indicate that the correlations were significantly affected by task difficulty or significantly different from zero (transformed in z-score values, *P <0.05, **P <0.01, and ***P <0.001, t-test). Error bars, ±SEM.
Discussion
We found that task difficulty modulated spike count correlations between pair of neurons with non-overlapping RFs in area V1, and this could increase or decrease. Our analyses revealed that this phenomenon was due to the attentional modulation of the firing rates in pairs of neurons. The interesting pattern of changes in correlations among EN, SN, and NN pairs during easy and hard tasks suggested that attention can adjust the functional interactions between different pools of neurons holding representations of target and distractor according to the difficulty of the attentional task. It would be challenging to design a task that involves pairs with V1 neurons modulated by both attended and distractor stimuli, and how attention impacts their activity still merits exploration.
Effects on Spike Count Correlations: Relationship to Previous Studies
In many previous studies, attention-related reduction in weakly positive spike count correlations has been reported in V1 [10, 40], V4 [21, 22, 39, 41], and the middle temporal area (MT) [3, 6, 7, 36], by analyzing neuronal responses to one large stimulus covering overlapping RFs of recorded neurons. It could be predicted by the population coding models [14], since the pairs of neurons with similar response properties most likely belong to the same pool and those with dissimilar properties would be considered from different pools. On the other hand, spike count correlations observed in pairs of neurons of V4 and FEF with separate and non-overlapping RFs have been reported to be negative [24, 39]. Our spike count correlations were calculated among V1 neurons with non-overlapping RFs responding to two different stimuli, and we also found negative correlations during the hard attentional task, and weakly positive during the easy task. These neurons should be classified into different pools, from which results cannot be explained by the population coding models. Moreover, a pooling model of perceptual decision-making has been used [42] for interpretation on the role of sensory neurons in MT and V2 [43], showing choice-related activity in a discrimination task. However, this cannot be applied in our experiment since their study and ours differed in the way stimuli are presented, the cognitive task, and the cortical area.
Due to the design of the “Gray Matter” microdrive system, our recordings were obtained from two electrodes with an average distance of 6.22 mm (3.35–7.50 mm), while the distance between electrodes measuring correlations in previous work were within 4 mm [3, 9, 10, 35, 40, 44]. So, we were able to record from pairs of neurons whose RFs were separated far enough to be driven by different gratings drifting in their preferred directions. This allowed us to investigate how attention affects the co-variability in the spiking response of different groups of V1 neurons. Another advantage of our microdrive system was the high recording stability and quality. Data from a simulation model have shown that mistakenly counting spikes from other neurons generates incorrect results [8]. Since a majority of multi-units were included in previous studies, and too few pairs of well-isolated units were recorded simultaneously, their spike count correlation analysis might have been affected. Recording from well-isolated single units provided us more valid evaluation of spike count correlations.
Several measurements of correlations in V1 had been conducted under various behavioral and stimulus conditions, and at different cortical distances between pairs of neurons [3, 9, 10, 35, 40]. Previous measurements of spike count correlations in V1 were either under anesthesia or in response to the same stimulus in vivo. Whether attention modulated the correlations among pairs of V1 neurons has long been debated. Our results showed that the correlations in V1 were negative until the task was hard enough when one of the stimuli was attended. However, they were weakly positive during the easy task, which is consistent with previous studies. Moreover, an earlier study reported that correlations were independent of orientation [35]. We also analyzed the result to find out whether the drifting gratings moving in the same direction would affect the correlations (the data were collapsed across stimulus conditions). There was no significant difference in spike count correlations between when the pair of neurons were stimulated by the same and different stimulus directions during both the easy and hard tasks (Easy, same vs different: 0.082 ± 0.047 vs 0.025 ± 0.023, P = 0.260; Hard, same vs different: 0.015 ± 0.043 vs −0.023 ± 0.022, P = 0.419; two-sample t-test). We also analyzed the results of the spike count correlations in EN, NN, and SN pairs during the easy and hard tasks when attention is allocated to position Up (EN, easy, −0.059 ± 0.064, hard, −0.022 ± 0.065, n = 20, P = 0.444; NN, easy, 0.041 ± 0.042, hard, 0.000 ± 0.040, n = 45, P = 0.396; SN, easy, 0.064 ± 0.058, hard, −0.109 ± 0.065, n = 16, P = 0.017; paired t-test) or even to position Opposite in the ipsilateral hemifield (EN, easy, −0.080 ± 0.068, hard, −0.016 ± 0.079, n = 20, P = 0.568; NN, easy, −0.050 ± 0.046, hard, −0.052 ± 0.047, n = 45, P = 0.977; SN, easy, −0.076 ± 0.068, hard, −0.164 ± 0.063, n = 16, P = 0.239; paired t-test). We found that task difficulty had no significant effect on the EN and NN pairs when attention was directed away from their RFs, but still had a significant effect on the SN pairs when attention was allocated to the Up position. This indicated that the modulation of spike count correlations by task difficulty depends on spatial attention and that SN pairs might play different roles in attention-related improvements in perception compared with EN and NN pairs. The robustness suggests that the attention-related changes in correlations cannot be attributed to differences in the firing rates of the V1 neurons, but may result from the attentional modulation of visual competition between mutually inhibiting streams of information. Although the reduction in correlations was slightly larger when attending to the Down than to the Middle position in the hard task among NN pairs (Fig. 7C), we did not find a significant difference between the two conditions (P = 0.100, paired t-test). It was not possible to determine which type of neuron was being recorded and how they were modulated by the animals’ attention during the experiment. In fact, we recorded from almost the same number of attention-modulated neurons with their RFs located at either position, which could not be determined arbitrarily. The electrode distance of pairs between the enhanced and suppressed groups were not significantly different (20 pairs with one enhanced neuron, EN, vs 16 pairs with one suppressed neuron, SN, P = 0.146, Mann–Whitney Test). The absolute difference in preferred direction of drifting gratings between these two groups of neuronal pairs was not significant (P = 0.311, Mann–Whitney Test).
Reflection of Cooperation and Competition Among Neural Interactions
The neuronal mechanism of spatial attention in visual areas could be described based on the framework of biased competition theory, which proposes that selected and unselected stimuli compete with each other for better representation. Attention acts to let the selected one “win” via biasing the competition, with enhanced responses of visual neurons’ spiking to this stimulus. V1 neurons with non-overlapping RFs in our study represented two competing stimuli while spatial attention was directed to either one of the RFs. If the firing rates of both neurons are enhanced by spatial attention (MARFR >0), their spiking responses are supposed to exhibit a “push-pull” competitive interaction. As reported in eye-movement-related areas, spike count correlations are negative between pairs of neurons with spatially non-overlapping RFs in the FEF and dorsolateral prefrontal cortex area 8a of behaving primates [23, 24]. Consistent with previous studies, spike count correlations among EN pairs with positive MARFRs became negative (Fig. 6C). Although the N neurons in the pair did not show a significant attentional effect, their firing rates were enhanced while focus of attention was inside their RFs. We found no similar relationship between spike count correlation and MARFR among NN pairs (Fig. 6D), but a reverse effect among SN pairs (Fig. 6E). During the hard task, spike count correlations among SN pairs were positive while their MARFRs were positive. This means the firing rate of either neuron was suppressed with the focus of attention inside its RF (both negative ARFRs). Although attention-suppressed neurons have been reported in areas V1, V2, and V4 [18] in a proportional range of 27.6% to 42.4%, their function in attentional modulation was seldom discussed and is still unknown. One hypothesis is that these neurons are inhibitory interneurons for filtering distractors. Positive spike count correlation between attention-suppressed neurons might indicate that they communicate rather than compete with each other to filter the distracting information.
Our results also indicated that the difficulty of the spatial attention task affected the interactions between different neuronal pools. The competitive processes appeared to be constrained by the degree of difficulty of target detection among distractors. This was likely resolved by spatial attention via a bias toward the target over distractors. As the spiking responses of each neuron reflect the shared activity of its pool, which contributes to perceptual decisions, the spike count correlations among pairs comprised neurons with non-overlapping RFs at least partly reflect attentional top-down influences. Our results support the idea that top-down attention affects pools of sensory neurons before perceptual choices are made.
Possible Causes of the Effect of Task Difficulty on Correlations
Our results also deepen the understanding of how attention operates to affect neuronal correlations with different task demands. Task difficulty was manipulated to affect the attention deployed on the cued position. It is unlikely that monkeys deployed the same amount of attention during the easy and hard tasks: (1) the difficulty of the hard task was distinct from the easy task and pertained to the threshold, so that the monkeys had to make greater efforts to detect the subtle color change, or they did not receive much reward; (2) the allowed response interval was limited and the amount of juice was directly linked to the reaction time, so a faster reaction resulted in more reward. This experimental protocol likely encouraged the monkeys to pay more attention during hard than easy tasks. If the monkeys maintained their attention on the correct stimulus, decreasing task difficulty led to a remarkable improvement in performance as the psychometric curve clearly indicated (Fig. 1B, see Methods). In addition, there are other alternative factors. One possible cause is larger fluctuations in the behavioral state, which might affect neuronal responses and alter correlations [7, 10, 36]. While the animals performed the behavioral task, the same stimulus to be attended was no more than 30 consecutive trials. The influence of slow fluctuations may be diminished [6], and since we compared the change in correlations during hard and easy tasks, it was most likely the result of the differences in task difficulty, rather than larger slow fluctuations in neural spiking responses.
Another possibility is the stability of fixation. We analyzed the eye position during fixation across attended locations using a 1000-ms window before the color change. We found the differences in the average eye position between the two tasks were <0.15° in all sessions (n = 77, mean ± SD = 0.07° ± 0.06°). This suggested that our results cannot be explained by fixation eye movements, as the direction, fixation deviation, and frequency of microsaccades showed no systematic variation across the attended locations and task difficulty.
The correlations are thought to occur on longer timescales in ongoing activities and to be primarily affected by sensory drive (e.g., contrast and luminance) [35, 40, 41]. With identical cues and stimuli delivered in each trial, only the color of the target stimulus changed after a uniformly-distributed random period of time in which the animals maintained attentional focus sufficiently long to involve the modulation of neuronal responses. Thus, as only the task difficulty was manipulated during the time window in which the analysis was performed, the pattern of correlations among pairs of neurons could not be the result of the stimulus strength. To examine if the reaction time would affect the spike count correlation among neuronal pairs, we recalculated the spike count correlations in Fast trials in which the reaction times were comparatively shorter than the mean by −0.5 SD, and in Slow trials in which the reaction times were longer than the mean +0.5 SD during the easy and hard tasks. Then we compared the spike count correlations among 81 neuronal pairs in Fast and Slow trials with the same task difficulty and found no significant difference (Easy: Fast, 0.038 ± 0.035, Slow, 0.027 ± 0.038, P = 0.836; Hard: Fast, 0.021 ± 0.033, Slow, −0.040 ± 0.036, P = 0.222; n = 81, two-sample t-test).
Our results indicated that the difficulty-related effect on correlations was not from changes of neuronal firing rate. One could hypothesize that the effects of task difficulty on firing rates and spike count correlations are intimately associated, since the difference in correlations between easy and hard tasks might come from a change in firing rate. However, spike count correlations were calculated as the Pearson coefficient, which is a rate-independent metric. Previous studies had also provided evidence that attention-related changes in spike count correlation do not necessarily result in the same change in firing rates [29, 45], even when the response are z-scored and their spike count correlations recalculated. Therefore, a difficulty-related change in the firing rate would not affect our results.
Correlations can be reduced by encircling annular stimuli with no stimuli upon the RF, due to suppression from recruited surrounding stimuli as a normalization signal, resembling the effects of directly stimulating the RF [46]. We cannot exclude this influence, but two aspects of our measurements imply that our results are independent of the surrounding suppression. First, the peripheral area of the gratings was not circled by other stimuli. We assume that the suppression is related to the stimulation strength in the surrounding area, so that a reduction in the Middle should be recorded. As mentioned above, there was no significant difference when the focus of attention was on the positions Middle and Down at the same level of task difficulty. No evidence implies that attention or task difficulty affects the suppression that led to a variation in correlations. Second, direction selectivity and response linearity were measured to determine the preferred direction of each neuron before every recording session.
Taken together, we showed that our manipulation of task difficulty actually affects the animal’s attentional state by comparing performance in the easy and hard tasks. Our results show evident difficulty-related change in the spiking response covariability between V1 neuronal pairs with non-overlapping RFs, which could increase or decrease depending on the effect of attentional modulation. We demonstrated that the behaviorally-relevant change was sufficient to affect correlations, and this is attributable to local cognitive factors such as spatial attention. Our findings suggest that modulation of spike count correlations is important for the role of the neuronal mechanism underlying attention in improving the information processing of targets and distracters.
Acknowledgements
We thank Kuntan Ni and Bin Zhao for technical assistance, and Charles M. Gray, Pengcheng Sun, Yiheng Zhang, and Tianwei Wang for discussion and development of the implantation surgery. This work was supported by the National Natural Science Foundation of China (61773259, 31471081, 61773256, 62073221, and 61971280).
Conflict of interest
The authors declare no conflicts of interest.
References
- 1.Shadlen MN, Newsome WT. The variable discharge of cortical neurons: Implications for connectivity, computation, and information coding. J Neurosci. 1998;18:3870–3896. doi: 10.1523/JNEUROSCI.18-10-03870.1998. [DOI] [PMC free article] [PubMed] [Google Scholar]
- 2.Stettler DD, Das A, Bennett J, Gilbert CD. Lateral connectivity and contextual interactions in macaque primary visual cortex. Neuron. 2002;36:739–750. doi: 10.1016/S0896-6273(02)01029-2. [DOI] [PubMed] [Google Scholar]
- 3.Ruff DA, Cohen MR. Attention increases spike count correlations between visual cortical areas. J Neurosci. 2016;36:7523–7534. doi: 10.1523/JNEUROSCI.0610-16.2016. [DOI] [PMC free article] [PubMed] [Google Scholar]
- 4.Abbott LF, Dayan P. The effect of correlated variability on the accuracy of a population code. Neural Comput. 1999;11:91–101. doi: 10.1162/089976699300016827. [DOI] [PubMed] [Google Scholar]
- 5.Poort J, Roelfsema PR. Noise correlations have little influence on the coding of selective attention in area V1. Cereb Cortex. 2009;19:543–553. doi: 10.1093/cercor/bhn103. [DOI] [PMC free article] [PubMed] [Google Scholar]
- 6.Zohary E, Shadlen MN, Newsome WT. Correlated neuronal discharge rate and its implications for psychophysical performance. Nature. 1994;370:140–143. doi: 10.1038/370140a0. [DOI] [PubMed] [Google Scholar]
- 7.Gu Y, Liu S, Fetsch CR, Yang Y, Fok S, Sunkara A, et al. Perceptual learning reduces interneuronal correlations in macaque visual cortex. Neuron. 2011;71:750–761. doi: 10.1016/j.neuron.2011.06.015. [DOI] [PMC free article] [PubMed] [Google Scholar]
- 8.Cohen MR, Kohn A. Measuring and interpreting neuronal correlations. Nat Neurosci. 2011;14:811–819. doi: 10.1038/nn.2842. [DOI] [PMC free article] [PubMed] [Google Scholar]
- 9.Denfield GH, Ecker AS, Shinn TJ, Bethge M, Tolias AS. Attentional fluctuations induce shared variability in macaque primary visual cortex. Nat Commun. 2018;9:2654. doi: 10.1038/s41467-018-05123-6. [DOI] [PMC free article] [PubMed] [Google Scholar]
- 10.Ecker AS, Berens P, Keliris GA, Bethge M, Logothetis NK, Tolias AS. Decorrelated neuronal firing in cortical microcircuits. Science. 2010;327:584–587. doi: 10.1126/science.1179867. [DOI] [PubMed] [Google Scholar]
- 11.Ecker AS, Denfield GH, Bethge M, Tolias AS. On the structure of neuronal population activity under fluctuations in attentional state. J Neurosci. 2016;36:1775–1789. doi: 10.1523/JNEUROSCI.2044-15.2016. [DOI] [PMC free article] [PubMed] [Google Scholar]
- 12.Ruff DA, Cohen MR. A normalization model suggests that attention changes the weighting of inputs between visual areas. Proc Natl Acad Sci U S A. 2017;114:E4085–E4094. doi: 10.1073/pnas.1619857114. [DOI] [PMC free article] [PubMed] [Google Scholar]
- 13.Kanashiro T, Ocker GK, Cohen MR, Doiron B. Attentional modulation of neuronal variability in circuit models of cortex. Elife 2017, 6: e23978. [DOI] [PMC free article] [PubMed]
- 14.Averbeck BB, Latham PE, Pouget A. Neural correlations, population coding and computation. Nat Rev Neurosci. 2006;7:358–366. doi: 10.1038/nrn1888. [DOI] [PubMed] [Google Scholar]
- 15.Huang CC, Ruff DA, Pyle R, Rosenbaum R, Cohen MR, Doiron B. Circuit models of low-dimensional shared variability in cortical networks. Neuron. 2019;101:337–348.e4. doi: 10.1016/j.neuron.2018.11.034. [DOI] [PMC free article] [PubMed] [Google Scholar]
- 16.Kastner S, Ungerleider LG. Mechanisms of visual attention in the human cortex. Annu Rev Neurosci. 2000;23:315–341. doi: 10.1146/annurev.neuro.23.1.315. [DOI] [PubMed] [Google Scholar]
- 17.McAdams CJ, Maunsell JH. Effects of attention on orientation-tuning functions of single neurons in macaque cortical area V4. J Neurosci. 1999;19:431–441. doi: 10.1523/JNEUROSCI.19-01-00431.1999. [DOI] [PMC free article] [PubMed] [Google Scholar]
- 18.Motter BC. Focal attention produces spatially selective processing in visual cortical areas V1, V2, and V4 in the presence of competing stimuli. J Neurophysiol. 1993;70:909–919. doi: 10.1152/jn.1993.70.3.909. [DOI] [PubMed] [Google Scholar]
- 19.Cox MA, Dougherty K, Adams GK, Reavis EA, Westerberg JA, Moore BS, et al. Spiking suppression precedes cued attentional enhancement of neural responses in primary visual cortex. Cereb Cortex. 2019;29:77–90. doi: 10.1093/cercor/bhx305. [DOI] [PMC free article] [PubMed] [Google Scholar]
- 20.Cohen MR, Newsome WT. Estimates of the contribution of single neurons to perception depend on timescale and noise correlation. J Neurosci. 2009;29:6635–6648. doi: 10.1523/JNEUROSCI.5179-08.2009. [DOI] [PMC free article] [PubMed] [Google Scholar]
- 21.Cohen MR, Maunsell JH. Attention improves performance primarily by reducing interneuronal correlations. Nat Neurosci. 2009;12:1594–1600. doi: 10.1038/nn.2439. [DOI] [PMC free article] [PubMed] [Google Scholar]
- 22.Mitchell JF, Sundberg KA, Reynolds JH. Spatial attention decorrelates intrinsic activity fluctuations in macaque area V4. Neuron. 2009;63:879–888. doi: 10.1016/j.neuron.2009.09.013. [DOI] [PMC free article] [PubMed] [Google Scholar]
- 23.Leavitt ML, Pieper F, Sachs A, Joober R, Martinez-Trujillo JC. Structure of spike count correlations reveals functional interactions between neurons in dorsolateral prefrontal cortex area 8a of behaving primates. PLoS One. 2013;8:e61503. doi: 10.1371/journal.pone.0061503. [DOI] [PMC free article] [PubMed] [Google Scholar]
- 24.Cohen JY, Crowder EA, Heitz RP, Subraveti CR, Thompson KG, Woodman GF, et al. Cooperation and competition among frontal eye field neurons during visual target selection. J Neurosci. 2010;30:3227–3238. doi: 10.1523/JNEUROSCI.4600-09.2010. [DOI] [PMC free article] [PubMed] [Google Scholar]
- 25.Reynolds JH, Chelazzi L, Desimone R. Competitive mechanisms subserve attention in macaque areas V2 and V4. J Neurosci. 1999;19:1736–1753. doi: 10.1523/JNEUROSCI.19-05-01736.1999. [DOI] [PMC free article] [PubMed] [Google Scholar]
- 26.Buschman TJ, Kastner S. From behavior to neural dynamics: An integrated theory of attention. Neuron. 2015;88:127–144. doi: 10.1016/j.neuron.2015.09.017. [DOI] [PMC free article] [PubMed] [Google Scholar]
- 27.Boudreau CE, Williford TH, Maunsell JH. Effects of task difficulty and target likelihood in area V4 of macaque monkeys. J Neurophysiol. 2006;96:2377–2387. doi: 10.1152/jn.01072.2005. [DOI] [PubMed] [Google Scholar]
- 28.Chen Y, Martinez-Conde S, Macknik SL, Bereshpolova Y, Swadlow HA, Alonso JM. Task difficulty modulates the activity of specific neuronal populations in primary visual cortex. Nat Neurosci. 2008;11:974–982. doi: 10.1038/nn.2147. [DOI] [PMC free article] [PubMed] [Google Scholar]
- 29.Ruff DA, Cohen MR. Global cognitive factors modulate correlated response variability between V4 neurons. J Neurosci. 2014;34:16408–16416. doi: 10.1523/JNEUROSCI.2750-14.2014. [DOI] [PMC free article] [PubMed] [Google Scholar]
- 30.Schwartz S, Vuilleumier P, Hutton C, Maravita A, Dolan RJ, Driver J. Attentional load and sensory competition in human vision: Modulation of fMRI responses by load at fixation during task-irrelevant stimulation in the peripheral visual field. Cereb Cortex. 2005;15:770–786. doi: 10.1093/cercor/bhh178. [DOI] [PubMed] [Google Scholar]
- 31.Lavie N, Hirst A, de Fockert JW, Viding E. Load theory of selective attention and cognitive control. J Exp Psychol Gen. 2004;133:339–354. doi: 10.1037/0096-3445.133.3.339. [DOI] [PubMed] [Google Scholar]
- 32.Ringach D, Shapley R. Reverse correlation in neurophysiology. Cogn Sci 2004, 28: 147–166. 10.1207/s15516709cog2802_2
- 33.Malone BJ, Kumar VR, Ringach DL. Dynamics of receptive field size in primary visual cortex. J Neurophysiol. 2007;97:407–414. doi: 10.1152/jn.00830.2006. [DOI] [PubMed] [Google Scholar]
- 34.Skottun BC, De Valois RL, Grosof DH, Movshon JA, Albrecht DG, Bonds AB. Classifying simple and complex cells on the basis of response modulation. Vision Res. 1991;31:1079–1086. doi: 10.1016/0042-6989(91)90033-2. [DOI] [PubMed] [Google Scholar]
- 35.Kohn A, Smith MA. Stimulus dependence of neuronal correlation in primary visual cortex of the macaque. J Neurosci. 2005;25:3661–3673. doi: 10.1523/JNEUROSCI.5106-04.2005. [DOI] [PMC free article] [PubMed] [Google Scholar]
- 36.Bair W, Zohary E, Newsome WT. Correlated firing in macaque visual area MT: Time scales and relationship to behavior. J Neurosci. 2001;21:1676–1697. doi: 10.1523/JNEUROSCI.21-05-01676.2001. [DOI] [PMC free article] [PubMed] [Google Scholar]
- 37.Kelly RC, Smith MA, Samonds JM, Kohn A, Bonds AB, Movshon JA, et al. Comparison of recordings from microelectrode arrays and single electrodes in the visual cortex. J Neurosci. 2007;27:261–264. doi: 10.1523/JNEUROSCI.4906-06.2007. [DOI] [PMC free article] [PubMed] [Google Scholar]
- 38.Hembrook-Short JR, Mock VL, Briggs F. Attentional modulation of neuronal activity depends on neuronal feature selectivity. Curr Biol. 2017;27:1878–1887.e5. doi: 10.1016/j.cub.2017.05.080. [DOI] [PMC free article] [PubMed] [Google Scholar]
- 39.Ruff DA, Cohen MR. Attention can either increase or decrease spike count correlations in visual cortex. Nat Neurosci. 2014;17:1591–1597. doi: 10.1038/nn.3835. [DOI] [PMC free article] [PubMed] [Google Scholar]
- 40.Smith MA, Kohn A. Spatial and temporal scales of neuronal correlation in primary visual cortex. J Neurosci. 2008;28:12591–12603. doi: 10.1523/JNEUROSCI.2929-08.2008. [DOI] [PMC free article] [PubMed] [Google Scholar]
- 41.Smith MA, Sommer MA. Spatial and temporal scales of neuronal correlation in visual area V4. J Neurosci. 2013;33:5422–5432. doi: 10.1523/JNEUROSCI.4782-12.2013. [DOI] [PMC free article] [PubMed] [Google Scholar]
- 42.Nienborg H, Cohen MR, Cumming BG. Decision-related activity in sensory neurons: Correlations among neurons and with behavior. Annu Rev Neurosci. 2012;35:463–483. doi: 10.1146/annurev-neuro-062111-150403. [DOI] [PubMed] [Google Scholar]
- 43.Cohen MR, Newsome WT. Context-dependent changes in functional circuitry in visual area MT. Neuron. 2008;60:162–173. doi: 10.1016/j.neuron.2008.08.007. [DOI] [PMC free article] [PubMed] [Google Scholar]
- 44.Ecker AS, Berens P, Cotton RJ, Subramaniyan M, Denfield GH, Cadwell CR, et al. State dependence of noise correlations in macaque primary visual cortex. Neuron. 2014;82:235–248. doi: 10.1016/j.neuron.2014.02.006. [DOI] [PMC free article] [PubMed] [Google Scholar]
- 45.Zénon A, Krauzlis RJ. Attention deficits without cortical neuronal deficits. Nature. 2012;489:434–437. doi: 10.1038/nature11497. [DOI] [PMC free article] [PubMed] [Google Scholar]
- 46.Snyder AC, Morais MJ, Kohn A, Smith MA. Correlations in V1 are reduced by stimulation outside the receptive field. J Neurosci. 2014;34:11222–11227. doi: 10.1523/JNEUROSCI.0762-14.2014. [DOI] [PMC free article] [PubMed] [Google Scholar]