Abstract
Phenotypic and transcriptional profiling of Treg cells at homeostasis reveals that TCR activation promotes Treg cells with an effector phenotype (eTreg) characterized by the production of IL-10 and expression of the inhibitory receptor PD-1. At homeostasis, blockade of the PD-1 pathway results in enhanced eTreg cell activity while during infection with T. gondii early IFN-γ upregulates myeloid cell expression of PD-L1 associated with reduced Treg cell populations. In infected mice, the blockade of PD-L1, complete deletion of PD-1, or lineage-specific deletion of PD-1 in Treg cells prevents loss of eTreg cells. These interventions resulted in a reduced ratio of pathogen-specific effector T cells : eTregs and increased levels of IL-10 that mitigated the development of immunopathology, but which could compromise parasite control. Thus, eTreg cell expression of PD-1 acts as a sensor to rapidly tune the pool of eTreg cells at homeostasis and during inflammatory processes.
Introduction
T cells are essential for surveillance and protection against cancer and infection, but aberrant effector T cell responses can lead to auto-immunity or immune-mediated collateral damage. Regulatory T cells that express the transcription factor Foxp3+ (Treg cells) have a critical role in limiting these inflammatory processes, and the loss of Treg cells is associated with a variety of immune mediated conditions1,2. Consequently, there has been a long-standing interest in defining the cellular and molecular pathways that promote Treg cell development, maintenance, and suppressive effects. Thus, at homeostasis Treg cells are activated by self-antigen, ongoing TCR signaling and costimulation that is required to maintain these cells3–5. The inhibitory effects of Treg cells are mediated through numerous mechanisms that include the consumption of IL-2, secretion of IL-10, and expression of surface molecules such as PD-L1 and CTLA-46–8, but less is known about the pathways that limit T reg cell activity.
There is significant heterogeneity within the Treg cell populations that are associated with homeostasis as well as with different classes of inflammation9–12. For example, Treg cells exposed to the cytokines IFN-γ, IL-12, or IL-27 upregulate the Th1 associated transcription factor T-bet, express CXCR3, and are specialized to operate at sites of Th1-mediated inflammation9,13,14. Other instances that illustrate the diversity of Treg cells include the observation that Treg cells with low-affinity TCR interactions have highest levels of CD2515,16, while effector Treg (eTreg) cells express elevated levels of IL-10 and inhibitory receptors (IRs)17,18, do not require IL-2 for survival and are maintained via TCR activation and costimulatory signals15,16. For effector T cells, repeated TCR stimulation leads to expression of PD-117,19 which antagonize costimulatory and TCR signals20,21 and is associated with T cell exhaustion and deletion21. Although PD-1 is not essential for the development of Treg cells, there are reports that PD-1 can promote22 or limit23 peripherally induced (pTreg) cells. Support for the ability of PD-1 to limit Treg cells is provided by studies in which blockade of the PD-1 pathway in certain cancers resulted in an increase number of PD-1hi intra-tumoral eTreg cells, associated with immune suppression, metastasis, and increased morbidity17,18.
The role of Treg cells during infection is complex. Enhanced Treg cell responses can promote microbial persistence 24,25 whereas inflammatory signals promote specialized subsets that limit immunopathology9,13,14 . Additionally, certain systemic infections result in a global collapse of Treg cell populations which allows the emergence of effector T cell responses that limit microbial replication26,27. Together, these studies have led to the concept that high Effector T cell: Treg ratios favor pathogen control while lo effector T: Treg ratios facilitate persistence24,26. The basis for this Treg crash remains unclear but many infections lead to reduced basal IL-2 required to maintain Treg cells26,27, while treatment with IL-2 complexes partially mitigate this loss26,27. Whether inhibitory receptors expressed by T reg cells influence these processes is unclear.
Here, experiments were performed to understand how PD-1 influences eTreg cells, thus at homeostasis basal PD-L1 levels temper TCR signals that promote eTreg cell survival. However, during infection with the intracellular parasite Toxoplasma gondii the early production of IFN-γ promotes myeloid cell expression of PD-L1 which leads to contraction of the eTreg cells. Antagonizing PD-1 activity during infection resulted in preservation of the eTreg cells, reduced pathogen specific effector T cells and subsequent immunopathology, but at the most extreme increased parasite replication. Thus, PD-1 has a physiological role in eTreg cell homeostasis, and engagement of PD-1 during infection tunes Treg cell responses that balance protective and pathological responses.
Results:
Constitutive PD-L1 limits PD-1+ Treg populations at homeostasis
To visualize the distribution of PD-1 on different CD4+ T cell populations at homeostasis, UMAP analysis of splenic CD4+ T cells from naïve C57Bl/6 mice was utilized (Extended Data 1A–D). Few Tconv cells (CD4+, Foxp3-) expressed PD-1 whereas 40% of Treg cells (CD4+, Foxp3+) were PD-1+ (Figure 1A). Despite exclusion of PD-1 and Foxp3 from the UMAP analytical algorithm, Treg cells segregated from Tconv due to expression of Helios, GITR, and CD25 as well as PD-L1, and CTLA-4 (Extended Data 1C, 1E). Additional markers of activation (KLRG1, CD73, and ICOS) were associated with Treg cells, but illustrated their heterogeneity at homeostasis (Extended Data 1F). When compared to Tconv cells, Treg cells also had increased levels of activation-associated proteins (CD69, CD11a, CD44, and ICOS), but decreased expression of CD127 (Extended Data 1G–H). To compare the differences between PD-1- and PD-1+ Treg cells, a UMAP analysis of Foxp3+ CD4+ T cells was utilized that included markers of activation and function, but which excluded PD-1 as a calculation factor (Extended Data 2A–D). The UMAP generated clusters were then defined via X-shift analysis and then further delineated for expression trends using the ClusterExplorer tool (Extended Data 2E, 2G). The comparison of Treg cells from WT and PD-1 KO (Pdcd−/−) mice allowed the identification of PD-1-, PD-1lo, and PD-1hi subsets (Extended Data 2B). Amongst the 5 Treg clusters identified via X-shift, 4 had extensive overlap in the PD-1hi regions (Figure 1B). At homeostasis, the PD-1hi Treg region of the UMAP demonstrated increased expression of CD69, CD11a and Nur77 (expressed after TCR engagement28) (Figure 1C). The PD-1hi region was also associated with expression of Ki67 and cMyc, proteins connected to T cell proliferation (Figure 1D) and overlapped with the Helios+ region of the UMAP (Figure 1E), a marker of thymically derived Treg cells. The PD-1- and PD-1lo subsets did not overlap extensively with these activated, proliferative, or thymic Treg associated proteins, but were correlated with CD25 expression and the pro-survival Bcl-2 (Figure 1B–E). Expression of proteins linked to Treg effector function (ICOS, CTLA-4, PD-L1, CD27, CD43, CD73, KLRG1) were enriched in the PD-1hi region (Figure 1F). Notably, a KLRG1+ subset appears as a distinct cluster within the activated PD-1hi CD25lo Treg pool, indicating heterogeneity within the PD-1hi compartment (Figure 1C–1F). Further, the capacity of these Treg cells to produce IL-10 was closely associated with the PD-1+ compartment (Figure 1G, Extended Data 2H–K). Examination of the PD-1-, PD-1lo, and PD-1hi Treg cell subsets demonstrates increasing proportions of Helios+ thymic Treg cells with increasing PD-1 expression (Figure 1H). Helios+ Treg cells are associated with distinct TCR repertoires and enhanced suppressive capacity29; and the levels of PD-1 correlated with increased expression of Nur77, CD11a, CD69, ICOS and CTLA-4 (Figure 1H–J) but absence of CD25 and Bcl-2 (Figure 1K). This combination of low CD25 with expression of IR is similar to eTreg populations16,18,30,31 and we will refer to PD-1+ Treg cells as eTreg cells while PD-1- CD25+ Treg cells will be termed central Treg (cTreg) cells31.
Figure 1: Treg cell heterogeneity at homeostasis and eTreg association with PD-1.
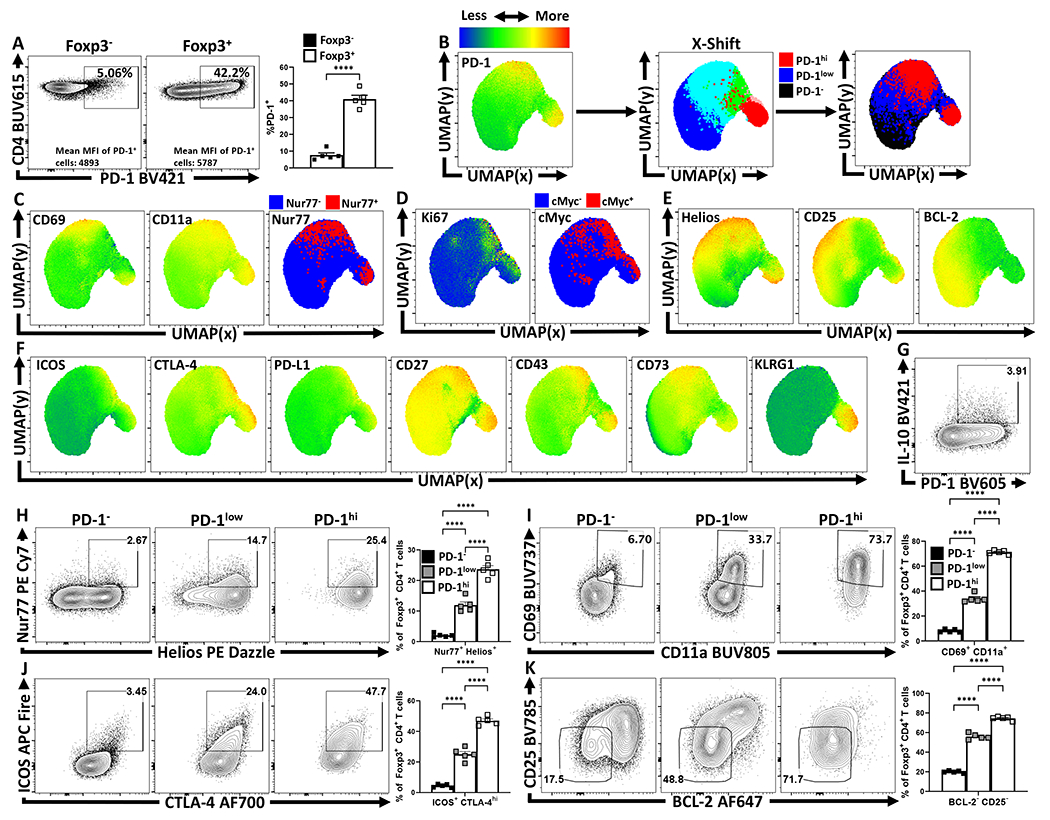
Splenocytes from naïve 8-week old female C57BL/6 mice were analyzed via high-parameter flow cytometry for the following figures. (A) Flow cytometry plots depicting PD-1 expression amongst CD4+ Foxp3− T cells (Tconv), in comparison CD4+ Foxp3+ T cells (Treg) (n = 5/group two-tailed unpaired student’s t-test, **** = p < 0.0001, 6 experimental replicates). (B) UMAP heatmap plot of PD-1 expression amongst Treg cells from (A), with the subsequent X-shift identified subpopulations and delineated PD-1 subsets subdivided into PD-1− (black), PD-1low (blue), and PD-1hi (red) regions within the UMAP (see Supplemental Figure 2 for description). (C-F) Heatmap analysis of the above UMAP demonstrating median fluorescence of stained protein expression, with additional simple overlays of positive cells within the UMAP. (C) Expression of activation-associated proteins CD69, CD11a, in addition to an overlay of Nur77+ cells within the UMAP. (D) Expression of proliferation-associated Ki67 and an overlay of cMyc+ cells within the UMAP. (E) Expression of Treg-associated Helios, and survival-associated proteins CD25, and BCL-2. (F) Expression of Treg effector-associated proteins: ICOS, CTLA-4, PD-L1, CD27, CD43, CD73, and KLRG1. (G) Flow cytometry plot of Treg cells depicting PD-1 and IL-10 expression. (H-K) Flow cytometry plots depicting proportional Treg cell changes with increasing PD-1 expression, based on PD-1−, PD-1low, and PD-1hi subsetting (as shown in Supplemental Figure 2). (H) Depictions of proportional enrichment of Nur77+ Helios+ Treg cells (n = 5/group, 1-way ANOVA with Tukey’s multiple comparisons test, **** = p < 0.0001, 4 experimental replicates), in addition to (I) increases in activation-associated CD69+ CD11a+ Treg cells with increases in PD-1 expression (n = 5/group, 1-way ANOVA with Tukey’s multiple comparisons test, **** = p < 0.0001, 6 experimental replicates). (J) Flow cytometry plots depicting changes in effector-Treg associated proteins ICOS and CTLA-4 (n = 5/group, 1-way ANOVA with Tukey’s multiple comparisons test, **** = p < 0.0001, 5 experimental replicates), with subsequent plots (K) demonstrating an enrichment of CD25− BCL-2low Treg cells, both with increasing PD-1 expression (n = 5/group, 1-way ANOVA with Tukey’s multiple comparisons test **** = p < 0.0001, 4 experimental replicates). All data presented are means +/− SEM and show individual data points.
PD-1 restrains eTreg cell populations at homeostasis
To assess the impact of PD-1/PD-L1 interactions on Treg cells, naive mice were dosed with an isotype control or αPD-L1 antibody and splenocytes assessed after 72 hours. Basal PD-L1 was present on different immune populations (Extended Data 3A, 3C) and the in vivo αPD-L1 antibody bound to these PD-L1 expressing populations (Extended Data 3B). This short-term treatment resulted in an increased number of Treg cells (Figure 2A), most notably the proportion and total number of PD-1+ Treg cells (Figure 2B), elevated expression of Ki67 by PD-1+ cells (Extended Data 4B, 4E), and the proportion of and number of PD-1hi, CTLA-4hi eTreg cells (Extended Data 4D). In Nur77-GFP reporter mice, this blockade increased the proportion of eTreg cells (Nur77+, CD11ahi, Ki67+ which expressed PD-1, CTLA-4 and KLRG1 but were CD25lo, (Extended Data 4A–C). There was also an increase in the population of IL-10+ Treg cells (Figure 2C) and, consistent with the ability of IL-10 to limit costimulation, cDC2s and macrophages expressed decreased levels of CD80 (Figure 2D). Similarly, Pdcd−/− mice at homeostasis had an increase in the total number of Treg cells, Ki67+ Tregs, and an increased population of CD25lo, BCL-2lo eTreg cells (Extended Data 5) that correlated with increased production of IL-10 and reduced cDC2 expression of CD80 (Extended Data 5E–F). Thus, at homeostasis, constitutive levels of PD-L1 do not affect cTreg cells but constrain the PD-1hi eTreg cell pool.
Figure 2: PD-1 signaling restrains eTreg populations at homeostasis.
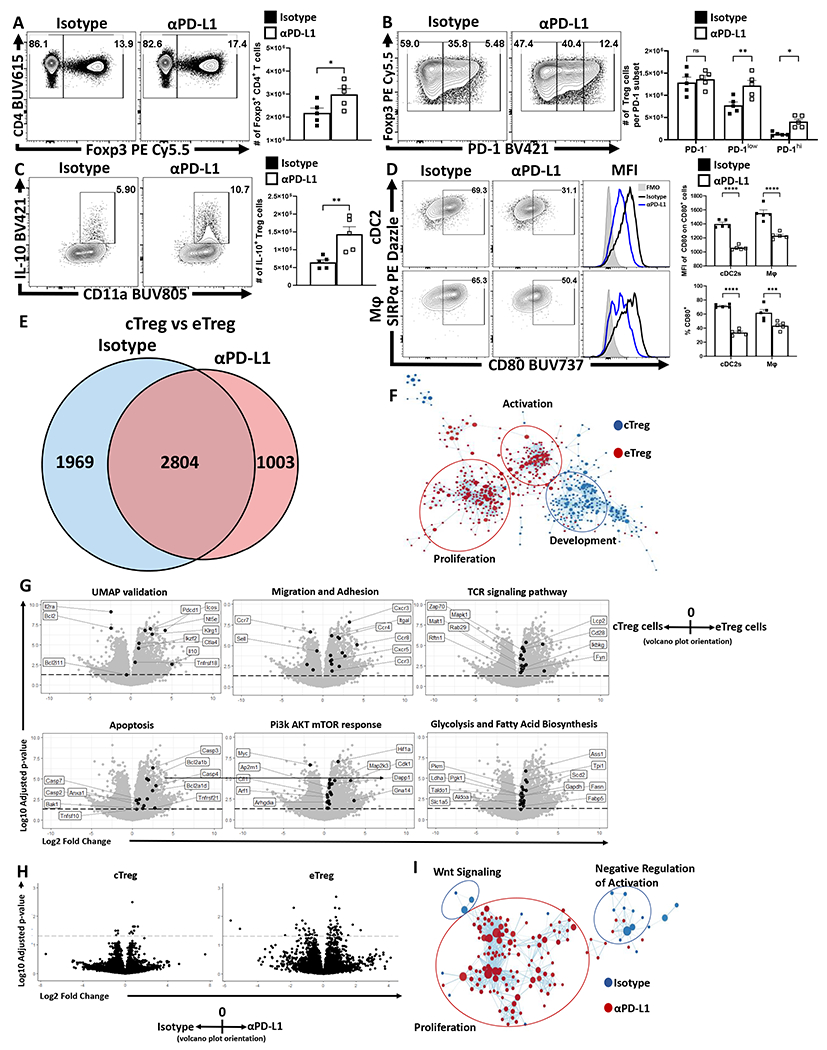
(A-D) Naïve 8-week old male C57BL/6 mice were intraperitoneally injected with IgG2b isotype antibody or anti-PD-L1 blocking antibody. After 72 hours, splenocytes were harvested and analyzed via high-parameter flow cytometry (A-D data presented are means +/− SEM and show individual data points). (A) Flow cytometry plots of CD4 cells depicting changes in the Foxp3+ subset following treatment (n = 4/group two-tailed unpaired student’s t test, * = p = 0.0395, 4 experimental replicates). (B) Plots of Treg cells depicting enrichment in the PD-1low, and PD-1hi subsets following PD-L1 blockade at homeostasis (n = 5/group, 2-way ANOVA with Fisher’s LSD individual comparisons test, * = p = 0.0298, ** = p = 0.0012, 4 experimental replicates). (C) Splenocytes from these treated cohorts were also incubated with PMA/ionomycin and then stained for cytokine production of IL-10. Cytokine staining data depicting an increase in Treg expression of IL-10 following PD-L1 blockade treatment (n = 5/group two-tailed unpaired student’s t-test, ** = p = 0.0072, 4 experimental replicates). (D) Plots depicting the CD80+ proportions of cDC2s (CD3−, B220−, CD19−, NK1.1−, Ly6G−, CD64−, CD11c+, MHC-II+, SIRPα+) and macrophages (CD3−, B220−, CD19−, NK1.1−, Ly6G−, CD64+, CD11b+, MHC-II+, Ly6Clow), with subsequent MFI comparisons of CD80 expression on CD80+ cells (n = 5/group, 2-way ANOVA with Sidak’s multiple comparisons test, *** = p = 0.0007, **** = p < 0.0001, 3 experimental replicates). (E-F) Splenocyte derived Treg cells were isolated from naïve 9-week old male Foxp3EGFP mice following 72 hour isotype or PD-L1 blockade treatment (n = 4/group) were double sorted into cTreg (CD25+ PD-1−) and eTreg (CD25− PD-1+) subsets for RNAseq analysis. (E) Transcriptomic data was normalized across biological replicates and compared for differentially expressed genes between cTreg and eTreg pools, and then specific differences were identified comparing cTreg to eTreg cells within isotype or PD-L1 blockade treated hosts (Linear-fit model with Benjamini-Hochberg correction, p < 0.05, log2 fold change > 0.3). (F) GSEA analysis matrix plot depicting transcriptomic divergence of cTreg and eTreg cells between pathways of proliferation, activation, and development. (G) Volcano-plot comparisons of significant transcript differences in relation to previously identified proteins via flow cytometry (UMAP validation), gene signatures associated with migration and adhesion, TCR signaling, apoptosis, Pi3k/AKT/mTOR, and glycolysis, cTreg values are depicted to the left of 0 on the x-axis, and eTreg values are on the right of 0 on the x-axis (Linear-fit model with Benjamini-Hochberg correction, p < 0.05 = threshold line). (H) Volcano-plot comparisons of cTregs (left plot) and eTregs (right plot) depicting the impact of anti-PD-L1 blockade treatment (cells from isotype treated hosts on the left of 0 on the x-axis, and cells from anti-PD-L1 treated hosts on the right of the x-axis) (Linear-fit model with Benjamini-Hochberg correction, p < 0.05 = threshold line). (I) GSEA analysis examining the impact of anti-PD-L1 blockade on eTregs, demonstrating changes to Wnt signaling, proliferation, and negative regulation of activation transcripts with treatment.
To understand the differential impact of PD-L1 blockade on cTreg and eTreg, Foxp3EGFP mice were treated with an isotype control or anti-PD-L1. After three days cTreg and eTreg cells were used for bulk RNAseq (Extended Data 4F). Comparisons of transcriptomic data between cTreg and eTreg cells from both isotype and PD-L1 blockade resulted in 2804 genes with significantly different expression regardless of treatment (Figure 2E). There were an additional 1969 genes with different expression between cTreg and eTreg cells in isotype treated hosts, while PD-L1 blockade resulted in an additional unique set of 1003 differently expressed genes (Figure 2E). The use of Gene Set Enrichment Analysis (GSEA) to compare expression trends amongst significantly different gene signatures between cTreg and eTreg cells, revealed marked enrichment of development and morphogenesis related gene sets (Sox9, Wnt3, Wnt4, Ntn4, Plag1, Tp63, and Pbx1) in cTregs suggesting early stem-cell like properties. Conversely, eTreg cells were enriched for transcripts associated with activation such as Zap70, Fyn, and Pi3k/Akt/mTOR downstream proteins, and proliferation associated transcripts involving spindle assembly and DNA replication (Figure 2F). Volcano-plot comparisons (Figure 2G) of transcript differences in cTreg (values to the left of 0 on the x-axis) to eTreg cells (values to the right of 0 on the x-axis) provided transcriptional confirmation to trends previously identified in Figure 1D–1F. Thus, cTreg cells were enriched for IL2ra and Bcl2 transcripts, while eTreg cells were enriched for transcripts downstream of Treg activation that included Pdcd1, ICOS, Ctla4, Tnsfrsf18, Nt5e, IL10, and Klrg1. In addition, eTreg subsets were enriched for TCR signaling transcripts (Zap70, Cd3e, Lime1, Ptprc, Cd28, Mapk1, Themis2, Fyn, and Irf4) and those linked to migration and adhesion and significant increases in metabolic (e.g. Pck2, Ldha, Cpt1a, and Ass1), apoptotic (e.g. Pmaip1, Bak1, and caspases), and proliferative/growth transcripts related to the Pi3K/Akt/mTOR pathway (e.g. Cdk1, Mapk1, Map2k3, and Myc). Thus, compared to cTreg cells, the eTreg subset is characterized by constitutive activation, metabolic function, and entry into the cell cycle.
Next, the impact of anti-PD-L1 on the transcriptional profile of cTreg and eTreg was assessed via volcano-plot comparisons of isotype treated hosts (values to the left of 0 on the x-axis) and αPD-L1 treated hosts (values to the right of 0 on the x-axis). These comparisons demonstrated minimal impact of PD-L1 blockade on cTreg transcriptional profiles, but a marked effect on the eTreg subset (Figure 2H). Further GSEA analysis demonstrated that αPD-L1 treated eTreg cells have downregulated Wnt signaling transcripts, a pathway that mediates disruption of Foxp3 transcriptional activity and negatively modulates Treg suppressive function32 (Figure 2I). Additionally, eTreg cells from isotype treated hosts had enrichment for transcripts associated with negative regulation of activation (e.g. Anxa1, Cd59, Cd300a, and Tnfrsf21), which indicates that eTreg cells are receiving activation signals while also experiencing ongoing restriction of function and proliferation. These data sets highlight differences between cTreg and eTreg and that constitutive PD-1/PD-L1 interactions limit eTreg cell proliferation and suppressive functions.
TCR signals maintain eTreg cell populations at homeostasis
Because PD-1 antagonizes TCR activation and CD28 costimulation20,21 studies were performed to evaluate the contribution of TCR activation to eTreg maintenance. In naïve mice, abrogation of downstream TCR signaling in mice treated with FK506 (tacrolimus) for 96 hours resulted in a reduction in the proportion and number of splenic Treg cells (Figure 3A), with preferential loss of the PD-1+ eTreg subset (Figure 3B). This short-term treatment did not impact the existing populations of activated Tconv CD4+, and CD8+ T cells, but did reduce the numbers of activated CD44hi, CD11ahi Treg cells (Figure 3C) and their expression of Ki67 (Extended Data 4G). Division of the Treg cell compartment into PD-1-, PD-1lo, and PD-1hi subsets revealed that FK506 treatment did not impact the Ki67+ PD-1- Treg cell pool but the significant reduction in Ki67+ Treg cells was due to reductions in the PD-1+ subset (Figure 3D). The ability of FK506 to reduce the activated Treg cells coincided with a reduction in the number of eTreg cells (PD-1+, CTLA-4hi), and a loss of IL-10+ Treg cells (Figure 3E–F). These results suggest that at homeostasis eTreg cells are more dependent than cTregs on constitutive TCR signals and would be sensitive to mechanisms that reduce T cell activation signals.
Figure 3: TCR signals are necessary to maintain eTreg populations at homeostasis.
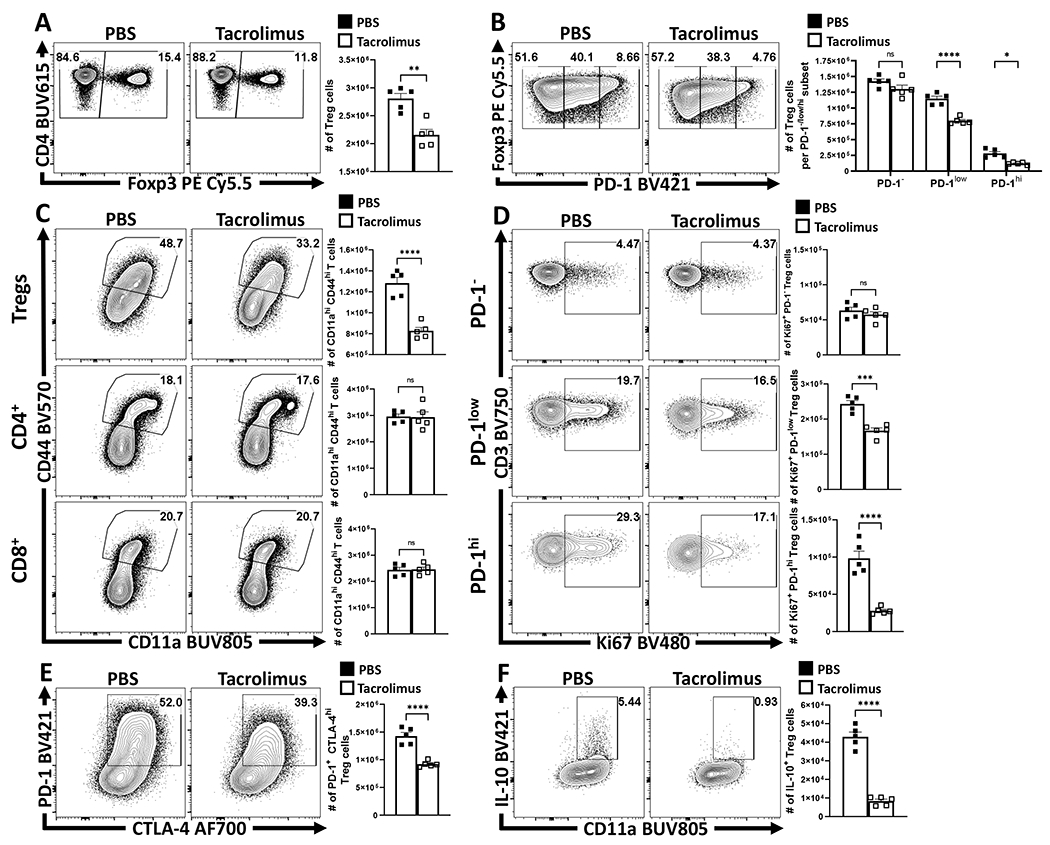
Cohorts of 8 week-old male C57BL/6 mice (n = 5/group) were treated once daily for 4 days with subcutaneous injections of PBS or Tacrolimus (FK506), and splenocytes were harvested and analyzed via high-parameter flow cytometry (2 experimental replicates). (A) Plots depicting drop in proportion and number of Treg cells with FK506 treatment (two-tailed unpaired student’s t-test, ** = p = 0.0012). (B) Plots depicting further changes to the Treg cell compartment in context of PD-1−, PD-1low, PD-1hi subsets (2-way ANOVA with Sidak’s multiple comparisons test, * = p = 0.0162, **** = p < 0.0001). (C) Plots depicting proportion and numbers of activated (CD44hi CD11ahi) Treg, Foxp3− CD4+ Tconv, and CD8+ T cells between PBS and FK506 treated hosts (two-tailed unpaired student’s t-test, **** = p < 0.0001). (D) Plots depicting changes proportion and number of Ki67+ Treg cells amongst PD-1−, PD-1low, PD-1hi subsets (two-tailed unpaired student’s t-test, *** = p = 0.0003, **** = p < 0.0001). (E) Plots demonstrating changes to the PD-1+ CTLA-4hi Treg cell subset following FK506 treatment (two-tailed unpaired student’s t-test, **** = p < 0.0001). (F) Cytokine stain plots of IL-10 on Treg cells from PBS and Tacrolimus hosts (two-tailed unpaired student’s t-test, **** = p < 0.0001). All data presented are means +/− SEM and show individual data points.
Infection–induced IFN-γ upregulates PD-L1, limiting PD-1+ eTregs
Infection with T. gondii stimulates cDC1 production of IL-12 that promotes secretion of IFN-γ, a cytokine that signals through STAT1 and which can upregulate PD-L1 expression in other settings33. This infection is also accompanied by a collapse in Treg cell populations associated with CD4+ T cell-mediated immunopathology26,27. To determine if these phenomena are related, studies were performed to assess whether infection-induced IFN-γ drives expression of PD-L1 and if disruption of this pathway impacts the Treg populations. Therefore, mice infected with T. gondii were treated with an isotype or αIFN-γ blocking antibody. In naive hosts, basal PD-L1 was detected on multiple cell types (neutrophils, cDCs, monocytes, macrophages, and Treg cells) in the spleen (Extended Data 6A) and peritoneum (Figure 4A), with the highest levels of PD-L1 expression on cDC2s and macrophages (Figure 4A). As early as 72 hours following infection with T. gondii, there was expansion of the macrophage and monocyte compartments which expressed high levels of PD-L1 (Figure 4A) that dominated other cellular sources of this ligand. In infected hosts treated with αIFN-γ there was a failure to upregulate PD-L1 expression (Figure 4A). When mice which lacked STAT1 in DC or myeloid cells (STAT1flox/flox x ITGAXcre and STAT1flox/flox x LysMcre) respectively were infected, there was a significant reduction in the upregulation of PD-L1 on the relevant cell lineages, but PD-L1 expression was preserved on other cell types (Figure 4B, Extended Data 6B). In these experiments, by day 7 post infection there was a marked loss of Treg cells in control and STAT1flox/flox x ITGAXcre mice, but the crash was absent in the STAT1flox/flox x LysMcre hosts (Figure 4C). Thus, despite normal levels of PD-L1 on other cell types, the loss of PD-L1 on macrophage/monocyte populations correlated with the increase in the number of eTreg cells (Figure 4D). These observations indicate that heightened IFN-γ-STAT1 signaling promotes macrophages and monocyte expression of PD-L1 which contributes to the infection-induced crash of Treg cells.
Figure 4: Infection–induced IFN-γ promotes upregulation of myeloid PD-L1 via STAT1, which limits PD-1+ eTreg cells.
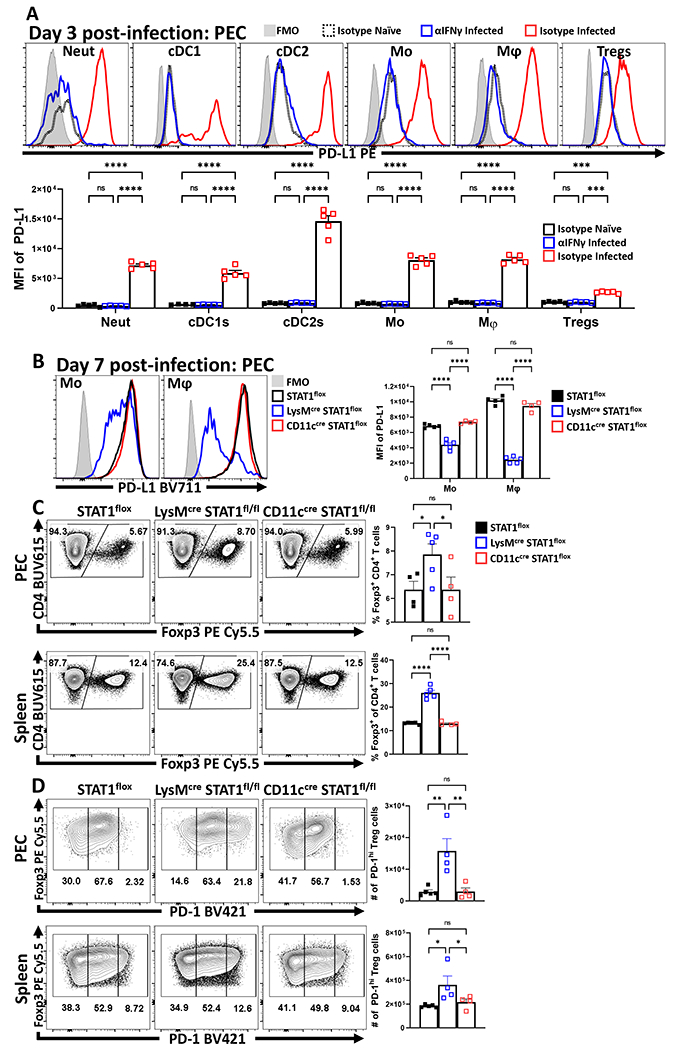
Cohorts of 8 week-old male C57BL/6 mice (n = 10/group) were treated with an isotype antibody or IFNγ blocking antibody and half (n = 5) of each group were infected with T. gondii intraperitoneally (IP). Splenocytes and Peritoneal exudate cells (PEC) were isolated 72 hours later and analyzed via high-parameter flow cytometry (2 experimental replicates). (A) Comparative histograms evaluating changes in the MFI of PD-L1 expression amongst PEC between experimental groups within leukocyte subsets: neutrophils (CD3−, B220−, CD19−, NK1.1−, Ly6G+, Ly6C+, CD11b+), cDC1s (CD3−, B220−, CD19−, NK1.1−, Ly6G−, CD64−, CD11c+, MHC-II+, XCR1+), cDC2s (CD3−, B220−, CD19−, NK1.1−, Ly6G−, CD64−, CD11c+, MHC-II+, SIRPα+), monocytes (CD3−, B220−, CD19−, NK1.1−, Ly6G−, CD64+, CD11b+, MHC-II+, Ly6C+), macrophages (CD3−, B220−, CD19−, NK1.1−, Ly6G−, CD64+, CD11b+, MHC-II+, Ly6C−) and Treg cells (B220−, CD19−, Ly6G−, NK1.1−, CD3+, CD4+, Foxp3+) (n = 5/group, 2-way ANOVA with Tukey’s multiple comparisons test *** = p < 0.001, **** = p < 0.0001, 2 experimental replicates). (B-C) 8 week-old female STAT1flox mice (n = 5) in addition to STAT1flox mice crossed onto either the LysMcre (n = 5) or CD11ccre (n = 4) background were infected with 20 cysts of ME49 IP. Splenocytes and PEC were harvested on day 7 of infection and analyzed via flow-cytometry. (B) Histogram comparisons of PD-L1 MFI changes in monocytes and macrophages following conditional deletion of STAT1 (2-way ANOVA with Tukey’s multiple comparisons test, **** = p < 0.0001, 2 experimental replicates). (C) Plots of CD4+ T cells from PEC and spleen depicting proportional changes to Treg cell populations in context of conditional STAT1 deletion (1-way ANOVA with Fisher’s LSD individual comparisons test, * = p = 0.0414, **** = p < 0.0001, 2 experimental replicates). (D) Plots of Treg cells from PEC and spleen depicting changes in the number of PD-1hi Treg cell subsets from STAT1flox mice (n = 5), STAT1flox x LysMcre (n = 4), STAT1 x CD11ccre (n = 4) (1-way ANOVA with Fisher’s LSD individual comparisons test, * = p < 0.05, ** = p < 0.01, 2 experimental replicates). All data presented are means +/− SEM and show individual data points.
PD-L1 blockade mitigates infection-induced eTreg depletion
To evaluate the impact of PD-L1 on Treg subsets during toxoplasmosis , mice were treated with an isotype control or αPD-L1 blocking antibody 24 hours prior to challenge, and re-dosed with antibody every 72 hours until day 10 of infection. While infection resulted in a marked decrease in the number of Treg cells, treatment with anti-PD-L1 mitigated the infection-induced loss of Treg cells in the spleen (Figure 5A; Extended Data 7E), and other sites of infection (Extended Data 7A–B). Similar results were observed with mice infected with L. monocytogenes (Extended Data 7E). Additional analysis revealed that infection with T. gondii resulted in a preferential loss of PD-1hi eTreg cells (Figure 5B) and was abrogated by PD-L1 blockade (Extended Data 7C–D). This preferential impact on eTreg cells was verified by the ability of anti-PD-L1 to increase numbers of PD-1+ CTLA4hi eTreg cells (Figure 5C) and the proportion of IL-10+ Treg cells (Figure 5D). The cTreg-associated expression of pro-survival BCL-2 was not enhanced by PD-L1 blockade (Figure 5E), despite overall increased Treg cell number. This analysis also revealed that infection resulted in Treg cells that were characterized by deceased expression of pro-survival BCL-2 and increased levels of the pro-apoptotic BIM. While PD-L1 blockade did not affect BCL-2 it did decrease levels of BIM (Figure 5F). Thus, PD-1 restricts the ability of eTreg cells to proliferate and in infected hosts treated with anti-PD-L1 there was an increase in the proportion and number of cMyc+, Ki67+ Treg cells (Figure 5G). Additionally, IL-10 is an important antagonist of IL-12 production during toxoplasmosis34 and PD-L1 blockade resulted in increased numbers of IL-10+ eTreg cells (Fig 5D) and a marked reduction in the proportion of IL-12+ cDC1s (Figure 5H). In additional experiments, the use of αIL-10r resulted in partial amelioration of the αPD-L1 driven reductions in CD80+ CD86+ cDC2 subsets (Extended Data 7F). Since signals through PD-1 limit effector T cell responses, including production of IL-235, it was possible that systemic blockade of PD-L1 during infection would result in enhanced parasite-specific CD4+ T cell responses and increased IL-2 that preserve the Treg cell populations. However, while infection resulted in reduced T cell production of IL-2, blockade of PD-L1 did not reverse this effect (Figure 5I). These data sets indicate that PD-L1 blockade during infection results in enhanced eTreg cell functions and expression of IL-10 and this is not due to a restoration of IL-2 production.
Figure 5: PD-L1 blockade ameliorates the crash of PD-1+ eTreg cells during the acute phase of infection.
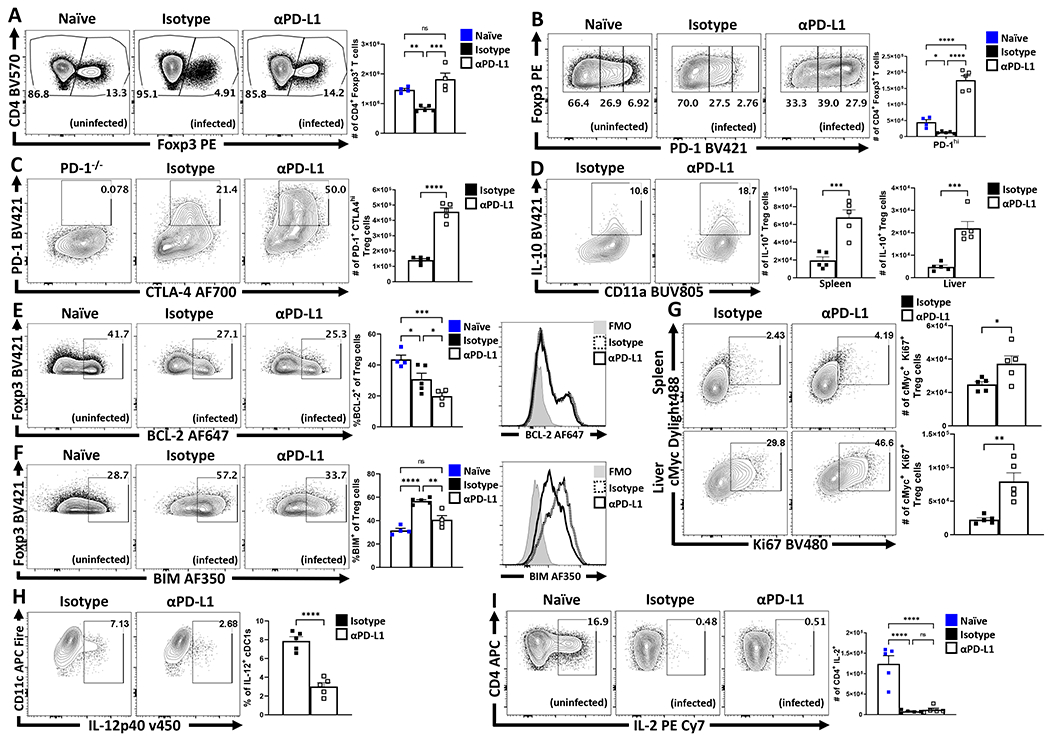
(A-I) Cohorts of 9 week-old female C57BL/6 mice were treated with an isotype antibody or PD-L1 blocking antibody 24 hours prior to infection with T. gondii IP. The antibody treatments were repeated every 72 hours throughout the course of infection until the mice were euthanized on day 10 and PEC, spleen, and liver were harvested and analyzed via high-parameter flow cytometry. (A) Flow plots of bulk CD4+ T cells with subsequent gates on the Foxp3+ T cells (Treg cells), demonstrating the drop in Treg cells comparing naïve mice (n = 4) from homeostatic levels during infection in isotype treated hosts (n = 5), and the maintenance of Tregs during infection with PD-L1 blocking antibody (n = 4) treatment (1-way ANOVA with Tukey’s multiple comparisons test, ** = p < 0.01, *** = p < 0.001, 4 experimental replicates). (B) Flow plots of Treg cells from naïve (n = 4), infected isotype treated (n = 5) and infected PD-L1 blockade treated (n = 5) groups showing enrichment of PD-1hi Treg compartment as a consequence of PD-L1 blockade treatment during infection (1-way ANOVA with Fisher’s LSD individual comparisons test, * = p = 0.0438, **** = p < 0.0001, 4 experimental replicates). (C) Flow data for the co-expression of PD-1 and CTLA-4 on bulk Treg cells comparing the number of PD-1+ CTLA-4hi Treg cells (eTreg-associated) from animals from the infected groups, using cells from a PD-1−/− host as a gating control (n = 5/group two-tailed unpaired student’s t-test, **** = p < 0.0001, 4 experimental replicates). (D) Cells from spleen and liver from each group were stimulated and stained for cytokines, depicted here is IL-10 staining of Treg cells and total number of IL-10+ Treg cells in context of PD-L1 blockade (n = 5/group two-tailed unpaired student’s t-test, spleen *** = p = 0.0009, liver *** = p = 0.0006, 4 experimental replicates). (E-F) Flow cytometry analysis of anti-apoptotic BCL-2 (E), and BIM (F) expression on bulk Treg cells between uninfected (n = 4), infected isotype treated (n = 5), and infected PD-L1 blockade treated (n = 4) groups of mice (1-way ANOVA with Fisher’s LSD individual comparisons test, * = p < 0.05, ** = p < 0.01,*** = p < 0.001, **** = p < 0.0001, 3 experimental replicates). (G) Plots depicting the proportion and number of Ki67+ cMyc+ Treg cells in spleen and liver from infected hosts (n = 5/group two-tailed unpaired student’s t-test, spleen * = p = 0.0376, liver ** = p = 0.0025, 2 experimental replicates). (H) Plots of PEC-derived cDC1s (CD3−, B220−, CD19−, NK1.1−, Ly6G−, CD64−, CD11c+, MHC-II+, XCR1+) depicting changes in IL-12p40 expression (n = 5/group two-tailed unpaired student’s t-test, **** = p < 0.0001, 2 experimental replicates). (I) Intracellular stain for IL-2 on bulk Tconv cells (CD3+ CD4+ Foxp3−) from naïve hosts, and infected hosts treated with isotype or PD-L1 blocking antibody (n = 5/group, 1-way ANOVA with Tukey’s multiple comparisons test, **** = p < 0.0001, 4 experimental replicates). All data presented are means +/− SEM and show individual data points.
Impact of PD-L1 blockade on parasite-specific effector T cells
Parasite-specific effector CD4+ T cells produce IFN-γ required for resistance to T. gondii but the weight loss that accompanies this infection can be mediated by enhanced parasite replication, or as result of the CD4+ T cell response which is regulated by IL-1034. Analysis of infected mice treated with αPD-L1 revealed that this intervention resulted in reduction of parasite-specific CD4+ and CD8+ T cells (Figure 6A – 6D). While infection leads to acute weight loss mediated by CD4+ T cells, PD-L1 blockade antagonized the weight loss and resulted in improved physical condition (Figure 6E) but was not associated with alterations in parasite burden (Figure 6F). Since Treg cell production of IL-10 antagonizes infection-induced immune pathology, mice were treated with anti-PD-L1 alone or in combination with anti-IL-10r. In these experiments, the protective effects of αPD-L1 against infection-driven weight loss were antagonized by αIL-10r (Figure 6G). Moreover, while αPD-L1 treatment alone resulted in significant reduction in the magnitude of the Tbet+ IFN-γ+ Th1 CD4+ Tconv cells, treatment with αIL-10r antagonized this effect (Figure 6H). The impact of these treatments on the CD4+ T cell compartment are most apparent when comparing the ratio of Teff (Foxp3- CD11ahi Tbet+) to eTreg cells (Foxp3+ CTLA-4hi ICOS+). Thus, infection results in a high Teff : Treg ratio that is reduced following PD-L1 blockade which in turn was negated by co-administration of αIL-10r (Figure 6I). Similarly, the comparison of infected WT and Pdcd−/− mice, demonstrated that absence of PD-1 resulted in the preservation of Treg cells, an enrichment of the eTreg-associated phenotypes (CD25lo, BCL-2lo, ICOS+, CTLA-4hi), an increase in the number of IL-10+ Treg cells and a reduction in the proportion of activated cDC2s, decreased number of Tbet+ KLRG1+ parasite-specific CD4+ T cells, but no significant differences in parasite burden (Extended Data 8). Thus, PD-L1 blockade or loss of PD-1 did not result in increased CD4+ T cell effector responses, but rather was associated with enhanced eTreg activity and reduced systemic pathology.
Figure 6: Impact of PD-L1 blockade on effector T cell responses during infection.
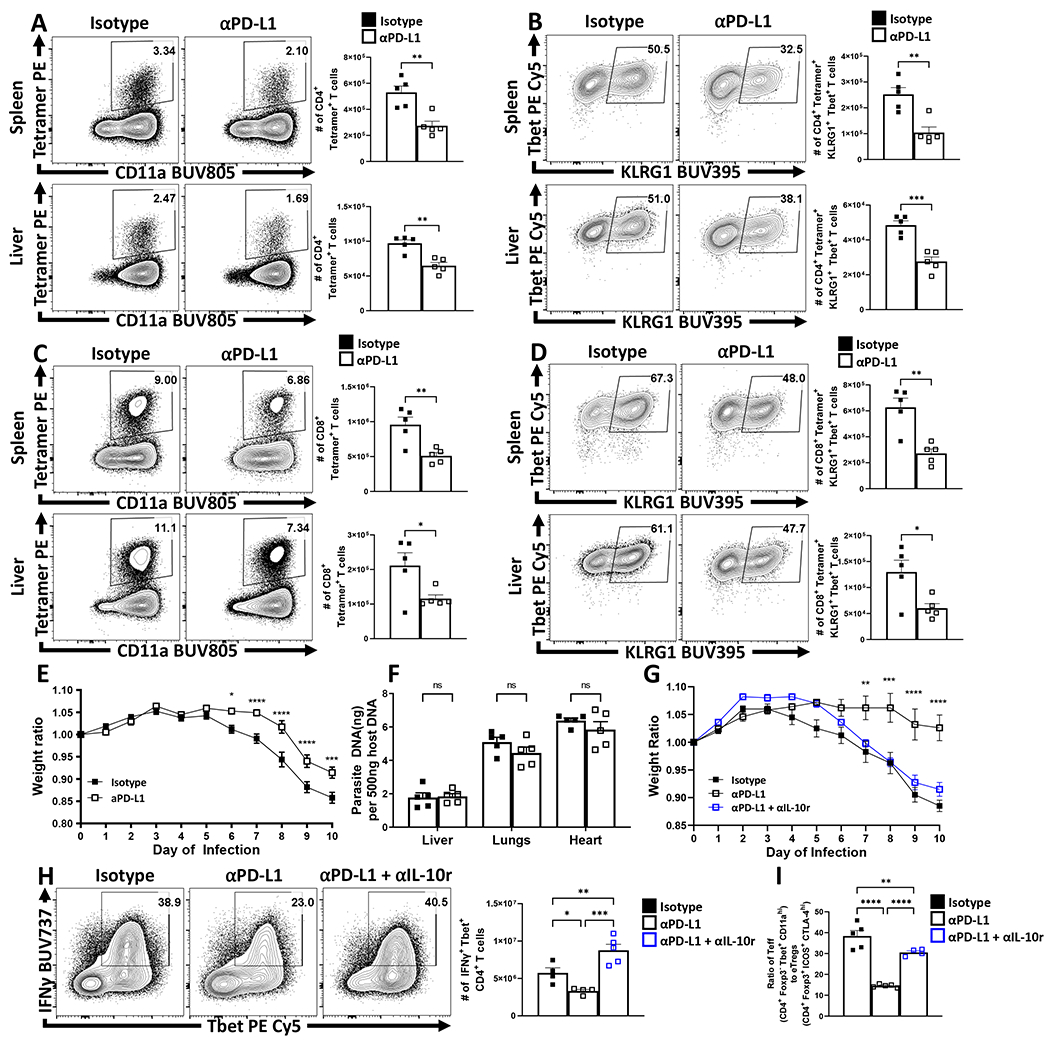
(A-E) Cohorts of 8 week-old male C57BL/6 mice were treated with an isotype antibody or PD-L1 blocking antibody 24 hours prior to infection with T. gondii IP. The antibody treatments were repeated every 72 hours throughout the course of infection until the mice were euthanized on day 10 and spleen, and liver were harvested and analyzed via high-parameter flow cytometry. (A) Plots depicting parasite-specific AS15:I-Ab tetramer staining on CD4+ Tconv cells vs CD11a expression between the isotype and anti-PD-L1 treated groups (n = 5/group, two-tailed unpaired student’s t-test, spleen ** = p = 0.0027, liver ** = p = 0.0014, 4 experimental replicates). (B) Plots of Tbet and KLRG1 expression amongst AS15:I-Ab+ Tconv cells, with a decrease in the proportion and number of Tbet+, KLRG1+ cells as result of PD-L1 blockade treatment (n = 5/group, two-tailed unpaired student’s t-test, spleen ** = p = 0.0026, liver *** = p = 0.0004, 4 experimental replicates). (C) Plots depicting parasite-specific tgd057:Kb tetramer staining on CD8+ Tconv cells between isotype and anti-PD-L1 treated groups (n = 5/group, two-tailed unpaired student’s t-test, spleen ** = p = 0.0053, liver * = p = 0.0387, 4 experimental replicates). (D) Plots of Tbet and KLRG1 expression amongst tgd057:Kb+ CD8+ T cells, depicting a decrease in the proportion and number of Tbet+, KLRG1+ cells as result of PD-L1 blockade treatment (n = 5/group, two-tailed unpaired student’s t-test, spleen ** = p = 0.0020, liver * = p = 0.0207, 4 experimental replicates). (E) X-Y plot of daily weight change ratios comparing weight loss between isotype or PD-L1 blockade treatment groups during the acute phase of infection (n = 10/group, two-tailed multiple unpaired t tests with Holm-Sidak’s correction for multiple comparisons, * = p = 0.0159, *** = p = 0.0002, **** = p < 0.0001, 4 experimental replicates). (F) qPCR analysis of liver, lung, and heart samples at day 10 of infection from isotype and anti-PD-L1 treated groups (n = 5/group, 2-way ANOVA with Sidak’s multiple comparisons test, 4 experimental replicates). (G-I) Cohorts of 9 week-old male C57BL/6 mice were treated with an isotype antibody, PD-L1 blocking antibody, or a combination of blocking anti-IL-10r/anti-PD-L1 blocking antibodies 24 hours prior to infection with 20 cysts of ME49 IP. The antibody treatments were repeated every 72 hours throughout the course of infection until the mice were euthanized on day 10 and spleen, and liver were harvested and analyzed via high-parameter flow cytometry. (G) X-Y plot of daily weight change ratios comparing mouse weight loss between isotype (n = 4), PD-L1 blockade (n = 4), or combination IL-10r and PD-L1 blockade treatment (n = 5) groups during the acute phase of infection (two-tailed multiple unpaired t tests with Holm-Sidak’s correction for multiple comparisons, ** = p = 0.0043, *** = p = 0.0002, **** = p = 0.0001, 2 experimental replicates) (H) Splenocytes from cohorts infected 9 week-old male C57BL/6 mice treated with isotype antibody (n = 4), PD-L1 blocking antibody (n = 4), and combination IL-10r and PD-L1 blocking antibody (n = 5), were stimulated with PMA/Ionomycin and stained for IFN-γ, comparing the magnitude of the Th1 response by evaluating the proportion and number of IFN-γ+ Tbet+ CD4+ Tconv cells (1-way ANOVA with Fisher’s LSD individual comparisons test, * = p = 0.0371, ** = p = 0.0082, *** = p = 0.0001, 2 experimental replicates). (I) Bar graph comparing ratios of CD4+ Teff (Foxp3− Tbet+ CD11ahi) vs eTreg cells (Foxp3+ ICOS+ CTLA-4hi) within hosts from each of the treated groups Isotype treated (n = 5), PD-L1 blockade treated (n = 5), and combo IL-10r and PD-L1 blockade treated (n = 4) (1-way ANOVA with Fisher’s LSD individual comparisons test, ** = p = 0.0093, **** < p = 0.0001, 2 experimental replicates). All data presented are means +/− SEM and show individual data points.
Deletion of PD-1 in Treg cells increases Treg activities
While the blockade of PD-L1 or total loss of PD-1 affects eTreg populations, these effects could be mediated through other immune cell populations. To determine if the ability of PD-1 to limit Treg cell responses was intrinsic to Treg cells, Pdcdflox/flox x Foxp3Cre mice were generated as described36. These mice showed normal expression of PD-1 on effector T cell populations while the Treg cell population lacked PD-1 (Figure 7A). At homeostasis, these mice had an increased number of total Treg cells (Figure 7B) associated with preferential expansion of the eTreg population (Figure 7C–D). Thus, PD-1 was not required to generate eTreg cells, but expression of PD-1 does limit the eTreg cell pool. In response to infection with T. gondii, Pdcdflox/flox x Foxp3Cre mice did not undergo Treg cell collapse (Figure 7E) and maintained an enhanced proportion of eTreg cells (defined in the absence of PD-1 as ICOS+, CTLA-4+, CD25lo, BCL-2lo) (Figure 7F–G). Congruent with the previous experiments, there was an increase in the number of IL-10+ Treg cells and a reduction in the number of activated cDC2s (Figure 7H–I), and a reduced population of IL-12+ cDC1s (Figure 7J). Analysis of the CD4+ T cell effector responses revealed no evidence of increased IL-2 production (Figure 8A). However, in context of the enhanced eTreg compartment, there was a reduction in the number of parasite-specific CD4+ T cells (Figure 8B,C). Moreover, the parasite-specific CD4+ Tconv compartment (Figure 8B) was profoundly impacted with decreased Tbet expression and total number of Tbet+ KLRG1+ T cells (Figure 8D–E). In contrast to the studies with the PD-L1 blockade or Pdcd−/− mice, the lineage specific deletion of PD-1 from Treg cells resulted in increased weight loss (Figure 8F), but a marked reduction in pathology in the liver (Figure 8G). Despite the reduced immunopathology, the decreased T cell responses were associated with an increase in parasite burden (Figure 8H).
Figure 7: Treg cell-specific deletion of PD-1 enhances eTreg cell populations at homeostasis and prevents Treg cell depletion during infection.
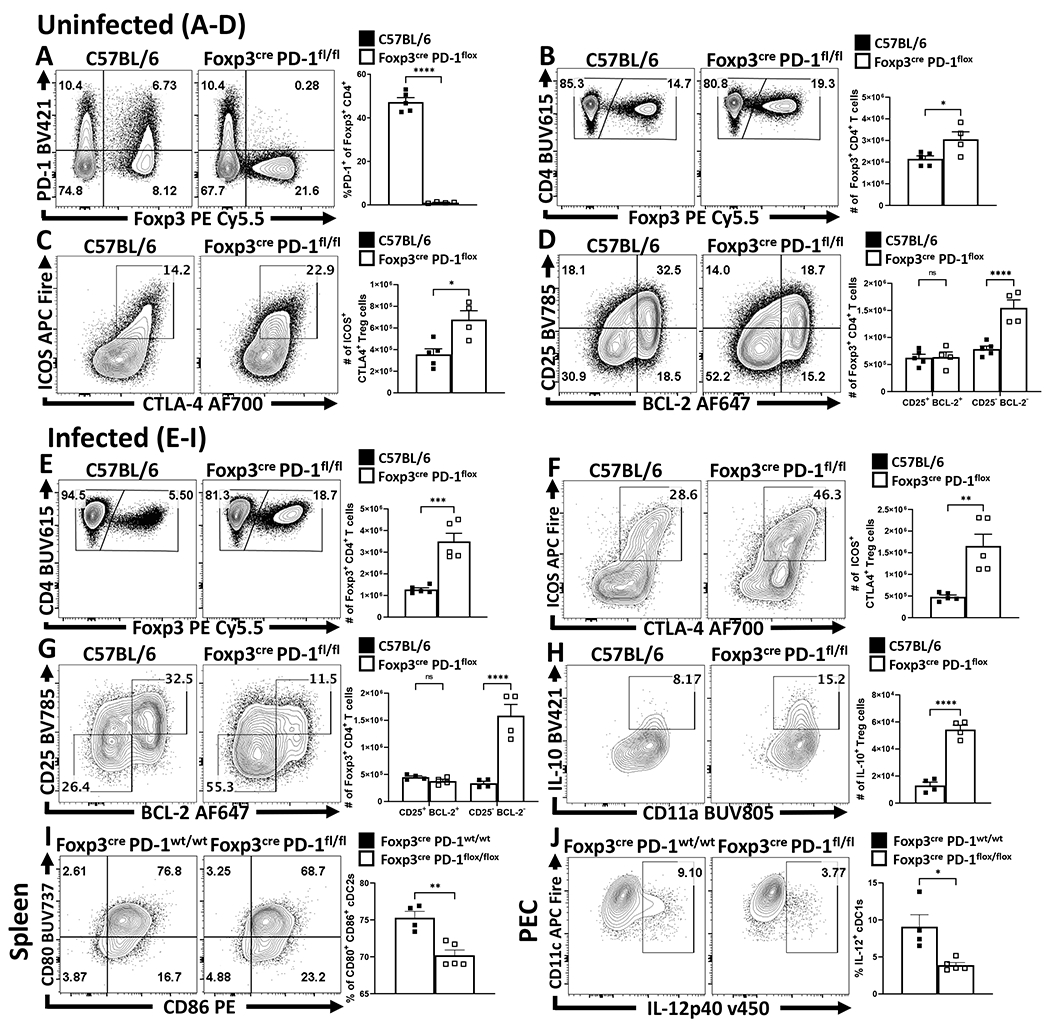
(A-D) Splenocytes were harvested from naïve 8 week-old male C57BL/6 (n = 5) and Foxp3cre x PD-1flox/flox mice (n = 4) and then stained and analyzed via flow cytometry. (A) Flow cytometry plots depicting CD4+ T cells and their expression of Foxp3 and PD-1 to represent the Treg-specific deletion of PD-1, while also preserving the expression of PD-1 amongst Foxp3− Tconv cells (two-tailed unpaired student’s t-test, **** = p < 0.0001, 4 experimental replicates). (B) Comparisons of the number of Foxp3+ Treg cells between C57BL/6 and Foxp3cre x PD-1flox/flox mice, depicting an increase in the total number of Treg cells in naïve Foxp3cre x PD-1flox/flox mice at homeostasis (two-tailed unpaired student’s t-test, * = p = 0.0322, 4 experimental replicates). (C) Flow cytometry plots of ICOS and CTLA-4 expression on Treg cells demonstrating an increase in the proportion and number of eTreg-associated (ICOS+ CTLA-4hi) Treg cells in Foxp3cre x PD-1flox/flox mice (two-tailed unpaired student’s t-test, * = p = 0.0101, 4 experimental replicates). Subsequently, (D) demonstrates the increase in the size of the Treg pool in Foxp3cre x PD-1flox/flox mice is specific to the eTreg compartment (BCL-2low, CD25low), as the non-eTreg compartment (BCL-2hi, CD25hi) is consistent in number when compared to C57BL/6 mice (2-way ANOVA with Sidak’s multiple comparisons test, **** = p < 0.0001, 4 experimental replicates). (E-H) 8 week-old male C57BL/6 and Foxp3cre x PD-1flox/flox mice were infected with T. gondii IP. At day 10 of infection cells were harvested and analyzed via flow cytometry. (E) Flow plots of splenocytes from infected C57BL/6 (n = 5) and Foxp3cre x PD-1flox/flox (n = 5) mice depicting splenic CD4+ cells sub-gated on Treg cells, indicating preservation of the Treg compartment in Foxp3cre x PD-1flox/flox mice during infection (two-tailed unpaired student’s t-test, *** = p = 0.0004, 6 experimental replicates). (F) Flow plots of Treg cells from C57BL/6 (n = 5) and Foxp3cre x PD-1flox/flox mice (n = 5) depicting changes in the number of ICOS+ CTLA-4hi eTreg cells (two-tailed unpaired student’s t-test, ** = p = 0.0026, 5 experimental replicates). (G) Flow plots of Treg cells from C57BL/6 (n = 4) and Foxp3cre x PD-1flox/flox (n = 4) mice, demonstrating enrichment of BCL-2low, CD25low eTreg associated cells in Foxp3cre x PD-1flox/flox hosts (2-way ANOVA with Sidak’s multiple comparisons test, **** = p < 0.0001, 5 experimental replicates) following infection. (H) Intracellular cytokine staining for IL-10 on bulk Treg cells from C57BL/6 (n = 4) and Foxp3cre x PD-1flox/flox (n = 4) mice following PMA/Ionomycin stimulation, demonstrating an increase of IL-10+ Treg cells in Foxp3cre x PD-1flox/flox hosts (two-tailed unpaired student’s t-test, **** = p < 0.0001, 4 experimental replicates). (I-J) Comparisons of myeloid stains from 8 week-old male Foxp3cre x PD-1wt/wt (n = 4) and Foxp3cre x PD-1flox/flox (n = 5) hosts at day 10 of T. gondii infection. (I) Flow cytometry data of CD80 and CD86 expression amongst splenic cDC2s (two-tailed unpaired student’s t-test, ** = p = 0.0025, 4 experimental replicates). (J) Intracellular staining of IL-12p40 on PEC derived cDC1s (two-tailed unpaired student’s t-test, * = p = 0.0102, 2 experimental replicates). All data presented are means +/− SEM and show individual data points.
Figure 8: Treg cell-specific deletion of PD-1 results in reduction of parasite specific Th1 cells, and a systemic increase in parasite burden.
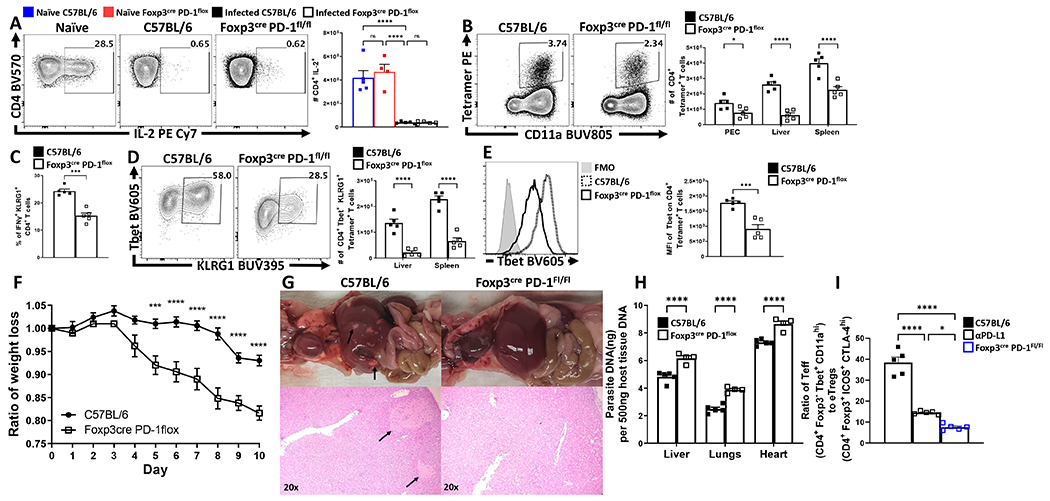
Bulk splenocytes harvested from 9 week-old uninfected and infected (day 10 of T. gondii infection) male C57BL/6 and Foxp3cre x PD-1flox/flox mice were stimulated with PMA/Ionomycin, permeabilized and stained for IL-2. (A) Intracellular cytokine staining for IL-2 expression on splenic CD4+ Tconv cells comparing changes between naïve C57BL/6 (n = 5) and Foxp3cre x PD-1flox/flox (n = 4) mice, to infected C57BL/6 (n = 5) and Foxp3cre x PD-1flox/flox (n = 5) (1-way ANOVA with Tukey’s multiple comparisons test, **** = p < 0.0001, 4 experimental replicates). (B) Exvivo flow cytometry data depicting activated parasite-specific CD4+ Tconv cells (Foxp3−, CD11ahi, AS15:I-Ab+), from C57BL/6 (n = 5) and Foxp3cre x PD-1flox/flox (n = 5) mice demonstrating a reduction in parasite specific T cells in Foxp3cre x PD-1flox/flox hosts across multiple tissues (2-way ANOVA with Sidak’s multiple comparisons test, * = p = 0.0335, **** = p < 0.0001, 4 experimental replicates). (C) Bar graph of cytokine stain data depicting splenic proportional changes in Th1 effector-associated IFN-γ+ KLRG1+ CD4+ Tconv cells (n = 5/group, two-tailed unpaired student’s t-test, *** = p = 0.001, 4 experimental replicates). (D) Plot depicting phenotypic changes via expression of Tbet and KLRG1 on liver and splenic derived AS15:I-Ab+ CD4+ Tconv cells (n = 5/group, 2-way ANOVA with Sidak’s multiple comparisons test, **** = p < 0.0001, 4 experimental replicates). (E) Histogram comparing Tbet expression on AS15:I-Ab+ CD4+ Tconv cells between groups (n = 5/group, two-tailed unpaired student’s t-test, *** = p = 0.0006, 4 experimental replicates). (F) X-Y plot of daily weight change ratios comparing weight loss between C57BL/6 (n = 5) and Foxp3cre x PD-1flox/flox (n = 5) hosts (two-tailed multiple unpaired t tests with Holm-Sidak’s correction for multiple comparisons, *** = p = 0.0002, **** = p < 0.0001, 4 experimental replicates). (G) Representative gross anatomy of 9 week-old male C57BL/6 (n = 5) and Foxp3cre x PD-1flox/flox (n = 4) pleural and peritoneal cavities (top), and H&E histological preparations of liver left lateral lobe at 20x magnification (bottom) with black arrows pointed at lesions at day 10 of infection T. gondii (3 experimental replicates). (H) qPCR analysis of parasite burden from liver, lungs, and heart tissue from C57BL/6 (n = 5) and Foxp3cre x PD-1flox/flox (n = 4) mice demonstrating an increase in parasite burden in Foxp3cre x PD-1flox/flox hosts (2-way ANOVA with Sidak’s multiple comparisons test, **** = p < 0.0001, 3 experimental replicates). (I) Bar graph comparing ratios of CD4+ Teff (Foxp3− Tbet+ CD11ahi) vs eTreg cells (Foxp3+ ICOS+ CTLA-4hi) within hosts from infected 9 week-old male C57BL/6, anti-PD-L1 treated, and Foxp3cre x PD-1flox/flox mice (n = 5/group, 1-way ANOVA with Tukey’s multiple comparisons test, * = p = 0.0250, **** = p < 0.0001, 3 experimental replicates). All data presented are means +/− SEM and show individual data points.
The loss of PD-1 during acute toxoplasmosis resulted in reduced immune pathology (based on gross histology) across all methods (blockade, total deletion, or Pdcdflox/flox x Foxp3Cre), but yielded different outcomes for gross weight loss and parasite burden. To understand why the blockade of PD-L1, loss of PD-1 or Treg specific PD-1 deletion produced varying outcomes, we compared the Effector T cell: eTreg ratios in each of these conditions. In a WT setting, infection resulted in the highest Teff: Treg ratio, while blockade of PD-L1 resulted in a decrease in this ratio (Figure 8I). However, the lowest Teff: Treg ratio was observed in the Pdcdflox/flox x Foxp3Cre mice and this ratio correlated with increased levels of parasite replication and weight loss. These results highlight that Treg cell expression of PD-1 has a physiological role in tuning the Teff:Treg ratios during infection that determining the balance between protective and pathological responses.
Discussion:
The initial perspective that PD-1 signaling promotes iTreg formation, and that PD-1 provided a mechanism for Treg cells to suppress immune activity26,37 has been altered with reports for certain cancers that PD-L1 blockade enhances function of PD-1hi Tregs associated with hyperprogression and metastasis without further tumor mutations18. Likewise, the clinical observations that PD-L1 blockade can augment Treg cell responses38 and that PD-1 blockade therapy is more effective when combined with strategies that also target Treg cells39 provides indirect evidence that PD-1 can inhibit Treg cells. Moreover, that targeted deletion of PD-1 from Treg cells results in reduced severity of experimental autoimmune encephalomyelitis (EAE)36 highlights that the inhibitory activity of PD-1 on Treg cells is not restricted to cancer. However, it seems unlikely that the ability of PD-1 to limit Treg cell activity evolved to promote cancer or autoimmunity. Treg cells function to limit a wide variety of immune mediated conditions but pathogens can benefit from their ability to dampen effector T cell responses24,25. Consequently, it has been proposed that the transient “crash” of Treg cells during systemic infection is a compromise that allows a balanced T cell response to emerge and infection-induced suppression of homeostatic IL-2 production contributes to this crash26,27. The data presented here reveal that at homeostasis PD-1 regulates Treg cell populations, during infection the production of IFN-γ drives increased PD-L1 levels which licenses PD-1 to acts as a rheostat that is sensitive to global levels of inflammation in order to contract the PD-1hi eTreg cell population.
The finding that pharmacological blockade of TCR stimulation at homeostasis leads to a reduction in the eTreg cell population (but not the cTreg cell subset) is relevant, because TCR stimulation promotes PD-1 expression16,39–41. The continuous interactions of DC with Treg cells is a process critical for Treg cell homeostasis31,42,43 and the presence of constitutive levels of PD-L1 on MHC-IIhi cDC2s and macrophages suggest that eTreg cells encounter TCR stimulation and PD-1 signaling simultaneously. Previous studies indicated that PD-1 restrains the PI3K-Akt pathway36 and the comparison of eTreg and cTreg before and after PD-L1 blockade also highlighted this pathway. However, PD-1 engagement had the greatest impact on networks associated with cell division and activation that appear constitutive at homeostasis. Thus, the link of PD-1 to transcriptional alterations in Pi3k/AKT/mTOR pathways and changes in Bcl-2 and BIM reinforce the influence of PD-1 on proliferation and survival. While the increase in eTreg cell proliferation after short term PD-L1 blockade is likely accompanied by alterations in cellular activity, the dominant amplification of cell cycle gene sets compared to metabolic related genes sets did not identify a clear PD-1-mediated impact on Treg cell metabolism.
In many infectious systems, Tregs and the production of IL-10 determine the balance between protective and pathological responses and too many Treg cells or IL-10 can be associated with decreased DC function, reduced effector responses and increased microbial replication34,44,45. This is exemplified during toxoplasmosis where the systemic inflammatory response promotes parasite control but can result in CD4+ T cell mediated immunopathology. In this setting, IL-10 and Treg cells limit the magnitude of the DC and effector T cell responses and prevent immunepathology14,27. This continuum is reflected in our data sets derived from Pdcd−/− mice or those undergoing PD-L1 blockade which are characterized by increased eTreg cell populations, a reduction in the parasite-specific CD4+ T cell responses and reduced immunopathology but the immune response is sufficient for parasite control. A similar phenotype (increased Tregs, reduced immunopathology) was observed with the Pdcdflox/flox x Foxp3Cre mice, but these mice had the lowest Teff:Treg ratio, which was accompanied by increased parasite replication. This continuum reinforces the importance of Teff : Treg ratios on the balance between pathological and protective responses during infection and is analogous to the hyper-progressive disease observed in certain cancer patients treated with anti-PD-L1 associated with reductions in Teff: Treg ratios17.
Many studies on the biology of PD-1 have focused on the impact of this pathway on restraining effector T cell function with the idea that blocking PD-1 signaling would invariably drive an increase in T effector cells, shifting the Teff : Treg ratio to enhance immune responses. However, during toxoplasmosis, the ubiquitous IFN-γ mediated upregulation of PD-L1 did not appear to significantly restrict the development of acute T cell effector responses. Rather, PD-L1 blockade resulted in a reduction in the magnitude of the parasite-specific CD4+ T cell responses and reduced immunopathology. Because of the expectation that the ability of PD-1 to limit effector T cell responses is a dominant feature of this pathway46, these findings were unanticipated but are consistent with other reports where interfering with the PD-1 pathway does not improve effector responses47,48. One example involves the role of PD-1 in susceptibility to Mycobacterium tuberculosis (TB) where either genetic human deficiency or blockade of PD-1 in mice and humans results in reduced effector responses, reactivation, and higher bacterial burdens49,50.
There have been many advances in our understanding of the factors that maintain Treg cell populations and their inhibitory functions but less is known about the pathways that restrict these cells. These studies identify the constitutive expression of PD-1 on Treg cells as a homeostatic regulator of the eTreg population and establish that this pathway allows the development of adaptive responses to infectious challenges while balancing the development of immunopathology. Thus, PD-1 has a physiological role in Treg homeostasis and the ability to engage this receptor during infection provides a mechanism to rapidly tune Treg cell responses to allow the emergence of pathogen specific T cell responses while balancing the development of T cell-mediated immune pathology. Other IRs, such as CTLA4, also limit Treg cell activities51,52, even utilizing similar intracellular signaling pathways. As such, it is still unclear how signals from distinct IR are integrated with those from PD-1 to control Treg cell homeostasis. Additionally, there are open questions about the relationship between the cTreg and eTreg populations that will require lineage tracing, while the long term impact of the transient infection-induced PD-1 mediated restriction on the Treg cell repertoire has yet to be addressed.
Materials and Methods
Mice
All mice used were housed in the University of Pennsylvania Department of Pathobiology vivarium with 12 hour light and dark cycles, maintained at temperature ranges of 68°F - 77°F and humidity ranges from 35% - 55% humidity in accordance with institutional guidelines. For all strains of mice used in this study, both male and female mice were used. C57BL/6 mice were purchased from Taconic (Rensselaer, NY, USA) at 6 weeks of age and housed in the University of Pennsylvania Department of Pathobiology vivarium for 2 – 4 weeks until used. LysMcre x STAT1flox mice were generated as previously described53, while CD11ccre mice (stock no: 018967) were acquired from The Jackson Laboratory (Bar Harbor, ME, USA), and crossed with STAT1flox mice54 to generate CD11ccre x STAT1flox mice. Foxp3EGFP reporter mice (stock no:006772) were acquired from The Jackson Laboratory (Bar Harbor, ME, USA). PD-1−/− mice bred on the C57BL/6NTac background were created by deleting exons 2 and 3 from the Pdcd1 locus through use of CRISPR/Cas9 gene editing at Taconic Artemis55. These PD-1−/− mice were then bred and maintained by Taconic Biosciences Inc on behalf of Merck & Co., Inc. (Kenilworth, NJ, USA) and shipped to the University of Pennsylvania. Nur77-gfp mice on the C57BL/6J background created in the Hogquist Lab28 at the University of Minnesota were bred by The Jackson Laboratory (Bar Harbor, ME, USA) and shipped to the University of Pennsylvania. The Foxp3cre x PD-1flox strain was created by the Sharpe Lab at Harvard Medical School by cross-breeding the Foxp3cre-YFP strain and a PD-1flox strain on the C57BL/6 background, having loxP sequences inserted into intron 1-2 and 4-5 of the PD-1 locus by the Sharpe Lab36. The mice were shipped to the University of Pennsylvania vivarium and bred in accordance with institutional guidelines. Foxp3cre x PD-1flox mice bred at the University of Pennsylvania were PCR screened using digested tail tips, with a Foxp3cre forward primer sequence of: 5’ - AGG ATG TGA GGG ACT ACC TCC TGT A -3’, and a reverse primer sequence of: 5’ - TCC TTC ACT CTG ATT CTG GCA ATT T - 3’. The Foxp3cre PCR reaction condition settings were: 3 minutes at 94C, with 30 cycles of 45 seconds at 94C for melting, 30 seconds at 55C for annealing, and 1 minute at 72 seconds for extension with a 2-minute final extension at 72C. For PD-1flox screening, a 3-primer approach was utilized, with two primers flanking intron 4-5 to amplify products with and without the loxP sequence; in addition to a 3rd primer which bound upstream of the loxP insertion within intron 1-2, which would generate a 3rd PCR product if off-target PD-1 deletion had occurred. The sequences and conditions for this reaction were: upstream primer sequence of: 5’ – ACC GCA CCT ATA TAC CCG AC – 3’, forward primer sequence of: 5’ - GTC TCA ACA GAG GCC AGA GG - 3’, and a reverse primer sequence of TGA AGG CTC CTC CTT CTT CA - 3’, with condition settings of 4 minutes at 94C, with 30 cycles of 45 seconds at 94C for melting, 30 seconds at 55C for annealing, and 1 min at 72C for extension, with a 10 minute final extension at 72C.
Ethical oversight of all animal use in this study was approved by the University of Pennsylvania Institutional Animal Care and Use Committee.
Infection and Blockade
In vivo blockade antibodies:
Details of antibodies used in blockade can be found in Supplementary Table 1.
Infections were performed intraperitoneally at 8-10 weeks of age using 20 cysts of the ME49 strain of T. gondii which were harvested from neural tissue of chronically infected CBA/ca mice. Inhibition of PD-1/PD-L1 signaling was performed by intraperitoneal injection of 1mg/dose of αPD-L1 (clone: 10F.9G2, BioXcell), while control mice were treated with an IgG2b isotype (clone: LTF-2, BioXcell). Repeated injections of αPD-L1 or isotype clones were performed one day prior to infection, and then every 72 hours until indicated for acute infection studies. In scenarios involving IL-10r (CD210) blockade, mice were intraperitoneally injected on the 5th day of infection with ME49 with 500ug of αIL-10r antibody (clone: 1B1.3A, BioXcell) while control mice were treated with 500ug of the IgG1 isotype (clone:TNP6A7, BioXcell). The dose of 500ug of αIL-10r or isotype antibody was repeated on day 8 of infection, with mice being killed on day 10 of infection following antibody blockade treatments.
Tacrolimus Treatment
8-week-old C57BL/6 mice were given single doses of FK506 (F4679-5MG, Sigma-Aldrich, MO, USA) every 24 hours over a 96 hour period. FK506 was reconstituted in DMSO to 25mg/ml, and then the reconstituted stock was diluted in 1xDPBS to achieve a working concentration of 2.5mg/ml. 50ul of FK506 at 2.5mg/ml was subcutaneously injected subcutaneously to deliver 125ug of FK506 per dose daily. Following 72 hours of treatment, splenocytes were then harvested and analyzed via flow cytometry.
Histology and Assessing Parasite Load
Gross anatomical photos of liver and lungs were taken post-cardiac perfusion with 10ml of 1x DPBS. Perfused sections of whole liver were fixed in 10% buffered formalin (Jansen Pharmaceuticals, NJ, USA) for 48 hours, then processed for histopathology. Hematoxylin and eosin (H&E) stained sections were used to count for cysts present, or to assess for evidence of necrosis and leukophilia as result of infection or inhibitory blockade treatment. Serum was isolated at different times post-infection and then analyzed for cytokine concentration by ELISA. 100mg sections of whole liver, heart, thymus, and lungs purified for total DNA using the DNeasy Isolation Kit (Qiagen, MD, USA). DNA concentration was assessed using a Nano Drop spectrophotometer and normalized to equal concentration for qPCR analysis (50ng/ul). qPCR for parasite burden was conducted using toxoplasma specific primers: (forward) 5’-TCCCCTCTGCTGGCGAAAAGT-3’ and (reverse) 5’-AGCGTTCGTGGTCAACTATCGATT G-3’ and Power SYBR Green master mix (Applied Biosystems, CA, USA). The qPCR condition settings were: hold phase (occurs only once at the start): 2min 50C, 10min 95C. PCR phase (occurs 50x): 15s at 95C, 1min @60C.
Data Acquisition:
qPCR was performed using a ViiA 7 Real-Time PCR system operating on ViiA 7™ Software. Analysis of parasite qPCR data was performed in Microsoft Excel version 2011 (Build 13426.20332).
Isolation of tissues for analysis
Tissue Preparation:
Single cell suspensions were prepared from spleen, lung, liver, bone marrow, and peritoneal exudate cells (PEC) for flow cytometry analysis. Spleens were mechanically processed and passed through a 70µm nylon filter and then lysed in 1ml of 0.846% solution of NH4Cl for red blood cell lysis. The cells were then washed and stored on ice. Lungs were harvested and digested with 1mg/ml Collagenase I (Sigma, MO, USA) supplemented with 0.5mg/ml DNAse I (Sigma, MO, USA) in complete RPMI for 45 minutes at 37°C. The digested lungs were then passed through a 70μm nylon filter and washed with 10ml of complete RPMI. For liver preparations, the left renal artery was severed, and the mice were perfused using 10ml of 1xDPBS. The gallbladder was removed, and the lobes of the liver were mechanically processed over a 70µm nylon filter and washed. The single cell preparations were then re-suspended in 20ml of 37.5% percoll and centrifuged at 500xg for 20mins at RT. The pellet was then re-suspended in NH4Cl solution for red blood cell lysis and the cells were then washed and stored on ice. The bone marrow from the femur and tibia of mice was harvested and pooled RBC lysed, and these single cell preparations used for analysis.
Analysis by flow cytometry
Staining antibodies and staining reagents:
Antibody, viability dye, Fc block, dilutions, and buffer reagent details can be found on Supplemental Table 1.
T cell staining:
Aliquots consisting of 5e6 cells were washed with ice cold 1x DPBS in a 96 well round bottom plate, then incubated in in 50μl volume of viability stain reconstituted in 1xDPBS for 20 minutes on ice and then washed in 0.2% FACS buffer. The cells were then incubated in 50μl volume of Fc block for 30 minutes on ice. The cells were then washed with 0.2% FACS buffer and were stained in 50µl volume of 0.2% FACS buffer supplemented with tetramers loaded with the parasite-specific peptides AS15 and Tgd057 for 30 minutes on ice. The cells were washed in 0.2% FACS buffer, and then incubated for 30 minutes on ice in 50µl volume of antibody cocktail composed of surface-stain antibodies in 0.2% FACS buffer supplemented with brilliant stain buffer (Supplemental Table 1). The cells were washed in 0.2% FACS buffer and re-suspended in 100µl Foxp3 Perm-fix cocktail (00-5523-00, Thermo Fisher Scientific) for 4 hours at 4⁰C. The cells were then washed twice in 1X permeabilization buffer, and then re-suspended in an intracellular staining cocktail composed of intracellular-stain antibodies diluted in 1X permeabilization buffer supplemented with normal goat serum of for 2 hours at 4⁰C. The cells were then washed with 1x permeabilization buffer twice, and then resuspended in 50µl of Goat α-Rabbit detection antibody diluted in 1X permeabilization buffer for 2 hours at 4⁰C. The cells were washed in 1X permeabilization buffer and resuspended in 500µl 0.2% FACS buffer for flow cytometric analysis.
Cytokine staining:
To detect intracellular cytokines on T cells, cells were re-suspended in a stimulation cocktail of 0.05ng/ml PMA (Sigma), 0.5ng/ml ionomycin (Sigma), 5ng/ml BFA (Biolegend), Golgi-stop 0.75µl/ml (BD Biosciences, #554724) in cRPMI for 2 hours at 37⁰C and 5% CO2. Cells were then washed, and surface stained and permeabilized as described above in the T cell panel. The cytokine stain prepped cells were then intracellularly stained with a cytokine detection panel for 2 hours on ice. The cells were washed and then resuspended in 500µl 0.2% FACS buffer for analysis.
Myeloid staining:
Aliquots of 5e6 cells were washed in ice cold 0.2% FACS buffer in a 96 well and were resuspended in 50µl stain cocktail of α-rat IgG2b detecting antibody in 0.2% FACS buffer for 15 minutes on ice. The cells were washed, viability stained, and then FC-blocked as described in the T cell panel. The cells were surface stained in 50µl of antibody cocktail consisting diluted in 0.2% FACS buffer supplemented with brilliant stain buffer on ice for 30 minutes. For stains including IL-12p40, the cells were washed, permeabilized, and intracellularly stained as done in the T cell panel. For stains not requiring permeabilization, the cells were washed and fixed in with 2% PFA (15710-S, Electron Microscopy Sciences) diluted in 0.2% FACS buffer for 15 minutes at room temperature. The cells were then washed and then re-suspended in 500µl 0.2% FACS buffer for analysis.
Data acquisition:
The cells were analyzed on a FACS Symphony A5 (BD Biosciences) using BD FACSDiva v9.0 (BD Biosciences) and analysis was performed with FlowJo (10.5.3, BD biosciences).
T cell sorting:
To compare transcriptional profiles of cTreg (CD25+, PD-1−) to eTreg (CD25−, PD-1+) cells subsets, Foxp3eGFP mice were treated with a single intraperitoneal dose of 1mg of Isotype or αPD-L1 antibody and their splenocytes were harvested 72 hours later. The splenocytes were CD4+ enriched using the EasySep™ Mouse CD4+ T cell Isolation Kit (19852, STEMCELL Technologies, MA, USA). The cells were then washed with sterile ice cold 1x DPBS (21-031-CM, Corning) and stained with Live/Dead Fixable Aqua Dead Cell Stain (L34957, Thermo Fisher Scientific) for 20 minutes on ice and washed in sterile 2% FACS buffer. The cells were then stained with α-CD4 (17-0041-82, Invitrogen, MA, USA), α-PD-1 (29F.1A12, 135221, Biolegend), and α-CD25 (PC61, 102051, Biolegend) and washed in sterile 2% FACS buffer. The cells were then then double-sorted using a FACS Aria II (643180, BD Biosciences) into RPMI (10-040-CV, Corning) supplemented with 20% FBS. The cells were then preserved in Buffer RLT Plus (Qiagen, MD, USA) and stored at −80C.
RNAseq and Analysis
mRNA was isolated from sorted cTreg and eTreg cells using RNeasy Micro Plus Kit (Qiagen), and quality was assessed using High Sensitivity RNA Screen Tape on a 4200 TapeStation (Agilent, CA, USA). cDNA library and adapters were prepared with Clontech SMART-Seq HT kit (Takara, CA, USA). Primer cleanup was performed with AMPure XP beads (Beckman Coulter, PA, USA). 75-base pair reads were sequenced on a NextSeq 500 machine (Illumina, CA, USA) according to manufacturer protocol. Reads were pseudo-aligned to the mouse genome using with Kallisto v0.46.156. Gene counts under 1 in 3 samples were excluded from analysis. Normalized counts per million were analyzed for differential genes in R using the limma package57 with a log2 fold change cutoff of 0.3. Heatmaps were generated with the heatmaply package58. Gene set enrichment analysis was performed with GSEA software v4.0.3 (Broad Institute, MA, USA) with gene sets containing less than 10 genes excluded. Enrichment plots were generated in Cytoscape v3.7.1 (National Institute of General Medical Sciences, Bethesda, MD, USA) with a p-value cutoff of 0.05 and false discovery rate cutoff of 0.1.
Statistics:
Statistical analysis was performed using Prism 8 for Windows (version 8.4.3). For comparison of means between two groups, a two-tailed unpaired student’s t test was utilized with a 95% CI. Analysis for univariate statistics comparing multiple means was performed using a one-way ANOVA (family-wise significance and confidence level of 95% CI), with post-hoc analysis consisting of Fisher’s LSD test for direct comparison of two means within the ANOVA, or Tukey’s multiple comparisons test for comparisons of all means within the test group for multiple-comparison correction. For multi-group multivariate analysis, a two-way ANOVA with post-hoc analysis utilizing Sidak’s multiple comparisons test for comparisons across two groups with two variables, or Tukey’s multiple comparisons test for comparisons across multiple groups for multiple variables (also with a 95% CI). Probability for p values <0.05 or lower were considered statistically significant. All error bars in the figures indicate standard error of the mean (SEM).
UMAP analysis:
Uniform Manifold Approximation and Projection for Dimension Reduction (UMAP) analysis was performed using the UMAP plug-in using the Euclidean distance function with a nearest neighbor score of 20, and a minimum distance rating of 0.5 (version: 1802.03426, 2018, ©2017, Leland McInness) for Flowjo (Version 10.53). All stained parameters were included in UMAP analysis except for: Live Dead (gated out), CD4 (pre-gated), PD-1 (avoiding grouping bias), Foxp3 (avoiding grouping bias or already pre-gated), and in instances of PD-L1 blockade treatment, PD-L1 was excluded from UMAP cluster analysis for UMAP figures depicting bulk CD4+ T cell, Treg cell, or CD4+ Tetramer+ T cell UMAP images. The plots generated by UMAP Euclidian algorithms were analyzed via the X-shift tool (version 1.3)59 to identify unique clusters determined by the UMAP using a weighted k-nearest-neighbor density estimation (kNN-DE) plot. This strategy classifies and defines membership of a cell event into unique cluster groups based on a plurality of observations made from the nearest neighbor events in the UMAP. The X-shift identified clusters were then labeled and subsequently interpreted using the ClusterExplorer (version 1.2.2) tool, which compares X-shift clusters to highlight differences in expression.
Data availability statement:
RNAseq datasets discussed in this publication have been deposited in NCBI’s Gene Expression Omnibus and are accessible through GEO Series accession number GSE186350 (https://www.ncbi.nlm.nih.gov/geo/query/acc.cgi?acc=GSE186350). The remaining data that support the findings of this study are available on request from the corresponding author C.A. Hunter.
Extended Data
Extended Figure 1. Treg cell heterogeneity at homeostasis and Treg cell expression of PD-1.
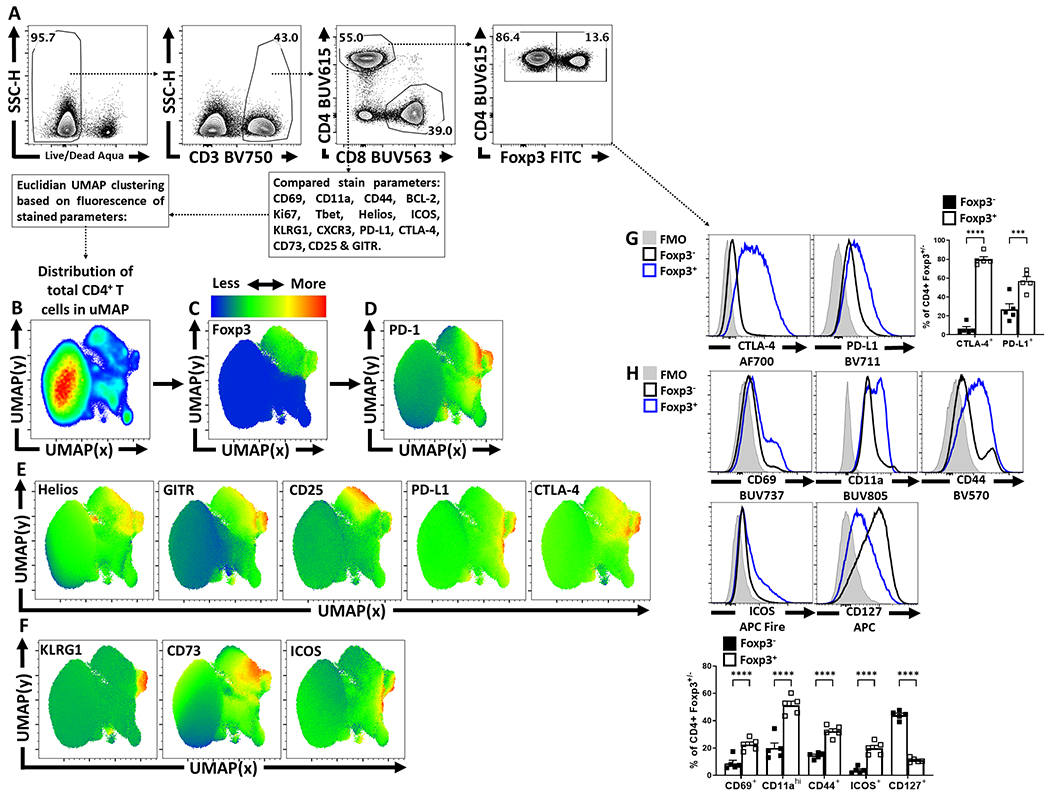
(A) Splenocytes from naïve 8 week-old male C57BL/6 mice were analyzed via high-parameter flow cytometry to identify CD4+ T cells, and subset them into Foxp3+ and Foxp3− subsets, depicted is the gating strategy to identify Treg and Tconv CD4+ T cells. (B) Qualitative analysis of bulk CD3+, CD4+ T cells was conducted to produce a 2-dimensional UMAP representation using dimensional reduction algorithms (excluding CD4, Foxp3, and PD-1 expression as calculated factors). (C-D) Regions of CD4+ T cells expressing Foxp3 and or PD-1 were identified via median heatmap of expression of the generated UMAP plot. (E) The initial distribution UMAP was then qualitatively assessed using median heatmap distribution trends amongst the bulk CD4+ T cell pool of Treg cell associated proteins: Helios, GITR, CD25, PD-L1, and CTLA-4, in addition to proteins associated with effector function in Tregs (F) KLRG1, CD73, and ICOS. (G) Histogram comparisons were then made and quantified between Foxp3+ and Foxp3− subsets for the inhibitory proteins CTLA-4 and PD-L1 (n = 5/group, 2 way ANOVA with Tukey multiple comparisons test, *** = p = 0.0002, **** = p < 0.0001, 6 experimental replicates). (H) Proteins associated with activation (CD69, CD11a, CD44, ICOS, and CD127) were also compared and quantified (n = 5/group, 2 way ANOVA with Tukey multiple comparisons test, **** = p < 0.0001, 6 experimental replicates). All data presented are means +/− SEM and show individual data points.
Extended Figure 2. Qualitative X-shift identification of Treg heterogeneity in the PD-1hi cluster of Treg cells.
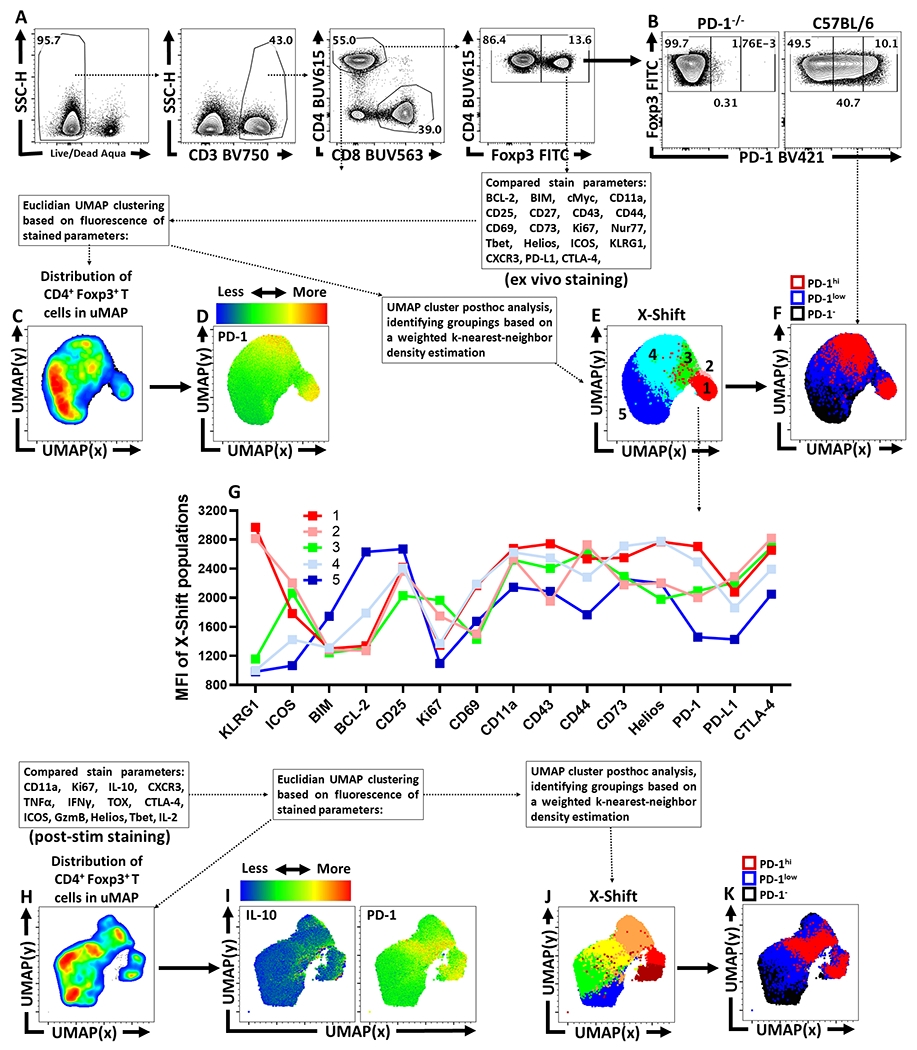
(A) Splenocytes from naïve 8 week-old male C57BL/6 mice were analyzed via high-parameter flow cytometry to identify CD4+ T cells and were then grouped into Foxp3+ and Foxp3− subsets. (B) CD4+ Foxp3+ T cells were then subset into PD-1−ve, PD-1low, and PD-1hi groups using a PD-1KO host as a negative stain comparative control. (C) UMAP qualitative analysis was generated specifically on CD4+ Foxp3+ T cells (Treg cells), excluding CD4, PD-1, and Foxp3 as variables in the calculation. (D) Depiction of PD-1 expression as a median heatmap amongst the Treg cell UMAP. (E) The Treg cell UMAP was then reanalyzed via the X-shift algorithm (excluding CD4, PD-1, and Foxp3 from the calculation) to potentially identify Treg subsets as clusters within the UMAP, with each X-shift identified subset depicted as a separate color. (F) Within the same UMAP, the PD-1−ve, PD-1low, and PD-1hi groups are portrayed as black, blue, and red respectively, to compare the location of these subsets to the locations of the X-shift identified Treg subsets. (G) Graphed MFI of fluorescence of stained proteins on these cells identified in the UMAP X-shift analysis to qualitatively compare different trends amongst the Treg cell clusters at homeostasis. (H) UMAP qualitative analysis on splenocyte-derived Treg cells from naïve C57BL/6 mice following stimulation and cytokine staining. (I) Heatmaps of median expression of IL-10 and PD-1 within the UMAP generated in H. (J) Re-analysis via X-shift algorithm to identify unique clusters within the cytokine-stain UMAP, indicated by separate colors in the plot. (K) Overlay of PD-1−, PD-1low, and PD-1hi subsets within the cytokine-stain UMAP.
Extended Figure 3. Constitutive PD-L1 expression at homeostasis and anti-PD-L1 blocking antibody detection.
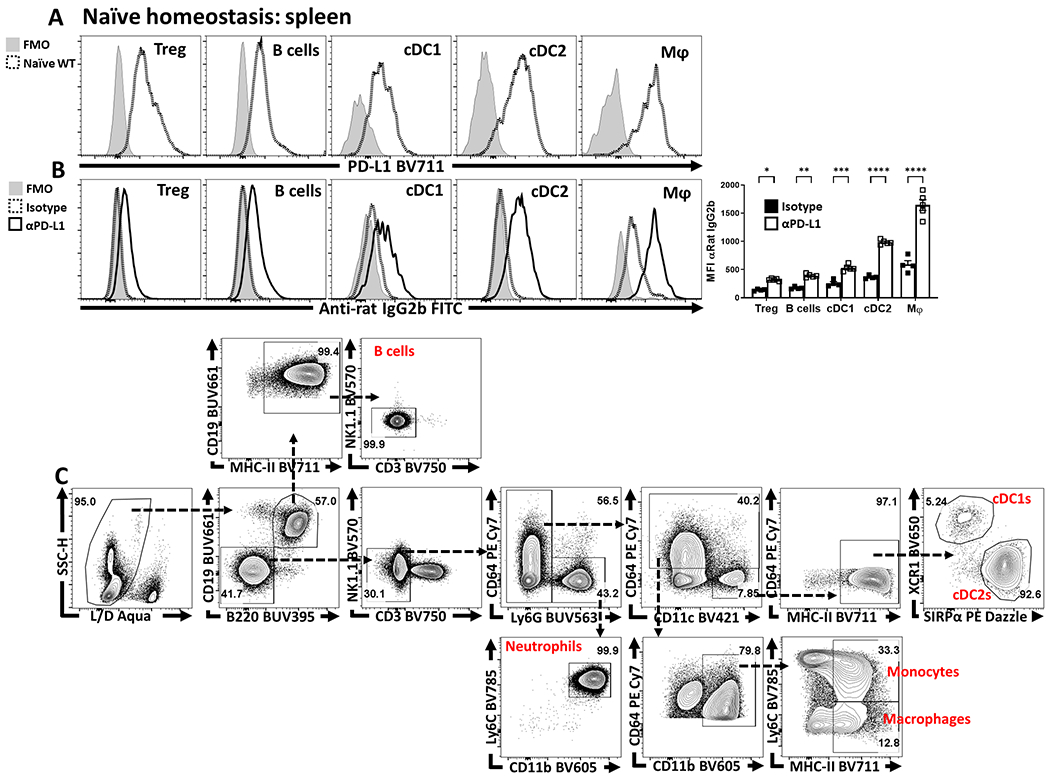
(A) Splenocytes from 8 week-old male C57BL/6 mice were qualitatively analyzed for PD-L1 expression compared to an FMO (fluorescence minus one) via flow cytometry across multiple leukocyte populations: Treg cells (CD3+, CD4+, Foxp3+), B cells (CD3−, B220+, CD19+), cDC1s (CD3−, B220−, CD19−, NK1.1−, Ly6G−, CD64−, CD11c+, MHC-II+, XCR1+), cDC2s (CD3−, B220−, CD19−, NK1.1−, Ly6G−, CD64−, CD11c+, MHC-II+, SIRPα+), and macrophages (CD3−, B220−, CD19−, NK1.1−, Ly6G−, CD64+, CD11b+, MHC-II+, Ly6Clow). (B) Groups of 9 week-old male C57BL/6 mice were treated with an IP injection of isotype (Rat - IgG2b) (n = 4) or anti-PD-L1 blocking antibody (n = 5) for 72 hours. Splenocytes from these groups were then harvested and stained with an anti-Rat-IgG2b FITC antibody to determine if the PD-L1 blocking antibody was opsonizing the previously identified PD-L1+ subsets (Tregs, B cells, cDC1s, cDC2s, and Macrophages). The anti-PD-L1 blocking antibody was readily detected while subsets from the isotype treated animals had minimal anti-Rat-IgG2b staining (2-way ANOVA with Sidak’s multiple comparisons test,* = p = 0.0222, ** = p = 0.0044, *** = p = 0.0004, **** = p < 0.0001, 3 experimental replicates). (C) Example gating strategy using splenocytes from a naïve C57BL/6 host, for the populations identified in (A), starting with singlet cells, and refining down to B cells, neutrophils, monocytes, macrophages, cDC1s, and cDC2s. All data presented are means +/− SEM and show individual data points.
Extended Figure 4. Anti-PD-L1 blockade results in increased eTreg cell activation and proliferation in naïve hosts.
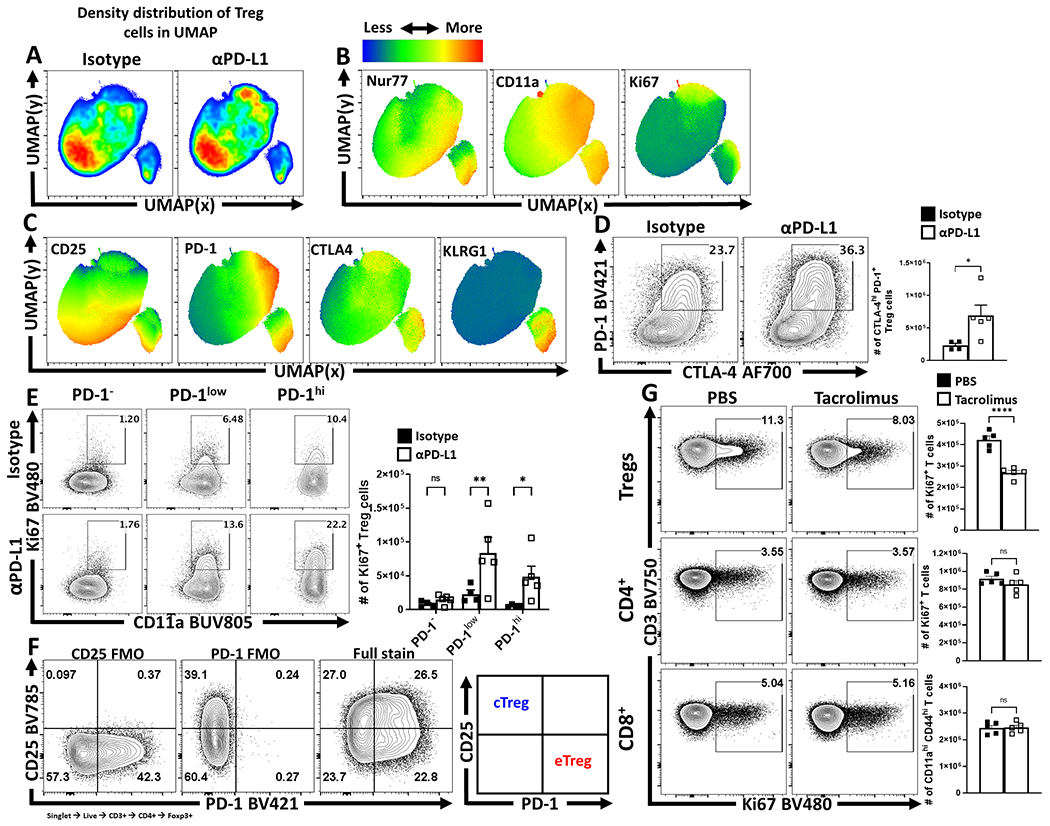
(A-C) 9 week-old male Nur77GFP reporter mice were treated with a single dose of isotype or anti-PD-L1 blocking antibody for 72 hours. Splenocytes were then harvested and assessed via high-parameter flow cytometry. Treg cell data was then concatenated between the isotype and anti-PD-L1 treated groups, and the subsequent qualitative interpretation was conducted via UMAP analysis (excluding Foxp3, PD-1, PD-L1, and CD4 as calculation factors). (A) Side-by-side pseudo-color density plot comparison of Treg cells from isotype and anti-PD-L1 treated hosts depicting regional shifts within the same UMAP calculation. (B) Heatmap expression analysis across the total combined UMAP data from both groups, depicting median heatmaps of TCR activation associated proteins Nur77, CD11a, and Ki67, with overlapping enrichment of activated Treg cells in anti-PD-L1 treated hosts. (C) Additional heatmap analysis of Treg cell associated CD25, inhibitory receptors PD-1 and CTLA-4, and KLRG-1, with an enrichment of overlap between PD-1, CTLA-4, and KLRG1 expression in context of PD-L1 blockade. (D-F) 9 week-old male C57BL/6 mice were also treated with a single dose of isotype (n = 4) or anti-PD-L1 blocking antibody (n = 5) for 72 hours, and their splenocytes were also isolated and analyzed via high-parameter flow cytometry. (D) Flow plot data of splenic Treg cells from isotype and anti-PD-L1 treated hosts comparing changes to the PD-1+ CTLA-4hi subset following PD-L1 blockade (two-tailed unpaired student’s t-test, * = p = 0.0394, 4 experimental replicates). (E) Treg cells from isotype and PD-L1 blockade treated hosts, gated on activated (CD11ahi) cells in cell cycle (Ki67+), indicating an increase in PD-1+ Treg cells in cell cycle following treatment (2-way ANOVA with Fisher’s LSD individual comparisons test, * = p = 0.032, ** = p = 0.0037, 4 experimental replicates). (F) Gating strategy utilized for flow cytometry sorting to isolate cTreg cells (CD25+ PD-1−) vs eTreg cells (CD25− PD-1+). (G) Flow cytometry data of Treg, CD4+ Tconv, and CD8+ T cells for the expression of Ki67 following 96 hours of tacrolimus (FK506) treatment (n = 5/group two-tailed unpaired student’s t-test, **** = p < 0.0001, 2 experimental replicates). All data presented are means +/− SEM and show individual data points.
Extended Figure 5. The development of homeostatic eTregs is not dependent on PD-1, and eTregs are limited by PD-1.
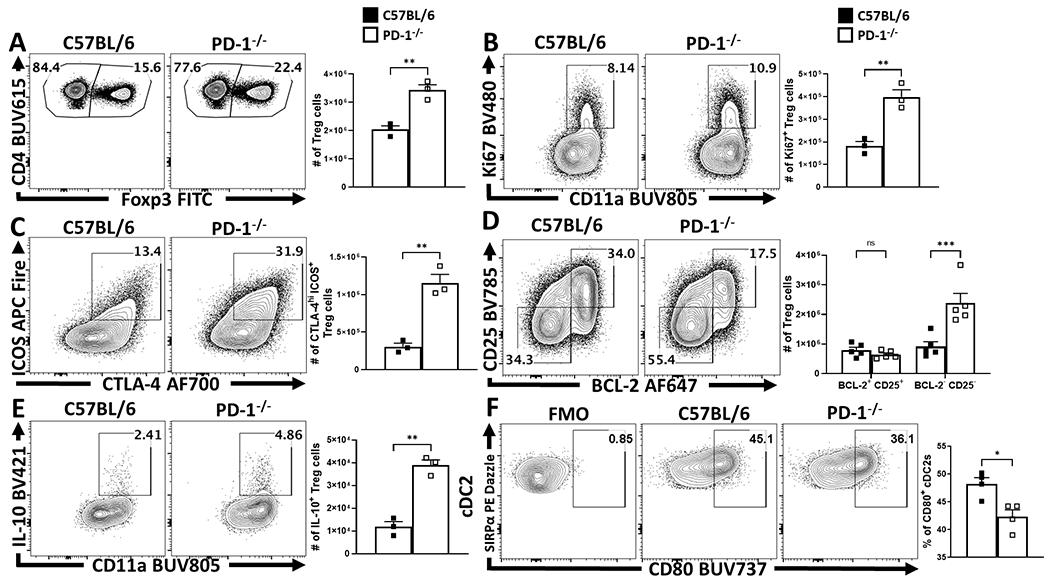
(A-F) Splenocytes from naïve 8 week-old female C57BL/6 mice or total PD-1−/− mice were isolated and analyzed via high-parameter flow cytometry. (A) Pre-gated CD4+ T cells gated on Foxp3+ events (Treg cells) depicting an enrichment of Treg cells at homeostasis in PD-1−/− age matched hosts (n = 3/group two-tailed unpaired student’s t-test, ** = p = 0.0037, 4 experimental replicates). (B) Comparative flow plots of Treg cells between C57BL/6 and PD-1−/− hosts with gating on activated Treg cells in cell cycle (CD11ahi Ki67+), demonstrating an increase in Tregs cells undergoing proliferation at homeostasis in PD-1−/− hosts (n = 3/group two-tailed unpaired student’s t-test, ** = p = 0.0044, 4 experimental replicates). (C) Treg cell staining of ICOS and CTLA-4, depicting the proportion and number of eTreg-associated (ICOS+ CTLA-4hi) Treg cells is increased in PD-1−/− mice (n = 3/group two-tailed unpaired student’s t-test, ** = p = 0.0022, 4 experimental replicates), while (D) demonstrates this enhancement is specific to the eTreg compartment (BCL-2low, CD25low), as the non-eTreg compartment (BCL-2hi, CD25hi) is consistent in number when compared to C57BL/6 mice (n = 5/group, 2-way ANOVA with Sidak’s multiple comparisons test, *** = p = 0.0001, 3 experimental replicates). Splenocytes from isotype and anti-PD-L1 treated groups were also stimulated and stained for IL-10 and analyzed via flow cytometry. (E) Flow plots of Treg cells from C57BL/6 and PD-1−/− hosts gated on CD11ahi IL-10+ events, depicting an increase in the proportion and number of IL-10+ Treg cells in PD-1−/− hosts (n = 3/group two-tailed unpaired student’s t-test, ** = p = 0.0011, 3 experimental replicates). (F) Splenic cDC2 subsets were identified via flow cytometry (CD3−, B220−, CD19−, NK1.1−, Ly6G−, CD64−, CD11c+, MHC-II+, SIRPα+), and gated on CD80+ events based on an FMO (n = 4/group, two-tailed unpaired student’s t test, * = p = 0.0122, 2 experimental replicates). All data presented are means +/− SEM and show individual data points.
Extended Figure 6. IFN-γ mediated changes to myeloid PD-L1 expression.
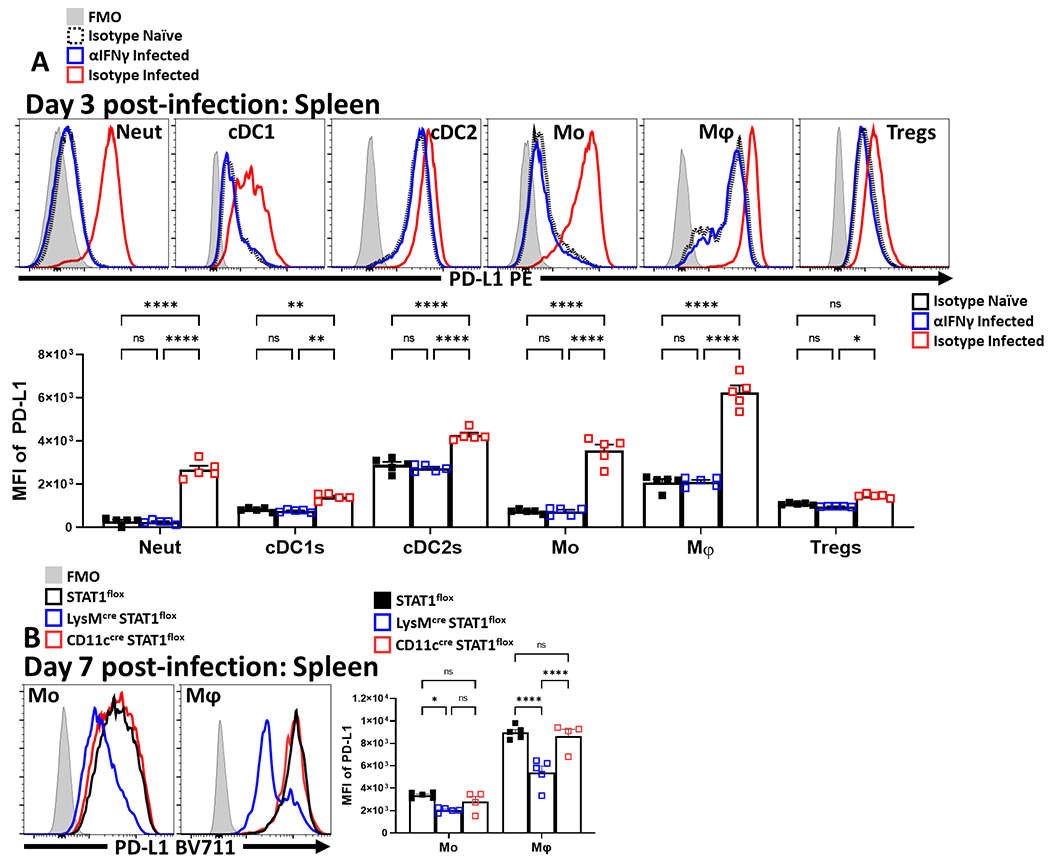
Cohorts of 8 week-old male C57BL/6 mice (n = 10/group) were treated with an isotype antibody or IFNγ blocking antibody and half of each group (n = 5) were infected with 20 cysts of ME49 intraperitoneally (IP). Splenocytes and Peritoneal exudate cells (PEC) were isolated 72 hours later and analyzed via high-parameter flow cytometry. (A) Comparative histograms evaluating 72 hour timepoint changes in the MFI of PD-L1 expression amongst splenocytes between experimental groups within leukocyte subsets: neutrophils (CD3−, B220−, CD19−, NK1.1−, Ly6G+, Ly6C+, CD11b+), cDC1s (CD3−, B220−, CD19−, NK1.1−, Ly6G−, CD64−, CD11c+, MHC-II+, XCR1+), cDC2s (CD3−, B220−, CD19−, NK1.1−, Ly6G−, CD64−, CD11c+, MHC-II+, SIRPα+), monocytes (CD3−, B220−, CD19−, NK1.1−, Ly6G−, CD64+, CD11b+, MHC-II+, Ly6C+), macrophages (CD3−, B220−, CD19−, NK1.1−, Ly6G−, CD64+, CD11b+, MHC-II+, Ly6C−) and Treg cells (B220−, CD19−, Ly6G−, NK1.1−, CD3+, CD4+, Foxp3+) (n = 5/group, 2-way ANOVA with Tukey’s multiple comparisons test, * = p = 0.0239, ** = p < 0.01, **** = p < 0.0001, 2 experimental replicates). (B) Cohorts of 8 week-old female STAT1flox mice without any cre expressing alleles (n = 5), or STAT1flox mice crossed onto either the CD11ccre (n = 4) or LysMcre (n = 5) background were infected with 20 cysts of ME49 IP. Splenocytes and PEC were harvested on day 7 of infection and analyzed via flow-cytometry. (B) Histogram comparisons of PD-L1 MFI changes in splenic monocytes and macrophages following conditional deletion of STAT1 (2-way ANOVA with Tukey’s multiple comparisons test, * = p = 0.0475, **** = p < 0.0001, 2 experimental replicates). All data presented are means +/− SEM and show individual data points.
Extended Figure 7. Impact of PD-L1 blockade across tissues and infection.
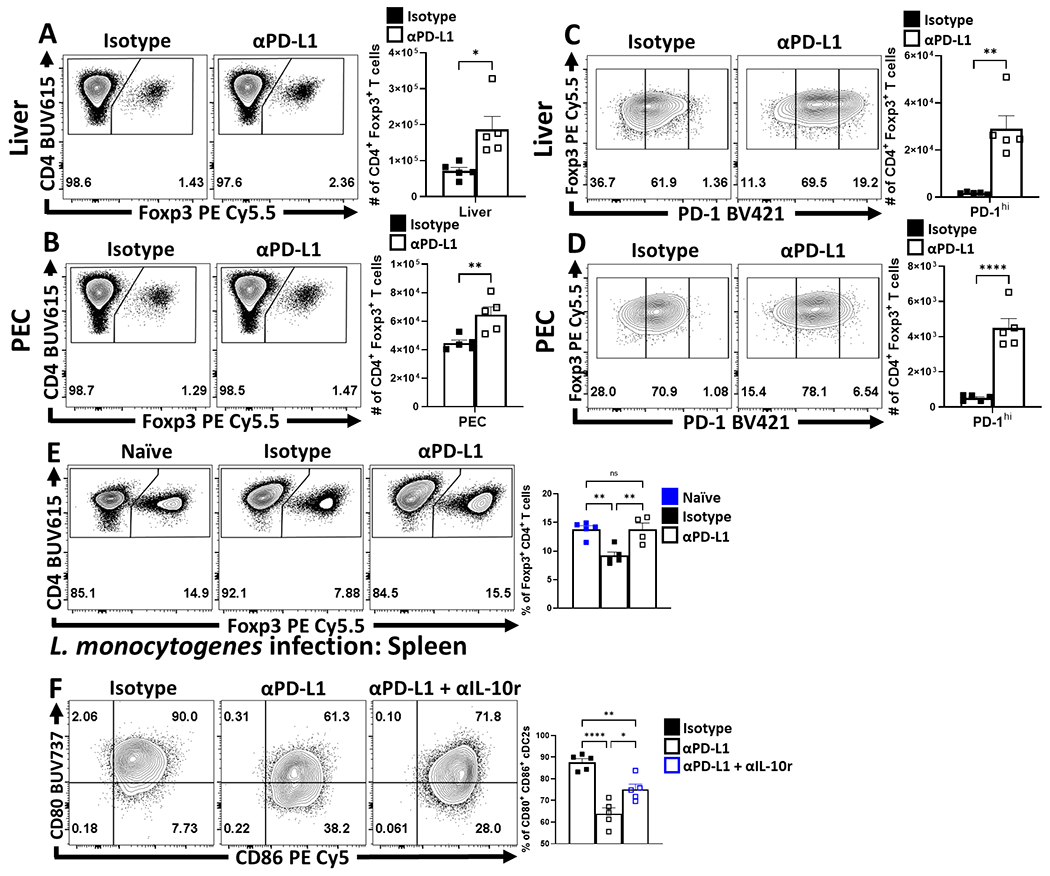
(A-D) Cohorts of 8 week-old male C57BL/6 mice were treated with an isotype antibody or PD-L1 blocking antibody 24 hours prior to infection with 20 cysts of ME49 IP. The antibody treatments were repeated every 72 hours throughout the course of infection until the mice were killed on day 10 and PEC, spleen, and liver were harvested and analyzed via high-parameter flow cytometry. (A-B) Flow plots of bulk CD4+ T cells with subsequent gates on the Foxp3+ T cells (Treg cells) for liver (A) and PEC (B), demonstrating the drop in Treg cells from homeostatic levels during infection, and the maintenance of Tregs during infection with PD-L1 blocking antibody treatment (n = 5/group two-tailed unpaired student’s t-test, * = p = 0.0153, ** = p = 0.0088, 4 experimental replicates). (C-D) Flow plots of Treg cells from treatment groups showing enrichment of PD-1hi Treg compartment as a consequence of PD-L1 blockade treatment during infection in liver (C), and PEC (D) (n = 5/group two-tailed unpaired student’s t-test, ** = p = 0.0013, **** = p < 0.0001, 4 experimental replicates). (E) Cohorts of 8 week-old male C57BL/6 mice were treated with an isotype antibody (n = 5 uninfected, n = 5 infected) or PD-L1 blocking antibody (n = 4) 24 hours prior to intravenous infection with 104 pfu of L. monocytogenes cysts of ME49 IP. The antibody treatments were repeated every 72 hours until splenocytes were harvested and analyzed via high-parameter flow cytometry on day 6 of infection. Depicted are flow plots of splenocyte-derived bulk CD4+ T cells gated on Foxp3+ T cells (Treg cells), (1-way ANOVA with Tukey’s multiple comparisons test, Isotype naïve vs Isotype infected: ** = p = 0.0033, Isotype infected vs anti-PD-L1 infected: ** = p = 0.0055, 1 experimental replicate). (F) Splenocyte-derived flow plots of cDC2s from cohorts of 8 week-old male C57BL/6 mice at day 10 of infection with T. gondii (20 cysts ME49 IP), that had been treated with isotype (n = 5), anti-PD-L1 (n = 5), with the inclusion of an additional cohort treated with a combination of blocking anti-IL-10r/anti-PD-L1 antibodies (n = 5) depicting exvivo changes in the proportion of CD80+ CD86+ cells (n = 5/group, 1-way ANOVA with Tukey’s multiple comparisons test, * = p = 0.0117, ** = p = 0.0056, **** = p < 0.0001, 2 experimental replicates). All data presented are means +/− SEM and show individual data points.
Extended Figure 8. During infection, PD-1−/− mice maintain an increased eTreg pool with diminished parasite specific responses.
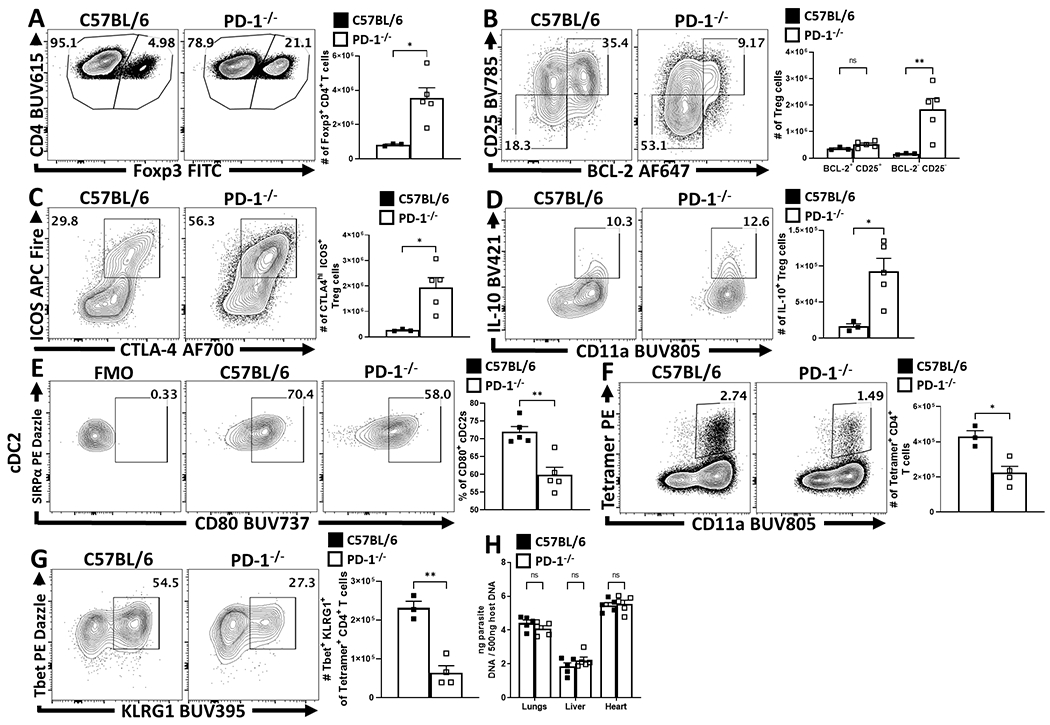
(A-G) 8 week-old female C57BL/6 and PD-1−/− mice were IP infected with 20 cysts of T. gondii and splenocytes were harvested and analyzed via flow cytometry at day 10 of infection. (A) Plots of CD4+ T cells from C57BL/6 (n = 3) and PD-1−/− (n = 5) mice with gating on Foxp3+ events (Treg cells) depicting a preservation of Treg cells in PD-1−/− hosts during infection (two-tailed unpaired student’s t-test, * = p = 0.0158, 3 experimental replicates). (B) Treg cell staining of BCL-2 and CD25, demonstrating an eTreg specific increase (BCL-2low, CD25low), as the non-eTreg compartment (BCL-2hi, CD25hi) is consistent in number when comparing C57BL/6 (n = 3) and PD-1−/− (n = 5) mice (2-way ANOVA with Sidak’s multiple comparisons test, ** = p = 0.0020, 3 experimental replicates). (C) Plots depicting and increase in the proportion and number of eTreg-associated (ICOS+ CTLA-4hi) Treg cells when comparing C57BL/6 (n = 3) to PD-1−/− (n = 5) mice (two-tailed unpaired student’s t-test, * = p = 0.0177, 3 experimental replicates). Splenocytes from C67BL/6 and PD-1−/− treated groups were stimulated and then stained for IL-10 and analyzed via flow cytometry, (D) plots of Treg cells from 8 week-old female C57BL/6 (n = 3) and PD-1−/− (n = 5) mice gated on CD11ahi IL-10+ events, depicting an increase in the proportion and number of IL-10+ Treg cells in PD-1−/− hosts (two-tailed unpaired student’s t-test, * = p = 0.0181, 3 experimental replicates). (E) Splenic cDC2 subsets were identified via flow cytometry (CD3−, B220−, CD19−, NK1.1−, Ly6G−, CD64−, CD11c+, MHC-II+, SIRPα+), and gated on CD80+ events based on an FMO, comparing the proportion of CD80+ cDC2 events between C57BL/6 (n = 5) and PD-1−/− (n = 5) mice (two-tailed unpaired student’s t test, ** = p = 0.0017, 2 experimental replicates). (F-G) Splenocytes from infected hosts were tetramer stained using the toxoplasma specific AS15 peptide, and the number of CD11ahi parasite specific CD4+ T cells was compared between C57BL/6 (n = 3) and PD-1−/− (n = 4) (two-tailed unpaired student’s t-test, * = p = 0.0108), (G) while the phenotype of the parasite specific CD4+ T cells (CD11ahi Tetramer+) was evaluated for the expression of KLRG1 and Tbet, resulting in a loss of observed Tbet+ KLRG1+ parasite specific T cells in PD-1−/− hosts (two-tailed unpaired student’s t-test, * = p = 0.0012, 3 experimental replicates). (H) Parasite burden was assessed via qPCR from tissue samples of lungs, liver, and heart at day 10 of infection, resulting in no significant differences in parasite burden (n = 5/group, 2-way ANOVA with Sidak’s multiple comparisons test, 3 experimental replicates). All data presented are means +/− SEM and show individual data points.
Extended Figure 9. Primary T. gondii infection depletes eTreg cell populations in both C57BL/6 and hemizygous Foxp3cre x PD-1wt/flox mice, while eTreg cells in homozygous Foxp3cre x PD-1flox/flox hosts are spared.
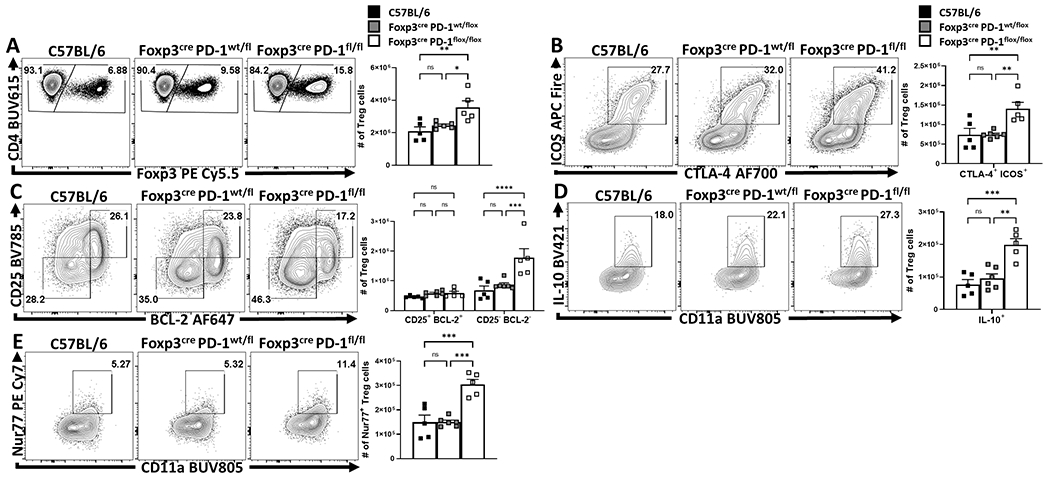
(A-E) 8 week-old male C57BL/6 (n = 5), Foxp3cre x PD-1wt/flox (n = 6), and Foxp3cre x PD-1flox/flox (n = 5) mice were IP infected with 20 cysts of T. gondii (ME49 strain), at day 10 of infection splenocytes were harvested from each group and analyzed via high parameter flow cytometry. (A) Flow plots of bulk CD4+ T cells from each infected group and were gated on Foxp3+ events (Treg cells), depicting similar Treg depletion in C57BL/6 and hemizygous (PD-1wt/flox) groups, with increased Treg preservation in the homozygous (PD-1flox/flox) hosts (1-way ANOVA with Tukey’s multiple comparisons test * = p = 0.0227, ** = p = 0.0050, 2 experimental replicates). (B) Flow plots of splenic Treg cells depicting an increase in eTreg-associated ICOS+ CTLA-4hi cells in the Foxp3cre x PD-1flox/flox group, but not the C57BL/6 or Foxp3cre x PD-1wt/flox cohorts (1-way ANOVA with Tukey’s multiple comparisons test, ** = p < 0.01, 2 experimental replicates). (C) Flow plots depicting enhancement to the eTreg associated BCL-2low CD25low compartment in Foxp3cre x PD-1flox/flox mice only, while the non-eTreg compartment (BCL-2hi, CD25hi) was consistent in number across all three groups (2-way ANOVA with Tukey’s multiple comparisons test *** = p = 0.0002, **** = p < 0.0001, 2 experimental replicates). Splenocytes from all three groups were also stimulated and stained for IL-10. (D) Flow plots of Treg cells and their expression of IL-10 vs CD11a. There is no significant change between C57BL/6 and hemizygous groups, however homozygous mice have a significant increase in the number and proportion of IL-10+ Treg cells (1-way ANOVA with Tukey’s multiple comparisons test, ** = p = 0.0011, *** = p = 0.0004). Splenocytes were permeabilized exvivo and stained for the downstream TCR-activation protein Nur77 and analyzed via flow cytometry. (E) Treg cell plots from the three respective groups depicting no significant differences in Nur77+ Treg cells between C57BL/6 and hemizygous groups, while Treg cells from homozygous hosts (Foxp3cre x PD-1flox/flox) have an increased proportion and number of Nur77+ Treg cells compared to the other two groups during infection (1-way ANOVA with Tukey’s multiple comparisons test *** = p < 0.001). All data presented are means +/− SEM and show individual data points.
Supplementary Material
Supplementary Table 1 – Reagent information.
Statistical source data.
Statistical source data.
Statistical source data.
Statistical source data.
Statistical source data.
Statistical source data.
Statistical source data.
Statistical source data.
Statistical source data.
Statistical source data.
Statistical source data.
Statistical source data.
Statistical source data.
Statistical source data.
Statistical source data.
Statistical source data.
Statistical source data.
Acknowledgements
This project was supported by NIAID R01 AI125563 & R01 AI41158, awarded to Christopher Hunter and P01 AI039671 and P01 AI056299 awarded to Arlene Sharpe.
Joseph Perry was supported by training grant: T32-CA-009140.
Thank you to Dr. Warren Pear for mentorship and guidance during the formation of this project. Thank you to Lorenzo “Enzo” Burton for your patience and encouragement.
Footnotes
Competing Interests Statement
At the time of the study, Renee de Waal Malefyt was employed by Merck & Co Inc., Palo Alto. Renee has declared no financial interest in Merck & Co Inc.
The authors have declared no competing interests.
References
- 1.Josefowicz SZ, Lu L-F & Rudensky AY Regulatory T Cells: Mechanisms of Differentiation and Function. Annu. Rev. Immunol 30, 531–564 (2012). [DOI] [PMC free article] [PubMed] [Google Scholar]
- 2.Sakaguchi S et al. Regulatory T Cells and Human Disease. Annu. Rev. Immunol 38, 541–566 (2020). [DOI] [PubMed] [Google Scholar]
- 3.Kieback E et al. Thymus-Derived Regulatory T Cells Are Positively Selected on Natural Self-Antigen through Cognate Interactions of High Functional Avidity. Immunity 44, 1114–1126 (2016). [DOI] [PubMed] [Google Scholar]
- 4.Levine AG, Arvey A, Jin W & Rudensky AY Continuous requirement for the TCR in regulatory T cell function. Nat. Immunol 15, 1070–1078 (2014). [DOI] [PMC free article] [PubMed] [Google Scholar]
- 5.Lenschow DJ et al. B7 / CD28 Costimulation Is Essential for the Homeostasis of the CD4+ CD25+ Immunoregulatory T Cells that Control Autoimmune Diabetes. Immunity 12, 431–440 (2000). [DOI] [PubMed] [Google Scholar]
- 6.Bluestone JA & Tang Q How do CD4+CD25+ regulatory T cells control autoimmunity? Curr. Opin. Immunol 17, 638–642 (2005). [DOI] [PubMed] [Google Scholar]
- 7.Chinen T et al. An essential role for IL-2 receptor in regulatory T cell function. Nat. Immunol 17, 1322–1333 (2016). [DOI] [PMC free article] [PubMed] [Google Scholar]
- 8.Rubtsov YP et al. Regulatory T Cell-Derived Interleukin-10 Limits Inflammation at Environmental Interfaces. Immunity 28, 546–558 (2008). [DOI] [PubMed] [Google Scholar]
- 9.Levine AG et al. Stability and function of regulatory T cells expressing the transcription factor T-bet. Nature 546, 421–425 (2017). [DOI] [PMC free article] [PubMed] [Google Scholar]
- 10.Duhen T, Duhen R, Lanzavecchia A, Sallusto F & Campbell DJ Functionally distinct subsets of human FOXP3 + Treg cells that phenotypically mirror effector Th cells. Blood 119, 4430–4440 (2012). [DOI] [PMC free article] [PubMed] [Google Scholar]
- 11.Zheng Y et al. Regulatory T-cell suppressor program co-opts transcription factor IRF4 to control TH2 responses. Nature 458, 351–356 (2009). [DOI] [PMC free article] [PubMed] [Google Scholar]
- 12.Chaudhry A et al. CD4+ Regulatory T Cells Control TH17 Responses in a Stat3-Dependent Manner. Science (80-. ). 326, 986–991 (2009). [DOI] [PMC free article] [PubMed] [Google Scholar]
- 13.Koch MA et al. The transcription factor T-bet controls regulatory T cell homeostasis and function during type 1 inflammation. Nat. Immunol 10, 595–602 (2009). [DOI] [PMC free article] [PubMed] [Google Scholar]
- 14.Hall AOH et al. The Cytokines Interleukin 27 and Interferon-γ Promote Distinct Treg Cell Populations Required to Limit Infection-Induced Pathology. Immunity 37, 511–523 (2012). [DOI] [PMC free article] [PubMed] [Google Scholar]
- 15.Sprouse ML et al. Cutting Edge: Low-Affinity TCRs Support Regulatory T Cell Function in Autoimmunity. J. Immunol 200, 909–914 (2018). [DOI] [PMC free article] [PubMed] [Google Scholar]
- 16.Wyss L et al. Affinity for self antigen selects Treg cells with distinct functional properties. Nat. Immunol 17, 1093–1101 (2016). [DOI] [PMC free article] [PubMed] [Google Scholar]
- 17.Kumagai S et al. The PD-1 expression balance between effector and regulatory T cells predicts the clinical efficacy of PD-1 blockade therapies. Nat. Immunol 21, 1346–1358 (2020). [DOI] [PubMed] [Google Scholar]
- 18.Kamada T et al. PD-1 + regulatory T cells amplified by PD-1 blockade promote hyperprogression of cancer . Proc. Natl. Acad. Sci 116, 201822001 (2019). [DOI] [PMC free article] [PubMed] [Google Scholar]
- 19.Odorizzi PM, Pauken KE, Paley MA, Sharpe A & Wherry EJ Genetic absence of PD-1 promotes accumulation of terminally differentiated exhausted CD8 + T cells. J. Exp. Med 212, 1125–1137 (2015). [DOI] [PMC free article] [PubMed] [Google Scholar]
- 20.Hui E et al. T cell costimulatory receptor CD28 is a primary target for PD-1–mediated inhibition. Science (80-. ). 4, eaaf1292 (2017). [DOI] [PMC free article] [PubMed] [Google Scholar]
- 21.Fife BT et al. Interactions between PD-1 and PD-L1 promote tolerance by blocking the TCR-induced stop signal. Nat. Immunol 10, 1185–1192 (2009). [DOI] [PMC free article] [PubMed] [Google Scholar]
- 22.Chen X et al. PD-1 regulates extrathymic regulatory T-cell differentiation. Eur. J. Immunol 44, 2603–2616 (2014). [DOI] [PMC free article] [PubMed] [Google Scholar]
- 23.Ellestad KK, Thangavelu G, Ewen CL, Boon L & Anderson CC PD-1 is not required for natural or peripherally induced regulatory T cells: Severe autoimmunity despite normal production of regulatory T cells. Eur. J. Immunol 44, 3560–3572 (2014). [DOI] [PubMed] [Google Scholar]
- 24.Belkaid Y, Piccirillo CA, Mendez S, Shevach EM & Sacks DL CD4+CD25+ regulatory T cells control Leishmania major persistence and immunity. Nature 420, 502–507 (2002). [DOI] [PubMed] [Google Scholar]
- 25.Maizels RM & Smith KA Regulatory T Cells in Infection. Advances in Immunology vol. 112 (Elsevier Inc., 2011). [DOI] [PMC free article] [PubMed] [Google Scholar]
- 26.Benson A et al. Microbial Infection-Induced Expansion of Effector T Cells Overcomes the Suppressive Effects of Regulatory T Cells via an IL-2 Deprivation Mechanism. J. Immunol 188, 800–810 (2012). [DOI] [PMC free article] [PubMed] [Google Scholar]
- 27.Oldenhove G et al. Decrease of Foxp3+ Treg Cell Number and Acquisition of Effector Cell Phenotype during Lethal Infection. Immunity 31, 772–786 (2009). [DOI] [PMC free article] [PubMed] [Google Scholar]
- 28.Moran AE et al. T cell receptor signal strength in Treg and iNKT cell development demonstrated by a novel fluorescent reporter mouse. J. Exp. Med 208, 1279–1289 (2011). [DOI] [PMC free article] [PubMed] [Google Scholar]
- 29.Thornton AM et al. Helios + and Helios − Treg subpopulations are phenotypically and functionally distinct and express dissimilar TCR repertoires. Eur. J. Immunol 49, 398–412 (2019). [DOI] [PMC free article] [PubMed] [Google Scholar]
- 30.Kornete M, Mason E, Istomine R & Piccirillo CA KLRG1 expression identifies short-lived Foxp3(+) Treg effector cells with functional plasticity in islets of NOD mice. Autoimmunity 50, 1–9 (2017). [DOI] [PubMed] [Google Scholar]
- 31.Smigiel KS et al. CCR7 provides localized access to IL-2 and defines homeostatically distinct regulatory T cell subsets. J. Exp. Med 211, 121–136 (2014). [DOI] [PMC free article] [PubMed] [Google Scholar]
- 32.vanLoosdregt J et al. Canonical Wnt signaling negatively modulates regulatory T cell function. Immunity 39, 298–310 (2013). [DOI] [PubMed] [Google Scholar]
- 33.Garcia-Diaz A et al. Interferon Receptor Signaling Pathways Regulating PD-L1 and PD-L2 Expression. Cell Rep. 19, 1189–1201 (2017). [DOI] [PMC free article] [PubMed] [Google Scholar]
- 34.Gazzinelli RT et al. Parasite-induced IL-12 stimulates early IFN-gamma synthesis and resistance during acute infection with Toxoplasma gondii. J. Immunol 153, 2533–43 (1994). [PubMed] [Google Scholar]
- 35.Chikuma S et al. PD-1-Mediated Suppression of IL-2 Production Induces CD8 + T Cell Anergy In Vivo . J. Immunol 182, 6682–6689 (2009). [DOI] [PubMed] [Google Scholar]
- 36.Tan CL et al. PD-1 restraint of regulatory T cell suppressive activity is critical for immune tolerance. J. Exp. Med 218, (2020). [DOI] [PMC free article] [PubMed] [Google Scholar]
- 37.Francisco LM et al. PD-L1 regulates the development, maintenance, and function of induced regulatory T cells. J. Exp. Med 206, 3015–3029 (2009). [DOI] [PMC free article] [PubMed] [Google Scholar]
- 38.Huang AC et al. A single dose of neoadjuvant PD-1 blockade predicts clinical outcomes in resectable melanoma. Nat. Med 25, 454–461 (2019). [DOI] [PMC free article] [PubMed] [Google Scholar]
- 39.Bally APR, Austin JW & Boss JM Genetic and Epigenetic Regulation of PD-1 Expression. J. Immunol 196, 2431–2437 (2016). [DOI] [PMC free article] [PubMed] [Google Scholar]
- 40.Chemnitz JM, Parry RV, Nichols KE, June CH & Riley JL SHP-1 and SHP-2 Associate with Immunoreceptor Tyrosine-Based Switch Motif of Programmed Death 1 upon Primary Human T Cell Stimulation, but Only Receptor Ligation Prevents T Cell Activation. J. Immunol 173, 945–954 (2004). [DOI] [PubMed] [Google Scholar]
- 41.Parry RV et al. CTLA-4 and PD-1 Receptors Inhibit T-Cell Activation by Distinct Mechanisms CTLA-4 and PD-1 Receptors Inhibit T-Cell Activation by Distinct Mechanisms †. Mol. Cell. Biol 25, 9543–9553 (2005). [DOI] [PMC free article] [PubMed] [Google Scholar]
- 42.Darrasse-Jèze G et al. Feedback control of regulatory T cell homeostasis by dendritic cells in vivo. J. Exp. Med 206, 1853–1862 (2009). [DOI] [PMC free article] [PubMed] [Google Scholar]
- 43.Wohn C et al. Absence of MHC class II on cDC1 dendritic cells triggers fatal autoimmunity to a cross-presented self-antigen. Sci. Immunol 5, (2020). [DOI] [PubMed] [Google Scholar]
- 44.Mcberry C et al. PD-1 modulates steady-state and infection-induced IL-10 production in vivo. Eur. J. Immunol 44, 469–479 (2014). [DOI] [PMC free article] [PubMed] [Google Scholar]
- 45.Belkaid Y et al. The role of interleukin (IL)-10 in the persistence of Leishmania major in the skin after healing and the therapeutic potential of anti-IL-10 receptor antibody for sterile cure. J. Exp. Med 194, 1497–1506 (2001). [DOI] [PMC free article] [PubMed] [Google Scholar]
- 46.Bhadra R, Gigley JP, Weiss LM & Khan IA Control of Toxoplasma reactivation by rescue of dysfunctional CD8+ T-cell response via PD-1-PDL-1 blockade. Proc. Natl. Acad. Sci. U. S. A 108, 9196–201 (2011). [DOI] [PMC free article] [PubMed] [Google Scholar]
- 47.Pack AD, Collins MH, Rosenberg CS & Tarleton RL Highly competent, non-exhausted CD8+ T cells continue to tightly control pathogen load throughout chronic Trypanosoma cruzi infection. PLoS Pathog. 14, 1–20 (2018). [DOI] [PMC free article] [PubMed] [Google Scholar]
- 48.Xu D et al. A Potential New Pathway for PD-L1 Costimulation of the CD8-T Cell Response to Listeria monocytogenes Infection. (2013) doi: 10.1371/journal.pone.0056539. [DOI] [PMC free article] [PubMed] [Google Scholar]
- 49.Kauffman KD et al. PD-1 blockade exacerbates Mycobacterium tuberculosis infection in rhesus macaques. Sci. Immunol 6, 139–148 (2021). [DOI] [PMC free article] [PubMed] [Google Scholar]
- 50.Ogishi M et al. Inherited PD-1 deficiency underlies tuberculosis and autoimmunity in a child. Nat. Med 27, 1646–1654 (2021). [DOI] [PMC free article] [PubMed] [Google Scholar]
- 51.Holt MP, Punkosdy GA, Glass DD & Shevach EM TCR Signaling and CD28/CTLA-4 Signaling Cooperatively Modulate T Regulatory Cell Homeostasis. J. Immunol 198, 1503–1511 (2017). [DOI] [PMC free article] [PubMed] [Google Scholar]
- 52.Paterson AM et al. Deletion of CTLA-4 on regulatory T cells during adulthood leads to resistance to autoimmunity. J. Exp. Med 212, 1603–1621 (2015). [DOI] [PMC free article] [PubMed] [Google Scholar]
Methods-specific References
- 53.Wang S et al. Infection-induced intestinal dysbiosis is mediated by macrophage activation and nitrate production. MBio 10, 1–13 (2019). [DOI] [PMC free article] [PubMed] [Google Scholar]
- 54.Klover PJ et al. Loss of STAT1 from mouse mammary epithelium results in an increased neu-induced tumor burden. Neoplasia 12, 899–905 (2010). [DOI] [PMC free article] [PubMed] [Google Scholar]
- 55.Md Sakib Hossain D et al. Dinaciclib induces immunogenic cell death and enhances anti- PD1–mediated tumor suppression. J. Clin. Invest 128, 644–654 (2018). [DOI] [PMC free article] [PubMed] [Google Scholar]
- 56.Bray NL, Pimentel H, Melsted P & Pachter L Near-optimal probabilistic RNA-seq quantification. Nat. Biotechnol 34, 525–527 (2016). [DOI] [PubMed] [Google Scholar]
- 57.Ritchie ME et al. Limma powers differential expression analyses for RNA-sequencing and microarray studies. Nucleic Acids Res. 43, e47 (2015). [DOI] [PMC free article] [PubMed] [Google Scholar]
- 58.Galili T, O’Callaghan A, Sidi J & Sievert C Heatmaply: An R package for creating interactive cluster heatmaps for online publishing. Bioinformatics 34, 1600–1602 (2018). [DOI] [PMC free article] [PubMed] [Google Scholar]
- 59.Samusik N, Good Z, Spitzer MH, Davis KL & Nolan GP Automated mapping of phenotype space with single-cell data. Nat. Methods 13, 493–496 (2016). [DOI] [PMC free article] [PubMed] [Google Scholar]
Associated Data
This section collects any data citations, data availability statements, or supplementary materials included in this article.
Supplementary Materials
Supplementary Table 1 – Reagent information.
Statistical source data.
Statistical source data.
Statistical source data.
Statistical source data.
Statistical source data.
Statistical source data.
Statistical source data.
Statistical source data.
Statistical source data.
Statistical source data.
Statistical source data.
Statistical source data.
Statistical source data.
Statistical source data.
Statistical source data.
Statistical source data.
Statistical source data.
Data Availability Statement
RNAseq datasets discussed in this publication have been deposited in NCBI’s Gene Expression Omnibus and are accessible through GEO Series accession number GSE186350 (https://www.ncbi.nlm.nih.gov/geo/query/acc.cgi?acc=GSE186350). The remaining data that support the findings of this study are available on request from the corresponding author C.A. Hunter.


