Abstract
Retinal ganglion cells (RGC) are lost as a sequela of optic nerve inflammation in myelin oligodendrocyte glycoprotein antibody associated disease (MOGAD), but the mechanisms of injury remain incompletely understood and there remains a need to characterize the murine model of MOGAD. Several studies have shown that RGC loss occurs in association with optic neuritis in MOG35–55 experimental autoimmune encephalomyelitis (EAE), but retinal pathology has not been studied in the double transgenic opticospinal EAE (OSE) model, in which animals develop spontaneous disease associated with MOG35–55 peptide specific T cells and B cells producing MOG-specific antibodies. Herein, we show that at 8-weeks OSE mice develop optic nerve inflammation, reactive astrogliosis, and RGC loss. By 10-weeks of age, affected mice have a 50% reduction in RGCs as compared to age matched wild type mice without EAE. The retinal pathology that ensues from spontaneous optic neuritis in OSE mice mirrors that seen following human optic neuritis and may be a useful model for screening neuroprotective compounds for MOGAD and other diseases with optic neuritis.
Keywords: EAE, astrocytes, retinal ganglion cells, optic neuritis
Graphical Abstract
1. Introduction
The spectrum of diseases associated with acute optic neuritis continues to broaden and includes multiple sclerosis (MS), neuromyelitis optica spectrum disorder (NMOSD), and myelin oligodendrocyte glycoprotein (MOG) antibody associated disease (MOGAD). Notably, visual and structural retinal outcomes between these three conditions appear to differ markedly, and recent evidence suggests underlying differences in the anterior visual pathway pathology (Filippatou et al., 2020, Hoftberger et al., 2020).
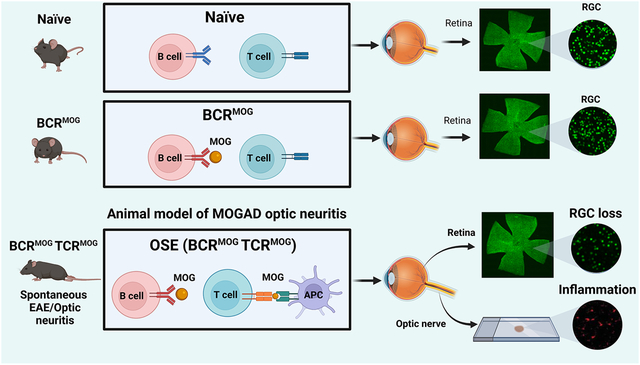
In order to model the pathogenesis of these disease processes, we and others have previously reported on the timing and extent of reactive gliosis and retinal ganglion cell loss (RGC) in the classical MOG35–55 induced experimental autoimmune encephalomyelitis (EAE) model in C57/B6 mice (Dietrich et al., 2019, Jin et al., 2019). Retinal ganglion cell (RGC) pathology has also been described in MOG-specific TCR transgenic mice (2D2) mice expressing a transgenic TCR recognizing MOG35–55 peptide (Bettelli et al., 2003, Guan et al., 2006). Approximately 30% of these animals sustain spontaneous optic neuritis resulting in 30–40% reduction in RGCs in affected eyes. However, the timing and extent of retinal pathology has not been reported in the double transgenic opticospinal spontaneous EAE (OSE) model (Krishnamoorthy et al., 2006). In this model, MOG-specific TCR transgenic mice (2D2 mice) are crossed with MOG-specific Ig heavy-chain knock-in mice (IgH MOG, Th mice) in which B lymphocytes produce demyelinating MOG-specific antibody (8.18C5) (Linnington et al., 1984). In OSE mice the mean onset of disease is at 6 weeks of age in both males and females. Lesions are located in the spinal cord and optic nerve and infiltrates are predominately composed of macrophages and CD4+ T cells, with few CD8+ T cells and B cells, which closely reflects MOGAD pathology in humans (Hoftberger, Guo, 2020).
Herein, we report that OSE mice in our facility developed EAE between 4–6 weeks of age with a cumulative incidence of 76%. Of mice with behavioral signs of EAE, we detected significant loss of RGCs at both 8 and 10 weeks. This was associated with classical CD4+ T cell infiltrates and reactive gliosis in the optic nerve. Th mice did not develop EAE, nor did they have detectable RGC loss, although interestingly some mice exhibited mild optic nerve and retinal pathological changes of a similar nature to the OSE mice.
2. Material and methods
2.2. Animals and behavior score
2D2 TCR transgenic mice (also known as TCRMOG mice) and Th mice (also known as IgH MOG or BCRMOG mice) were purchased from the Jackson Laboratory. Wild type C57/B6 mice were used as controls. Mice were housed in the pathogen-free, temperature-controlled animal facility at the Johns Hopkins University School of Medicine with 12 hours/12 hours light/dark cycles and fed with standard food and water ad libitum. The National Institutes of Health guidelines for the use of experimental animals were exactly followed and all experimental protocols were approved by the Johns Hopkins Institutional Animal Care and Use Committee. The two transgenic mice lines were cross bred and male and female double positive mice were used for further experiments. Mice were monitored from 4-weeks to 15-weeks of age. Body weight was measured and clinical EAE behavioral scores were graded daily by a person blind to mouse genotype. The standard scoring used was as published previously, with standard EAE scored from 1 to 5 (Jin, Smith, 2019). Briefly, no disease signs=0; loss of tail tonicity=1; loss of tail tonicity and mild paralysis of hindlimbs=2; paralysis of hindlimbs=3; hindlimb paralysis and mild paralysis of forelimbs=4; and complete paralysis or death=5.
2.3. Tissue preparation.
Mice were anesthetized at indicated ages using isoflurane and then cardiac perfused with 30 mL phosphate buffered saline (PBS). Eyes, together with optic nerve, were enucleated from eye socket rapidly using curved dressing forceps and immersed into 4% paraformaldehyde (PFA) immediately. After 3 hours of fixation, eyeballs were transferred into 30% sucrose overnight or until sinking to the container bottom to guarantee cryoprotection for sectioning.
Retina and optic nerve tissue processes were handled as described previously. Whole flat mount retinas were prepared for staining with anti-Brn3a (POU4F1) antibody to quantify RGC numbers. The fellow eye was used to make retinal cross-sections from an Optimal Cutting Temperature compound (OCT) block by snap freezing with 2-methylbutane and stored at −80°C. Eyes in the OCT block were sectioned at 16 μm and mounted onto slides for further staining with indicated antibodies.
One optic nerve from each mouse was divided into three parts evenly and then made into an OCT block for sectioning. The block was snap frozen and then stored at −80°C. Optic nerve was cross sectioned at 10 μm and sections were mounted to slides for immunofluorescence staining.
2.4. Immunofluorescence staining and image analysis
Flat mount retinal staining was performed using anti-Brn3a antibody, which labels the majority of RGCs with the notable exception of the melanopsin-expressing, intrinsically photosensitive RGCs that comprise only 1% of total RGCs. Briefly, retinas were permeabilized with PBS containing 3% Triton X-100, then blocked with blocking buffer (PBS containing 5% normal donkey serum and 1% Triton X-100) for 2 hours at room temperature. After blocking, anti-Brn3a antibody, diluted with blocking buffer, was incubated for 3 overnight at 4°C with gentle shaking. Sections were then washed 3 times with PBS for one hour at room temperature, then incubated with donkey-anti-goat IgG conjugated with Alexa-647 overnight at 4°C with gentle shaking. Following a final rinse, retinas were stained with Hoechst and mounted on slides using Aqua-Poly/Mount medium. Retinas were imaged using a Zeiss Axio Observer Z1 epifluorescence microscope to quantify RGC number.
The vertical eyeball sections and optic nerve cross sections were stained with the indicated antibodies using standard immunofluorescence staining protocols with some revision for each antibody. Briefly, we permeabilized sections with PBS (with 0.4% of Triton X-100) then blocked with blocking buffer (PBS+5% normal donkey serum+ 0.1–0.3% Triton X-100) for 45 minutes to one hour at room temperature. Primary antibodies were incubated with optimized concentrations overnight at 4°C. The next day, after 3 washes with PBS, species-specific secondary antibodies directly conjugated to Alexa fluorophores were incubated with sections for 1 hour at room temperature. After this incubation, sections were washed, and nuclear staining was performed with Hoechst. Sections were mounted with a coverslip using aqua poly/mount reagent (Polysciences, Warrington, PA, USA). After the mounting solution dried, the section was imaged. The antibody used for retinal and optic nerve pathologies included anti-β-III tubulin (BD Pharmingen, 1:100), anti-GFAP (DAKO, 1:500), anti-IBA-1 (Wako, 1:500), anti-CD4 (Biolegend, 1:100), anti-SMI31 (Biolegend, 1:250), anti-SMI32 (Biolegend, 1:250), anti-MBP (Cell Signaling Technology, 1:250), and anti-GFAP (Cell Signaling Technology, 1:250 for optic nerve and 1:500 for retina).
Axiovision software was used to capture images for further analysis. Regions of interest (ROI) in vertical section retina and optic nerve were delineated by solid lines. Each retina was divided into 12 areas in which RGCs were quantified, as described previously. For cross sections of the optic nerve, 9 sections were analyzed from three parts of each nerve. Mean fluorescent intensity (MFI) of staining was quantified using ImageJ software (National Institutes of Health) by a person blind to section identifiers. For T-cell enumeration, Zen Blue software (Carl Zeiss, Oberkochen, Germany) was used.
2.5. Semi-automatic RGC counts
RGC numbers per eye were obtained from the whole flat mount retinas. Whole retina images were captured at 20X using a Zeiss Axio Observer Z1 epifluorescence microscope with a motorized stage and a z-stack of 3 um × 16 stacks and merged mosaic image. In order to avoid regional bias, the whole flat retina image was segmented into center, middle and peripheral regions and 4 evenly distributed squares from each region were selected (Jin, Smith, 2019). The average RGC number from these 12 segmented regions was used to represent total RGC number for one mouse.
A customized MATLAB-based semi-automated RGC counting algorithm was used to evaluate RGC number in each mouse (Jin, Smith, 2019). Briefly, representative segments from whole flat mount retina images were exported and saved as tagged image file format (TIFF). Then using the custom MATLAB (MathWorks, Natick, MA, USA), size segmentation algorithm was applied. Brn3a+ cells in selected retinal regions undergo filtering, automatic or user-defined thresholding, and binarization followed by identification of cell boundaries. The total number of RGCs is automatically calculated. All analyses were performed by persons masked to sample identification.
2.6. Statistical analysis
GraphPad Prism software (GraphPad, San Diego, CA, USA) was used for statistical analyses. Comparisons between groups were performed using Welch’s ANOVA test and Dunnett’s T3 multiple comparisons test. Results were considered significant if the p value was <0.05. All data are presented as percent (%) of the mean of the naïve group unless specified. Error bars indicate SEM in all figures.
3. Results
3.1. OSE mice exhibited spontaneous EAE and had significant RGC loss
Double transgenic mice were monitored every day from 4 weeks (earliest onset of mild behavioral abnormalities) until 15 weeks of age. Behavioral score and body weight were evaluated daily by a rater blind to genotypes. OSE mice had worsening disease behavioral scores, reaching peak at 10-weeks of age (Figure 1a), which was the end point for our pathological study (in pilot studies we found that older mice had such severe retinal pathology that we could not reliably dissect and quantify the tissues). There was no sex difference in behavioral scores (Figure 1a). The overall incidence of spontaneous EAE in OSE mice was 76% at 15 weeks. At 4 weeks, 7% of OSE mice showed behavior deficit, while at 10 weeks more than 70 % of mice showed behavioral phenotypes (Figure 1b). Male and female mice had similar body weight at all time points we observed (Figure 1c).
Figure 1. Retinal ganglion cell (RGC) counts in OSE mice.
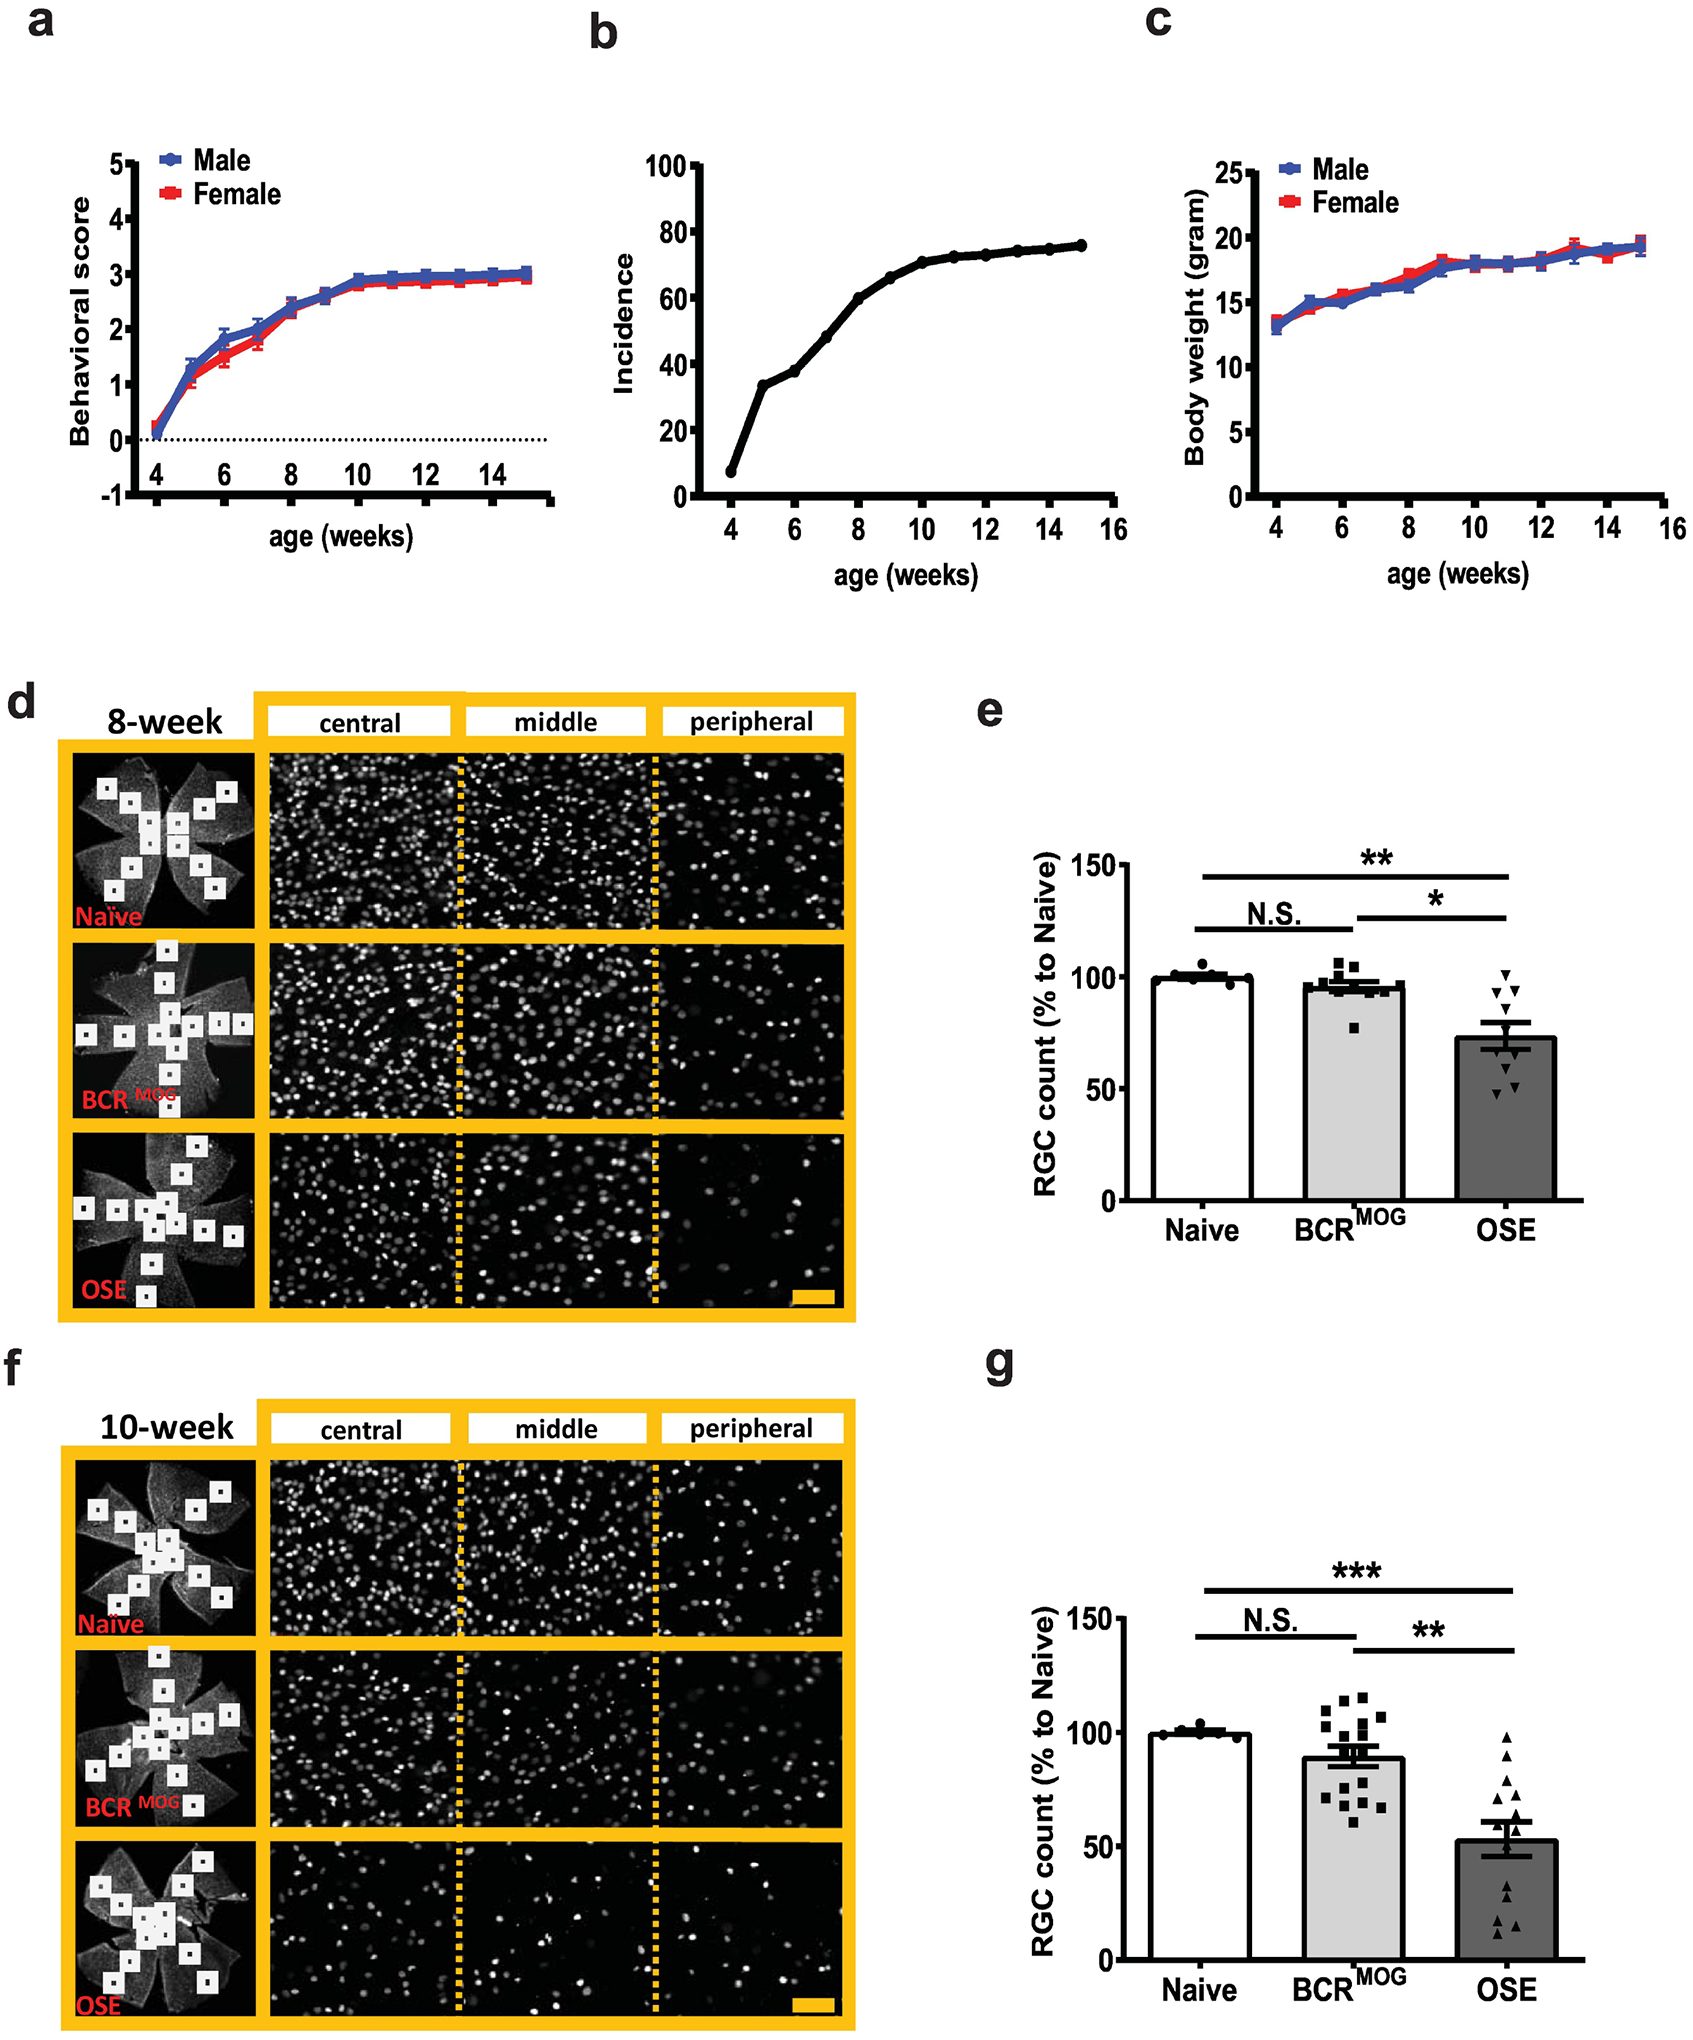
a) Behavioral score of OSE mice. b) Incidence of OSE mice. c) Body weight of OSE mice. RGC number was counted in flat mount retinas stained with the RGC specific marker, Brn-3a, in 8-week-old and 10-week-old mice, respectively. d) Representative images of Brn3a staining in flat-mount whole retinas from 8-week-old mice. e) Quantification of Brn3a+ RGC for 8-week-old mice (F=12.05, p=0.0002. Naïve vs BCRMOG, P=0.7353; Naïve vs OSE, P=0.0006; BCRMOG vs OSE, P=0.0012). f) Representative images of Brn3a staining in flat-mount whole retinas from 10-week-old mice. g) Quantification of Brn3a+ RGC count for 10-week-old mice (F=14.74, p<0.0001. Naïve vs BCRMOG, P=0.5623; Naïve vs OSE, P=0.0003; BCRMOG vs OSE, P=0.0001). Each dot from bar graph represents a mouse RGC count from the average of 12 segments of flat mount retina. Significance of RGC between groups was assessed by one-way ANOVA (** P ≤ 0.01, *** P ≤ 0.001, N.S. = no significance). Error bars represent SEM. Scale bar=20μm.
RGC number in the whole flat mount retina was evaluated at two different ages of symptomatic OSE mice (8 and 10 weeks) and compared with BCRMOG and naïve mice. Retinas were too fragile to be dissected at later timepoints due to severe disease. BCRMOG and naïve mice had similar numbers of RGCs at 8-weeks of age (BCRMOG was 95.5% ± 2.3% of the mean of naïve mice). However, OSE mice had a significant reduction in RGC numbers with an average of 73.6 ± 6.0 compared to naïve mice at 8 weeks (Figure 1d and e). At the ten-week time point, OSE mice had average of 53.2 ± 7.6% RGC compared to naïve mice, while BCRMOG mice still had a non-significant reduction with mean RGC being 89.4 ± 4.5% of naïve mice (Figure 1f and g).
3.2. OSE mice had severe neurite loss in the retina
OSE mice had severe neurite loss both at the GCL and IPL regions compared with those of naïve and BCRMOG mice at both 8 and 10 weeks of age (Figure 2 a–c). However, interestingly, in the IPL layer of BCRMOG, there was mild neurite loss vs naïve mice at 10 weeks of age (Figure 2b and c) even though the RGC count (Figure 1g) and Tuj intensity in the GCL layer (Figure 2b) were not significantly different between BCRMOG and naïve mice at same age.
Figure 2. OSE mouse had fewer neurite projections in the inner retina.
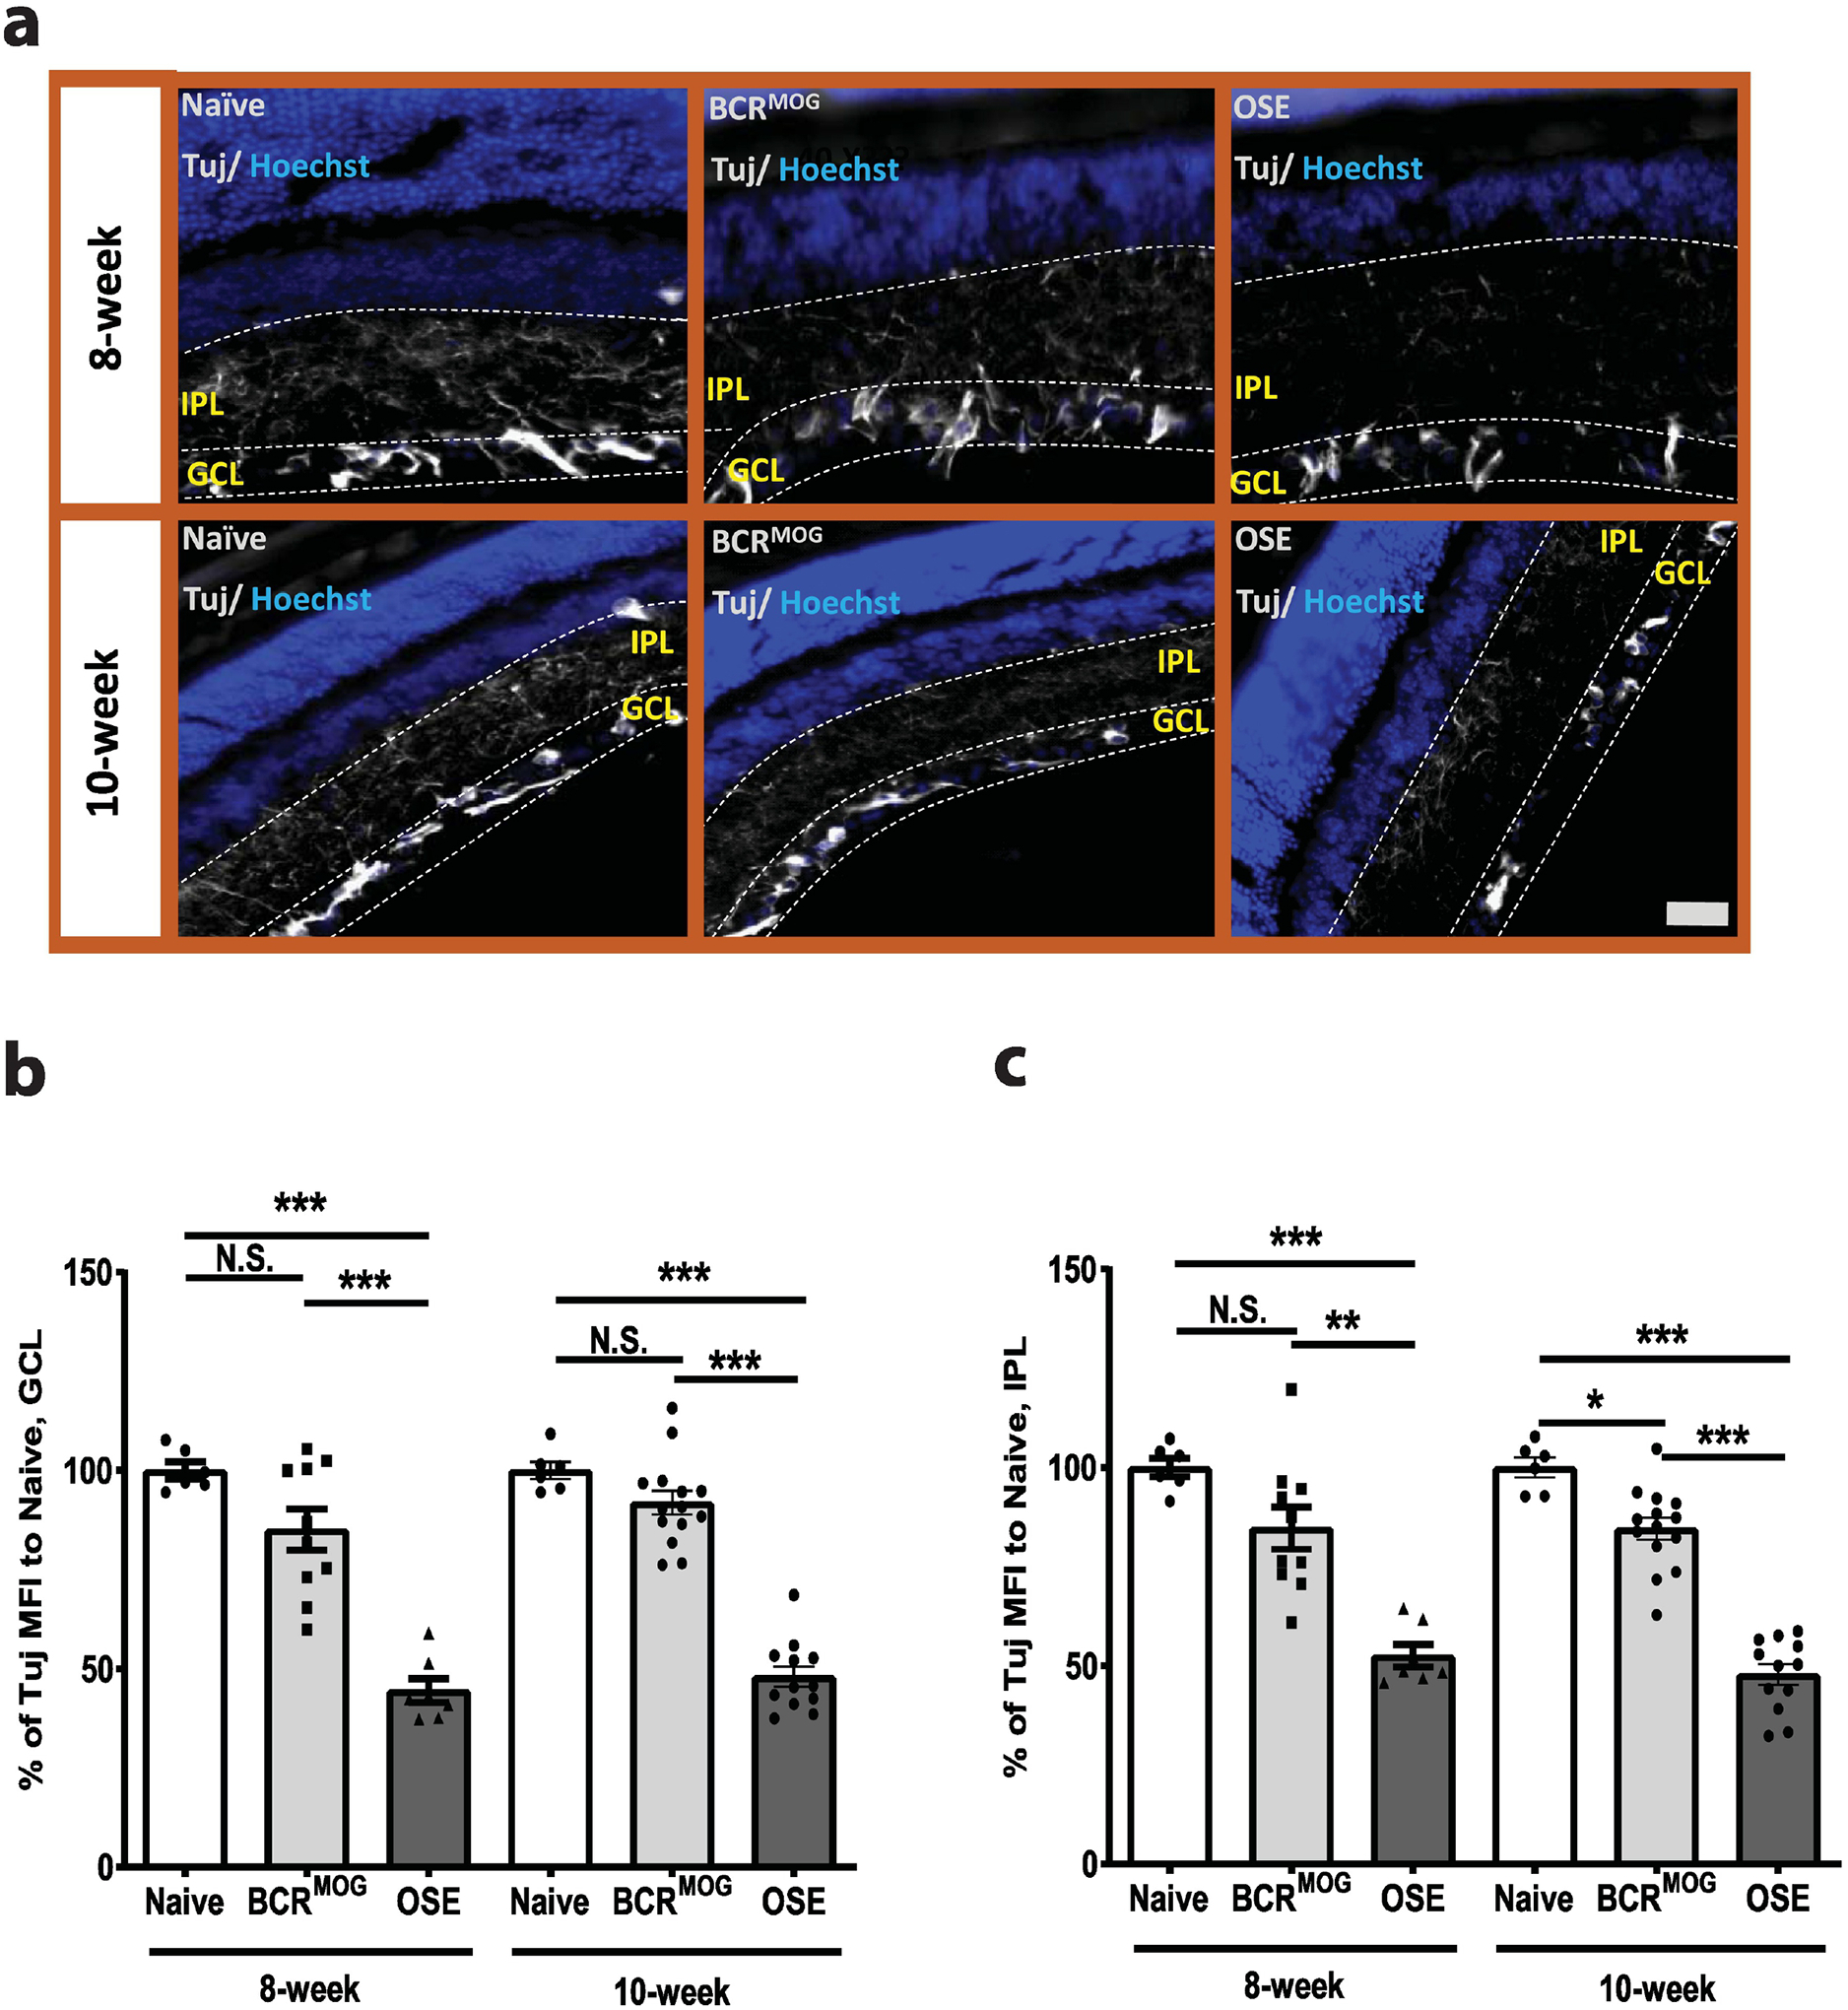
Anti-mouse β–III tubulin (Tuj) antibody was used to label neurite projections in vertically sectioned mouse retinas. a) Representative images of Tuj staining in vertical sectioned retina from 8-week-old and 10-week old mice. b) Quantification of Tuj staining in GCL layer of a) (F=48.50, p<0.0001. For 8-week: Naïve vs BCRMOG, P=0.0909; Naïve vs OSE, P<0.0001; BCRMOG vs OSE, P<0.0001. For 10-week: Naïve vs BCRMOG, P=0.6265; Naïve vs OSE, P<0.0001; BCRMOG vs OSE, P<0.0001). c) Quantification of Tuj staining in IPL layer of a) (F=38.78, p<0.0001. For 8-week: Naïve vs BCRMOG, P=0.0807; Naïve vs OSE, P<0.0001; BCRMOG vs OSE, P<0.0001. For 10-week: Naïve vs BCRMOG, P=0.0497; Naïve vs OSE, P<0.0001; BCRMOG vs OSE, P<0.0001). Each dot from bar graph represents one mouse. Significance of Tuj intensity level between groups was assessed by one-way ANOVA (* P ≤ 0.05, *** P ≤ 0.001, N.S. = no significance). Error bars represent SEM. Scale bar =50μm.
3.3. OSE mice had reactive gliosis in the inner retina
OSE mice had marked reactive astrogliosis in the GCL both at 8 weeks and 10 weeks of age (Figure 3a and b). However, activated astrocyte processes were restricted to the GCL. Microglia were activated in both the IPL and OPL of OSE mice compared with those of naïve and BCRMOG mice at 10 weeks old, respectively (Figure 4 a–c).
Figure 3. Activated astrocytes in the retina of OSE mice.
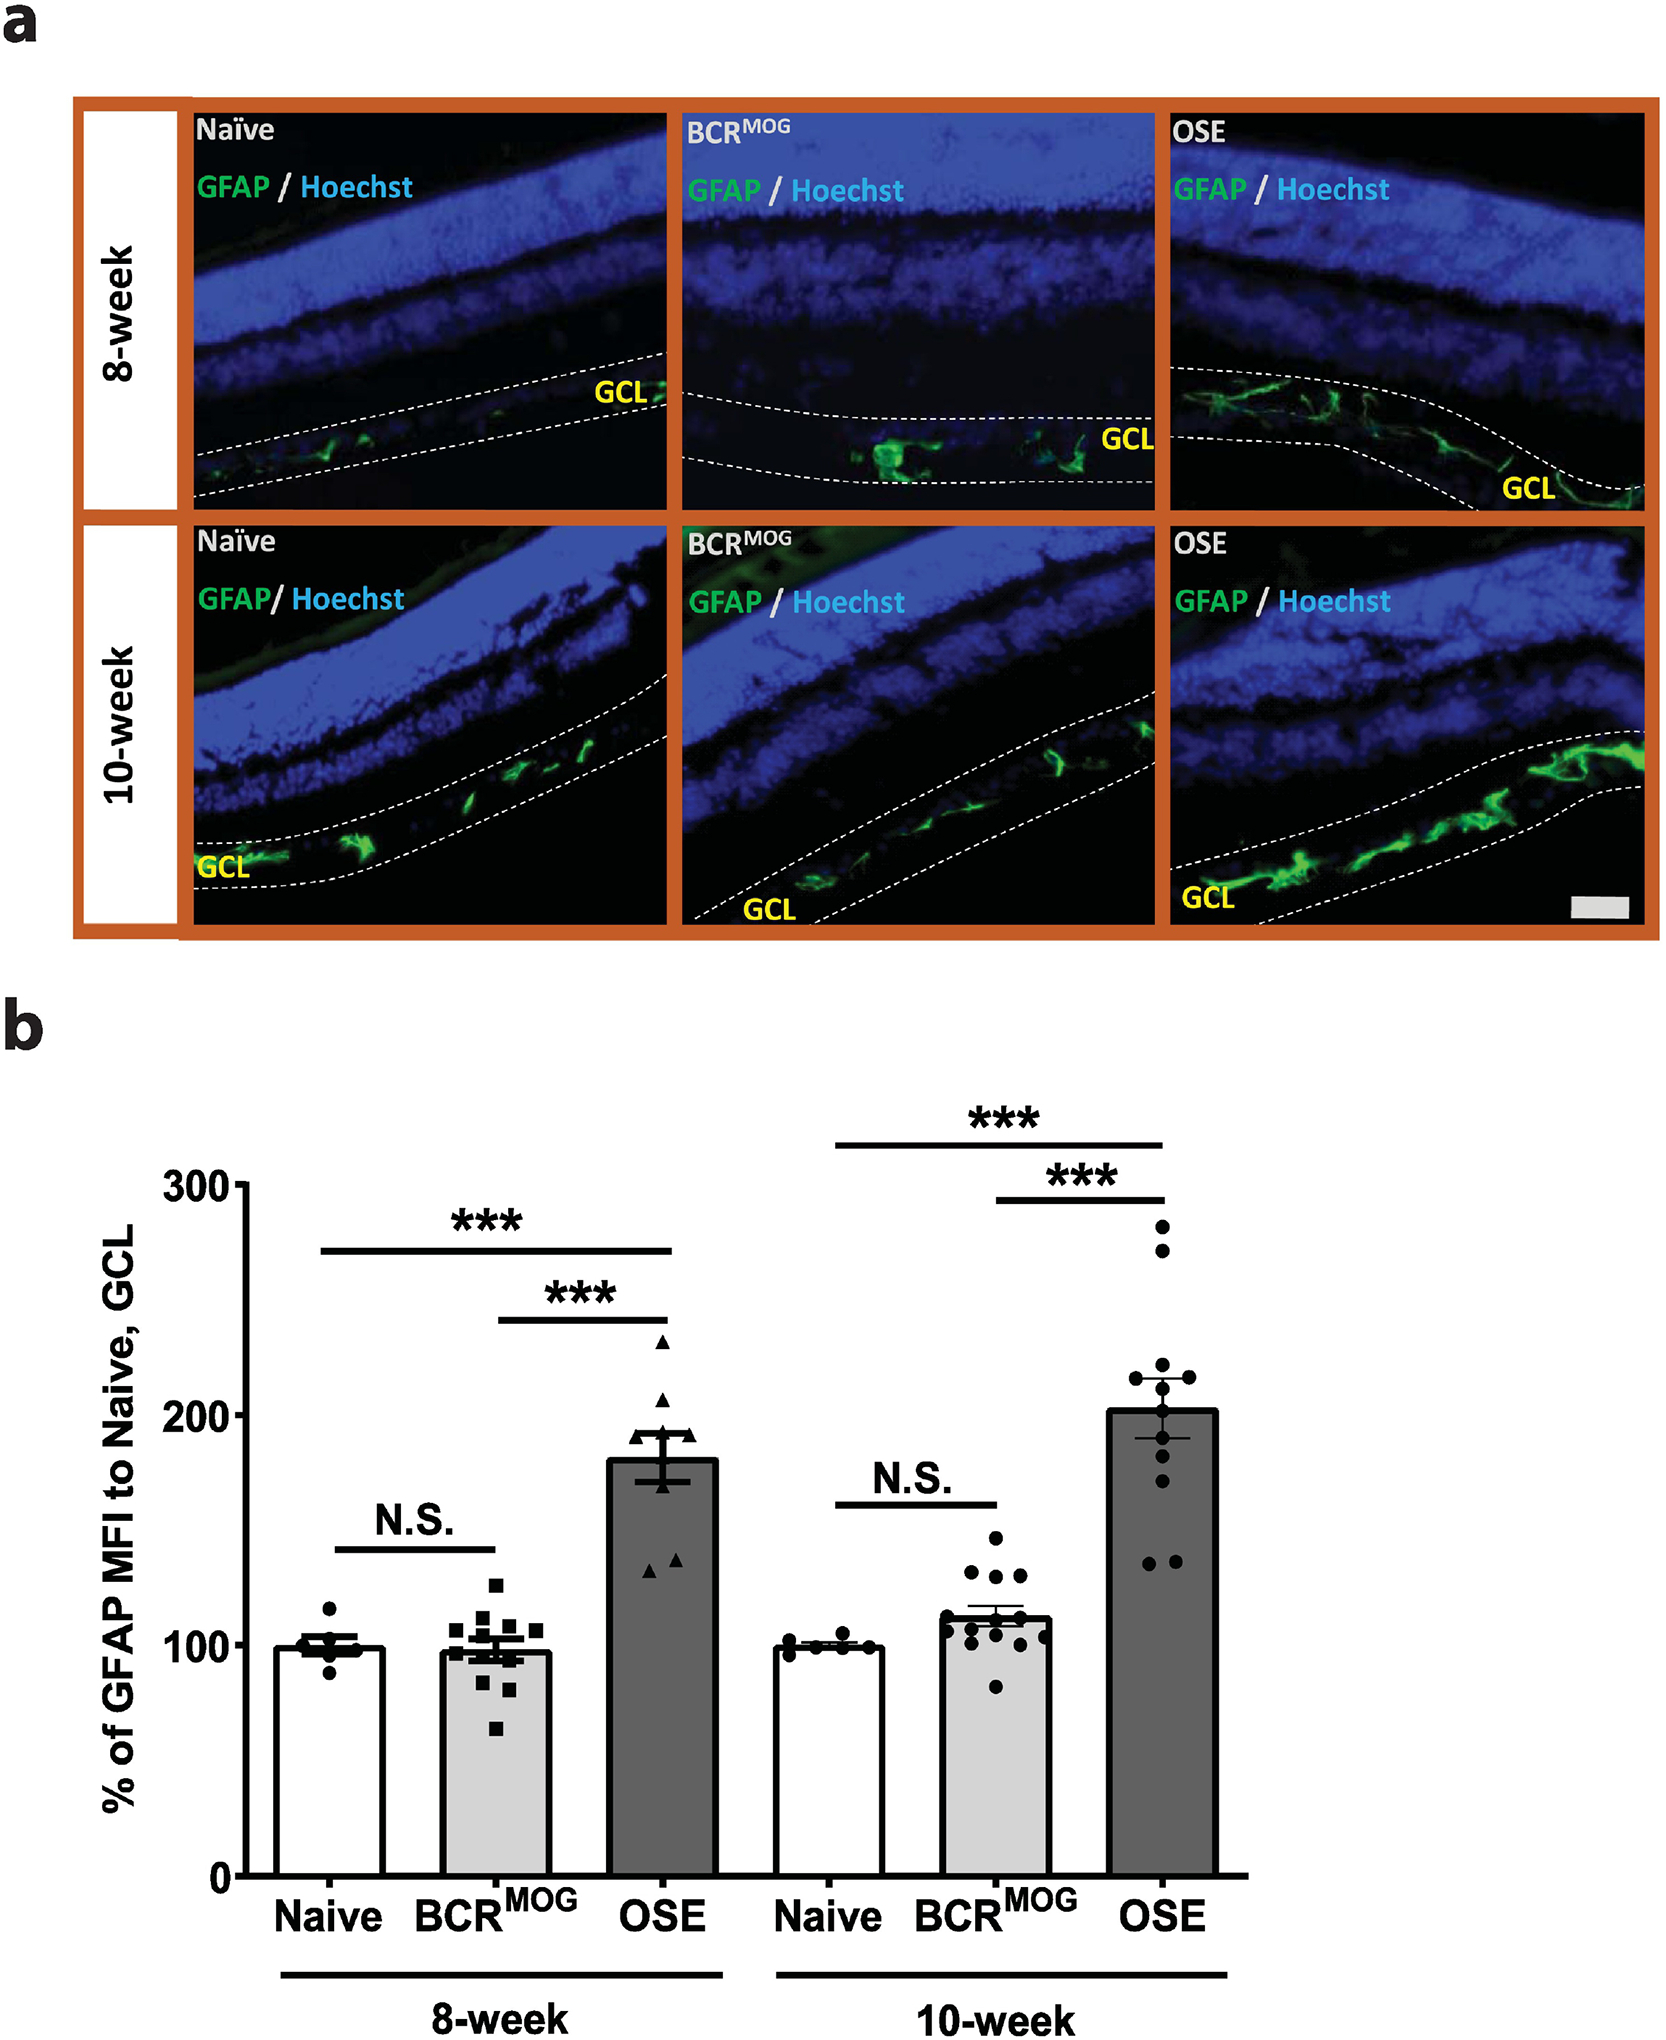
a) Representative images of astrocyte staining in the retina of OSE mice using anti-GFAP antibody. b) Quantification of GFAP expression in GCL layer of OSE mouse retina (F=32.25, p<0.0001. For 8-week: Naïve vs BCRMOG, P>0.9999; Naïve vs OSE, P<0.0001; BCRMOG vs OSE, P<0.0001. For 10-week: Naïve vs BCRMOG, P=0.9209; Naïve vs OSE, P<0.0001; BCRMOG vs OSE, P<0.0001). Each dot from bar graph represent one mouse. Significance of GFAP level between groups was assessed by One-way ANOVA (*** P ≤ 0.001, N.S. = no significance). Error bars represent SEM. Scale bar =50μm.
Figure 4. Microglia were activated in the inner retina of OSE mice.
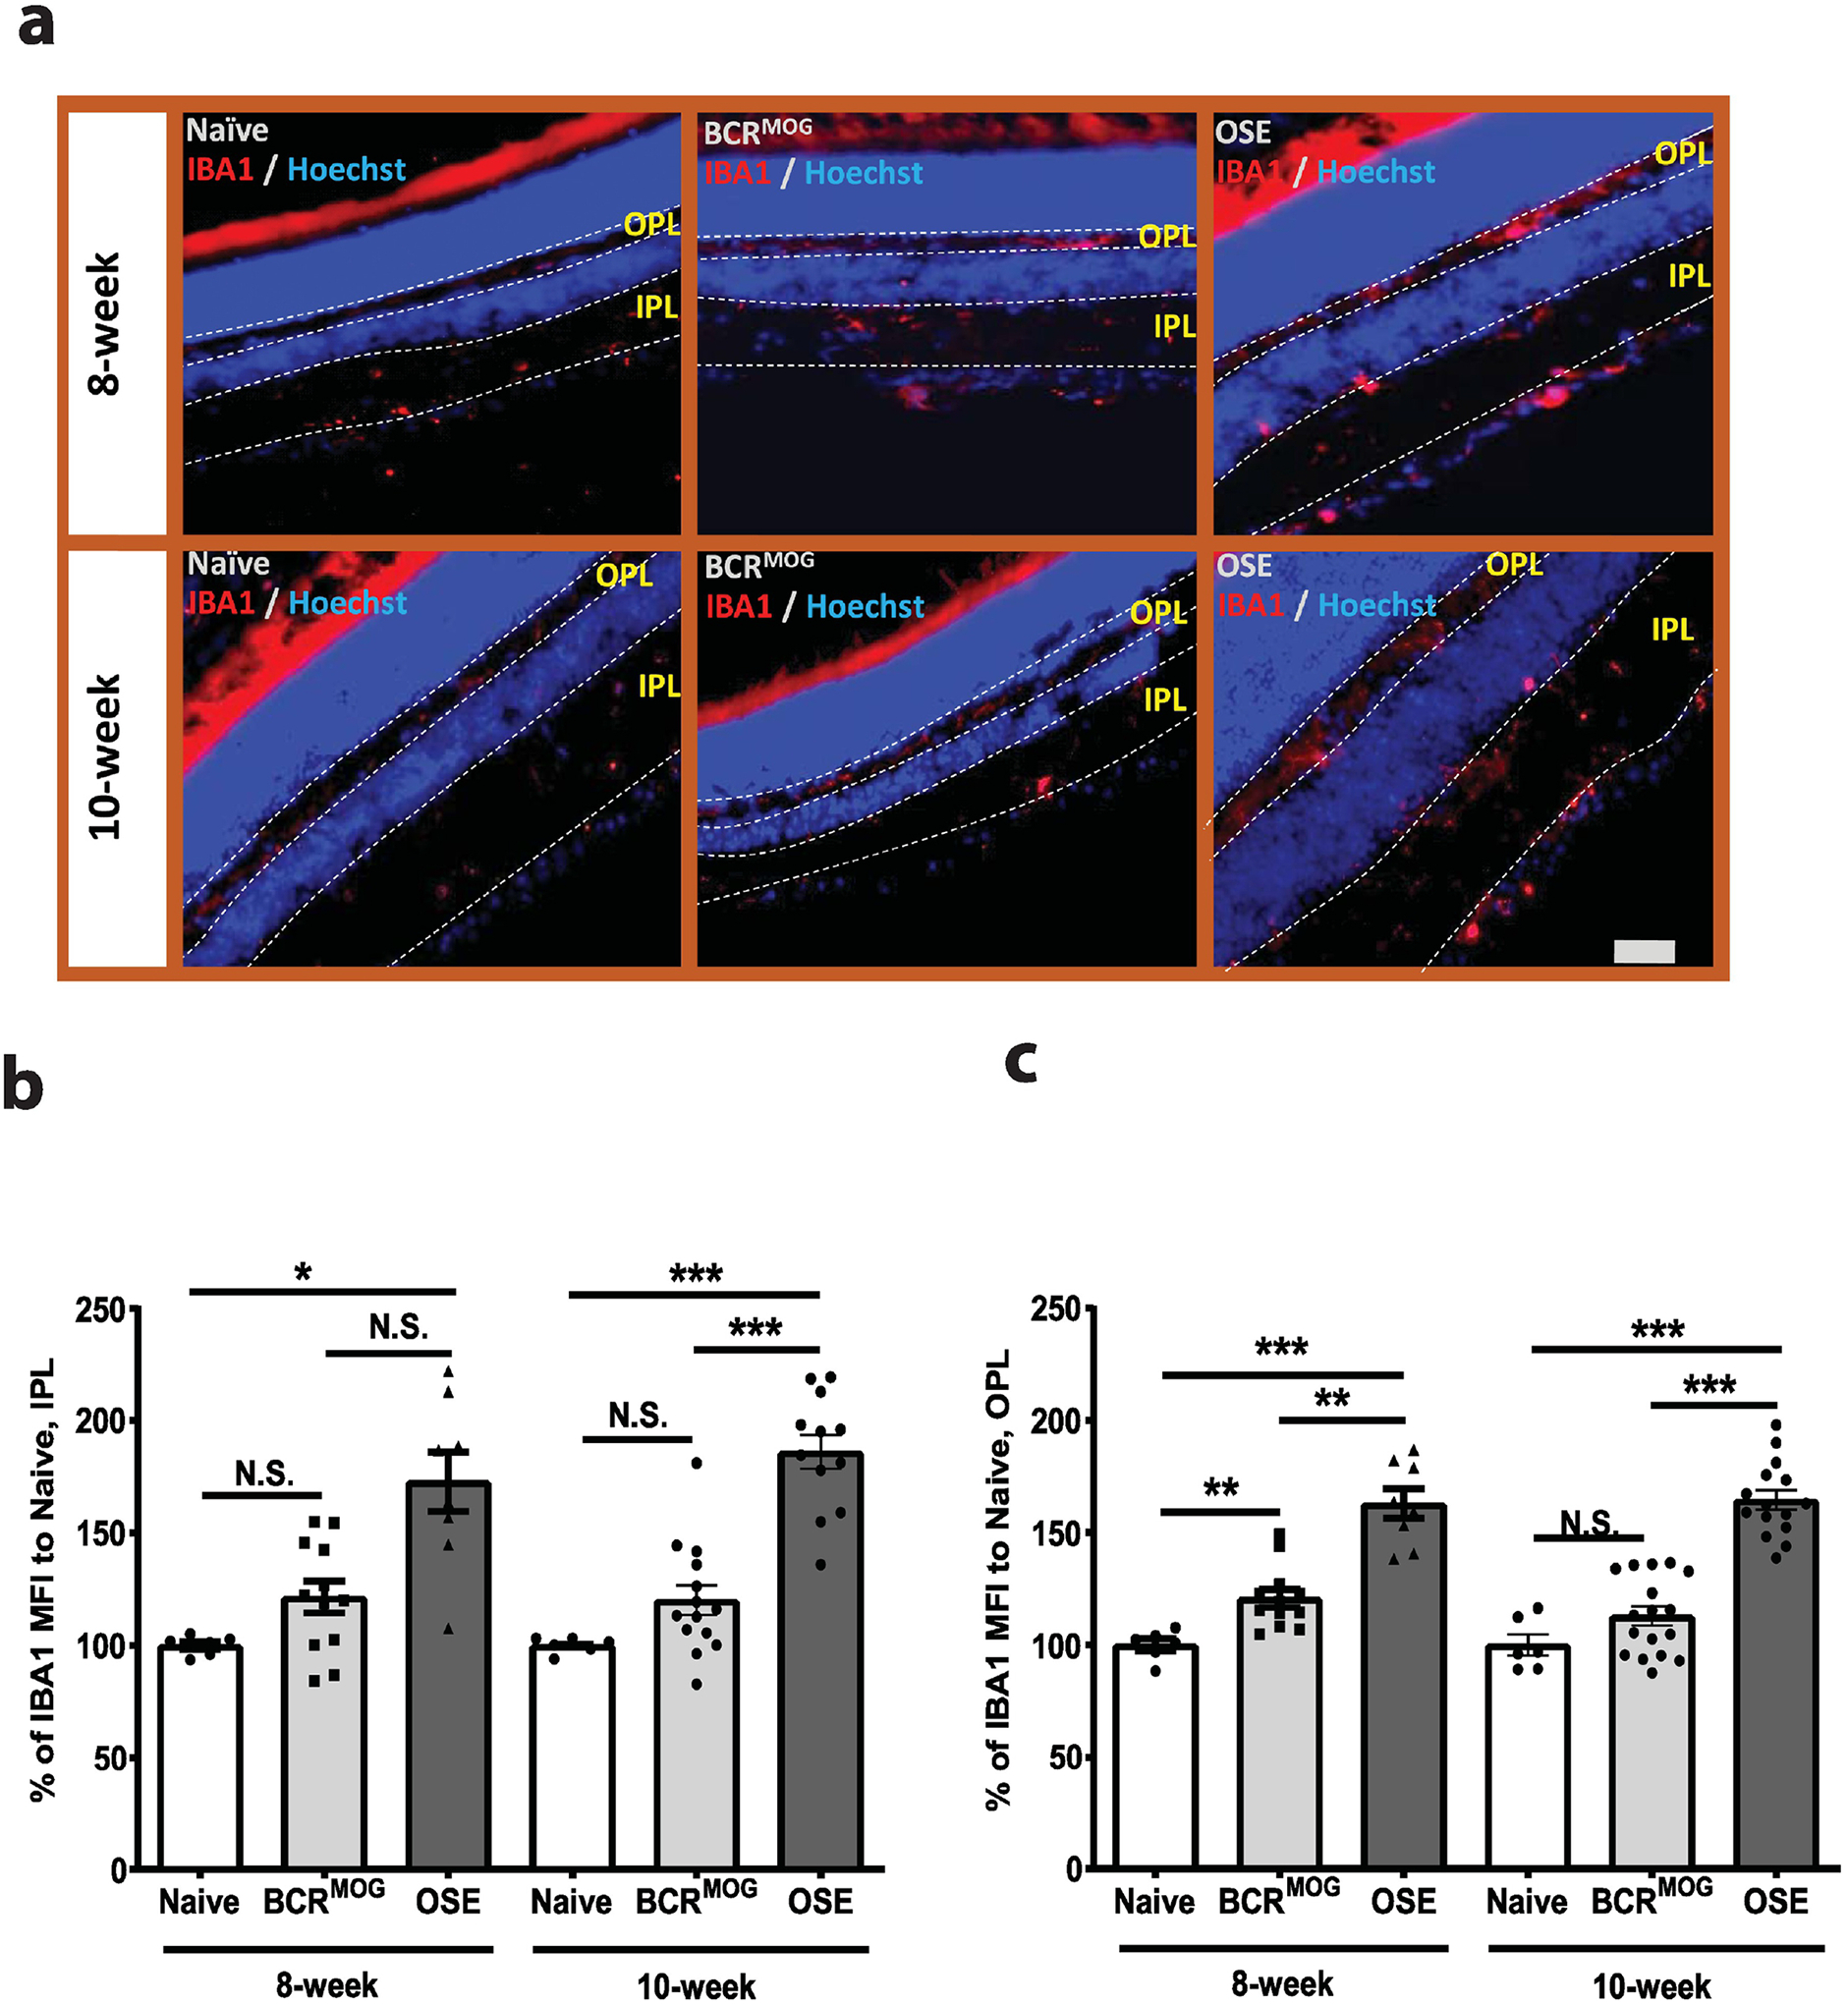
a) Representative images of microglia staining in the inner retina of OSE mice using anti-IBA1 antibody. b) Quantification of IBA1 expression in the IPL layer of OSE retinas (F=20.28, p<0.0001. For 8-week: Naïve vs BCRMOG, P=0.5154; Naïve vs OSE, P<0.0001; BCRMOG vs OSE, P=0.0005. For 10-week: Naïve vs BCRMOG, P=0.5606; Naïve vs OSE, P<0.0001; BCRMOG vs OSE, P<0.0001). c). Quantification of IBA1 expression in the OPL layer of OSE retinas (F=35.65, p<0.0001. For 8-week: Naïve vs BCRMOG, P=0.0994; Naïve vs OSE, P<0.0001; BCRMOG vs OSE, P<0.0001. For 10-week: Naïve vs BCRMOG, P=0.5105; Naïve vs OSE, P<0.0001; BCRMOG vs OSE, P<0.0001). Each dot from bar graph represents one mouse. Significance of IBA1 level between groups was assessed by one-way ANOVA (* P ≤ 0.05, ** P ≤ 0.01, *** P ≤ 0.001, N.S. = no significance). Error bars represent SEM. Scale bar =50μm.
3.4. OSE mice had persisting immune cell infiltration in the optic nerve
OSE mice had immune cell infiltration in the optic nerve at 8 weeks that persisted into 10 weeks (Figure 5a and b). BCRMOG mice had slightly more CD4+ T-cell infiltrates but were not significantly different from naïve mice at 8 weeks or 10 weeks of age (Figure 5a and b). Astrocytes and microglia were significantly activated in the parenchyma of the optic nerve in OSE mice as compared to those in naïve and BCRMOG mice at both 8 and 10 weeks of age (Figure 5c–f). The glial response was not significantly difference between BCRMOG and naïve mice (Figure 5 d and f).
Figure 5. CD4+ T-cell infiltration and glia response in the optic nerves of OSE mice.
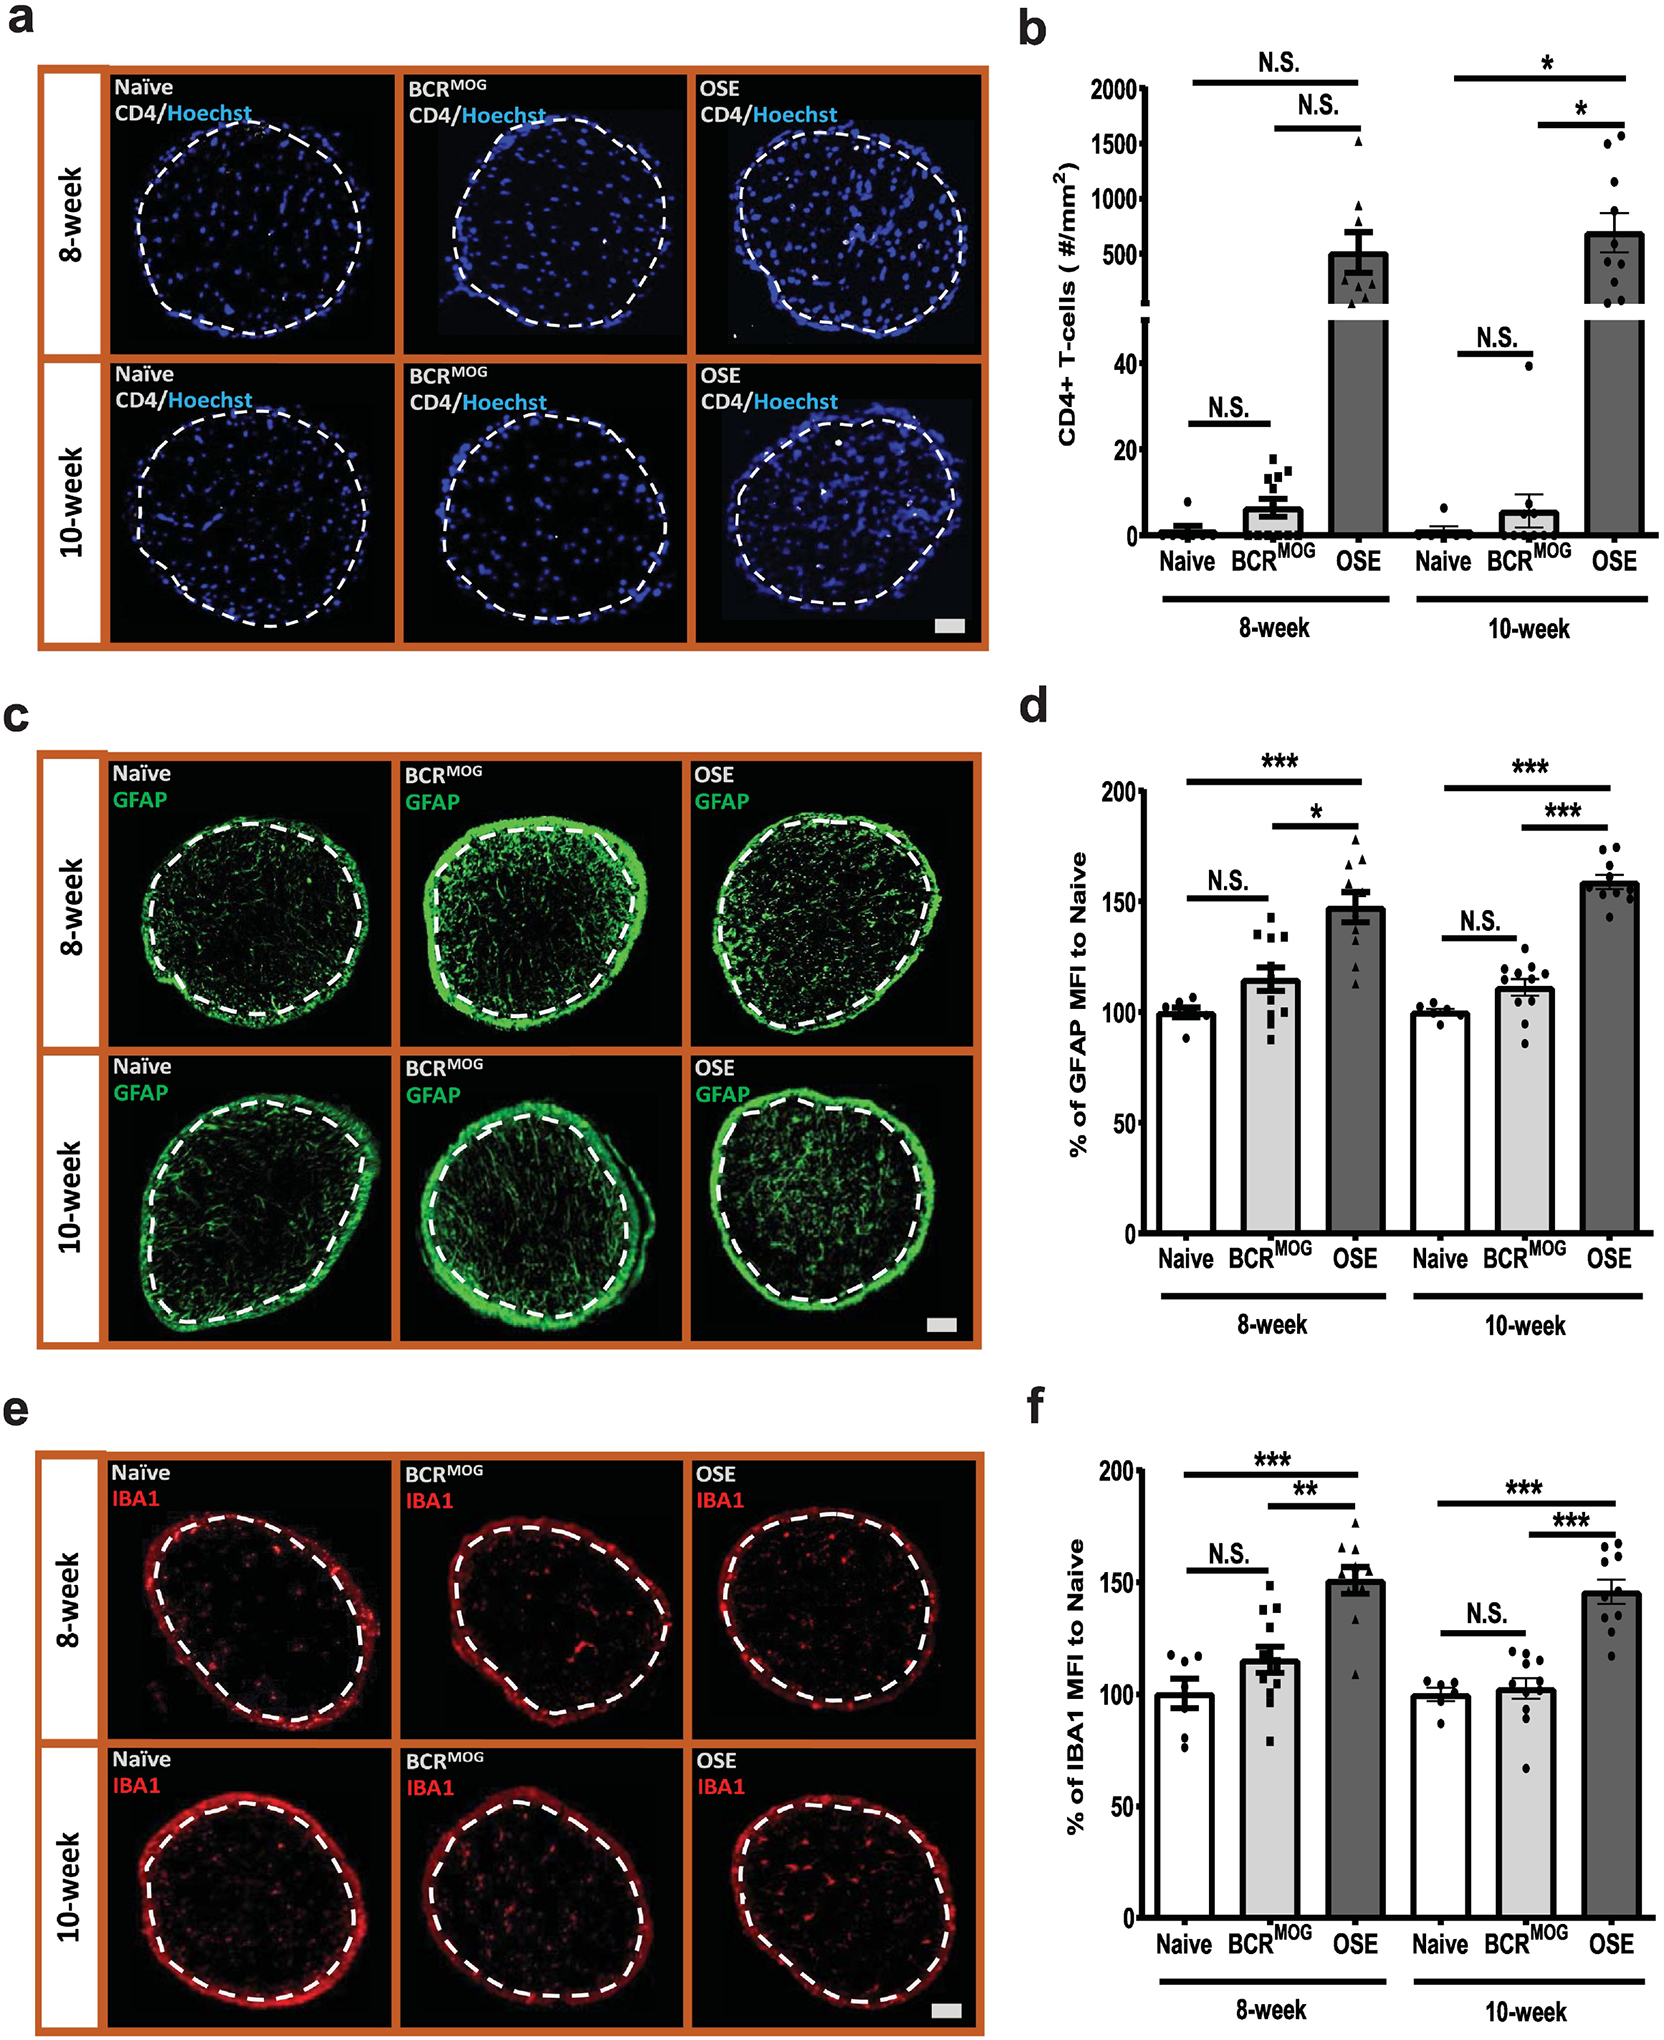
Immune cell infiltration was detected using anti-CD4 antibody. a) Represent images of CD4+ T-cell staining in the optic nerves of OSE mice. b) Quantification of CD4+ T-cell staining in the optic nerves of OSE mice (F=9.012, p<0.0001. For 8-week: Naïve vs BCRMOG, P>0.9999; Naïve vs OSE, P=0.0346; BCRMOG vs OSE, P=0.0125. For 10-week: Naïve vs BCRMOG, P=>0.9999; Naïve vs OSE, P=0.0015; BCRMOG vs OSE, P=0.0002). Glia cell response was detected with anti-GFAP and IBA1 antibody. c) Representative images of GFAP staining in the optic nerves of OSE mice. d) Quantification of GFAP staining in the optic nerves of OSE mice (F=26.33, p<0.0001. For 8-week: Naïve vs BCRMOG, P=0.2696; Naïve vs OSE, P<0.0001; BCRMOG vs OSE, P<0.0001. For 10-week: Naïve vs BCRMOG, P=6606; Naïve vs OSE, P<0.0001; BCRMOG vs OSE, P<0.0001). e) Representative images of IBA1 staining in the optic nerves of OSE mice. f) Quantification of IBA1 staining in the optic nerves of OSE mice. Each dot from bar graph represents one mouse (F=16.75, p<0.0001. For 8-week: Naïve vs BCRMOG, P=0.4561; Naïve vs OSE, P<0.0001; BCRMOG vs OSE, P=0.0002. For 10-week: Naïve vs BCRMOG, P=0.9996; Naïve vs OSE, P<0.0001; BCRMOG vs OSE, P<0.0001). Significance between groups was assessed by One-way ANOVA (* P ≤ 0.05, ** P ≤ 0.01, *** P ≤ 0.001, N.S. = no significance). Error bars represent SEM. Scale bar =50μm.
3.5. OSE mice had severe demyelination and axonal injury in the optic nerve
OSE mice exhibited severe optic neuritis both at 8 weeks and 10 weeks of age (Figure 6). There was marked demyelination, indicated by loss of MBP staining, in the parenchyma of optic nerve in OSE mice vs those of naïve and BCRMOG mice at both 8 and 10 weeks of age (Figure 6a and b). Healthy axons were labeled with antibody detecting phosphorylated neurofilament H, SMI31. There was significant SMI31 signal loss in the parenchyma of optic nerve in OSE mice vs those of naïve and BCRMOG mice at both 8 and 10 weeks of age (Figure 6c and d) suggesting axonal injury in the optic nerve of OSE mice. SMI-32 antibody was used to label non-phosphorylated neurofilament, which accumulates in congested axons. In the parenchyma of optic nerve of OSE mice, there were significantly increased numbers of SMI32+ spheroids vs those of naïve and BCRMOG mice both at 8 and 10 weeks of age indicating axonal stress in OSE mice (Figure 6e and f). BCRMOG mice exhibited modest but significant increases in SMI32+ spheroids as compared to naïve mice at both time points (Figure 6e and f).
Figure 6. OSE mice had severe myelin loss and axonal damage.
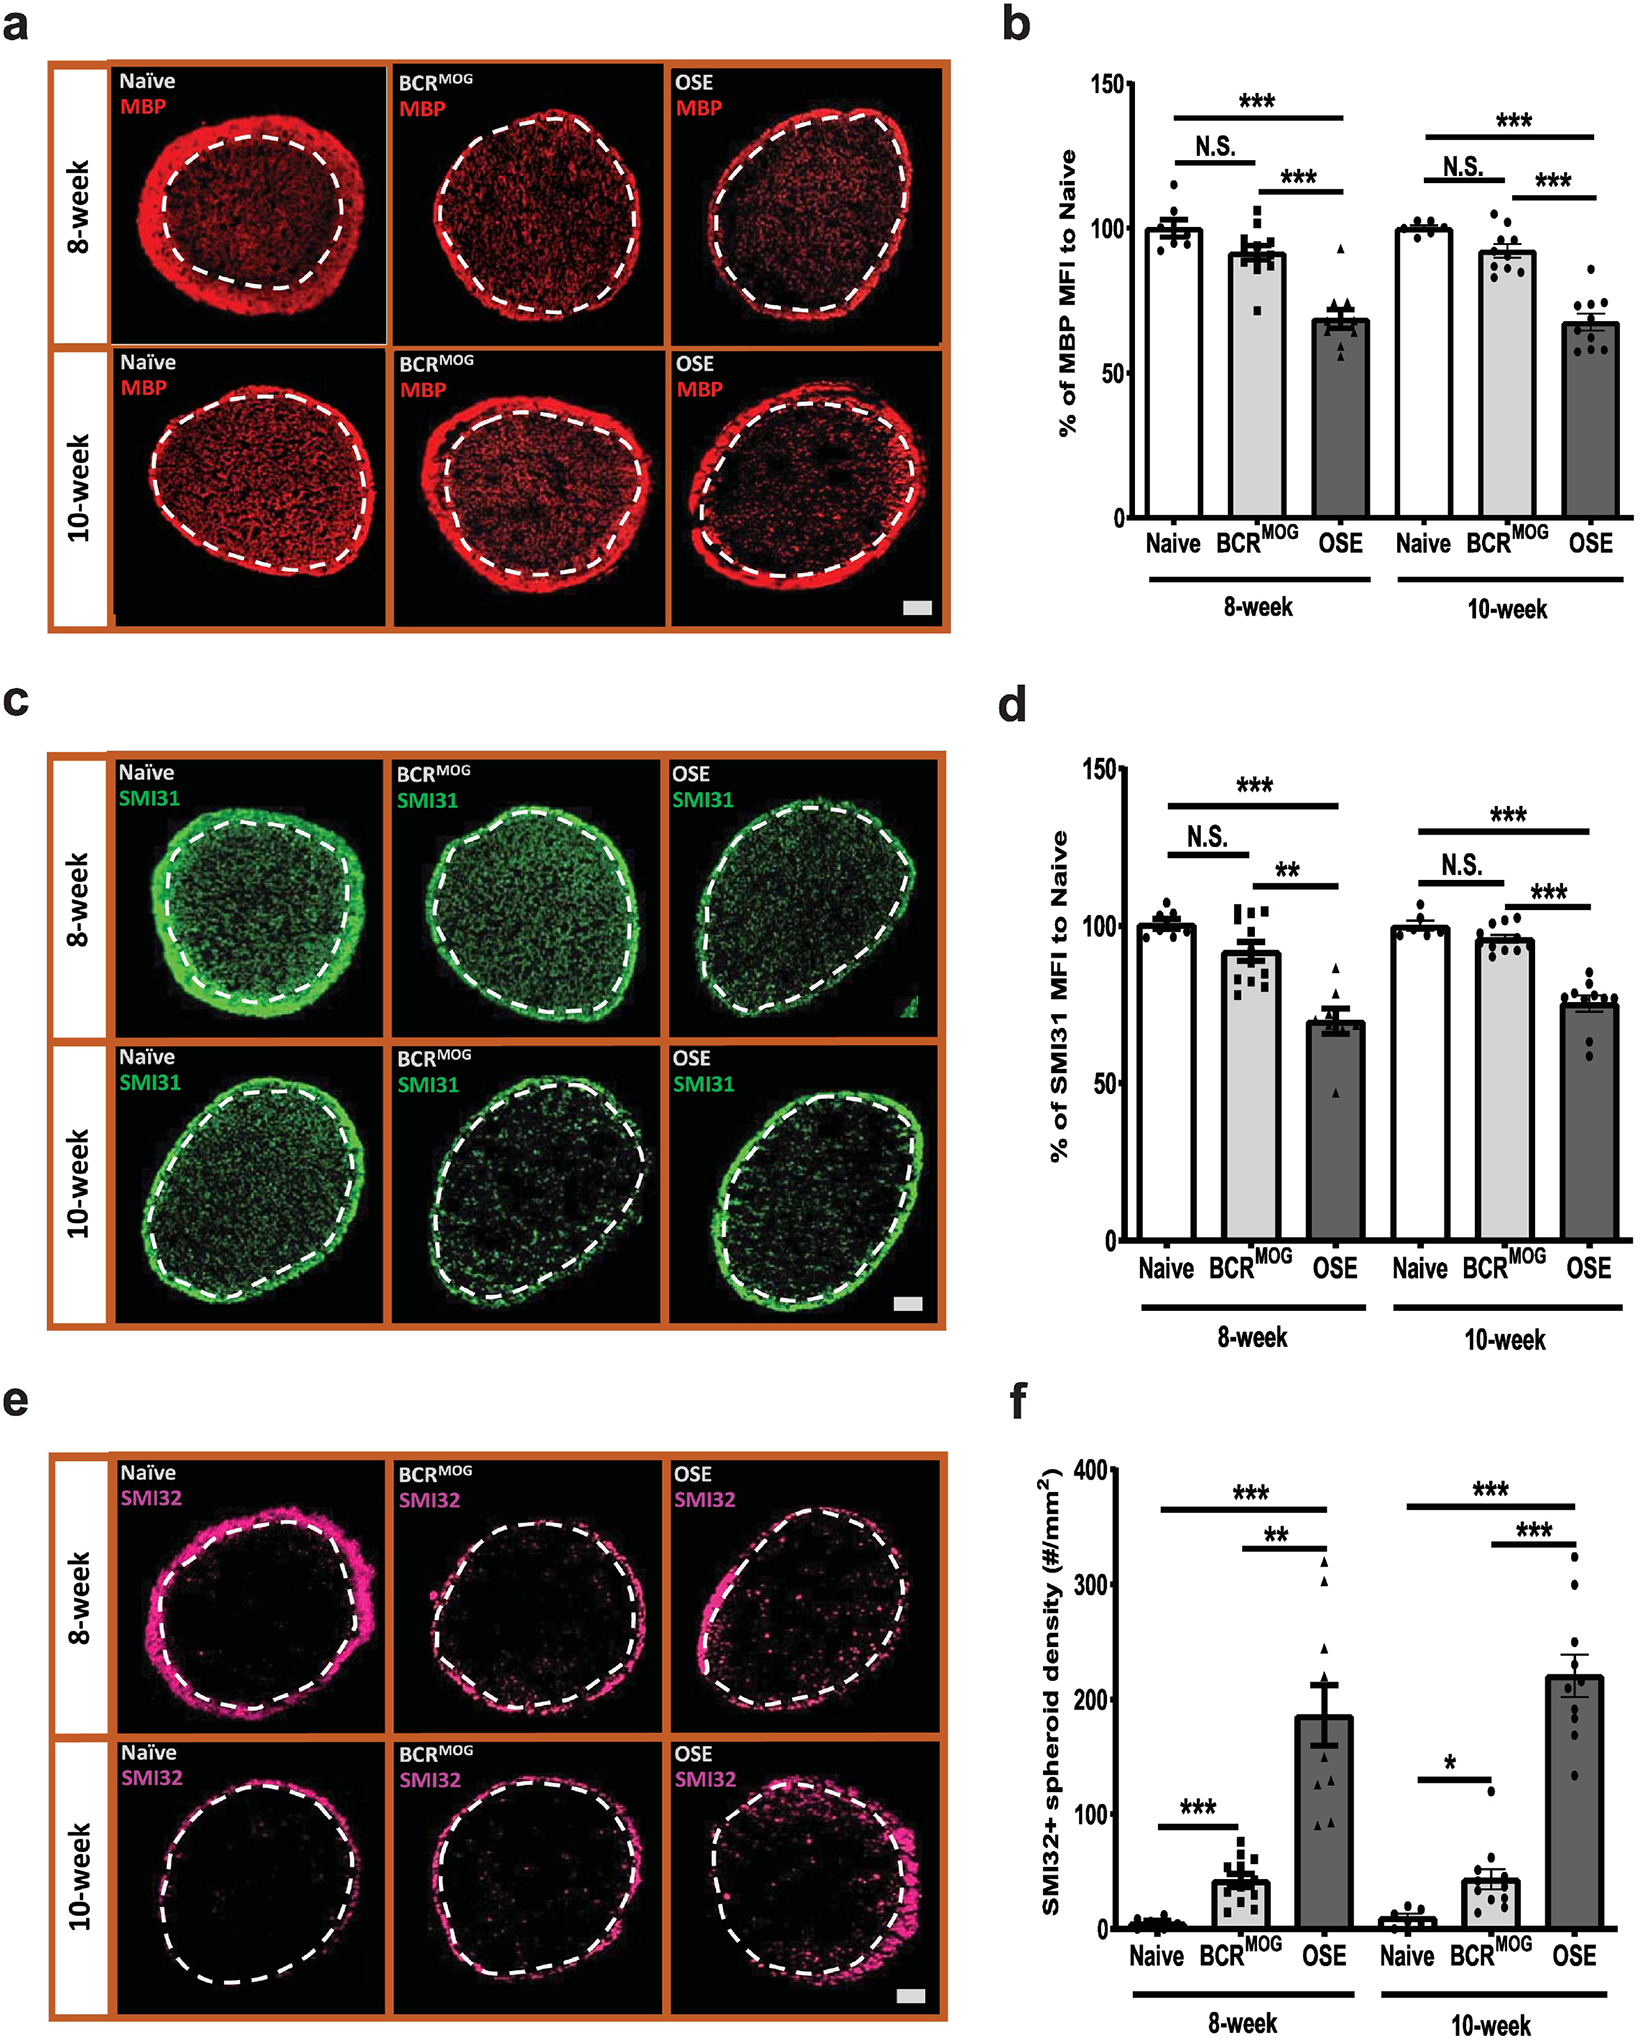
Demyelination and axonal injury were evaluated by staining with MBP and neurofilament markers, SMI31 and SMI32. a) Represent images of MBP staining in the optic nerves of OSE mice. b) Quantification of MBP staining in the optic nerves of OSE mice (F=27.21, p<0.0001. For 8-week: Naïve vs BCRMOG, P=0.2956; Naïve vs OSE, P<0.0001; BCRMOG vs OSE, P<0.0001. For 10-week: Naïve vs BCRMOG, P=0.4768; Naïve vs OSE, P<0.0001; BCRMOG vs OSE, P<0.0001). c) Representative images of SMI31 staining in the optic nerves of OSE mice. d) Quantification of SMI31 staining in the optic nerves of OSE mice (F=22.48, p<0.0001. For 8-week: Naïve vs BCRMOG, P=0.2174; Naïve vs OSE, P<0.0001; BCRMOG vs OSE, P<0.0001. For 10-week: Naïve vs BCRMOG, P=0.9098; Naïve vs OSE, P<0.0001; BCRMOG vs OSE, P<0.0001). e). Representative images of SMI32 staining in the optic nerve of OSE mouse. f). Quantification of SMI32 staining in the optic nerves of OSE mice (F=36.68, p<0.0001. For 8-week: Naïve vs BCRMOG, P=0.6137; Naïve vs OSE, P<0.0001; BCRMOG vs OSE, P<0.0001. For 10-week: Naïve vs BCRMOG, P=0.7228; Naïve vs OSE, P<0.0001; BCRMOG vs OSE, P<0.0001). Each dot from bar graph represents one mouse. Significance between groups was assessed by one-way ANOVA (*** P ≤ 0.001, N.S. = no significance). Error bars represent SEM. Scale bar =50μm.
4. Discussion
RGC loss occurs within the first 3 to 6 months following optic neuritis, which is common manifestation of MS, NMO, and MOGAD. Further, in vivo measurement of the ganglion cell layer inner plexiform complex (GCIPL) using optical coherence tomography (OCT) shows that GCIPL thinning is associated with loss of both high and low contrast visual acuity and loss of RGCs (Gharagozloo et al., 2021, Rothman et al., 2019). However, the mechanisms of injury are incompletely defined and no therapies have been shown to successfully rescue optic neuritis once the peripheral immune cells have extravasated into the optic nerve and mediated demyelination and axonal injury. Therefore, there is a great need to model the time course and nature of the pathology ensuing after acute optic neuritis in order to develop effective therapies. Furthermore, the anterior visual pathway may be an excellent location to more broadly model immune mediated neurodegeneration in MS since it is known that retinal pathology on OCT is associated with cortical and subcortical great matter pathology (Cerovski et al., 2013, Costello and Chen, 2021, Datta et al., 2019, Eslami et al., 2020, Hanson et al., 2016). Therefore, using the classical MOG35–55 EAE model, we and others have shown that RGC loss occurs as a relatively late sequela of the optic nerve inflammation with minimal neuronal loss at peak inflammation but near 50% RGC loss at d42 following recovery from the acute inflammation (Cruz-Herranz et al., 2019, Horstmann et al., 2016, Jin, Smith, 2019, Larabee et al., 2016, Nishioka et al., 2019). This discrepancy between clinical recovery and ongoing neurodegeneration is common in MS and EAE, as evidenced by prior studies of MRI measured atrophy and spinal cord axonal loss that accumulates over time in the non-progressive (behaviorally) MOG35−55 EAE model (Kurkowska-Jastrzebska et al., 2013, Manogaran et al., 2018). The neurodegeneration is now thought to be related to compartmentalized inflammation and especially reactive glia, both microglia and astrocytes, which lose their homeostatic functions and take on a neurotoxic profile (Borggrewe et al., 2021, Lopes Pinheiro et al., 2016, Nedelcu et al., 2020, Toft-Hansen et al., 2011). While actively induced MOG35–55 EAE implicates a role for CD4+ T cells, the Complete Freund’s Adjuvant (CFA) and pertussis required to induce EAE introduce potential confounds as they artificially activate endothelial cells and glia (Constantinescu et al., 2011). In addition, the MOG35–55 EAE does not completely address the role of MOG antibodies produced by B cells. Therefore, we examined the anterior visual pathway in the spontaneous EAE model using OSE mice and compared outcomes to those seen in BCRMOG alone or WT mice with no spontaneous EAE.
In this report, we show that OSE mice with spontaneous EAE have severe RGC loss associated with reactive gliosis in the retina and optic nerve. The RGC loss worsened between 8 and 10 weeks beyond which we could no longer dissect out intact retinas due to severe tissue injury. There was associated neuritic injury in the IPL and optic nerve axons had reduced neurofilament and increased spheroidal accumulations of non-phosphorylated NF indicating axonal congestion. The extent of RGC loss following spontaneous OSE EAE in our laboratory was ~50%, which is similar to the classical MOG35–55 EAE model (as described above) but more than what was reported in the MOGTCR model (2D2) transgenic mice in which 30% of these animals sustain spontaneous optic neuritis resulting in ~33% reduction in RGCs in affected eyes (Guan et al., 2006) (Cruz-Herranz et al., 2019). Thus, an additional advantage of the OSE mouse model is that there is a high incidence of spontaneous EAE (76% in our center), which is accompanied by universal optic neuritis at the tissue level, therefore every mouse that gets sick with EAE can be used to study ensuing robust RGC loss. We suggest that the higher incidence of spontaneous optic neuritis in OSE mice vs. MOGTCR transgenic mice is useful since it provides greater sample sizes to study novel pathologies or therapeutic interventions. A potential limitation of our study was our inability to directly compare with the MOGTCR model alone in which spontaneous optic neuritis occurs in less than half of the animals and can only be reliably detected histopathologically, and even then with varying degrees of T cell infiltration. Injection of pertussis toxin increases T cell infiltration into the optic nerve resulting in optic neuritis in 68% of mice but then introduces a confounding variable and is not a direct comparison (Guan et al., 2006).
Interestingly, the BCRMOG mice did not develop EAE or exhibit significant RGC loss, suggesting that B cells with the MOG BCR are not sufficient to induce disease, which is in keeping with findings from the original report of the OSE mice (Krishnamoorthy, Lassmann, 2006). In addition, several groups have shown that simply transferring MOG-IgG does not cause optic neuritis or EAE, however MOG antibody has been implicated in EAE (Lyons et al., 2002). Investigation of the human MOG-Ab pathogenicity is hampered by their limited binding to rodent MOG (Reindl and Waters, 2019). It is worth noting that in our study, while not significant in most cases, there were consistent patterns of similar pathology in the MOGBCR mice possibly suggesting a priming effect in mice with the IgH MOG transgene. Indeed, the increase in reactive gliosis, axonal spheroids, and RGC neuritic retraction from the IPL at ten weeks in MOGBCR mice, but without significant RGC loss, provides further evidence for the role of MOG antibodies in this process.
The data generated in this report are consistent with models of targeted focal EAE in which animals are primed with MOG and Incomplete Freund’s Adjuvant and then focal disease is induced with addition of locally injected cytokines in the brain or spinal cord (Sasaki et al., 2010). In this model systemic MOG antibodies are detectable in the periphery but do not cause disease until focal cytokines are injected and cause T cell activation. Nonetheless, other model systems have demonstrated convincing roles for antibodies in mediating demyelinating pathology in cranial windows of mice or in the retina (Adamus et al., 2011, Cobo-Calvo et al., 2019) (Cobo-Calvo et al., 2017). It should be noted that in the original report OSE mice were not noted to have detectable complement, which may be an important cofactor. This may reflect the paucity of reliable anti-C3 antibodies because several recent reports (including using a C3 reporter mouse line) document high C3 gene expression from neurotoxic astrocytes that are thought to produce excessive C3, which opsonizes synapses that are then in turn pruned by microglia (Gharagozloo, Smith, 2021, Jin, Smith, 2019, Liddelow et al., 2017, Werneburg et al., 2020). Indeed, some of these reports show a reduction in synaptic pruning in C3 knockout (KO) EAE (Hammond et al., 2020, Ramaglia et al., 2015, Tassoni et al., 2019, Werneburg, Jung, 2020).
In summary, we show that RGC loss occurs in OSE mice that develop spontaneous optic neuritis and EAE. The loss of RGCs is associated with decreased neuritic density in the IPL and marked reactive gliosis. The OSE mouse model has features that recapitulate aspects of human diseases characterized by optic neuritis, especially MOGAD, and which are instigated by combinatorial effects of T and B cells, but avoids potentially confounding factors such as CFA and pertussis toxin. In addition, we did not observe differences in onset or severity by sex. Therefore, we suggest the OSE mouse model may be useful for enhancing our understanding of the pathogenesis of immune mediated retinal neuronal demise and for testing putative neuroprotective drugs given at the time of behavioral disease onset to examine for retinal neuroprotection.
Highlights.
Spontaneous optic neuritis/EAE occurs in TCRMOG/BCRMOG (OSE) mice and causes a 50% reduction in retinal ganglion cells (RGCs) at 10 weeks of disease.
The optic nerve pathology is characterized by CD4 infiltrate, demyelination, reactive gliosis, and axonal spheroids, which mimics MOGAD (MOG antibody associated disease).
This model will allow further exploration of the pathophysiology of RGC loss and testing of neuroprotective agents.
Funding:
This work was supported by R01NS041435 (PAC)
Footnotes
Publisher's Disclaimer: This is a PDF file of an unedited manuscript that has been accepted for publication. As a service to our customers we are providing this early version of the manuscript. The manuscript will undergo copyediting, typesetting, and review of the resulting proof before it is published in its final form. Please note that during the production process errors may be discovered which could affect the content, and all legal disclaimers that apply to the journal pertain.
References
- Adamus G, Brown L, Schiffman J, Iannaccone A. Diversity in autoimmunity against retinal, neuronal, and axonal antigens in acquired neuro-retinopathy. J Ophthalmic Inflamm Infect. 2011;1:111–21. [DOI] [PMC free article] [PubMed] [Google Scholar]
- Bettelli E, Pagany M, Weiner HL, Linington C, Sobel RA, Kuchroo VK. Myelin oligodendrocyte glycoprotein-specific T cell receptor transgenic mice develop spontaneous autoimmune optic neuritis. J Exp Med. 2003;197:1073–81. [DOI] [PMC free article] [PubMed] [Google Scholar]
- Borggrewe M, Grit C, Vainchtein ID, Brouwer N, Wesseling EM, Laman JD, et al. Regionally diverse astrocyte subtypes and their heterogeneous response to EAE. Glia. 2021;69:1140–54. [DOI] [PMC free article] [PubMed] [Google Scholar]
- Cerovski B, Kutija MB, Vidovic T, Popovic-Suic S, Jandrokovic S, Kordic R, et al. The role of optical coherence tomography (OCT) in optic neuritis (ON). Coll Antropol. 2013;37 Suppl 1:121–5. [PubMed] [Google Scholar]
- Cobo-Calvo A, Ayrignac X, Kerschen P, Horellou P, Cotton F, Labauge P, et al. Cranial nerve involvement in patients with MOG antibody-associated disease. Neurol Neuroimmunol Neuroinflamm. 2019;6:e543. [DOI] [PMC free article] [PubMed] [Google Scholar]
- Cobo-Calvo A, Ruiz A, D’Indy H, Poulat AL, Carneiro M, Philippe N, et al. MOG antibody-related disorders: common features and uncommon presentations. J Neurol. 2017;264:1945–55. [DOI] [PubMed] [Google Scholar]
- Constantinescu CS, Farooqi N, O’Brien K, Gran B. Experimental autoimmune encephalomyelitis (EAE) as a model for multiple sclerosis (MS). Br J Pharmacol. 2011;164:1079–106. [DOI] [PMC free article] [PubMed] [Google Scholar]
- Costello F, Chen JJ. The role of optical coherence tomography in the diagnosis of afferent visual pathway problems: A neuroophthalmic perspective. Handb Clin Neurol. 2021;178:97–113. [DOI] [PubMed] [Google Scholar]
- Cruz-Herranz A, Dietrich M, Hilla AM, Yiu HH, Levin MH, Hecker C, et al. Monitoring retinal changes with optical coherence tomography predicts neuronal loss in experimental autoimmune encephalomyelitis. J Neuroinflammation. 2019;16:203. [DOI] [PMC free article] [PubMed] [Google Scholar]
- Datta R, Sollee JR, Lavery AM, Ficerai-Garland G, Karoscik K, Liu G, et al. Effects of Optic Neuritis, T2 Lesions, and Microstructural Diffusion Integrity in the Visual Pathway on Cortical Thickness in Pediatric-Onset Multiple Sclerosis. J Neuroimaging. 2019;29:760–70. [DOI] [PMC free article] [PubMed] [Google Scholar]
- Dietrich M, Aktas O, Hartung HP, Albrecht P. Assessing the anterior visual pathway in optic neuritis: recent experimental and clinical aspects. Curr Opin Neurol. 2019;32:346–57. [DOI] [PubMed] [Google Scholar]
- Eslami F, Ghiasian M, Khanlarzade E, Moradi E. Retinal Nerve Fiber Layer Thickness and Total Macular Volume in Multiple Sclerosis Subtypes and Their Relationship with Severity of Disease, a Cross-Sectional Study. Eye Brain. 2020;12:15–23. [DOI] [PMC free article] [PubMed] [Google Scholar]
- Filippatou AG, Mukharesh L, Saidha S, Calabresi PA, Sotirchos ES. AQP4-IgG and MOG-IgG Related Optic Neuritis-Prevalence, Optical Coherence Tomography Findings, and Visual Outcomes: A Systematic Review and Meta-Analysis. Front Neurol. 2020;11:540156. [DOI] [PMC free article] [PubMed] [Google Scholar]
- Gharagozloo M, Smith MD, Jin J, Garton T, Taylor M, Chao A, et al. Complement component 3 from astrocytes mediates retinal ganglion cell loss during neuroinflammation. Acta Neuropathol. 2021;142:899–915. [DOI] [PMC free article] [PubMed] [Google Scholar]
- Guan Y, Shindler KS, Tabuena P, Rostami AM. Retinal ganglion cell damage induced by spontaneous autoimmune optic neuritis in MOG-specific TCR transgenic mice. J Neuroimmunol. 2006;178:40–8. [DOI] [PubMed] [Google Scholar]
- Hammond JW, Bellizzi MJ, Ware C, Qiu WQ, Saminathan P, Li H, et al. Complement-dependent synapse loss and microgliosis in a mouse model of multiple sclerosis. Brain Behav Immun. 2020;87:739–50. [DOI] [PMC free article] [PubMed] [Google Scholar]
- Hanson JV, Lukas SC, Pless M, Schippling S. Optical Coherence Tomography in Multiple Sclerosis. Semin Neurol. 2016;36:177–84. [DOI] [PubMed] [Google Scholar]
- Hoftberger R, Guo Y, Flanagan EP, Lopez-Chiriboga AS, Endmayr V, Hochmeister S, et al. The pathology of central nervous system inflammatory demyelinating disease accompanying myelin oligodendrocyte glycoprotein autoantibody. Acta Neuropathol. 2020;139:875–92. [DOI] [PMC free article] [PubMed] [Google Scholar]
- Horstmann L, Kuehn S, Pedreiturria X, Haak K, Pfarrer C, Dick HB, et al. Microglia response in retina and optic nerve in chronic experimental autoimmune encephalomyelitis. J Neuroimmunol. 2016;298:32–41. [DOI] [PubMed] [Google Scholar]
- Jin J, Smith MD, Kersbergen CJ, Kam TI, Viswanathan M, Martin K, et al. Glial pathology and retinal neurotoxicity in the anterior visual pathway in experimental autoimmune encephalomyelitis. Acta Neuropathol Commun. 2019;7:125. [DOI] [PMC free article] [PubMed] [Google Scholar]
- Krishnamoorthy G, Lassmann H, Wekerle H, Holz A. Spontaneous opticospinal encephalomyelitis in a double-transgenic mouse model of autoimmune T cell/B cell cooperation. J Clin Invest. 2006;116:2385–92. [DOI] [PMC free article] [PubMed] [Google Scholar]
- Kurkowska-Jastrzebska I, Swiatkiewicz M, Zaremba M, Cudna A, Piechal A, Pyrzanowska J, et al. Neurodegeneration and inflammation in hippocampus in experimental autoimmune encephalomyelitis induced in rats by one--time administration of encephalitogenic T cells. Neuroscience. 2013;248:690–8. [DOI] [PubMed] [Google Scholar]
- Larabee CM, Hu Y, Desai S, Georgescu C, Wren JD, Axtell RC, et al. Myelin-specific Th17 cells induce severe relapsing optic neuritis with irreversible loss of retinal ganglion cells in C57BL/6 mice. Mol Vis. 2016;22:332–41. [PMC free article] [PubMed] [Google Scholar]
- Liddelow SA, Guttenplan KA, Clarke LE, Bennett FC, Bohlen CJ, Schirmer L, et al. Neurotoxic reactive astrocytes are induced by activated microglia. Nature. 2017;541:481–7. [DOI] [PMC free article] [PubMed] [Google Scholar]
- Linnington C, Webb M, Woodhams PL. A novel myelin-associated glycoprotein defined by a mouse monoclonal antibody. J Neuroimmunol. 1984;6:387–96. [DOI] [PubMed] [Google Scholar]
- Lopes Pinheiro MA, Kooij G, Mizee MR, Kamermans A, Enzmann G, Lyck R, et al. Immune cell trafficking across the barriers of the central nervous system in multiple sclerosis and stroke. Biochim Biophys Acta. 2016;1862:461–71. [DOI] [PubMed] [Google Scholar]
- Lyons JA, Ramsbottom MJ, Cross AH. Critical role of antigen-specific antibody in experimental autoimmune encephalomyelitis induced by recombinant myelin oligodendrocyte glycoprotein. Eur J Immunol. 2002;32:1905–13. [DOI] [PubMed] [Google Scholar]
- Manogaran P, Walker-Egger C, Samardzija M, Waschkies C, Grimm C, Rudin M, et al. Exploring experimental autoimmune optic neuritis using multimodal imaging. Neuroimage. 2018;175:327–39. [DOI] [PubMed] [Google Scholar]
- Nedelcu J, Reinbach C, Riedler P, Brendel M, Rominger A, Kaye J, et al. Laquinimod ameliorates secondary brain inflammation. Neurobiol Dis. 2020;134:104675. [DOI] [PubMed] [Google Scholar]
- Nishioka C, Liang HF, Barsamian B, Sun SW. Sequential phases of RGC axonal and somatic injury in EAE mice examined using DTI and OCT. Mult Scler Relat Disord. 2019;27:315–23. [DOI] [PMC free article] [PubMed] [Google Scholar]
- Ramaglia V, Jackson SJ, Hughes TR, Neal JW, Baker D, Morgan BP. Complement activation and expression during chronic relapsing experimental autoimmune encephalomyelitis in the Biozzi ABH mouse. Clin Exp Immunol. 2015;180:432–41. [DOI] [PMC free article] [PubMed] [Google Scholar]
- Reindl M, Waters P. Myelin oligodendrocyte glycoprotein antibodies in neurological disease. Nat Rev Neurol. 2019;15:89–102. [DOI] [PubMed] [Google Scholar]
- Rothman A, Murphy OC, Fitzgerald KC, Button J, Gordon-Lipkin E, Ratchford JN, et al. Retinal measurements predict 10-year disability in multiple sclerosis. Ann Clin Transl Neurol. 2019;6:222–32. [DOI] [PMC free article] [PubMed] [Google Scholar]
- Sasaki M, Lankford KL, Brown RJ, Ruddle NH, Kocsis JD. Focal experimental autoimmune encephalomyelitis in the Lewis rat induced by immunization with myelin oligodendrocyte glycoprotein and intraspinal injection of vascular endothelial growth factor. Glia. 2010;58:1523–31. [DOI] [PubMed] [Google Scholar]
- Tassoni A, Farkhondeh V, Itoh Y, Itoh N, Sofroniew MV, Voskuhl RR. The astrocyte transcriptome in EAE optic neuritis shows complement activation and reveals a sex difference in astrocytic C3 expression. Sci Rep. 2019;9:10010. [DOI] [PMC free article] [PubMed] [Google Scholar]
- Toft-Hansen H, Fuchtbauer L, Owens T. Inhibition of reactive astrocytosis in established experimental autoimmune encephalomyelitis favors infiltration by myeloid cells over T cells and enhances severity of disease. Glia. 2011;59:166–76. [DOI] [PubMed] [Google Scholar]
- Werneburg S, Jung J, Kunjamma RB, Ha SK, Luciano NJ, Willis CM, et al. Targeted Complement Inhibition at Synapses Prevents Microglial Synaptic Engulfment and Synapse Loss in Demyelinating Disease. Immunity. 2020;52:167–82 e7. [DOI] [PMC free article] [PubMed] [Google Scholar]


