

Abstract
OBJECTIVE:
The Alzheimer’s Continuum is biologically defined by beta-amyloid deposition which, at the earliest stages, is superimposed upon white matter degeneration in aging. However, the extent to which these co-occurring changes are characterized is relatively under-explored. The goal of this study was to use Diffusional Kurtosis Imaging (DKI) and biophysical modeling to detect and describe amyloid-related white matter changes in preclinical Alzheimer’s disease (AD).
METHODS:
Cognitively unimpaired participants ages 45–85 completed brain MRI, amyloid PET (florbetapir), neuropsychological testing, and other clinical measures at baseline in a cohort study. We tested whether beta amyloid-negative (AB−) and -positive (AB+) participants differed on DKI-based conventional (i.e. Fractional Anisotropy [FA], Mean Diffusivity [MD], Mean Kurtosis [MK]) and modeling (i.e. Axonal Water Fraction [AWF], extra-axonal radial diffusivity [De,⊥]) metrics, and whether these metrics were associated with other biomarkers.
RESULTS:
We found significantly greater diffusion restriction (higher FA/AWF, lower MD/ De,⊥) in white matter in AB+ than AB− (partial η2 = 0.08–0.19), more notably in the extra-axonal space within primarily late-myelinating tracts. Diffusion metrics predicted amyloid status incrementally over age (AUC=0.84) with modest yet selective associations, where AWF (a marker of axonal density) correlated with speed/executive functions and neurodegeneration, whereas De,⊥ (a marker of gliosis/myelin repair) correlated with amyloid deposition and white matter hyperintensity volume.
INTERPRETATION:
These results support prior evidence of a non-monotonic change in diffusion behavior, where an early increase in diffusion restriction is hypothesized to reflect inflammation and myelin repair prior to an ensuing decrease in diffusion restriction, indicating glial and neuronal degeneration.
Keywords: diffusion MRI, white matter, myelin, gliosis, aging, preclinical Alzheimer’s disease
1. Introduction
The Alzheimer’s Continuum in Alzheimer’s disease (AD) is biologically defined by amyloid deposition in the brains of individuals with or without other biomarker or clinical changes1. The presence of brain amyloid indicates risk for clinical progression in cognitively unimpaired older adults2. However, amyloid deposition in the preclinical stage co-occurs with other brain changes in aging including white matter degeneration, which results in cortical disconnection and cognitive decline3. Thus, it is important to examine the nexus of age-related changes and amyloid deposition to better illuminate the as-yet poorly understood pathogenesis of AD.
The literature describing the relationship between these changes in the preclinical stage using amyloid and diffusion imaging is conflicting. Similar to the literature that describes white matter degeneration in the clinical stages of AD4,5, in preclinical AD, greater amyloid burden has been found to correlate with loss of white matter integrity as indicated by lower fractional anisotropy (FA) and higher mean diffusivity (MD)6. This is in contrast to prior studies that found no association7,8, and others that found the opposite effect. That is, studies have associated greater amyloid burden with paradoxically greater diffusion restriction (i.e. higher FA, lower MD)9–11. Although this finding may indicate possible compensatory or inflammatory processes, conventional diffusion metrics (i.e. FA, MD) lack biological specificity, precluding more definitive conclusions about the tissue-specific changes influencing the diffusion signal.
Thus, the overall goal of this study was to identify the microstructural changes in white matter associated with amyloid deposition in the preclinical stage. To achieve this, we compared metrics obtained via Diffusional Kurtosis Imaging12 (DKI) and biophysical modeling13 in cognitively unimpaired older adults with and without amyloid deposition. In addition to conventional diffusion metrics (i.e. FA, MD, mean kurtosis [MK]), we report modeling-derived White Matter Tract Integrity (WMTI) metrics of axonal density (i.e. Axonal Water Fraction [AWF]) and gliosis/myelin changes (i.e. extra-axonal radial diffusivity [De,⊥]) to distinguish neuronal from glial changes, respectively. We have shown these metrics to be sensitive to white matter changes in aging14 and across the clinical stages of AD15,16, with additional validation from preclinical models17–20 indicating the viability of our inferences regarding the mechanisms underlying these changes.
Our first aim was to test whether beta amyloid-negative (AB−) and -positive (AB+) participants differed on conventional diffusion and modeling metrics. We hypothesized that if the AB+ group demonstrates greater diffusion restriction (i.e. higher FA and MK, lower MD), this effect would be present for De,⊥ but not for AWF, supporting the presence of gliosis/myelin changes versus neurodegeneration in the preclinical stage. We also hypothesized that diffusion metrics would predict amyloid status incrementally over age, demonstrating the salience of these changes within the amyloid continuum even in the preclinical stage. Our second aim was to determine how diffusion metrics are associated with other disease indicators. We hypothesized that these metrics would correlate with amyloid burden, neurodegeneration, white matter hyperintensity volume, and cognition in directions that indicate their pathogenicity, and that modeling metrics would inform the tissue specificity of these findings.
2. Methods
2.1. Study Design, Setting, and Participants
Community-dwelling cognitively unimpaired older adults ages 45 to 85 were recruited and asked to provide informed consent to participate in an ongoing IRB-approved, prospective two-year observational cohort study. Only baseline data are reported here. Eligibility criteria included: no self-reported, previously diagnosed, or suspected cognitive impairment (defined by a normed MoCA score21 of z < −1.0), English as a first/primary language, no MRI or PET contraindications, and no history of severe/unstable condition that affects cognition (e.g. stroke, brain cancer, seizures, serious mental illness, current alcohol or substance abuse). We enrolled 165 participants but 12 were excluded due to: drop-out/incomplete procedures (n=7), incidental findings on MRI (n=2), or suspected cognitive impairment (n=3). The remaining 153 participants completed all procedures described here.
2.2. Clinical Procedures
Participants completed history forms from the National Alzheimer’s Coordinating Centers Uniform Dataset and Version 3 of the neuropsychological battery22. Raw scores were converted to demographically-normed (i.e. age, sex, years of education) z-scores23 for the following preclinical AD-relevant cognitive domains24: memory, language, and speed/executive functions.
Venous blood collected from each study participant was processed using an automated QIAcube system (Qiagen, Venlo, Netherlands) to extract purified DNA for genotyping. ApoE (2/3/4) genotypes were obtained using TaqMan Genotyping Assays (Applied Biosystems, Waltham, MA) including genotypes for single nucleotide polymorphisms at Reference SNP cluster IDs rs7412 and rs42935825, as performed in previous studies26,27. All genotyping experiments were performed on the Quantstudio 6 FLEX real-time PCR system (ThermoFisher, Waltham, MA) and interpreted with TaqMan Genotyper Software v1.6.0 (Applied Biosystems).
2.3. MRI Data Acquisition and Analysis
2.3.1. Acquisition.
MRI scans were conducted on a 3T Prismafit MRI system (Siemens Healthineers, Erlangen, Germany) with the following sequences: (1) T1-weighted 3D imaging using a magnetization prepared rapid gradient echo (MPRAGE) sequence with TR/TI/TE = 2300/900/2.26 ms, FOV = 256 × 256 mm2, parallel imaging factor = 2, 1 × 1 × 1 mm3 voxels. (2) T2-weighted fluid attenuated inversion recovery (T2-FLAIR) sequence with TR/TI/TE = 9000/2500/92.0 ms, FOV = 220 × 220 mm2, parallel imaging factor = 2, voxel size 0.9 × 0.9 × 2 mm3. (3) DKI using bipolar diffusion weighted echo planar imaging (EPI) with 3 b-values (0, 1000, 2000 s/mm2) along 64 diffusion encoding directions, voxel size 2.5 × 2.5 × 2.5 mm3, TR/TE = 4600/85 ms, FOV = 220 × 220 mm2.
2.3.2. Analysis: Diffusion.
The analysis pipeline is depicted in Figure 1. Briefly, pre-processing was conducted using an open-source program developed by our lab called PyDesigner28 (v1.0-RC7; https://github.com/m-ama/PyDesigner). PyDesigner computes all parametric maps reported here, including AWF and De,⊥ (see Supplementary Material at the end of the manuscript for a summary of their theory and equations, published previously13). Conceptually, AWF is the ratio of intra-axonal water over all MR-visible intra- and extra-axonal water, whereas De,⊥ represents diffusivity perpendicular to the primary diffusion tensor eigenvector of the extra-axonal compartment. Tensor-based registration was performed with DTI-TK29 (http://dti-tk.sourceforge.net) to bring all maps into a sample-specific template space. Normalized FA maps were averaged and skeletonised to preserve only voxels with a high probability of containing white matter via the custom implementation of FSL’s Tract Based Spatial Statistics within DTI-TK. This was used to threshold the white matter skeleton before projecting it onto all other parametric maps to obtain skeletonised diffusion and WMTI maps. FSL’s randomise was used to conduct the voxelwise statistical analyses of the skeletonised maps.
Figure 1. Image analysis pipeline.
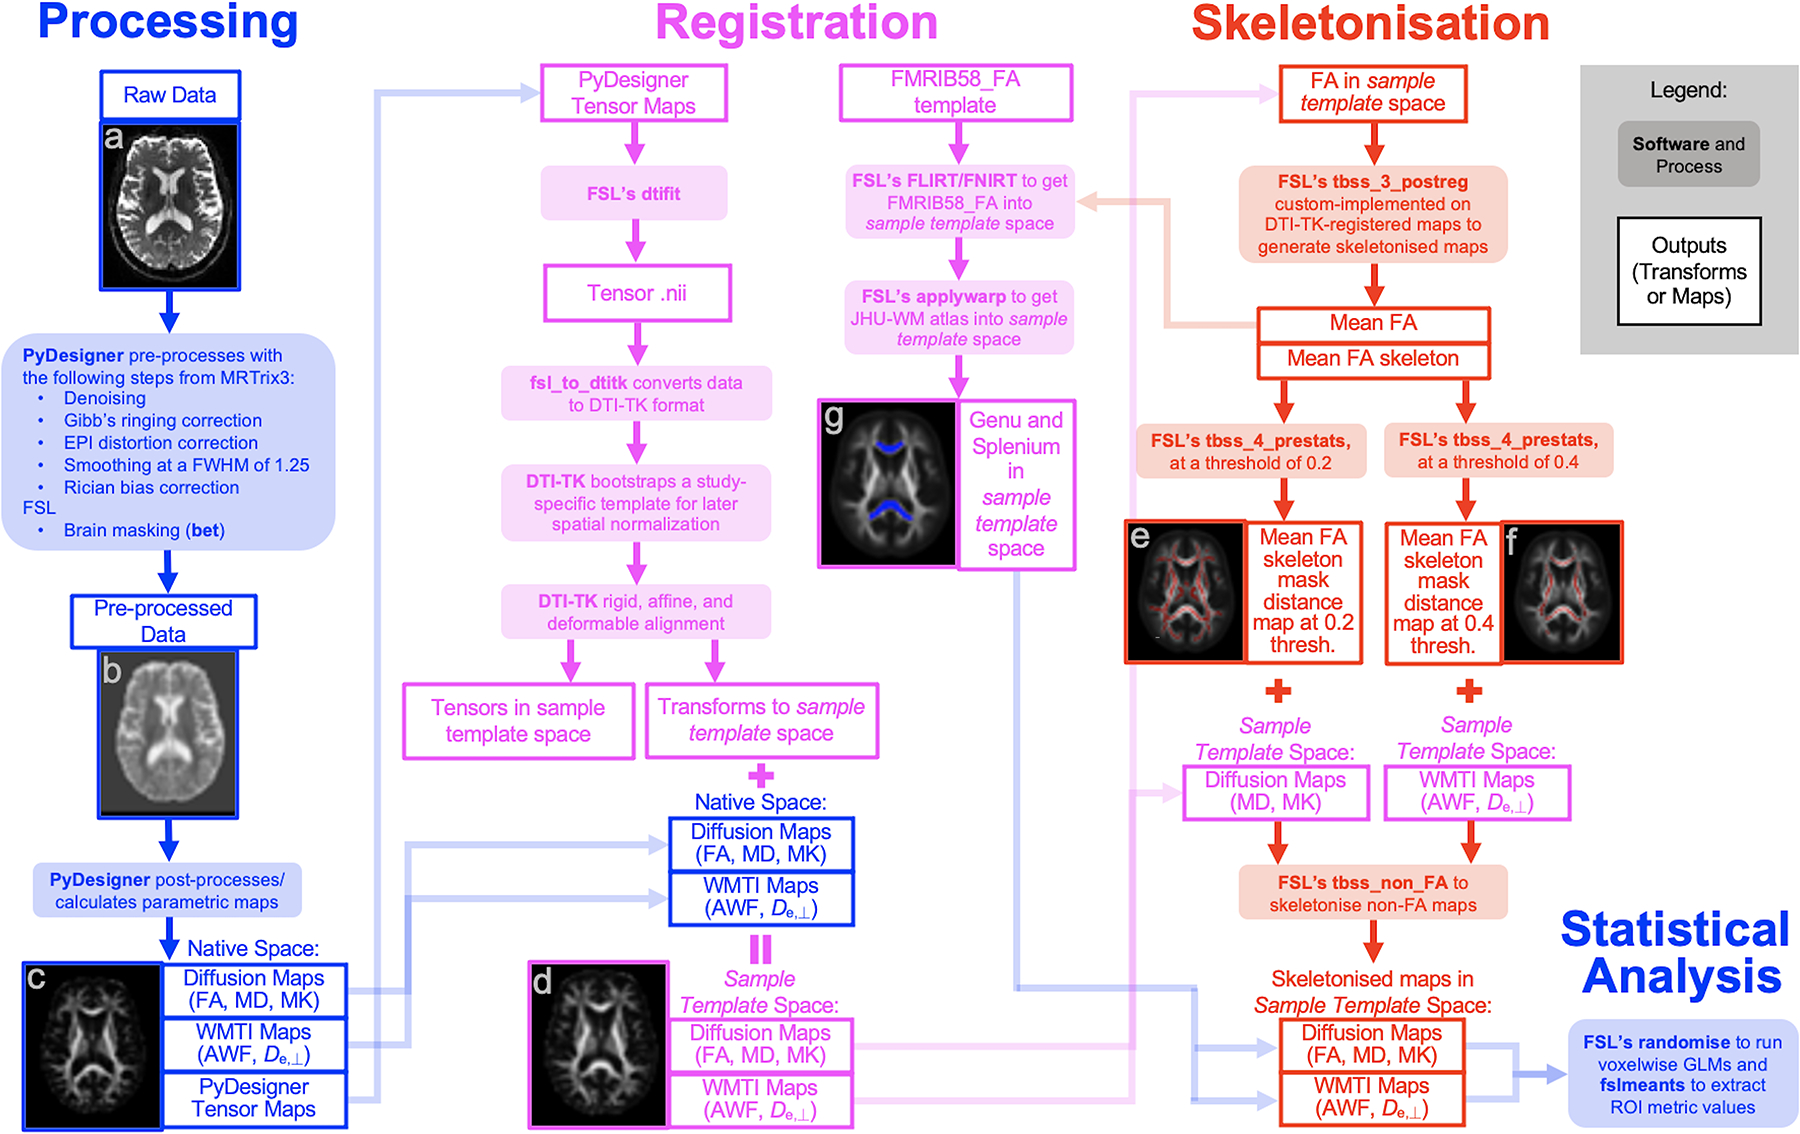
(a) Raw diffusion image (b = 0) in native space, (b) Pre-processed tensor map in native space, (c) Post-processed FA map in native space, (d) FA map in sample template space after DTI-TK registration, (e) Mean FA skeleton (red) thresholded at 0.2 overlain onto the mean FA map, (f) Mean FA skeleton (red) thresholded at 0.4 overlain onto the mean FA map, (g) Genu (blue, anterior) and splenium (blue, superior) from the Johns Hopkins University White Matter (JHU-WM) atlas in sample template space overlain onto the mean FA map.
Consistent with prior observations that the white matter changes in AD preferentially occur in tracts that myelinate later in life15,30, we further expected to corroborate the voxelwise analyses results with region of interest (ROI) analyses of two late- and early-myelinating regions within the same tract: the genu and splenium of the corpus callosum, respectively. The genu contains proportionally more smaller-caliber axons compared to the splenium, which contains more large-caliber, directionally-coherent axons that are less vulnerable to aging31–33, albeit both (as well as the body and isthmus) have been observed to be altered in symptomatic AD34,35. Thus, we selected these ROIs from the JHU white matter atlas and nonlinearly registered these to sample template space from FMRIB58_FA space. Mean metric values of these normalized ROIs (i.e. genu, splenium, and the result maps from the voxelwise analysis) were extracted from each participant’s skeletonised parametric map for statistical analysis. The accuracy of the WMTI metrics is expected to be relatively high in these two ROIs since they both have high FA values (see Supplementary Material).
2.3.3. Analysis: Neurodegeneration.
The following biomarkers were selected based on a recent summary of morphometrics defining neurodegeneration across the AD continuum36: AD signature, global atrophy, hippocampal atrophy. First, all T1-weighted images were segmented using the FreeSurfer v6.0 recon-all processing stream. To facilitate comparisons, FreeSurfer outputs were submitted to NOMIS37, a tool for generating normative z-scores per segment per participant, accounting for age, sex, head size, and scanner characteristics, with z-scores indicating deviations from the normative mean of almost 7,000 cognitively intact individuals. The AD signature is the mean of the following cortical thickness z-scores, averaged between hemispheres: entorhinal, inferior temporal, middle temporal, inferior parietal, fusiform, and precuneus. The global atrophy biomarker is the z-score of the brainsegvol segment, which is the sum of all structures including the cerebellum and ventricles. The hippocampal atrophy biomarker is the mean of bilateral hippocampal volume segment z-scores.
2.3.4. Analysis: White matter hyperintensities (WMH).
WMH were identified using the lesion growth algorithm38 via the LST toolbox version 3.0.0 (www.statistical-modelling.de/lst.html) for SPM12 using default parameters. Briefly, T1 images were first segmented into GM, WM, and CSF. These segments were used along with co-registered T2-FLAIR intensities to calculate lesion belief maps. Resulting maps were thresholded at 0.25 to obtain an initial binary lesion map which was then grown along hyperintense voxels in the FLAIR image, resulting in a lesion probability map. Total lesion volume (in ml) is the WMH metric in this study.
2.4. Amyloid PET Data Acquisition and Analysis
2.4.1. Acquisition.
Brain cortical amyloid burden was measured using 18F-florbetapir (Amyvid™). Each PET scan was obtained as a 3D acquisition over 10 min (one bed position) on a Siemens Biograph mCT Flow PET/CT scanner approximately 50 min following the injection of 370 MBq (10 mCi) of 18F-florbetapir. Images were reconstructed using a 400 × 400 matrix (zoom × 2) with iterative (TrueX) and time of flight reconstruction algorithms. A standard low dose CT of the brain was acquired for attenuation correction. No participants reported adverse reactions.
2.4.2. Analysis.
Derivation of the amyloid PET metric replicated published approaches cited here. Freesurfer v6.0 was used to transform T1 images into Talairach space for segmentation. PET images were then linearly registered39 to T1 in Talairach space. Standard uptake value (SUV) for six cortical regions sensitive to florbetapir uptake (anterior cingulate, posterior cingulate, parietal lobe, medial orbito-frontal lobe, middle temporal lobe, and precuneus) were extracted then normalized to the mean SUV of the reference region (cerebellum) to derive the SUV ratio40 (SUVr). The non-weighted mean SUVr (mSUVr) for each participant was derived by computing the mean SUVr across all six cortical regions40,41. As in other studies42,43, the upper mSUVr tertile was used to identify AB+ participants (n=51 with mSUVR ≥ 1.21), while all other participants were deemed AB− (n=102). While this mSUVr cut-off is higher than cut-offs previously defined in the literature40,44, it is comparable to florbetapir values reported in MCI45, suggesting that this is a meaningful indicator of significant brain amyloidosis.
2.5. Statistical Analysis
Prior to testing the study aims, we sought to examine potential sources of bias or confounding by testing differences between the two groups in demographic, medical history, cognitive, and imaging variables using independent samples t-tests, Fisher’s exact tests, or Mann-Whitney U tests, as appropriate to data distributions. We then conducted general linear models using FSL’s randomise, testing for voxelwise differences in the skeletonised diffusion maps between the AB+ and AB− participants, covarying for age and sex, using a threshold-free cluster-enhanced familywise-error-corrected p<0.05. We thresholded and binarised the result maps per metric to create metric-specific ROIs which were registered to MNI space using FSL’s FLIRT prior to rendering in MRIcroGL (https://www.nitrc.org/projects/mricrogl). We extracted mean metric values of these voxelwise ROIs as well as of the normalized genu and splenium ROIs for each participant. We then ran analyses of covariance to test for group differences in these regional metrics, covarying for age and sex. Next, we constructed a series of logistic regressions to determine whether the diffusion metrics for the voxelwise ROIs, the 3 neurodegeneration biomarkers, or the 3 cognitive domains predicted amyloid status beyond age. Though not a typical AD biomarker, we also examined the predictive value of WMH volumes. From these models, we determined whether each group of variables was significantly associated with amyloid status and computed areas under the receiver operating characteristics curve (AUC) for each. To test how diffusion metrics relate with other disease indicators, we calculated partial Pearson correlations covarying for age, sex, and amyloid status; this allowed us to quantify the associations between the metric values of the voxelwise ROIs with the AD-relevant cognitive domains and imaging biomarkers.
3. Results
The two groups did not differ significantly on demographic characteristics, medical history, cognitive test performance, and imaging biomarkers except for mSUVR (t(52.2)=−9.1, p<0.001), which contributed to group assignment, and age (t(129.5)=−5.4, p<0.001) (Table 1). Percentages or medians [first quartile, third quartile] for the total sample are additionally provided for overall study sample characterization.
Table 1.
Sample Characteristics and Imaging Biomarkers by Amyloid Status (N = 153).
| AB− (n = 102) |
n | AB+ (n = 51) |
n | Full Sample | |
|---|---|---|---|---|---|
| A. Demographics | |||||
| Age (years)* | 64.9 (9.7) | 102 | 72.5 (7.2) | 51 | 68.6 [60.6, 74.9] |
| Female | 73, 71.6% | 102 | 34, 66.7% | 51 | 107, 69.9% |
| White | 92, 90.2% | 102 | 48, 94.1% | 51 | 140, 91.5% |
| Education (years) | 16.2 (2.5) | 102 | 15.8 (2.7) | 50 | 16.0 [14.0, 18.0] |
| Right-handed | 92, 90.2% | 102 | 46, 90.2% | 51 | 138, 90.2% |
| B. Medical History | |||||
| MoCA total score | 27.1 (2.4) | 102 | 26.5 (2.6) | 51 | 27.0 [25.0, 29.0] |
| ApoE4 allele carrier | 39, 38.2% | 102 | 17, 33.3% | 51 | 56, 36.6% |
| Blood pressure, systolic (mmHg) | 133.6 (17.6) | 102 | 139.0 (16.5) | 51 | 135.0 [121.0, 147.5] |
| Blood pressure, diastolic (mmHg) | 76.4 (10.0) | 102 | 77.2 (10.5) | 51 | 76.0 [71.0, 82.0] |
| Body mass index (kg/m2) | 28.2 (6.8) | 102 | 29.2 (6.0) | 49 | 27.4 [24.1, 31.6] |
| Depression within past 2 years | 5, 5.7% | 88 | 4, 8.9% | 45 | 9, 6.8% |
| Diabetes | 9, 8.9% | 101 | 7, 14.0% | 50 | 16, 10.6% |
| Hypercholesterolemia | 26, 25.7% | 101 | 16, 32.7% | 49 | 42, 28.0% |
| Hypertension | 32, 31.4% | 102 | 19, 38.0% | 50 | 51, 33.6% |
| Sleep disorder, apneas | 12, 11.8% | 102 | 10, 20.0% | 50 | 22, 14.5% |
| Sleep disorder, insomnia | 4, 3.9% | 102 | 4, 8.0% | 50 | 8, 5.3% |
| Thyroid disorder | 20, 19.6% | 102 | 11, 22.4% | 49 | 31, 20.5% |
| Tobacco use, within past 30 days | 4, 3.9% | 102 | 1, 2.0% | 50 | 5, 3.3% |
| Tobacco use, >100 cigarettes lifetime | 44, 43.1% | 102 | 22, 44.0% | 50 | 66, 43.4% |
| Traumatic brain injury | 5, 5.1% | 99 | 1, 2.0% | 49 | 6, 4.1% |
| Vitamin B12 deficiency | 10, 9.8% | 102 | 4, 8.0% | 50 | 14, 9.2% |
| C. Cognitive Factors (z-scores) | |||||
| Memory | −0.9 (1.3) | 102 | −1.2 (1.1) | 51 | −1.1 [−1.9, −0.1] |
| Language | −0.8 (1.6) | 102 | −0.6 (1.3) | 51 | −0.8 [−1.7, 0.3] |
| Speed/Executive Functions | −0.7 (1.5) | 102 | −1.2 (1.8) | 51 | −0.7 [−1.6, 0.3] |
| D. Imaging Biomarkers | |||||
| Amyloidosis | |||||
| mSUVr* | 1.1 (0.1) | 102 | 1.5 (0.3) | 51 | 1.2 [1.1, 1.3] |
| Neurodegeneration (z-scores) | |||||
| AD Signature | −0.0 (0.7) | 102 | −0.2 (0.8) | 51 | −0.1 [−0.5, 0.5] |
| Global atrophy | 0.7 (1.0) | 102 | 1.0 (1.1) | 51 | 0.7 [0.1, 1.4] |
| Hippocampal volume | 0.2 (0.9) | 102 | 0.1 (0.8) | 51 | 0.2 [−0.4, 0.7] |
| White matter hyperintensities | |||||
| Lesion volume (ml) | 2.1 [0.6, 4.5] | 102 | 2.8 [1.3, 5.5] | 50 | 0.7 [2.3, 4.7] |
Note: Values are expressed as Mean (Standard Deviation); Number, % of Subgroup or Sample Total; or Median [Q1, Q3]. mSUVr = Mean standardized uptake value ratio. Variables with group differences
p < 0.001.
3.1. Greater diffusion restriction predicts high amyloid burden
Voxelwise analyses showed AB+ participants demonstrate greater diffusion restriction (i.e. higher FA/AWF, lower MD/De,⊥) in white matter than AB− participants (Fig 2A), with medium-to-large effect sizes (partial η2 = 0.08–0.19; Table 2B). Whereas diffusion metrics were significantly different in voxels throughout the brain, differences in WMTI metrics were localized to tracts in the corpus callosum, parietal, and temporal white matter, with more widespread voxelwise differences in De,⊥ relative to AWF (Fig 2A), where De,⊥ was significantly lower in AB+ than AB− (Fig 2C and Table 2B). Follow-up ROI analyses of the genu and splenium of the corpus callosum corroborated these voxelwise findings, with differences being greater in the late-myelinating genu than in the early-myelinating splenium albeit with smaller effect sizes (partial η2 = 0.05 for the genu ROIs and partial η2 = 0.01–0.04 for the splenium ROIs; Table 2B). MK did not differentiate the groups in either the voxelwise or ROI analyses.
Figure 2. Voxelwise and Region of Interest (ROI) analysis results.
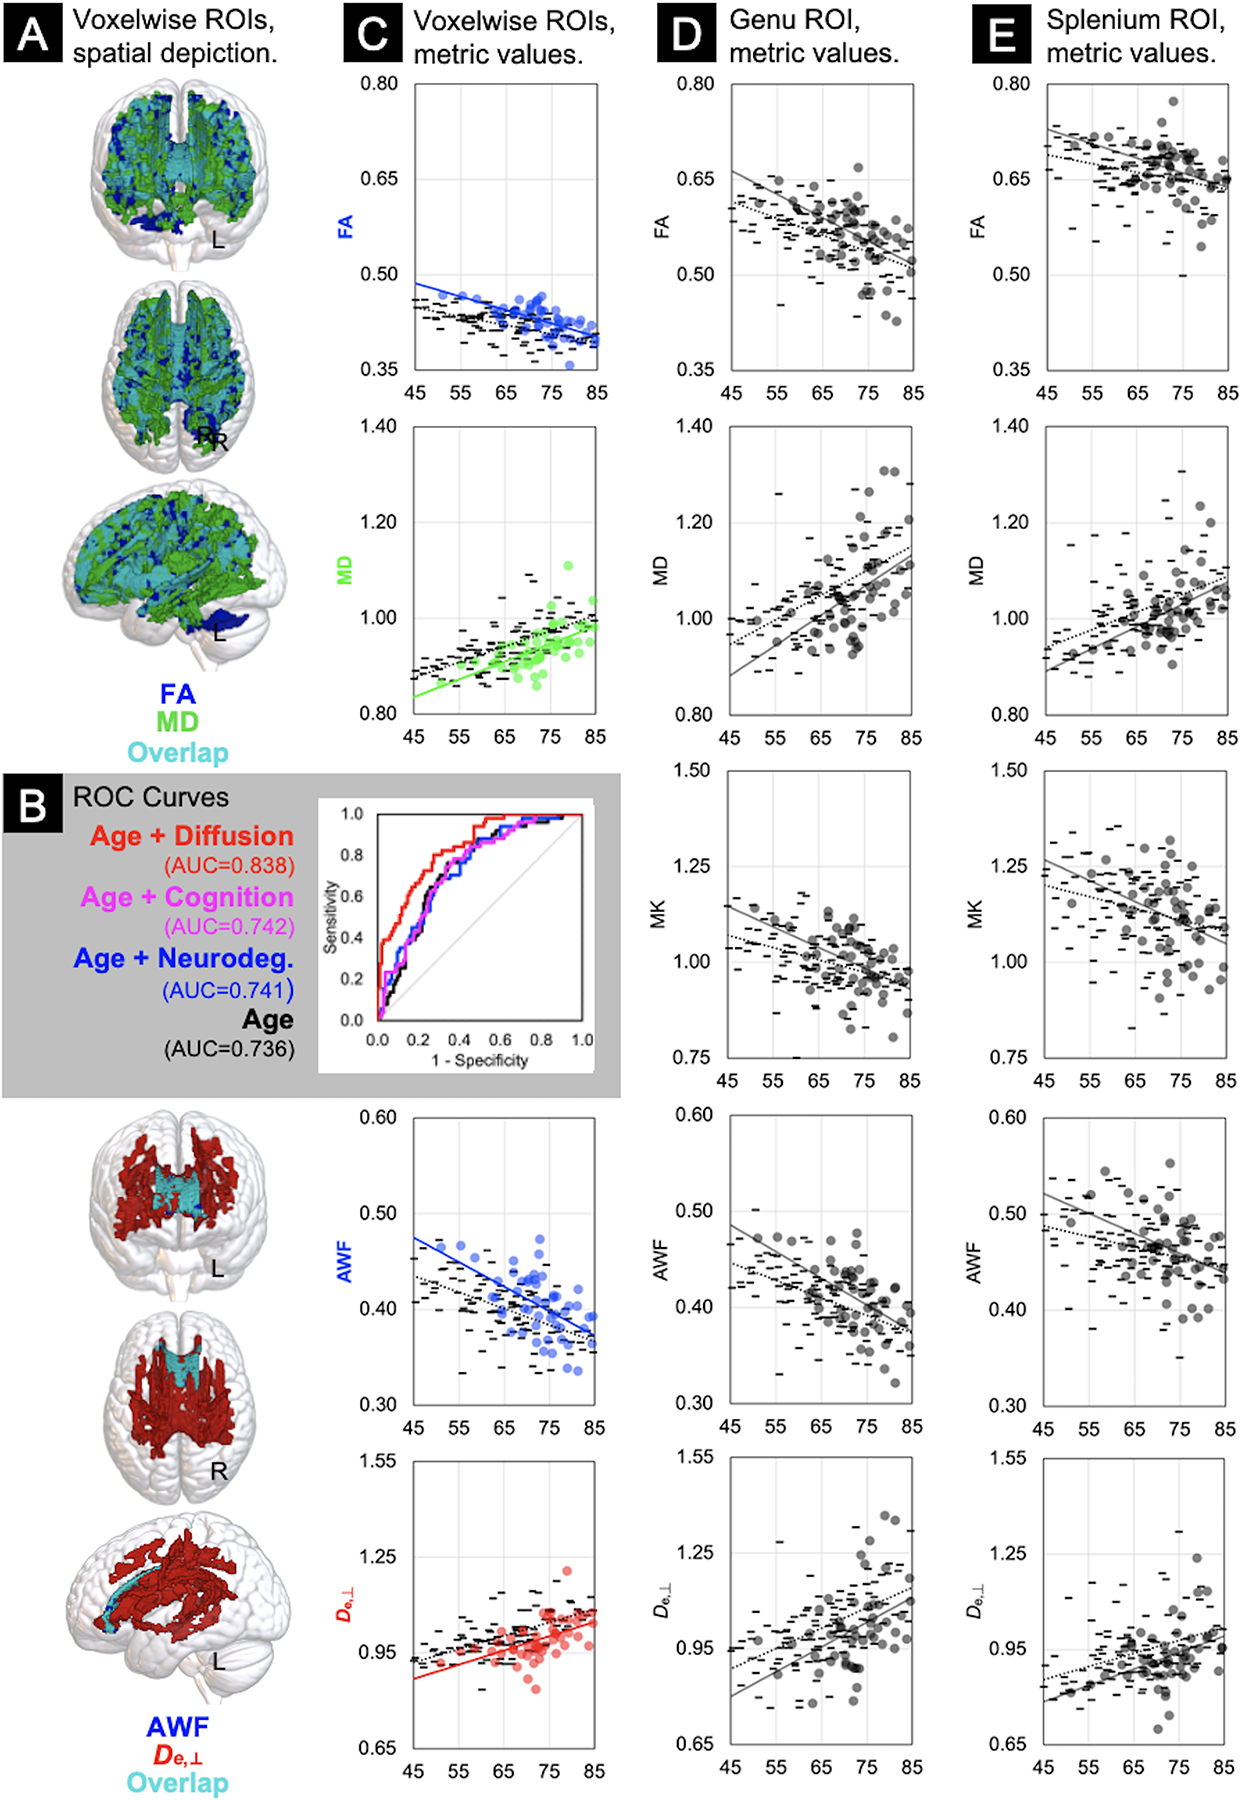
Column A: Results of the voxelwise general linear models indicating the voxels that differed significantly between AB− (n = 102) and AB+ (n = 51) groups, covarying for age and sex, color-coded to delineate diffusion (FA = blue; MD = green; overlapping voxels shared by FA and MD = teal) and WMTI (AWF = blue; De,⊥ = red; overlapping voxels shared by AWF and De,⊥ = teal) metrics. Panel B: Receiver Operating Characteristic curves depicting logistic regression results with age or age plus neurodegeneration, cognition, or diffusion metrics from Column C as predictors of amyloid status, with area under the curve (AUC) statistics. Scatterplots of linear correlations between age (x-axes) and the raw mean metric values of the voxelwise (Column C), genu (Column D), and splenium (Column E) ROIs (y-axes), stratified by group (AB− = - markers, ·····regression lines; AB+ = ● markers and —regression lines). FA = Fractional Anisotropy; MD = Mean Diffusivity; MK = Mean Kurtosis; AWF = Axonal Water Fraction; De,⊥ = Extra-axonal diffusivity, radial direction.
Table 2.
Age Correlations and Analyses of Covariance of the Metric Regions of Interest (N = 153).
| A. Age | B. ANCOVA | |||||
|---|---|---|---|---|---|---|
| Pearson’s | AB− (n = 102) | AB+ (n = 51) | Partial | |||
| Metric ROIs | r * | EMM (SE) | EMM (SE) | F | p-value | η2 |
| FA | ||||||
| Voxelwise ROI | −0.50 | 0.417 (0.002) | 0.436 (0.003) | 34.1 | <0.001 | 0.186 |
| Genu | −0.50 | 0.557 (0.004) | 0.578 (0.006) | 7.8 | 0.006 | 0.050 |
| Splenium | −0.30 | 0.658 (0.004) | 0.674 (0.006) | 5.2 | 0.026 | 0.033 |
| MD | ||||||
| Voxelwise ROI | 0.58 | 0.953 (0.004) | 0.924 (0.005) | 19.3 | <0.001 | 0.115 |
| Genu | 0.53 | 1.064 (0.008) | 1.028 (0.011) | 7.2 | 0.008 | 0.046 |
| Splenium | 0.45 | 1.026 (0.007) | 1.002 (0.010) | 4.1 | 0.044 | 0.027 |
| MK | ||||||
| Genu | −0.41 | 0.997 (0.008) | 1.017 (0.011) | 2.2 | 0.138 | 0.015 |
| Splenium | −0.32 | 1.126 (0.011) | 1.130 (0.015) | 0.0 | 0.842 | 0.000 |
| AWF | ||||||
| Voxelwise ROI | −0.49 | 0.396 (0.003) | 0.414 (0.004) | 13.7 | <0.001 | 0.084 |
| Genu | −0.51 | 0.405 (0.003) | 0.420 (0.004) | 8.0 | 0.005 | 0.051 |
| Splenium | −0.31 | 0.461 (0.004) | 0.470 (0.005) | 1.9 | 0.171 | 0.013 |
| D e,⊥ | ||||||
| Voxelwise ROI | 0.52 | 1.015 (0.005) | 0.971 (0.008) | 22.6 | <0.001 | 0.132 |
| Genu | 0.47 | 1.031 (0.011) | 0.980 (0.015) | 7.4 | 0.007 | 0.047 |
| Splenium | 0.35 | 0.947 (0.010) | 0.905 (0.014) | 6.4 | 0.013 | 0.041 |
Note: Covariates included age and sex. EMM = Estimated Marginal Means; SE = Standard Error; ROI = Region of Interest.
All correlations were statistically significant at p ≤ 0.001.
Logistic regression models predicting amyloid status yielded several important findings (Fig 2B). First, the model AUC that included only age as an independent variable was 0.736, and the beta coefficient for age was statistically significant (β=0.0992, p<0.0001). When the following sets of markers were added separately as independent variables to the model with age, no significant improvements were demonstrated in the AUCs: 3 neurodegeneration markers (AUC=0.741, λ2 = 2.19, 3df, p=0.53), 3 cognitive domains (AUC=0.742, λ2 = 2.38, 3df, p=0.50), WMH volumes (AUC=0.747, λ2 = 2.52, 1df, p=0.11). However, the logistic regression model predicting amyloid status using a combination of age and all 4 voxelwise diffusion metric ROIs yielded an AUC=0.838, a significant improvement over the model with only age as a predictor (λ2 = 33.4, 4df, p<0.0001). The AUC from this model was significantly greater than each of the AUCs from models with age plus other markers (i.e., neurodegeneration: p=0.008; cognition: p=0.011; WMH volume: p=0.021).
3.2. Greater diffusion restriction is associated with age, amyloid, cognition, neurodegeneration, and white matter hyperintensities
As expected, greater diffusion restriction (i.e. higher FA/AWF, lower MD/De,⊥ of the voxelwise ROIs) was moderately associated with younger age (Fig 2C–D; r = |0.3 – 0.6|, Table 2A). Greater diffusion restriction (i.e. higher FA, lower MD) was associated with higher amyloid burden and lower WMH volumes, with these effects likely being driven by changes in the extra-axonal space (i.e. De,⊥, Table 3B). Only AWF was positively correlated with speed/executive functions (Table 3A) and both AWF and FA were positively correlated with neurodegeneration biomarkers where higher z-scores indicate normatively greater thickness or larger volumes (Table 3B). Similarly, MD was inversely correlated with the AD signature biomarker of neurodegeneration. All biomarker associations were relatively small in magnitude (r = |0.2 – 0.3|) and not corrected for multiple comparisons.
Table 3.
Partial Correlation Coefficients of the Associations Between Cognitive Domain Factor Scores and Imaging Biomarkers with Metric Values of the Voxelwise Regions of Interest (N = 153).
| FA | MD | AWF | D e,⊥ | |
|---|---|---|---|---|
| A. AD-Relevant Cognitive Domains | ||||
| Memory factor | −0.02 | −0.00 | −0.14 | −0.01 |
| Language factor | 0.04 | 0.01 | −0.09 | 0.06 |
| Speed/Executive Functions factor | 0.11 | −0.08 | 0.18* | −0.02 |
| B. Imaging Biomarkers | ||||
| Amyloidosis | ||||
| mSUVra | 0.28** | −0.28** | 0.16 | −0.28** |
| Neurodegeneration | ||||
| AD Signature | 0.22** | −0.23** | 0.18* | −0.15 |
| Global atrophy | 0.21** | −0.05 | 0.17* | −0.06 |
| Hippocampal volume | 0.14 | −0.08 | 0.20* | −0.07 |
| White matter hyperintensities | ||||
| Lesion volume | −0.24** | 0.20* | −0.13 | 0.31** |
Note: Partial correlations controlled for age, sex, and amyloid status.
Covariates were age and sex.
mSUVr = Mean standardized uptake value ratio.
p < 0.05,
p < 0.01.
4. Discussion
White matter change in preclinical AD is characterized by greater diffusion restriction (i.e. higher FA/AWF, lower MD/De,⊥) in the presence of high amyloid burden. Model-derived WMTI metrics localize these effects to tracts known to myelinate later in life, preferentially involving gliosis/myelin repair rather than axonal neurodegeneration. Thus, this study suggests that glia/myelin serve a pivotal role in the early evolution of AD, actively regenerating and responding to coincident pathology, dominating the signal in lieu of opposing age-related increased diffusivity. These findings yield fresh insights into the overlapping paths of normal aging and AD pathogenesis and the potential of innovative diffusion MRI-based modeling to detect dissociable tissue-specific changes with sensitivity and specificity. Importantly, they also highlight underexplored mechanisms upon which to focus therapeutic development for the earliest stage of disease.
At the preclinical stage, diffusion metrics appear to behave in opposition to the trend observed in aging and clinical AD (i.e. MCI, dementia) of more progressively widespread increases in diffusivity4,5 due to age- and disease-related neurodegeneration. A unique strength of this paper is our use of WMTI metrics13–16 (Fig. 3.A) that have been validated in model systems17–20 to distinguish axonal degeneration (AWF) from gliosis (De,⊥), thereby providing insight into which tissue changes contribute to greater diffusion restriction. The WMTI model is predicated on the well-supported assumption of minimal water exchange between the intra-axonal and extra-axonal compartments over time scales comparable to echo time of the diffusion MRI sequence (≈ 50–100 ms)13. Here, the axolemma and myelin serve as low permeability barriers between the two compartments. Presuming fast water exchange between glial cells and the extracellular matrix, we hypothesize that changes in extra-axonal diffusion likely reflect myelin dynamics (e.g. remodeling, repair, breakdown) but also to some extent the associated changes in type, number, orientation, morphology, differentiation, or proliferation of glial cells and processes.
Figure 3. A conceptual model of diffusivity changes in white matter in aging and Alzheimer’s disease (AD).
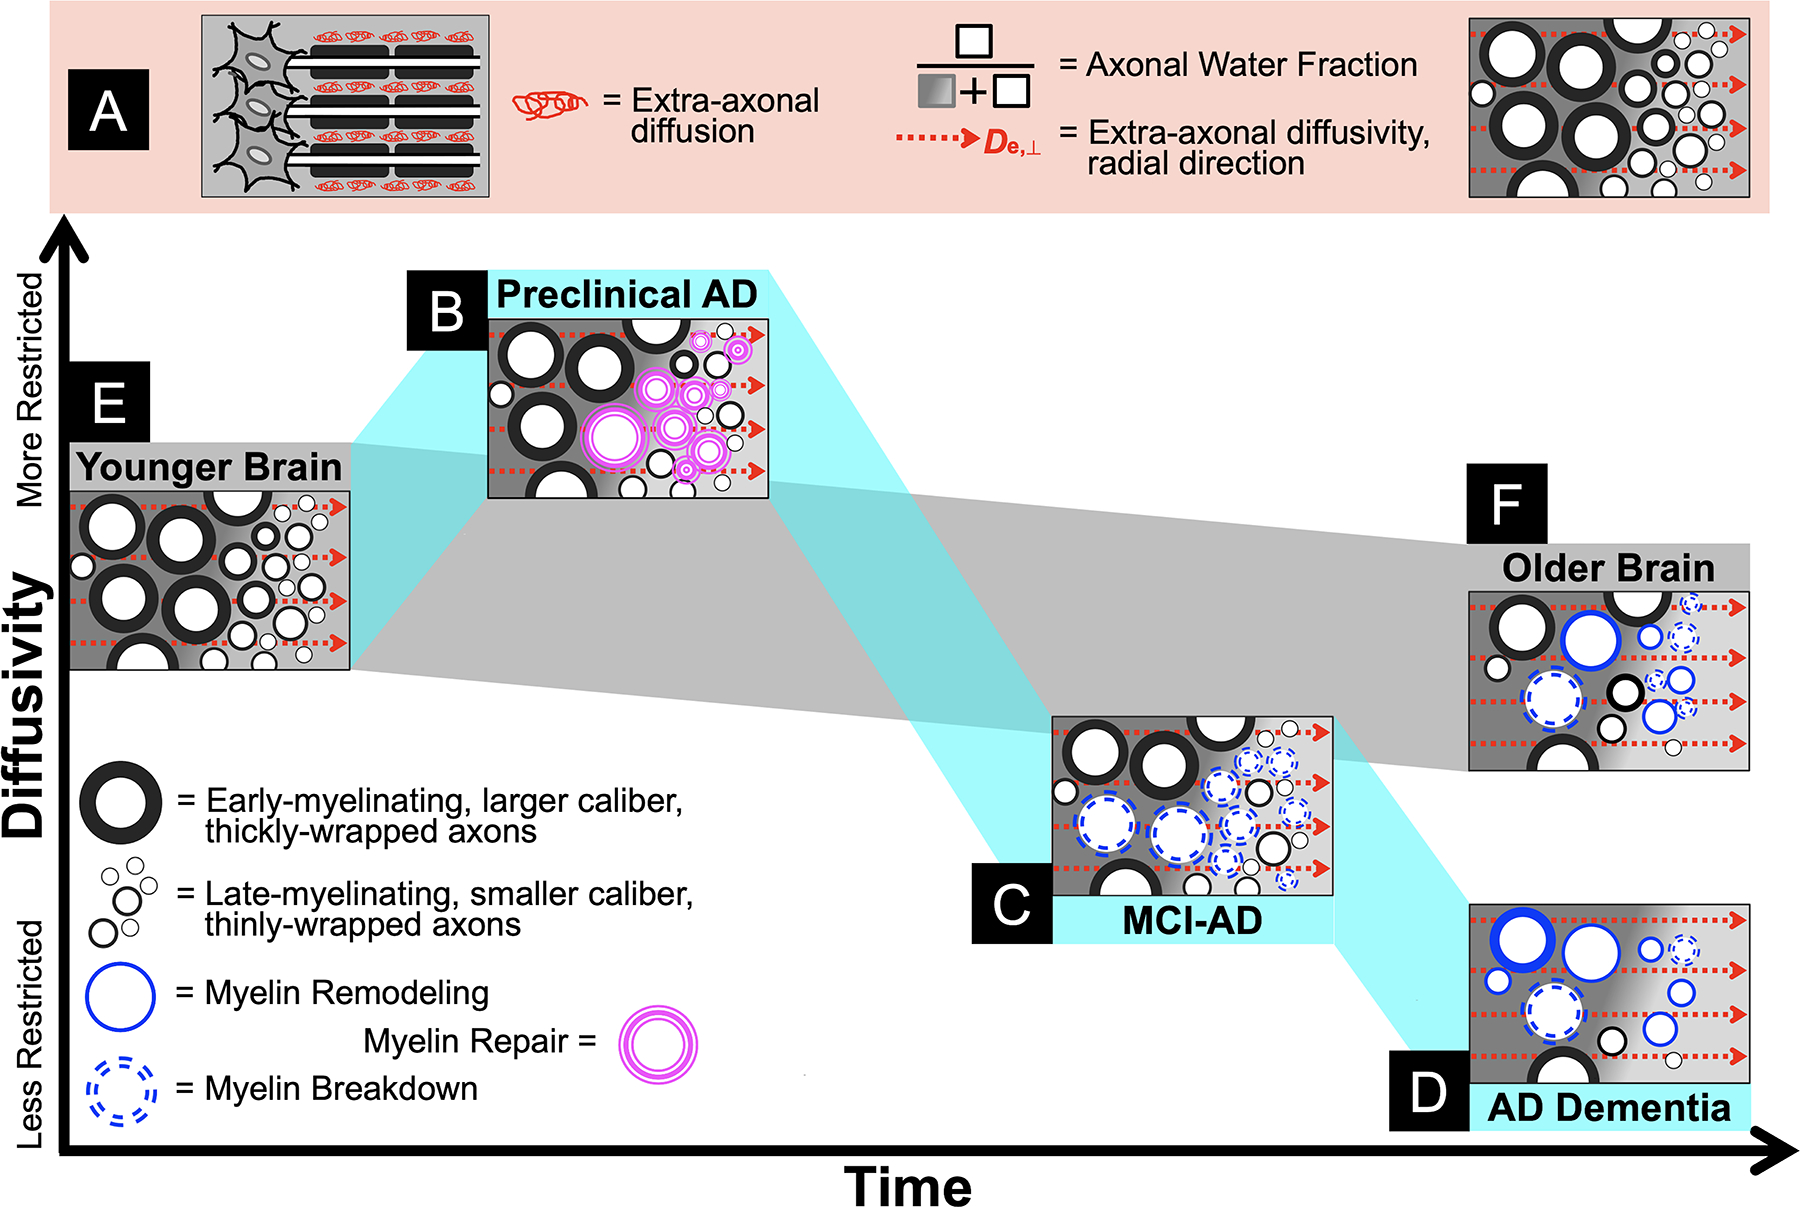
Panel A: An illustration of the White Matter Tract Integrity model, from left to right: a myelinated axon bundle depicting extra-axonal diffusion; Axonal Water Fraction as the proportion of intra-axonal water over all (intra- and extra-axonal) MR-visible water indicates axonal density, whereas De,⊥ indicates extra-axonal changes presumably due to gliosis and myelin changes; a cross-section of idealized healthy white matter, with early- and late-myelinating axon bundles in the left and right sides of the image, respectively, identical to the younger brain tissue depicted in Panel E. Note that the background gradient in each cross-section is only intended to visually draw attention to the difference between early- and late-myelinating axon bundles (left and right, respectively) and has no inherent meaning. Panel B: Greater diffusion restriction in preclinical AD due to gliosis/myelin repair processes in late-myelinating tracts. Panel C: When repair fails, myelin breakdown predominates in the symptomatic Mild Cognitive Impairment (MCI) phase prior to progressing to more widespread and severe myelin breakdown and axonal loss, driving global atrophy of white matter observed in AD dementia (Panel D). Panel F: In contrast, normal aging is characterized by homeostatic myelin remodeling with a modest loss of primarily late-myelinating axons and some myelin breakdown, contributing to age-related white matter atrophy.
Indeed, we have previously demonstrated correlations between diffusion metrics and histological markers of gliosis within peri-lesional cortex in experimental models of ischemia46,47, while in a clinical study of acute/subacute middle cerebral artery stroke we found significant changes in WMTI metrics within ischemic lesions48. Although axonal swelling or beading could certainly influence AWF due to a drop in intra-axonal diffusivity, our observation of a greater effect for De,⊥, both in effect size (Table 2) and spatial distribution (Fig. 2A), suggest that De,⊥ change may be more likely due to gliosis. Studies of the corpus callosum using a cuprizone model support these inferences, in that microglial activation correlates with De,⊥ but not AWF17, and that extensive infiltration and proliferation of microglia/macrophages increase cellularity/barriers, thus increasing diffusion restriction18. These supportive findings notwithstanding, our interpretations still bear validation in experimental or transgenic models of AD, though this study replicates previously published findings that arrived at similar conclusions (reviewed below). It is also important to note that the magnitude of the diffusion restriction found here is substantially smaller than that observed in acute ischemia and other severe brain pathologies49, suggesting different mechanisms that have yet to be further explored. Thus, while all our interpretations are restricted by the technique’s unique lens, these inferences are informed by the extant literature on myelin/glia and innovations in biophysical modeling, offering new perspectives and informed speculations on the nexus of healthy and pathological brain aging.
To this end, we therefore propose a conceptual model that outlines some hypothesized interpretations of white matter microstructural changes through the course of aging and AD. First, in preclinical AD, greater amyloid deposition associated with greater diffusion restriction particularly in the extra-axonal space suggests that white matter is in a state of myelin repair (Fig. 3.B). Here we define myelin repair as plasticity in myelin morphology to maintain neural function, staving off cognitive decline. Greater diffusion restriction as an indicator of myelin repair may reflect microglial activation and impaired phagocytosis of myelin debris, causing myelin vacuolation, fragmentation, and suboptimal remyelination50–52. In addition to barriers to diffusion resulting from amyloid deposition in white matter53, all of these effects plausibly decrease De,⊥. When this adaptive process fails and clinical symptoms emerge, our prior work suggests that white matter has proceeded to degenerate, initially involving myelin breakdown (i.e. demyelination as indicated by increased De,⊥) in MCI (Fig. 3.C) with subsequent further breakdown and marked loss of axons (i.e. decreased AWF) in dementia15,16 (Fig. 3.D). This perspective underscores that AD is inextricably linked with aging. That is, myelin repair and breakdown occur with (or perhaps are simply exacerbations of) normal, homeostatic, age-related myelin remodeling processes including spheroid formation, internode loss, and debris accumulation54,55 (Figs. 3.E–F), ultimately leading to tissue atrophy over time. That our findings are localized to regions that myelinate later in human brain development lends further credence to the hypothesis that within the unique phylogeny, ontogeny, and function of myelination lies the cause of AD30.
The findings of this study are concordant with prior studies that show this biphasic association between diffusion tensor imaging of white matter and amyloid PET in cognitively unimpaired older adults9–11. To this literature, we further suggest that in the preclinical stage these effects are driven by gliosis/myelin repair which we can detect with WMTI modeling. Analogous studies that used modeling-derived diffusion techniques arrived at similar conclusions. With a sample of healthy and MCI/early AD dementia patients staged according to low, intermediate, and high amyloid PET burden, Dong et al.41 found greater diffusion restriction (including higher AWF) in white matter in patients with intermediate versus low amyloid burden. Another study used a different modeling technique called neurite orientation dispersion and density imaging which they applied to analyze cortical microstructure in cognitively unimpaired participants with CSF amyloid and tau biomarkers. Here, Vogt et al.56 report findings of greater intracellular diffusion restriction in the presence of amyloid and the opposite in the presence of greater disease severity, i.e. when both amyloid and tau were present at higher levels. In sum, these and the current study support a non-monotonic change in diffusion behavior, where an early increase in diffusion restriction is hypothesized to reflect gliosis/myelin repair prior to a decrease in diffusion restriction, indicating glial and neural degeneration. While it is not possible to image the specific cellular and molecular mechanisms alluded to here using diffusion MRI, biophysical modeling provides potent tools with which to study how these mechanisms might influence water diffusion, exchange, permeability, and barriers in translational studies spanning tissue, model systems, and humans.
This study has three main clinical implications. First, it suggests that the presence of amyloid is not the sole pathophysiological process occurring at the earliest stage of disease57. Insofar as myelin is concerned30, studies using model systems and human tissue have shown that myelin/oligodendrocyte dysfunction can precede amyloid pathology58–60 in part via over-activation of myelin repair, leading to the inadvertent cleavage of amyloid precursor protein61. Thus, rather than a linear cascade of events, AD may be better conceptualized as synergistic, recursive, and critically, intimately tied to age-related homeostatic changes such as myelin remodeling/repair. Recent studies have indeed shown that treating myelin damage can reduce amyloid deposition and restore cognition62–64. As such, the second implication of these findings is that underexplored targets for treatment development and disease monitoring should be pursued for the very earliest stages of AD. For instance, selectively modulating innate immunity65 to support myelin repair may be beneficial at the preclinical stage prior to neurodegeneration. In turn, inflammation may also be potentiated by degeneration of oligodendrocytes (the myelinating glial cell) and their precursors, suggesting that treating glycolytic stress66 or senescence67 in these cells may be fruitful. Related agents (e.g. anti-inflammation/immunomodulatory therapies) are currently in clinical trials68 (none of which are targeting preclinical AD), but certainly future efforts to expand the drug development pipeline to include mechanisms described here are sorely needed, particularly in light of sobering results from anti-amyloid trials of both familial69 and late-onset symptomatic AD70,71. Finally, studies such as these underscore the importance of developing non-amyloid biomarkers for non-amyloid aspects of AD that are likely also highly relevant to disease pathogenesis and progression in aging brains. This is the motivating rationale behind innovations in diffusion MRI techniques such as those reported here, and in other diffusion MRI-based modeling56,72 and complementary MRI techniques73–75 as well.
This study has several strengths. First, in addition to employing a clinically applicable and validated WMTI modeling technique, a methodologically sophisticated registration method29 was incorporated per best practice recommendations for the widely-used voxelwise analytic approach used here76, thus improving the rigor and reproducibility of these findings. Second, the AB- and AB+ participants in this group did not systematically differ on almost all demographic, medical, cognitive, and biomarker measurements, providing confidence that the attributions put forth are not influenced by other explanatory variables. Given the focus on white matter in this line of work, future studies would benefit from more comprehensive characterization of other leukotoxic insults (e.g. certain therapies [chemotherapy, radiation, immunosuppressive drugs], environmental toxins) or conditions (e.g. migraine, demyelinating [e.g. Multiple Sclerosis], autoimmune [e.g. lupus], or infectious [e.g. HIV] diseases, leukodystrophy) which were not explicitly queried in the health history forms used in this study. Third, we also enhance the construct validity of WMTI metrics, showing meaningful (albeit modest) dissociated correlations where the axonal density metric AWF (but not De,⊥) was associated with speed/executive functions and neurodegeneration, whereas the gliosis metric De,⊥ (but not AWF) was associated with mSUVr and WMH volume. All diffusion metrics were superior in predicting amyloid status over age and any other biomarker, highlighting the unique contribution of diffusion imaging to understanding AD pathogenesis. These and other strengths outweigh some notable weaknesses in this study, including: use of a convenience sample of mostly female, white, and well-educated participants; lack of other AD biomarkers with which participants can be fully characterized within the research framework1; the fact that WMTI is only valid in highly-aligned white matter fiber bundles (i.e. FA>0.4); absence of other white matter-relevant imaging or biofluid biomarkers to further corroborate these inferences; and use of only cross-sectional data (as longitudinal data are still forthcoming in this ongoing study). Future work will endeavor to address these limitations to improve study generalizability and maximize relevance to ongoing AD biomarker research.
In conclusion, the Alzheimer’s Continuum in preclinical AD is associated with greater diffusion restriction in white matter, preferentially in regions that myelinate later in life and demonstrate the earliest AD-related changes. Potential mechanisms resulting in diffusion restriction include gliosis, innate immune activation/inflammation, and myelin repair, suggesting non-amyloid pathological changes upon which to focus disease monitoring or treatment development at the very earliest stages of disease.
Supplementary Material
ACKNOWLEDGMENTS
Research reported in this publication was supported by the National Institute on Aging of the National Institutes of Health under Award Numbers R01AG054159 and K23AG044434. The content is solely the responsibility of the authors and does not necessarily represent the official views of the National Institutes of Health. We would also like to acknowledge the support of the Litwin Foundation for this research, as well as the NIH National Center for Advancing Translational Sciences under award number UL1 TR001450 for data management support and COVID-related supplement funds. We also acknowledge Dr. Emmi Scott, Dr. Jacobo Mintzer, Ms. Mallory Gillen, Ms. Jennifer Sessions, Ms. Katrina Madden, Ms. Holly Fleischmann, Mr. Ian Cromwell, Ms. Laura Lohnes, Ms. Ericah Kerley, and Ms. Olivia Horn for their help with participant recruitment, data collection, and data entry in support of this project. Finally, we offer our utmost appreciation to all our participants whose enthusiasm for research has carried them through this longitudinal study despite the many challenges of the ongoing pandemic.
Footnotes
POTENTIAL CONFLICTS OF INTEREST
Nothing to report.
REFERENCES
- 1.Jack CR, Bennett DA, Blennow K, et al. NIA-AA Research Framework: Toward a biological definition of Alzheimer’s disease. Alzheimer’s & Dementia 2018;14(4):535–562. [DOI] [PMC free article] [PubMed] [Google Scholar]
- 2.Chételat G, La Joie R, Villain N, et al. Amyloid imaging in cognitively normal individuals, at-risk populations and preclinical Alzheimer’s disease. Neuroimage Clin 2013;2:356–365. [DOI] [PMC free article] [PubMed] [Google Scholar]
- 3.Bennett IJ, Madden DJ. Disconnected aging: Cerebral white matter integrity and age-related differences in cognition. Neuroscience 2014;276:187–205. [DOI] [PMC free article] [PubMed] [Google Scholar]
- 4.Bozzali M, Serra L, Cercignani M. Quantitative MRI to understand Alzheimer’s disease pathophysiology. Curr Opin Neurol 2016;29(4):437–444. [DOI] [PubMed] [Google Scholar]
- 5.Zhang B, Xu Y, Zhu B, Kantarci K. The role of diffusion tensor imaging in detecting microstructural changes in prodromal Alzheimer’s disease. CNS Neurosci Ther 2014;20(1):3–9. [DOI] [PMC free article] [PubMed] [Google Scholar]
- 6.Pichet Binette A, Theaud G, Rheault F, et al. Bundle-specific associations between white matter microstructure and Aβ and tau pathology in preclinical Alzheimer’s disease. eLife 2021;10:e62929. [DOI] [PMC free article] [PubMed] [Google Scholar]
- 7.Kantarci K, Schwarz CG, Reid RI, et al. White Matter Integrity Determined With Diffusion Tensor Imaging in Older Adults Without Dementia: Influence of Amyloid Load and Neurodegeneration. JAMA Neurology 2014;71(12):1547. [DOI] [PMC free article] [PubMed] [Google Scholar]
- 8.Rieckmann A, Van Dijk KRA, Sperling RA, et al. Accelerated decline in white matter integrity in clinically normal individuals at risk for Alzheimer’s disease. Neurobiology of Aging 2016;42:177–188. [DOI] [PMC free article] [PubMed] [Google Scholar]
- 9.Wolf D, Fischer FU, Scheurich A, et al. Non-Linear Association between Cerebral Amyloid Deposition and White Matter Microstructure in Cognitively Healthy Older Adults. J Alzheimers Dis 2015;47(1):117–127. [DOI] [PubMed] [Google Scholar]
- 10.Collij LE, Ingala S, Top H, et al. White matter microstructure disruption in early stage amyloid pathology [Internet]. Alzheimer’s & Dementia: Diagnosis, Assessment & Disease Monitoring 2021;13(1)[cited 2021 Jun 17] Available from: https://onlinelibrary.wiley.com/doi/10.1002/dad2.12124 [DOI] [PMC free article] [PubMed] [Google Scholar]
- 11.Racine AM, Adluru N, Alexander AL, et al. Associations between white matter microstructure and amyloid burden in preclinical Alzheimer’s disease: A multimodal imaging investigation. NeuroImage: Clinical 2014;4:604–614. [DOI] [PMC free article] [PubMed] [Google Scholar]
- 12.Jensen JH, Helpern JA. MRI quantification of non-Gaussian water diffusion by kurtosis analysis. NMR Biomed 2010;23(7):698–710. [DOI] [PMC free article] [PubMed] [Google Scholar]
- 13.Fieremans, Jensen JH, Helpern JA. White matter characterization with diffusional kurtosis imaging. Neuroimage 2011;58(1):177–188. [DOI] [PMC free article] [PubMed] [Google Scholar]
- 14.Benitez A, Jensen JH, Falangola MF, et al. Modeling white matter tract integrity in aging with diffusional kurtosis imaging. Neurobiology of Aging 2018;70:265–275. [DOI] [PMC free article] [PubMed] [Google Scholar]
- 15.Benitez A, Fieremans E, Jensen JH, et al. White matter tract integrity metrics reflect the vulnerability of late-myelinating tracts in Alzheimer’s disease. NeuroImage: Clinical 2014;4:64–71. [DOI] [PMC free article] [PubMed] [Google Scholar]
- 16.Fieremans E, Benitez A, Jensen JH, et al. Novel white matter tract integrity metrics sensitive to Alzheimer disease progression. AJNR Am J Neuroradiol 2013;34(11):2105–2112. [DOI] [PMC free article] [PubMed] [Google Scholar]
- 17.Falangola MF, Guilfoyle DN, Tabesh A, et al. Histological correlation of diffusional kurtosis and white matter modeling metrics in cuprizone-induced corpus callosum demyelination. NMR Biomed 2014;27(8):948–957. [DOI] [PMC free article] [PubMed] [Google Scholar]
- 18.Guglielmetti C, Veraart J, Roelant E, et al. Diffusion kurtosis imaging probes cortical alterations and white matter pathology following cuprizone induced demyelination and spontaneous remyelination. NeuroImage 2016;125:363–377. [DOI] [PMC free article] [PubMed] [Google Scholar]
- 19.Jelescu IO, Zurek M, Winters KV, et al. In vivo quantification of demyelination and recovery using compartment-specific diffusion MRI metrics validated by electron microscopy. Neuroimage 2016;132:104–114. [DOI] [PMC free article] [PubMed] [Google Scholar]
- 20.Zhou Z, Tong Q, Zhang L, et al. Evaluation of the diffusion MRI white matter tract integrity model using myelin histology and Monte-Carlo simulations. Neuroimage 2020;223:117313. [DOI] [PubMed] [Google Scholar]
- 21.Rossetti HC, Lacritz LH, Cullum CM, Weiner MF. Normative data for the Montreal Cognitive Assessment (MoCA) in a population-based sample. Neurology 2011;77(13):1272–1275. [DOI] [PubMed] [Google Scholar]
- 22.Weintraub S, Besser L, Dodge HH, et al. Version 3 of the Alzheimer Disease Centers’ Neuropsychological Test Battery in the Uniform Data Set (UDS). Alzheimer Dis Assoc Disord 2018;32(1):10–17. [DOI] [PMC free article] [PubMed] [Google Scholar]
- 23.Kiselica AM, Webber TA, Benge JF. The Uniform Dataset 3.0 Neuropsychological Battery: Factor Structure, Invariance Testing, and Demographically Adjusted Factor Score Calculation. J Int Neuropsychol Soc 2020;26(6):576–586. [DOI] [PMC free article] [PubMed] [Google Scholar]
- 24.Mortamais M, Ash JA, Harrison J, et al. Detecting cognitive changes in preclinical Alzheimer’s disease: A review of its feasibility. Alzheimers Dement 2017;13(4):468–492. [DOI] [PubMed] [Google Scholar]
- 25.Sherry ST, Ward MH, Kholodov M, et al. dbSNP: the NCBI database of genetic variation. Nucleic Acids Res 2001;29(1):308–311. [DOI] [PMC free article] [PubMed] [Google Scholar]
- 26.Kamboh MI, Barmada MM, Demirci FY, et al. Genome-wide association analysis of age-at-onset in Alzheimer’s disease. Mol Psychiatry 2012;17(12):1340–1346. [DOI] [PMC free article] [PubMed] [Google Scholar]
- 27.Jun G, Naj AC, Beecham GW, et al. Meta-analysis confirms CR1, CLU, and PICALM as alzheimer disease risk loci and reveals interactions with APOE genotypes. Arch Neurol 2010;67(12):1473–1484. [DOI] [PMC free article] [PubMed] [Google Scholar]
- 28.Dhiman S, Teves JB, Thorn KE, et al. PyDesigner: A Pythonic Implementation of the DESIGNER Pipeline for Diffusion Tensor and Diffusional Kurtosis Imaging [Internet]. Neuroscience; 2021.[cited 2021 Oct 22] Available from: http://biorxiv.org/lookup/doi/10.1101/2021.10.20.465189 [Google Scholar]
- 29.Zhang H, Yushkevich PA, Alexander DC, Gee JC. Deformable registration of diffusion tensor MR images with explicit orientation optimization. Med Image Anal 2006;10(5):764–785. [DOI] [PubMed] [Google Scholar]
- 30.Bartzokis G Alzheimer’s disease as homeostatic responses to age-related myelin breakdown. Neurobiol. Aging 2011;32(8):1341–1371. [DOI] [PMC free article] [PubMed] [Google Scholar]
- 31.Aboitiz F, Scheibel AB, Fisher RS, Zaidel E. Fiber composition of the human corpus callosum. Brain Res 1992;598(1–2):143–153. [DOI] [PubMed] [Google Scholar]
- 32.Marner L, Nyengaard JR, Tang Y, Pakkenberg B. Marked loss of myelinated nerve fibers in the human brain with age. J. Comp. Neurol 2003;462(2):144–152. [DOI] [PubMed] [Google Scholar]
- 33.Tang Y, Nyengaard JR, Pakkenberg B, Gundersen HJG. Age-Induced White Matter Changes in the Human Brain: A Stereological Investigation. Neurobiology of Aging 1997;18(6):609–615. [DOI] [PubMed] [Google Scholar]
- 34.Di Paola M, Spalletta G, Caltagirone C. In vivo structural neuroanatomy of corpus callosum in Alzheimer’s disease and mild cognitive impairment using different MRI techniques: a review. J. Alzheimers Dis 2010;20(1):67–95. [DOI] [PubMed] [Google Scholar]
- 35.Gold BT, Johnson NF, Powell DK, Smith CD. White matter integrity and vulnerability to Alzheimer’s disease: preliminary findings and future directions. Biochim. Biophys. Acta 2012;1822(3):416–422. [DOI] [PMC free article] [PubMed] [Google Scholar]
- 36.Allison SL, Koscik RL, Cary RP, et al. Comparison of different MRI-based morphometric estimates for defining neurodegeneration across the Alzheimer’s disease continuum. NeuroImage: Clinical 2019;23:101895. [DOI] [PMC free article] [PubMed] [Google Scholar]
- 37.Potvin O, Dieumegarde L, Duchesne S, et al. NOMIS: Quantifying morphometric deviation from normality over the lifetime in the adult human brain [Internet]. Neuroscience; 2021.[cited 2021 May 17] Available from: http://biorxiv.org/lookup/doi/10.1101/2021.01.25.428063 [Google Scholar]
- 38.Schmidt P, Gaser C, Arsic M, et al. An automated tool for detection of FLAIR-hyperintense white-matter lesions in Multiple Sclerosis. NeuroImage 2012;59(4):3774–3783. [DOI] [PubMed] [Google Scholar]
- 39.Jenkinson M, Bannister P, Brady M, Smith S. Improved optimization for the robust and accurate linear registration and motion correction of brain images. Neuroimage 2002;17(2):825–841. [DOI] [PubMed] [Google Scholar]
- 40.Clark CM, Schneider JA, Bedell BJ, et al. Use of Florbetapir-PET for Imaging β-Amyloid Pathology. JAMA 2011;305(3):275–283. [DOI] [PMC free article] [PubMed] [Google Scholar]
- 41.Dong JW, Jelescu IO, Ades-Aron B, et al. Diffusion MRI biomarkers of white matter microstructure vary nonmonotonically with increasing cerebral amyloid deposition. Neurobiology of Aging 2020;89:118–128. [DOI] [PMC free article] [PubMed] [Google Scholar]
- 42.Lowe VJ, Wiste HJ, Senjem ML, et al. Widespread brain tau and its association with ageing, Braak stage and Alzheimer’s dementia. Brain 2018;141(1):271–287. [DOI] [PMC free article] [PubMed] [Google Scholar]
- 43.Vasilevskaya A, Taghdiri F, Burke C, et al. Interaction of APOE4 alleles and PET tau imaging in former contact sport athletes. NeuroImage: Clinical 2020;26:102212. [DOI] [PMC free article] [PubMed] [Google Scholar]
- 44.Fleisher AS. Using Positron Emission Tomography and Florbetapir F 18 to Image Cortical Amyloid in Patients With Mild Cognitive Impairment or Dementia Due to Alzheimer Disease. Arch Neurol 2011;68(11):1404. [DOI] [PubMed] [Google Scholar]
- 45.Johnson KA, Sperling RA, Gidicsin CM, et al. Florbetapir (F18-AV-45) PET to assess amyloid burden in Alzheimer’s disease dementia, mild cognitive impairment, and normal aging. Alzheimer’s & Dementia 2013;9(5S):S72–S83. [DOI] [PMC free article] [PubMed] [Google Scholar]
- 46.Weber RA, Hui ES, Jensen JH, et al. Diffusional kurtosis and diffusion tensor imaging reveal different time-sensitive stroke-induced microstructural changes. Stroke 2015;46(2):545–550. [DOI] [PMC free article] [PubMed] [Google Scholar]
- 47.Weber RA, Chan CH, Nie X, et al. Sensitivity of diffusion MRI to perilesional reactive astrogliosis in focal ischemia. NMR Biomed 2017;30(7) [DOI] [PMC free article] [PubMed] [Google Scholar]
- 48.Hui ES, Fieremans E, Jensen JH, et al. Stroke assessment with diffusional kurtosis imaging. Stroke 2012;43(11):2968–2973. [DOI] [PMC free article] [PubMed] [Google Scholar]
- 49.Meyers SP. Intracranial Abnormalities with Diffusion Restriction. Magnetic Resonance Imaging Clinics of North America 2021;29(2):137–161. [DOI] [PubMed] [Google Scholar]
- 50.Heneka MT, Golenbock DT, Latz E. Innate immunity in Alzheimer’s disease. Nat Immunol 2015;16(3):229–236. [DOI] [PubMed] [Google Scholar]
- 51.Pohl HBF, Porcheri C, Mueggler T, et al. Genetically Induced Adult Oligodendrocyte Cell Death Is Associated with Poor Myelin Clearance, Reduced Remyelination, and Axonal Damage. Journal of Neuroscience 2011;31(3):1069–1080. [DOI] [PMC free article] [PubMed] [Google Scholar]
- 52.Nordengen K, Kirsebom B-E, Henjum K, et al. Glial activation and inflammation along the Alzheimer’s disease continuum. J Neuroinflammation 2019;16(1):46. [DOI] [PMC free article] [PubMed] [Google Scholar]
- 53.Iwamoto N, Nishiyama E, Ohwada J, Arai H. Distribution of amyloid deposits in the cerebral white matter of the Alzheimer’s disease brain: relationship to blood vessels. Acta Neuropathol 1997;93(4):334–340. [DOI] [PubMed] [Google Scholar]
- 54.Hill RA, Li AM, Grutzendler J. Lifelong cortical myelin plasticity and age-related degeneration in the live mammalian brain. Nat Neurosci 2018;21(5):683–695. [DOI] [PMC free article] [PubMed] [Google Scholar]
- 55.Peters A, Kemper T. A review of the structural alterations in the cerebral hemispheres of the aging rhesus monkey. Neurobiology of Aging 2012;33(10):2357–2372. [DOI] [PMC free article] [PubMed] [Google Scholar]
- 56.Vogt NM, Hunt JFV, Adluru N, et al. Interaction of amyloid and tau on cortical microstructure in cognitively unimpaired adults. Alzheimer’s & Dementia 2021;alz.12364. [DOI] [PMC free article] [PubMed] [Google Scholar]
- 57.Herrup K The case for rejecting the amyloid cascade hypothesis. Nat Neurosci 2015;18(6):794–799. [DOI] [PubMed] [Google Scholar]
- 58.Tse K-H, Cheng A, Ma F, Herrup K. DNA damage-associated oligodendrocyte degeneration precedes amyloid pathology and contributes to Alzheimer’s disease and dementia. Alzheimers Dement 2018;14(5):664–679. [DOI] [PMC free article] [PubMed] [Google Scholar]
- 59.Desai MK, Sudol KL, Janelsins MC, et al. Triple-transgenic Alzheimer’s disease mice exhibit region-specific abnormalities in brain myelination patterns prior to appearance of amyloid and tau pathology. Glia 2009;57(1):54–65. [DOI] [PMC free article] [PubMed] [Google Scholar]
- 60.Falangola MF, Nie X, Ward R, et al. Diffusion MRI detects early brain microstructure abnormalities in 2-month-old 3×Tg-AD mice. NMR Biomed 2020;33(9):e4346. [DOI] [PMC free article] [PubMed] [Google Scholar]
- 61.Nguyen T-VV, Hayes M, Zbesko JC, et al. Alzheimer’s associated amyloid and tau deposition co-localizes with a homeostatic myelin repair pathway in two mouse models of post-stroke mixed dementia. acta neuropathol commun 2018;6(1):100. [DOI] [PMC free article] [PubMed] [Google Scholar]
- 62.Xie Y-Y, Pan T-T, Xu D-E, et al. Clemastine Ameliorates Myelin Deficits via Preventing Senescence of Oligodendrocytes Precursor Cells in Alzheimer’s Disease Model Mouse. Front Cell Dev Biol 2021;9:733945. [DOI] [PMC free article] [PubMed] [Google Scholar]
- 63.Yu H, Shi J, Lin Y, et al. Icariin Ameliorates Alzheimer’s Disease Pathology by Alleviating Myelin Injury in 3 × Tg-AD Mice. Neurochem Res 2022; [DOI] [PubMed] [Google Scholar]
- 64.Chen J-F, Liu K, Hu B, et al. Enhancing myelin renewal reverses cognitive dysfunction in a murine model of Alzheimer’s disease. Neuron 2021;109(14):2292–2307.e5. [DOI] [PMC free article] [PubMed] [Google Scholar]
- 65.Cisbani G, Rivest S. Targeting innate immunity to protect and cure Alzheimer’s disease: opportunities and pitfalls [Internet]. Mol Psychiatry 2021;[cited 2021 Sep 1] Available from: http://www.nature.com/articles/s41380-021-01083-4 [DOI] [PubMed] [Google Scholar]
- 66.Zhang X, Wang R, Hu D, et al. Oligodendroglial glycolytic stress triggers inflammasome activation and neuropathology in Alzheimer’s disease. Sci. Adv 2020;6(49):eabb8680. [DOI] [PMC free article] [PubMed] [Google Scholar]
- 67.Zhang P, Kishimoto Y, Grammatikakis I, et al. Senolytic therapy alleviates Aβ-associated oligodendrocyte progenitor cell senescence and cognitive deficits in an Alzheimer’s disease model. Nat Neurosci 2019;22(5):719–728. [DOI] [PMC free article] [PubMed] [Google Scholar]
- 68.Cummings J, Lee G, Zhong K, et al. Alzheimer’s disease drug development pipeline: 2021 [Internet]. Alzheimer’s & Dementia: Translational Research & Clinical Interventions 2021;7(1)[cited 2022 Feb 2] Available from: https://onlinelibrary.wiley.com/doi/10.1002/trc2.12179 [DOI] [PMC free article] [PubMed] [Google Scholar]
- 69.Salloway S, Farlow M, McDade E, et al. A trial of gantenerumab or solanezumab in dominantly inherited Alzheimer’s disease. Nat Med 2021;27(7):1187–1196. [DOI] [PMC free article] [PubMed] [Google Scholar]
- 70.Huang Y-M, Shen J, Zhao H-L. Major Clinical Trials Failed the Amyloid Hypothesis of Alzheimer’s Disease: Clinical Trials Failed the Amyloid Hypothesis. J Am Geriatr Soc 2019;67(4):841–844. [DOI] [PubMed] [Google Scholar]
- 71.Ackley SF, Zimmerman SC, Brenowitz WD, et al. Effect of reductions in amyloid levels on cognitive change in randomized trials: instrumental variable meta-analysis. BMJ 2021;n156. [DOI] [PMC free article] [PubMed] [Google Scholar]
- 72.Vogt NM, Hunt JF, Adluru N, et al. Cortical Microstructural Alterations in Mild Cognitive Impairment and Alzheimer’s Disease Dementia. Cerebral Cortex 2020;30(5):2948–2960. [DOI] [PMC free article] [PubMed] [Google Scholar]
- 73.Bouhrara M, Reiter DA, Bergeron CM, et al. Evidence of demyelination in mild cognitive impairment and dementia using a direct and specific magnetic resonance imaging measure of myelin content. Alzheimers Dement 2018;14(8):998–1004. [DOI] [PMC free article] [PubMed] [Google Scholar]
- 74.Dean DC, Hurley SA, Kecskemeti SR, et al. Association of Amyloid Pathology With Myelin Alteration in Preclinical Alzheimer Disease. JAMA Neurology 2017;74(1):41. [DOI] [PMC free article] [PubMed] [Google Scholar]
- 75.Kavroulakis E, Simos PG, Kalaitzakis G, et al. Myelin content changes in probable Alzheimer’s disease and mild cognitive impairment: Associations with age and severity of neuropsychiatric impairment. J Magn Reson Imaging 2018;47(5):1359–1372. [DOI] [PubMed] [Google Scholar]
- 76.Bach M, Laun FB, Leemans A, et al. Methodological considerations on tract-based spatial statistics (TBSS). NeuroImage 2014;100:358–369. [DOI] [PubMed] [Google Scholar]
- 77.McKinnon ET, Helpern JA, Jensen JH. Modeling white matter microstructure with fiber ball imaging. Neuroimage 2018;176:11–21. [DOI] [PMC free article] [PubMed] [Google Scholar]
- 78.Nilsson M, Lätt J, van Westen D, et al. Noninvasive mapping of water diffusional exchange in the human brain using filter-exchange imaging. Magn Reson Med 2013;69(6):1573–1581. [DOI] [PubMed] [Google Scholar]
Associated Data
This section collects any data citations, data availability statements, or supplementary materials included in this article.