

Abstract
Regulatory T cells (Tregs) require (interleukin-2) IL-2 for their homeostasis by affecting their proliferation, survival, and activation. Here we investigated transcriptional and epigenetic changes after acute, periodic, and persistent IL-2 receptor (IL-2R) signaling in murine peripheral Tregs in vivo using IL-2 or the long-acting IL-2-based biologic mouse IL-2/CD25. We show that initially IL-2R-dependent STAT5 transcription factor-dependent pathways enhanced gene activation, chromatin accessibility, and metabolic reprogramming to support Treg proliferation. Unexpectedly, at peak proliferation, less accessible chromatin prevailed and was associated with Treg contraction. Restimulation of IL-2R signaling after contraction activated signature IL-2-dependent genes and others associated with effector Tregs, whereas genes associated with signal transduction were down-regulated to somewhat temper expansion. Thus, IL-2R-dependent Treg homeostasis depends in part on a shift from more accessible chromatin and expansion to less accessible chromatin and contraction. Mouse IL-2/CD25 supported greater expansion and a more extensive transcriptional state than IL-2 in Tregs, consistent with greater efficacy to control autoimmunity.
Introduction
Regulatory T cells (Tregs) are essential to maintain peripheral T cell tolerance and require IL-2R signaling for their development and homeostasis1. IL-2R signaling also functions as a growth factor for Tregs and pharmacologic application of IL-2 is being tested as a Treg-target therapy for autoimmunity. Indeed, low-dose IL-2 represents a therapy for patients with various autoimmune diseases by selective expansion of Tregs2,3. Fundamental to low-dose IL-2R therapy is that much lower IL-2R signaling threshold supports Treg growth, development, and homeostasis whereas effector T cells (Teff) require a much higher IL-2 signaling threshold4. In this regard, approximately 100-fold more IL-2 is required to activate IL-2-dependent genes in human CD45RO+ T effector/memory T cells when compared to Tregs5.
A drawback of IL-2 in low-dose IL-2 therapy is its short half-life (<15 min)6, which requires frequent administration to increase Tregs. Considerable interest and effort has led to development of new IL-2-based biologics to improve Treg-selectivity and/or prolong its half-life. These molecules include IL-2 muteins and PEGylated IL-2 with enhanced reactivity toward the high affinity IL-2R on Tregs, IL-2-immunoglobulin fusion proteins to increase half-life, IL-2/anti-IL-2 immune complexes, or a fusion protein of mouse IL-2 linked to mouse CD25 (mIL-2/CD25)7,8 to provide persistent IL-2R signaling selectively to Tregs.
The focus of the studies to date on these new IL-2-based biologics has been related to molecular approaches for their development, Treg selectivity, activation of proximal IL-2R signaling, and their efficacy in various disease models. Unexplored with these biologics or recombinant IL-2 is their outcome on gene transcription and effects on chromatin landscape in Tregs in vivo. Most of our understanding of gene regulation in Tregs by IL-2 has been obtained by comparing gene expression of Tregs obtained from wild-type mice versus mice with absent or lowered IL-2R signaling or stimulation of human Tregs with IL-2 in vitro4, 5, 9, 10, 11. However, these studies have not investigated the temporal response by which IL-2R signaling regulates Treg gene expression, the potential impact of the in vivo environment in shaping this response, and the extent to which persistent IL-2R signaling optimizes Treg transcription. Establishing the molecular underpinning by which IL-2R signaling regulates peripheral Tregs is not only relevant to the mechanism by which IL-2 contributes to Treg biology but is also of important translational value as low-dose IL-2 is being advanced as a Treg-targeted therapy for autoimmunity. Here, we use recombinant mouse IL-2 (mIL-2) and mIL-2/CD25 to induce acute, periodic, and persistent IL-2R-dependent signaling in mature peripheral Tregs in vivo to longitudinally profile shifts in their transcriptomes and chromatin landscapes.
Results
Sustained IL-2R signaling drives Treg proliferation
To model acute and persistent IL-2R signaling in vivo, we used short-acting (t½ <15 min) recombinant mIL-2 or long-acting (t½ ~16 hr) mIL-2/CD25, respectively. mIL-2/CD25 exists predominately as inactive head-to-tail noncovalent dimers that slowly dissociates into active monomers that bind to cells expressing the high affinity IL-2R to induce persistent IL-2R signaling12. At a low dose, this mode of action results in an IL-2-based biologic to selectively stimulate Tregs to control autoimmunity in preclinical models of type 1 diabetes and systemic lupus erythematous8,12,13.
We first assessed the consequences of acute versus persistent IL-2R signaling on proximal IL-2R signaling, proliferation, and gene expression for splenic C57BL/6J Tregs in vivo. Mice received a single administration of equimole amounts of mIL-2 or mIL-2/CD25. Accordingly, pSTAT5 activation in Tregs declined to ~50% of the maximal response 4 hr and 72 hr post administration of mIL-2 and mIL-2/CD25, respectively (Fig. 1a and Extended Data Fig. 1a,b). Importantly, only mIL-2/CD25 supported Treg expansion (Fig. 1b) while exhibiting enhanced suppressive function when tested in vitro (Fig. 1c).
Figure 1.

Single administration of mIL-2/CD25, but not mIL-2 supports Tregs expansion with gene expression outlining similar early transcription factors and signaling activities
RNA-seq of ex vivo purified Tregs (Extended Data Fig. 2) was performed to determine differentially expressed genes (DEGs) for 3-4 biological replicates at several time points after administering a single dose of mIL-2 or mIL-2/CD25. DEGs induced by IL-2 or mIL-2/CD25 were determined in reference to PBS-treated control mice. At the earliest time point (1.5 hr) when using a 1.5-fold cut-off, more DEGs were detected for mice treated with mIL-2 than mIL-2/CD25 (Fig. 1d and Supplementary Table 1). Indeed, clustering of these DEGs, based on the FDR without a fold cut-off, revealed that essentially all of these transcripts were similarly regulated after activation by IL-2 or mIL-2/CD25, although some DEGs were induced to somewhat lower levels by mIL-2/CD25, as illustrated in cluster 2 (Fig.1e). These quantitative difference likely accounts for the lower number of DEGs by mIL-2/CD25 at 1.5 hr (Fig. 1d), where a 1.5-fold cut-off was used. At 4 hr, numbers (Fig. 1d) and distribution (Extended Data Fig. 3) of DEGs activated by mIL-2 and mIL-2/CD25 were comparable. A non-parametric Spearman’s correlation matrix heat map for the 1.5-72 hr time points (Fig. 1f) revealed a high correlation at 1.5 (r2=0.87) and 4 (r2=0.82) hr for DEGs induced by mIL-2/CD25 and mIL-2, indicative of highly comparable early gene responses. A moderate correlation was also found for DEGs from early time points (1.5 hr and 4 hr) for mIL-2 and mIL-2/CD25 when compared to DEGs for mIL-2/CD25 at 16 hr. However, at and beyond 16 hr, essentially only mIL-2/CD25 supported DEGs, with the highest number at 72 hr. Initially (1.5-72 hr), the majority of DEGs were upregulated, with maximal number at 16 hr and 72 hr, whereas DEGs markedly decreased toward baseline at 168 hr with a shift toward downregulated transcripts. Thus, although mIL-2 and mIL-2/CD25 initially induce essentially identical transcriptional programs, sustained IL-2R signaling is required to further drive transcriptional changes required for Treg proliferation.
Early consequences of IL-2R signaling in Tregs
Gene set enrichment analysis (GSEA) was performed for mIL-2/CD25 and mIL-2-dependent DEGs at 1.5 hr and both revealed high normalized enrichment scores for RELA, IL-2/STAT5, SHC1 events in ERBB4 signaling pathways, and TCR in Tregs (Fig. 1g). Ingenuity Pathway Analysis (IPA) of DEGs confirmed that STAT5A/B-, REL-, and NFATC2-dependent pathways were among the most significant upstream regulators at 1.5 hr (Extended Data Fig. 4a). However, activation of the NF-κB RELA subunit and NFATC2 are associated with TCR, rather than IL-2R signaling. Notably, the top scoring IPA network identified TCR and STAT5 as key hubs at 1.5 hr (Extended Data Fig. 4b). These findings suggest that endogenous TCR signaling in Tregs may influence the IL-2R-dependent transcriptome induced by mIL-2 or mIL-2/CD25.
Identification of core IL-2R-dependent genes in Tregs
We compared the upregulated DEGs by mIL-2/CD25 and mIL2 at 1.5 hr, 16 hr, and 72 hr with those genes that require IL-2R signaling for their optimal expression in CD25 conditional knockout mice, where CD25 was inducibly and selectively deleted in peripheral Tregs11 (Fig. 1h). By comparing these gene sets (Fig. 1h, Venn diagrams), 29-56 (16-31%) of the IL-2R-dependent transcripts identified in Tregs from CD25 conditional knockout mice were also IL-2-dependent after administration of IL-2 or mIL-2/CD25. Quantitative analysis of the shared genes by scatter plots and Enrichr pathway analysis14, initially (1.5 hr) revealed several well-recognized IL-2- and/or STAT5-dependent transcripts (Il2ra, Ccnd2, Lta, Myc, Bcl-2, Cish, and Socs2) and later several genes (Idi1, Mvd, Dhcr24, and Sqle) involved in terpenoid and steroid biosynthesis (Fig. 1h, center and right). These pathways likely reflect an overlap related to some of the homeostatic functions of IL-2R signaling in Tregs. Administration of mIL-2/CD25 also identified additional pathways, which positively controls cellular and energy metabolic processes and cell cycle progression (Extended Data Fig. 5a,b) that reflects the growth promoting activity of IL-2R signaling.
The IL-2R-dependent transcriptome and Treg proliferation
DEGs induced in Tregs by mIL-2/CD25 as a consequence of persistent IL-2R signaling were interrogated to identify the cascade of transcription factors that affect gene expression. By applying the z-score of activation (active ≥ 2; inhibited ≤ −2), IPA predicted more factors acting at 16 hr and 72 hr than 1.5 hr and 4 hr (Fig. 2a,b and Extended Data Fig. 6), concordant with a larger number of DEGs at these time points (Fig. 1d). Those transcription factors that promote cell cycle progression and/or metabolism (e.g. MYC, E2F, CCND1, STAT5A, and NF2L1/2) were active, whereas others that limit transcription or cell growth (e.g. RB, FOXO3, and TOB1) were inhibited. Although rapid activation of MYC was anticipated, MYC transcription factor activity, which typically has activity over a short time-frame due to its short half-life15, was unexpectedly the highest at 16 and 72 hr. Likewise, the amount of MYC protein remained high at 2 and 48 hr (Extended Data Fig. 7a,b). The L amino acid transporter Slc7a5 mRNA stabilizes MYC protein levels16 and its mRNA levels also increased substantially from 1.5-16 hr by mIL-2/CD25 (Extended Data Fig. 7c), which may contribute to mIL-2/CD25-dependent persistent MYC.
Figure 2.

mIL-2/CD25 increases transcriptional activity and gene networks at 16 hr promoting DNA synthesis and cell cycle progression
The kinetics of enriched canonical pathways revealed largely induced pathways from 1.5-16 hr, active and repressed pathways at 72 hr, and only repressed pathways at 168 hr (Extended Data Fig. 5a,b and Supplementary Table 2). Initially, mIL-2/CD25 induces IL-2R signaling that facilitates cell transcription and integration of TCR signaling (NFκB and ERK5 pathways) as previously described17,18. These events are followed at 4 hr by induction of genes that facilitate biosynthesis of amino acids, nucleic acids, and cholesterol. Genes in these pathways often remained elevated at 16 hr and are now accompanied by gene activation related to cell cycle progression and cellular growth.
The 2790 DEGs and 25 active transcription regulators at 16 hr were analyzed using IPA to understand how mIL-2/CD25 supported Treg proliferation at 72 hr. The top enriched functional network predicts that mIL-2/CD25-modulates Hells, Tfdp1, Lin9, Ncoa3, Ndufa13, Pax8, Rbl1, E2F2, and Wwtr1 activities over 36 target genes promoting cell cycle progression and DNA synthesis, while inhibiting cell death (Fig. 2c). Most (29 of 39) target genes function in the nucleus. With respect to transcriptional regulators, 5 out of 9 were significantly induced by mIL-2/CD25 (Fig. 2d), where Hells and Tfdp1 were induced over 2-fold at 16 hr and 72 hr by mIL-2/CD25, but not mIL-2 (Fig. 2e). The gene Hells (also known as Lsh) encodes a SNF2 family DNA helicase that is required for proliferation of mature T lymphocytes and other cell types19,20, while Tfdp1 encodes for the transcription factor DP-1 that is involved in G1-S cell cycle progression by forming heterodimers with E2F2 stimulating transcription of numerous E2F-dependent genes21. Consistent with upregulation of Hells transcription and activity, several Hells-associated cell cycle genes were upregulated at 16 hr by mIL-2/CD25 (Fig. 2f). Collectively, these data imply mIL-2/CD25-dependent proliferation depends not only on activation of Myc and E2F family members, but also Hells.
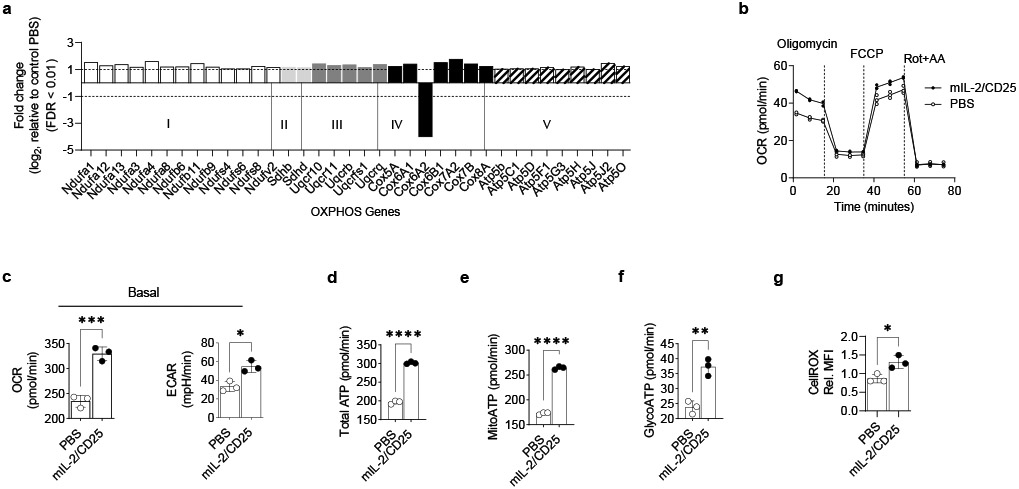
Sustained IL-2R signaling reprograms Treg energetic metabolism
Besides increases in expression and activity of MYC that is associated with Treg growth and metabolism22, (83 of 208 or 40%) of mouse mitochondrial genes associated with OXPHOS, electron transport chain (ETC), tricarboxylic acid cycle (TCA), and ROS metabolism23 were significantly upregulated by mIL-2/CD25 at 72 hr, including many transcripts associated with the electron transport chain (Fig. 3a and Extended Data Fig. 8a). Consequently, we tested whether mIL-2/CD25-dependent changes in the Treg transcriptome reflected reprogramming of metabolic pathways. At 72 hr, the oxygen consumption rate (OCR) was measured in the basal state and after the addition of oligomycin, FCCP, and Rotenone/Antimycin A in Tregs (Fig. 3b). After treatment with mIL-2/CD25, Tregs exhibited an increase in the basal level of OCR, an indicator of OXPHOS, and the basal extracellular acidification rate (ECAR), a consequence of lactic acid production and a marker of glycolysis (Fig. 3c left and right, respectively). The OCRs and ECARs measurements were combined to assess total ATP, as well as mitochondrial and glycolytic ATPs. A significant increase in total ATP was generated (Fig. 3d) with a larger increase in the mitochondrial than in the glycolytic ATP fraction (Fig.3e and Fig. 3f, respectively). An increase in intracellular ROS was found at 72 hr post injection of mIL-2/CD25 (Fig. 3e). Taken together, these results indicate that sustained IL-2R signaling at the peak of the response by mIL-2/CD25 modulates gene expression to increase mitochondrial activity, OXPHOS, ROS production, and ATP levels to support Treg metabolic demands.
Figure 3.
Sustained IL-2R signaling reprograms Treg energetic metabolism
Periodic IL-2 does not fully support Treg proliferation
Sustained, but not acute IL-2R signaling by mIL-2/CD25 expanded Tregs while engaging a large number of genes for an extended time. We tested whether periodic administration of high dose mIL-2 (50 μg/mouse twice a day), which represents in our hands the maximal tolerable dose, might recapitulate the responses by mIL-2/CD25. At 72 hr post-treatment, mIL-2 substantially expanded the spleen Treg population and increased expression of the proliferation marker Ki-67, but these levels were lower when compared to mice that received a single injection of mIL-2/CD25 (Fig. 4a), but both IL-2R agonists equivalently upregulated CD25. Cluster analysis of DEGs after RNA-seq revealed that periodic mIL-2 and mIL-2/CD25 showed generally similar regulation of gene expression. However, approximately 58% of the genes were less efficiently up- (clusters 2 and 4) or down-regulated by periodic IL-2 (cluster 3 and 5) (Fig. 4b), indicating quantitative differences between these two modes of Treg activation with mIL-2/CD25 being typically more effective. Notably, MYC and PRDM1 (encoded by Blimp1), which promote cell metabolism and effector Treg (eTreg) development, respectively, were among the top 6 upstream transcriptional regulator that were uniquely increased by persistent IL-2R signaling (Fig. 4c).
Figure 4.

Repeated administration of high doses of mIL-2 does not fully recapitulate the response of Tregs to mIL-2/CD25
MYB was previously shown to be an essential transcription regulator for the development of eTregs24. Transcriptome analysis identified 238 DEGs (upregulated ≥1.5-fold) that characterized eTregs and were dependent on MYB for their expression24. 104 of these 238 (43.7 %) DEGs were significantly increased after persistent IL-2R agonism by mIL-2/CD25, but only 17 of these were also significantly increased, usually to a lesser extent, by periodic IL-2R signaling by mIL-2 (Fig. 4d). These mIL-2/CD25 targets include Il10, Prdm1, Ccr5, Icos, and Itgae (CD103), which are well-recognized genes of eTregs. Thus, persistent IL-2R signaling was more effective than periodic IL-2R signaling to support expression of several key genes associated with eTregs, which are highly functional Tregs in tissue sites.
Comparison of canonical pathways showed that oxidative phosphorylation (OXPHOS) was the highest-ranking signaling pathway selectively related to persistent IL-2R signaling by mIL-2/CD25. (Fig. 4e). This finding reflects high (≥2-fold) upregulation of 30 genes associated with the OXPHOS pathway by mIL-2/CD25-dependent persistent, but not periodic IL-2-dependent signaling in Tregs (Fig. 4f). Collectively, only sustained IL-2R signaling for 72 hr by mIL-2/CD25 substantially triggered gene transcription to optimally support eTreg development and proliferation, the latter likely through an increase in metabolism in part by sustained upregulation of MYC.
Persistent IL-2R signaling regulate chromatin accessibility
As RNA expression is dependent upon DNA accessibility, we defined the chromatin landscape of Tregs by ATAC-seq of 3 biological replicates and characterized its intersection with the Treg transcriptome at 0.75 hr, 16 hr, 72 hr and 168 hr post single injection of mIL-2/CD25 or PBS (Fig. 5a and Supplementary Table 3). A progressive increase was noted for changes in chromatin accessibility, as defined by differential accessible regions (DARs) that was most striking at 72 hr and 168 hr. DARs increased over time, where more accessible DARs dominated at 0.75 hr and 16 hr, but less accessible DARs dominated at 72 hr and 168 hr. At 168 hr when Tregs contracted and were no longer responsive to mIL-2/CD25 based on activation of STAT5 (Fig. 1a), the greatest changes in DARs were noted, where less accessible DARs dominated. One important mechanism associated with chromatin compaction is DNA methylation25. Likewise, mIL-2/CD25 upregulated the mRNAs encoding three mediators of this process, the Enhancer of Zeste Homolog 2 (Ezh2), DNA Methylase 1 (Dnmt1), and the Ubiquitin-like PHD and RING finger domain-containing protein 1 (Uhrf1) (Fig. 5b), which likely contribute to less accessible chromatin.
Figure 5.

Chromatin accessibility in Tregs is dynamically regulated by mIL-2/CD25
To better understand and interpret the processes associated with less accessible chromatin and increased gene downregulation, DARs at 72 and 168 hr were organized based on gene ontology (GO) (Extended Data Fig. 9). At 72 hr and 168 hr genes significantly associated with closing peaks (FDR<0.05) include those associated with cell signaling pathways. Thus, in the late phase response to persistent IL-2R signaling, genes in Tregs were silenced to primarily inhibit cell signaling, which may be associated with Treg contraction.
Chromatin accessibility predicts transcription factor activity
The dynamic coordination of chromatin structure and transcription factors by which IL-2R signaling leads to the proliferation of Tregs has not been established. To identify DNA binding transcription factors that connect differential chromatin accessibility and gene expression, we used our ATAC-seq data to perform de novo motif profiling. The most significant overrepresented motif at 0.75 hr and 16 hr was STAT5 (Fig. 5c). Other DARs at the 0.75-hour time point contained the Foxp3 motif. Thus, an early effect of IL-2R signaling in vivo is to reinforce the Foxp3 gene program by chromatin remodeling and this does not require persistent IL-2R signaling, suggesting this may represent an important homeostatic, but not proliferative effect of IL-2R signaling. At 72 hr and 168 hr post-injection, the most overrepresented motif was CTCF, a transcription factor identified by its ability to regulate Myc26 and to establish and maintain chromatin loops that bring enhancer and associated transcription factors in close spatial proximity to target gene promoters27.
Genomic distribution of STAT5 binding sites were mapped to DARs showing the number of DARs containing STAT5 increased with time (Fig. 5d), but the overall representation of STAT5 sites decreased, as the total number of DARs increased with time (Fig. 5e). Indeed, a large fraction of DARs at 0.75 hr and 16 hr (49.6% and 31.3%, respectively) contained STAT5 sites and most (97.0% and 91.5%, respectively) were in more accessible regions (Fig. 5d). In contrast, at 72 hr and 168 hr, the STAT5 sites (55.5% and 63%, respectively) were more often associated with less accessible chromatin, consistent with tempering STAT5-dependent transcription. The more accessible sites initially (0.75 hr and 16 hr) occurred at intronic and intergenic regions while later (72 hr and 168 hr) they were in promoters. Together, these data indicate a temporal binding pattern where IL-2R signaling initially opens chromatin preferentially containing STAT5 binding sites, whereas more persistent IL-2R signaling up to 72 hr favored opening and activity of other transcription factors, dominantly CTCF, that is followed by a genome-wide less accessible chromatin.
IL-2R signaling and and cohesin and PRC2 complexes activities
Locus overlap analysis (LOLA)28 was performed to identify DARs from our ATAC-seq data that have been shown to be bound by proteins using ChIP-seq databases. As anticipated, STAT5 was the most significantly enriched transcription factor associated with our DARs at 0.75 hr and 16 hr (Fig. 6a and Supplementary Table 4), where STAT5 binding to these regions were previously identified in T cells. In contrast, at 72 hr this analysis identified genomic regions reportedly bound by CTCF, the cohesin complex subunits (STAG1, STAG2, SMC19, SMC3, and RAD21) which mediate sister chromatin cohesion after DNA replication29, and JARID2, an accessory subunit of the core PRC2 complex, which regulate gene repression and methylation30,31. Other components of the PRC2 complex (PHF19 and EZH2) were also identified at 168 hr. Binding of these proteins to DNA was previously identified in embryonic/progenitor stem cells, which are highly proliferating cells. The identification of DARs that have previously been found to bind to multiple DNA binding proteins in the cohesin and PRC2 complexes suggests that persistent IL-2R signaling increases chromatin accessibility to support the activities associated with these complexes. This LOLA analysis also identified several DNA-binding factors, i.e. STAT5, RELB, and RELA at 168 hr, which may poise Tregs to respond to IL-2 and TCR signaling (Fig. 6a and Supplementary Table 4). The identification of STAT5 and CTCF by LOLA is consistent with the motif enrichment analysis (Fig. 5c) and further supports the notion that these two proteins regulate gene expression in response to IL-2R-dependent activation of Tregs.
Fig. 6.

ATAC/RNA-seq integration uncovers new mediators induced by a persistent IL-2R signaling leading to Treg proliferation
To further integrate changes in chromatin accessibility from our DARs with gene activity, max ranks of overlap regions from LOLA were associated with transcription factors predicted by IPA to be active based on DEGs (Fig. 6b). The max rank values tend to prioritize biologically relevant associations, with lower values indicative of those most significant32. STAT5 binding to DARs and activity dominated at 0.75 and 16 hr, whereas MED1, FLI1, MYC, and SPI1 genomic enrichments are predicted to have significant transcriptional activities at 72 hr. RUNX1 activities are inhibited both at 72 and 168 hr. Taken together, these results define a temporal order in which mIL-2/CD25-induced transcriptional changes in Treg are initially STAT5-mediated, but persistent IL-2R signaling modulates chromatin accessibility and upregulates other transcriptional drivers that support proliferation.
Chromatin landscape and the Treg response to IL-2R signaling
At 168 hr post-treatment, mIL-2/CD25-dependent pSTAT5 signaling ceased and Tregs numbers contracted toward baseline (Fig. 1a,b), but these Tregs still exhibited substantial chromatin remodeling, where DARs were dominated by less accessible chromatin (Fig. 5a). To determine the consequences of these changes in the Treg chromatin landscape at 168 hr post mIL-2/CD25, we assessed proximal IL-2R signaling and gene expression, after challenging these mice by re-injection with mIL-2/CD25. When examined 1.5 hr later, STAT5 activation was similar when comparing mice that received a single injection or were re-stimulated with mIL-2/CD25 (Fig. 7a), indicating that prior stimulation with mIL-2/CD25 does not desensitize proximal IL-2R signaling. RNA-seq at 1.5 hr post single vs. re-stimulation with mIL-2/CD25 identified a somewhat greater number of DEGs (1.5-fold) associated with single injection (842 DEGs) when compared to repeat injection (702 DEGs) (Fig. 7b). Cluster analysis of these DEGs indicated that the majority (59.0%) were regulated in a coordinated fashion (clusters 1 and 3, upregulated; clusters 6-8, downregulated) although many of these showed quantitative differences in their levels of response. However, the other transcripts were uniquely affected. Some genes were only up- (cluster 5) or down- (cluster 4) regulated after the repeat administration of mIL-2/CD25 while other genes (cluster 2) were upregulated only after a single injection of mIL-2/CD25 (Fig. 7c). This finding suggests that these differences in gene transcription are related to stimulating cells with distinctive chromatin accessibility as identified by ATAC-seq. Of the DEGs similarly upregulated after a single and repeat treatment (cluster 1 and 3) with mIL-2/CD25, several included canonical IL-2-dependent genes (Fig. 7d). Other DEGs that were preferentially upregulated after re-stimulation (cluster 5) include genes involved in Treg activation, co-stimulation, tissue localization, and function (Fig. 7e). Thus, this reencounter with IL-2 supports gene expression associated with eTregs.
Figure 7.

mIL-2/CD25-dependent increase in less accessible chromatin regions does not limit STAT5 activation or IL-2 dependent genes transcription after re-stimulation with mIL-2/CD25
To further study the consequences of the less accessible chromatin at 168 hr, we assessed the extent re-stimulation of Tregs with mIL-2/CD25 supported Treg expansion and CD25 upregulation. When evaluated 72 hr later, Tregs in PBMCs showed CD25 upregulation and expansion after mice received a single injection or two injections of mIL-2/CD25 spaced 168 hr apart. However, lower expansion and Ki67 expression was found for Tregs that were re-stimulated with mIL-2/CD25 (Fig. 7f). Thus, the changes in the chromatin landscape at 168 hr after an initial encounter with mIL-2/CD25 support subsequent Tregs expansion upon re-exposure to an IL2R agonist, albeit one that is somewhat tempered, while favoring gene expression associated with eTregs.
Discussion
This study has defined the sequence of events at the levels of transcription and chromatin remodeling that promote IL-2R-dependent Treg activation, expansion, and subsequent contraction in vivo. Our data favor a model whereby persistent IL-2R signaling initially supports more accessible chromatin and active transcription leading to a metabolic shift toward a more energetic type required for Treg proliferation. Subsequently, as IL-2R signaling diminishes, a shift toward less accessible chromatin occurs that facilitates contraction of the expanded Tregs to restore homeostasis. The lower ratio of chromatin accessibility at the peak of proliferation and after Tregs contracted toward their homeostatic numbers was unexpected. This finding is consistent with a cell intrinsic programming mechanism to limit Treg growth and to alter the responses of surviving cells to a subsequent encounter with IL-2. Such a mechanism is likely fundamental to maintain Treg homeostasis, as these cells are highly sensitive to low amounts of IL-24,5.
An important finding in this study is that persistent IL-2R signaling leads to substantial chromatin remodeling, as assessed by ATAC-seq. Many of the DARs are biologically relevant as some are associated with DEGs, contain STAT5 motifs, and/or have been shown in other studies to bind DNA proteins in other T cells or proliferating cells, such as embryonic stem cells. The peak of the proliferative response at 72 hr was characterized by a large fraction of DARs, with a much greater representation of less accessible sites. At this time, we observed enrichment of genomic sequences of the cohesin complex members and CTCF, consistent with co-localization and functional cooperation of CTCF and cohesin33,34. Binding of CTCF and cohesin to DNA can create a chromatin loop that encompasses the enhancer and promoter to support transcriptional activation. Conversely, if CTCF and cohesin form a chromatin loop that prevents the enhancer from reaching the promoter, gene expression is repressed. This dual role of the CTCF/Cohesin complex may explain some of the gene activation or inhibition at 72 hr post single administration of mIL-2/CD25.
The expansion of Tregs by mIL-2/CD25 at 72 hr is followed by rapid contraction to near baseline at 168 hr. Based on the half-life of mIL-2/CD25 (~16 hr), the dose of mIL-2/CD25 (20 μg per mouse), and past dose-response studies12, mIL-2/CD25 is predicted to be at insufficient amounts after approximately 120-136 hr to induce IL-2R signaling at the dose used. It is not apparent why simply limiting IL-2R signaling leads to rapid contraction of the expanded pool of Tregs. Our findings point to epigenetic reprogramming as a mechanism for peripheral Treg homeostasis, as reflected by the high number of DARs with less accessible sites at 72 hr and 168 hr. Besides potential repressive activity of CTCF/Cohesin complex, we observed upregulation of genes important in DNA methylation at the peak of mIL-2/CD25-dependent proliferation. Based on previous findings35,36, we hypothesize that HELLS may interact with UHRF1 to promote DNA methylation through DNMT1, as all are upregulated by mIL-2/CD25. Another epigenetic regulator that might contribute to generate less accessible chromatin is the PRC2 complex, as the catalytic component EZH2 is upregulated by mIL-2/CD25 and the genomic regions of the subunits JARED2 and PHF19 are enriched. The PRC2 complex is required for JARED2-dependent de novo methylation37. Accordingly, concomitantly with mIL-2/CD25-dependent Treg expansion, an epigenetic program is likely activated to repress gene expression and restore homeostasis to avoid a long-term over-representation of Tregs, which might be immunosuppressive. This scenario resembles antigen-independent programmed contraction associated with CD8+ immune responses38,39,40.
Epigenetic re-programming has often been associated with facilitating transition to a distinct differentiated cell fate, including the plasticity of Tregs with Teff cells41,42. Although less accessible chromatin regions predominated in contracted Tregs 7 days post mIL-2/CD25, many sites were also found within more accessible chromatin. Notably, several mRNAs associated with eTregs, i.e. Il10, Entpd1, Tigit, and Id2, among others, were upregulated and associated with more accessible sites. Accordingly, IL-2R signaling-dependent chromatin remodeling may also reflect a step in the development of these highly functional eTregs. Consistent with this view, past studies have shown that short-lived Klrg-1+ terminally differentiated eTregs arise in and IL-2R-dependent manner after 8-9 cells divisions and express high amounts of IL-10 and Granzyme B. Thus, we speculate that IL-2R-dependent closing of chromatin contributes to the short-life span of many of the expanded Tregs while opening of chromatin of a smaller portion of persistent Tregs promotes a more polarized suppressive phenotype.
Two important points emerge related to IL-2R-dependent Treg-targeted immunotherapy to limit autoimmunity or other unwanted immune responses. First, sustained IL-2R signal through a long-acting IL-2 analog, such as mIL-2/CD25, is much more effective in promoting Treg expansion than recombinant IL-2. Moreover, a much more robust transcriptional profile was noted with mIL-2/CD25 to uniquely support gene expression that promotes oxidative phosphorylation, which is consistent with the increased metabolic activity of Tregs at the peak of their expansion. Second, when compared to basal levels, sustained IL-2R signaling by mIL-2/CD25 leads to a shift to less accessible chromatin that could limit continued transcription and cell signaling to promote Treg homeostasis. This finding raises the possibility that this shift might interfere with sustaining Treg expansion upon repeated administration of IL-2 during low-dose IL-2 therapy. However, many IL-2-dependent genes remained inducible at and following peak proliferation, including critical Treg genes such as Il2ra, Foxp3, Il10, and Myc. This recent contracted pool of Tregs also expanded when re-stimulated with mIL-2/CD25, albeit at somewhat reduced levels when compared to mIL-2/CD25-dependent expansion induced in naive mice. Consistent with this finding, we have noted only a modest attenuation of Treg expansion several weeks after twice-weekly administration of mIL-2/CD25 to NOD mice12, which reduced instances of diabetes in pre-diabetic and hyperglycemic mice. Thus, this decrease in chromatin accessibility does not abrogate, but at best somewhat tempers, a Treg response upon re-initiation of IL-2R signaling.
EXPERIMENTAL MODEL AND SUBJECT DETAILS
Mice
The specific-pathogen free (SPF) C57BL/6J Foxp3RFP mice 43 and congenic CD45.1+ mice (B6.SJL-Ptprca Pepcb/BoyJ; strain 002014, The Jackson laboratory) mice were bred in isolators and housed under SPF conditions with a 12 hour dark/light cycle, 22-25°C , and 50-60 % humidity with water and food provided ad libitum. All experiments were carried out with males mice between 8 to 12 weeks of age. All experiments were approved by the Institutional Animal Care and Use Committee (IACUC) of the University of Miami.
METHOD DETAILS
Time course experiment
For in vivo studies, mIL-2/CD25 (20 μg) or mIL-2 (5 μg) were diluted in PBS and administered by i.p injection. Alternatively, mIL-2 (50 μg) was also i.p administered twice a day for 72 hr. Mice were sacrificed at 1.5; 4; 16; 72; 168 hr (RNA-seq) or 0.75; 16; 72 and 168 hr (ATAC-seq) post injection.
Flow cytometric analysis,
For ex-vivo STAT5 assay, cell suspensions of spleens were immediately prepared in ice-cold HBSS. A 200 μL aliquot was rapidly transferred to a FACS tube and cells were immediately fixed in 1.6% paraformaldehyde in complete media (CM), consisting of RPMI 1640 supplemented with 5% FBS, 100 U/mL penicillin, 100 μg/mL streptomycin, 2 mM L-glutamine, and 0.05 mM β-mercaptoethanol at 37°C for 10 minutes. After centrifugation, cells were permeabilized in 100% methanol, maintained on ice for 30 min, then washed twice in PBS containing 0.5% bovine serum albumin and 0.02% (w/v) sodium azide before incubation for 1 hr at RT with antibodies against phospho-STAT5, selected surface CD4(PE), CD8 (PCP/Cy5.5), CD25 (PE/Cy7), and intracellular Foxp3 (eFluor450) markers. Data were obtained with LSR II (BD Biosciences) and analyzed using BD FACSDiva (version 8.0.2) and FlowJo (version 10.7.1) software.
For surface staining, splenocytes were treated with ACK buffer for 1 min at 37°C to lyse red blood cells. HBSS 1x was added to dilute ACK and stop the reaction. After centrifugation, cell pellet was resuspended in 5 mL of CM. Unfractionated splenocytes (2 million) were incubated with 2.4G2 antibody for 5 min at RT to block binding to Fc receptors, washed with sorter buffer, incubated with antibodies against CD4, CD8, and CD25 for 20 min at 4°C, and washed again. At this time, intracellular staining was performed using the Foxp3/Transcription Factor Staining Buffer Set (eBioscience). Basically, samples after the previous wash were fixed in Perm/Fix buffer for 30 min at 4°, washed twice with Perm/Wash buffer, and antibodies against Foxp3 and Ki-67 diluted in Perm/Wash buffer were added. Samples were incubated for 30 min at 4°C, washed twice with Perm/Wash buffer, and resuspended in 300 μL of sorting buffer.
For sorting of CD4+ T cells, unfractionated splenocytes obtained after ACK treatment were positively selected using CD4 (L3T4) MicroBeads kit (Miltenyi Biotec, USA). Cells were sorted based on expression of CD4 and the Foxp3/Red Fluorescent Protein (RFP) reporter using CD4(FITC) and Foxp3 (eFluor450) antibodies, respectively.
In vitro Treg suppression assay
Responders (CD4+Foxp3−) and suppressors (CD4+Foxp3+) cells were purified from spleen of C57BL/6J-Foxp3RFP mice by cell sorting after CD4+ enrichment with magnetic MicroBeads (Miltenyi Biotec). CD11c+ dendritic cells (DCs) were used as APCs and were also sorted from C57BL/6J-Foxp3RFP mice. Responders (2.5 x 10⁴ cells/well) and Tregs were cultured in a U-bottom 96-well plate with 5 x 10³ DCs and 0.25 μg/mL soluble anti-CD3 antibody (clone 145-2C11). Cells were pulsed with 1 μCi [3H] thymidine per well for the last 4 hours of the 72-hr culture period. Data were collected as mean [3H] thymidine incorporation from duplicate cultures and used to determine the percent suppression in reference to cultures without Tregs.
RNA-seq
All RNA-seq experiments were performed with 3-4 biologically independent mice per experimental condition. FACS-purified Tregs were resuspended in TRIzol (Thermo Fisher Scientific). Separation of the RNA phase was performed according to the manufacturer instructions. RNA was isolated using the RNeasy Micro Kit (Qiagen), according to the manufacturer’s instructions. Quality control analysis, library generation, and RNA-seq were carried out by the Oncogenomics Core Facility at the University of Miami. Quality control analysis of RNA samples was performed using the Bioanalyzer 2100 platform (Agilent Technologies). Libraries were prepared using KAPA’s RNA Hyperprep protocol and sequenced on a 75bp pair-end run using the Illumina NextSeq 500 High Output Kit (150 cycle; 400 M flow cell). Reads from the RNA-seq were mapped to the Mus musculus genome GRCm38 using STAR aligner, version 2.5.044. Raw counts were generated based on the Ensembl genes (GENCODE M13) with featureCounts, version1.5.045. Differentially expressed genes (DEG) were identified using DESeq46 and determined by a threshold of false discovery rate (FDR) ≤ 0.01. For GSEA, input genes were ranked based a composite metric (Log2FC x -log10 p value) and tested against MSigDB hallmark.
DEGs were grouped and heat maps were constructed by hierarchical clustering of DEGs (rows) and indicated treatment conditions (columns). Hierarchical clustering (one minus the Pearson correlation, k-means partition tool) was performed using Morpheus (https://software.broadinstitute.org/morpheus/) with RNA-seq reads filtered to ≥75 reads for at least one sample.
ATAC-seq library generation and sequencing
All ATAC-seq experiments were performed with 3 biologically independent mice per experimental condition. ATAC-seq was performed as previously described47. 50,000 unfixed nuclei were tagged using Tn5 transposase (Nextera DNA sample prep kit; Illumina) for 30 min at 37°C. Libraries were generated using the Ad1_noMX and Ad2.1-24 barcoded primers48 and amplified for 10-12 cycles. Resulting library fragments were purified using a DNA Clean & Concentrator-5 kit (Zymo Research). Size-selection was performed using the Agencourt AMPure XP PCR purification system (Beckman Coulter) to remove large fragments > 1 kb and primers to maintain high library complexity. Libraries qualities were assessed using the Agilent Bioanalyzer High-Sensitivity DNA kit and sequenced on an Illumina NextSeq500 with a read length of 75 bp to a minimum depth of 40 million reads per sample using the NextSeq 500 High-Output Kit (150-Cycle, 400 M Flow Cell).
ATAC-seq sequences processing and motifs analyses
The ATAC-seq data were preprocessed (trimmed, aligned, filtered, and quality controlled) and analyzed using the ENCODE ATAC-seq pipeline (https://www.encodeproject.org/pipelines/ENCPL792NWO/, accessed on 2019-05-26)49. In particular, reads were mapped to the GRCm38 (mm10) mouse reference sequence using bwa-mem50 and MACS (version 2.1.2)51 was used to identify the peak regions. The Irreproducible Discovery Rate (IDR) method52 was used to identify reproducible peaks between two pseudo-replicates that were generated for each sample. Only reproducible peaks (IDR ≤ 0.1) were retained for downstream analyses. Also the ENCODE ATAC-seq pipeline removed peaks overlapping with blacklisted regions (http://mitra.stanford.edu/kundaje/akundaje/release/blacklists/, Oct 2016 version). Next, peaks obtained from samples in the same treatment and at the same time point were merged together. For peaks obtained from different treatment and time conditions, we considered peaks that overlap with each other as a cluster. Next, if the longest peak within the cluster occupied more than 80% of the cluster range, we used the longest peak to represent the cluster. Otherwise, all the peaks within the cluster were retained. After this step, we obtained 197,363 ATAC-seq peaks. Read counts were generated from the quality-filtered bam files for the peak sets using summarizeOverlaps function in R package GenomicAlignments53.. To identify differential chromatin accessibility regions between two conditions, the differential peaks were analyzed and identified with DESeq246. We then performed hierarchical clustering and principal component analysis on count matrix of the peaks to explore the differences in chromatin accessibility between different conditions. Motif enrichment analysis were performed on the significant differential peaks (with peaks from all samples as the background) using the findMotifsGenome.pl script of the HOMER software version 4.10 with default settings54.. To annotate the peaks to chromatin states, we used previous computed 15-states annotations for spleen samples55. To reduce redundancy, we binned redundant states to obtain a 10-states model. To annotate the peaks to genes, we used the goldmine R package56. By default, goldmine considered the region 1 kb upstream and 500 bp downstream from transcription start site (TSS) to be the gene promoter region.
Integrative analyses of chromatin accessibility and gene transcription data
To identify genomic regions from the mIL-2/CD25-induced differentially accessible regions (query) in spleen Treg at 0.75, 16, 72, and 168 hr after single injection that overlap with each region set in a compendium of publicly available region sets (database), Locus amplification analysis software (LOLA) as well as its composited database (ver 1.12.0) was used28. All peaks discovered by ATACseq were used as the contrast background while the differential peaks in each comparison were selected with an FDR rate less than 0.05 for LOLA input. The LOLA bundle combination databases are composed of Codex database (https://academic.oup.com/nar/article/43/D1/D1117/2439489), Cistrome database (https://genomebiology.biomedcentral.com/articles/10.1186/gb-2011-12-8-r83), and Encode TFBS (https://www.cell.com/cell-reports/pdf/S2211-1247(20)31014-7.pdf) database. LOLA evaluated overlaps by comparing the query region set to each database region set and calculated the number of overlapping regions for each pairwise comparison. Next, LOLA used the number of overlaps and non-overlaps to build a contingency table, and a Fisher's exact test was used to assess the significance of the overlap. Then, LOLA ranked each database region set and provided a ranked summary of the top database sets. The resulting rank score for each region set is then computed by assigning it the worst (max) rank among three measures: P-value, log odds ratio and number of overlapping regions.
Relation between differentially expressed genes
The web tool Venny 2.157 was used to show relations between differentially expressed genes
Pathway analysis
Gene lists containing gene identifiers, log2fold changes and corresponding p-adjusted values (FDR) were uploaded to and analyzed through the use of Ingenuity Pathway Analysis (IPA). Cutoffs at fold change ≥ [1.5] and FDR ≤ 0.01 were set to identify significantly differentially expressed genes (DEGs) at each experimental time. The following IPA tools were used to analyze DEGs: 1) Canonical pathways; 2) Upstream regulators (transcription factors only); and 3) Networks. In addition, IPA allows comparing results from longitudinal experiments to identify similarities, differences, and trends. We used this function to compare canonical pathways and transcription factors modulated across all time points. Overall, there were two statistical measures to consider: 1) the overlap p-value that measures statistically significant overlap between the dataset genes and genes that are regulated by a transcription factor, it is calculated using Fisher’s Exact Test, and significance is generally attributed to p-values ≤ 0.05; 2) activation z-scores to infer the activation states of transcriptional factors avoiding skews in gene regulation as well as regulation of edges towards a particular direction58.
In addition, DEGs were used for pathway analysis performed on significantly over-represented genes using Enrichr and most significant groups are represented according to the Kyoto Encyclopedia of Genes and Genomes (KEGG) pathway library or Gene Ontology (GO) molecular function14.
Metabolism Assays (Seahorse)
C57BL/6J-Foxp3RFP-reporter mice were injected with PBS (control) or mIL-2/CD25 (20 μg) (n=3 biologically independent mice/group) and splenic Tregs were sorted 72 hr later. Oxygen consumption rates (OCR) and extracellular acidification rates (ECAR) of freshly sorted Tregs plated at 2x10⁵ cells/well using Cell-Tak (Corning) were measured under basal conditions and in response to 2 μM of the mitochondrial inhibitor oligomycin, 8 μM of the mitochondrial uncoupler FCCP, and 2 μM of the respiratory chain inhibitor antimycin A/rotenone with the Agilent Seahorse XFp Extracellular Flux Analyzer (Agilent). Data was analyzed with the software Wave (Agilent, version 2.6.0.31). Total ATP and ATP fractions that are produced from mitochondrial oxidative phosphorylation or glycolysis were measured using the Agilent Seahorse XFp Real-Time ATP Rate Assay kit (Agilent)59.
Reactive oxygen species detection
For oxidative stress detection, unfractionated splenocytes were plated in CM at a density of 2 × 10⁶/mL. The CellROX Deep Red Oxidative Stress Reagent (ThermoFisher) diluted in DMSO was added to cells at a final concentration of 500 nM and incubated for 1 h at 37°C. Cells were then surface stained with FITC anti-CD4 (GK1.5), suspended in 1mL of HBSS with 3% FBS and 0.1% (w/v) sodium azide, and stained with SYTOX Blue Dead Cell Stain for flow cytometry (ThermoFisher) according to the manufacturer’s instructions to exclude nonviable cells from analysis. Relative MFI was calculated by dividing each individual MFI value by the mean MFI of control PBS samples.
Statistical analysis and reproducibility
A two-tailed unpaired or paired Student’s t-test were used for comparison between two groups. For multiple comparisons, one-way ANOVA was performed. Data were analyzed using GraphPad Prism (version 8.4.3 for Windows, GraphPad Software, USA). Statistical tests used for bioinformatics analysis were described in legends of figures. To compare the temporal changes in gene expression levels of mIL-2/CD25 and mIL-2 samples at different time points, we computed Spearman correlations between estimated effect sizes (log2fold changes) for differential expressions of mIL-2/CD25 and mIL-2 samples (when compared to PBS samples). To limit variability all biological independent samples for RNA- and ATAC-seq were processed the same day for each time point. These same samples were analyzed in parallel for various parameters as shown in figures. The effects of IL-2 and mIL-2/CD25 were consistent with previous published findings
Extended Data
Extended data Fig. 1.

Sustained pSTAT5 activation of Treg by single injection of mIL-2/CD25 but not of mIL-2. Unfractionated splenocytes from mice (n=3/group) were injected with mIL-2/CD25, mIL-2 or control PBS and stained with indicated antibodies. (a) Representative flow cytometry plots showing gating for Treg and (b) expression of pSTAT5+ of Tregs at each experimental condition.
Extended data Fig. 2.

Representative FACS gating strategy for sorted Treg at 72 hr post single injection of mIL-2/CD25. CD4+ T cells from the spleen of CD4+Foxp3+-RFP+ reporter mice were enriched with anti-CD4 magnetic beads and stained with FITC -anti-CD4 antibody. RFP+ Treg were sorted as shown. Treg purity was typically greater than 98%.
Extended data Fig. 3.

Expression of DEGs (FDR<0.01) at 4 hr after single injection of PBS, mIL2, or mIL2/CD25 using the same RNAseq data set as (Fig. 1d). Heat map of K-means clustering of 789 differentially expressed genes in response to single injection or re-stimulation with mIL-2/CD25 versus control PBS. Clustering was done using Morpheus software (clustering type: K-means clustering, distance metric: 1-Pearson correlation). The colors in the map display the relative values within indicated experimental conditions. Blue indicates the lowest expression, white indicates intermediate expression, and red indicates the highest expression. Genes were grouped into three clusters on the basis of the expression similarity.
Extended data Fig. 4.

(a) Significant upstream regulators (p value of overlap <0.05; −2 ≤ z-score ≥2) at 1.5 hr post injection of mIL-2/CD25. The horizontal bars denote the different regulators based on the activation z-score. Red color indicates activation, while blue color indicates inhibition. (b) Top gene network related to ‘Cellular Development, Cellular Growth and Proliferation, Lymphoid Tissue Structure and Development’ in Tregs 1.5 hrs post injection. TCR and STAT5 were identified as key hubs.
Extended data Fig. 5.

Significant modulated canonical pathways predicted by GSEA (a) or Ingenuity Pathway Analysis (IPA) (b) post single injection of mIL-2/CD25. Cutoffs: GSEA FDR<0.25; IPA p<0.05; z-score of activation (orange: active ≥2; blue: inhibited ≤ −2). NES: normalized enrichment score.
Extended data Fig. 6.

Significant modulated upstream regulators predicted by IPA at each time post single administration of mIL-2/CD25. p<0.05; z-score of activation (orange: active ≥2; blue: inhibited ≤−2)
Extended data Fig. 7.

(a) Western blot and (b) normalized (MYC/β-Actin) expression after densitometry analysis (n=3) showing that MYC protein in Treg was significatively increased at 2 hr and persisted for up to 48 hr post single injection of mIL-2/CD25. Protein extracts were obtained from FACS-sorted CD4+Foxp3+ Tregs (>95% Foxp3+) isolated from C57BL/6J-Foxp3+RFP mice at the indicated times after PBS, or mIL-2/CD25 (20 μg) injection. Expression levels of MYC and β-actin were analyzed by Western blotting with anti–MYC (10828-1-AP), or anti-β Actin (20536-1-AP) and revealed with a goat anti-rabbit polyclonal (G-21234). (b) One-way ANOVA with Tukey's multiple comparisons test, ****p<0.0001; ***p=0.0002; n.s p=0.1131. (c) RNA-seq time course expression of Myc or Slc7a5 in response to mIL-2/CD25. Data shown in (a) is from one representative gel where lanes were spliced to move relevant data neighboring to each other.
Extended data Fig. 8.

Sustained IL-2R signaling reprograms Treg energetic metabolism. (a) Overlap between DEGs upregulated by mIL-2/CD25 at 72 hr post single injection (FDR<0.01; fold change ≥ 1.5 X) and a set of mouse mitochondrial genes from the database Mitocarta 3.0. (b) Significant (upregulated, red; down-regulated, green) DEGs in the oxidative phosphorylation (OXPHOS) pathway in response to single injection of mIL-2/CD25 shown as components within each electron transport chain complex.
Extended data Fig. 9.

Enrichment analysis was performed on significantly over-represented genes and ten most significant groups are represented according to GO molecular function. Reference dotted lines indicate p<0.05 fold change cutoff.
Supplementary Material
Supplementary Table 1 Significant Differentially Expressed Genes from RNA-seq
Supplementary Table 2 Gene Set Enrichment Analysis results
Supplementary Table 3 Significant Differentially Accessible Regions from ATAC-seq
Supplementary Table 4 Locus Overlap Analysis results
Acknowledgements
We thank Alicia Santos Savio for technical assistance. Jay Enten, Patricia Guevara, Shannon Saigh and Natasha Ward from the Flow Cytometry Core and Marissa Brooks, Yoslayma Cardentey and Jenny Kemper from the Oncogenomics Core of the Sylvester Comprehensive Cancer Center (supported by NIH P30CA240139); and Mary Struthers and Francisco Ramirez-Valle at Bristol Myers Squibb and Alejandro Villarino at the University of Miami for critically reading the manuscript. This research was supported by funding to T.R.M. from Bristol Myers Squibb and the NIH (R01AI148675).
Footnotes
Competing interests
The University of Miami and T.R.M have patents pending on IL-2/CD25 fusion proteins (WO2016022671A1) and their use (PCT/US20/13152) that have been licensed exclusively to Bristol Myers Squibb, and this research has been supported in part by a collaboration and sponsored research and licensing agreement with Bristol Myers Squibb. The other authors have no financial conflicts of interest.
Reporting Summary.
Further information on research design is available in the Nature Research Reporting Summary linked to this article.
DATA AVAILABILITY
Gene Expression Omnibus: RNA-seq data have been deposited under accession code GSE163946; ATAC-seq data is available under accession code: GSE162030. Other data will be made available upon reasonable request.
References
- 1.Buszko M & Shevach EM Control of regulatory T cell homeostasis. Curr Opin Immunol 67, 18–26 (2020). [DOI] [PubMed] [Google Scholar]
- 2.Abbas AK, Trotta E, D RS, Marson A & Bluestone JA Revisiting IL-2: Biology and therapeutic prospects. Sci Immunol 3 (2018). [DOI] [PubMed] [Google Scholar]
- 3.Sharabi A et al. Regulatory T cells in the treatment of disease. Nat Rev Drug Discov 17, 823–844 (2018). [DOI] [PubMed] [Google Scholar]
- 4.Yu A, Zhu L, Altman NH & Malek TR A low interleukin-2 receptor signaling threshold supports the development and homeostasis of T regulatory cells. Immunity 30, 204–217 (2009). [DOI] [PMC free article] [PubMed] [Google Scholar]
- 5.Yu A et al. Selective IL-2 responsiveness of regulatory T cells through multiple intrinsic mechanisms supports the use of low-dose IL-2 therapy in type 1 diabetes. Diabetes 64, 2172–2183 (2015). [DOI] [PubMed] [Google Scholar]
- 6.Donohue JH & Rosenberg SA The fate of interleukin-2 after in vivo administration. J Immunol 130, 2203–2208 (1983). [PubMed] [Google Scholar]
- 7.Pol JG, Caudana P, Paillet J, Piaggio E & Kroemer G Effects of interleukin-2 in immunostimulation and immunosuppression. J Exp Med 217 (2020). [DOI] [PMC free article] [PubMed] [Google Scholar]
- 8.Ward NC et al. IL-2/CD25: A Long-Acting Fusion Protein That Promotes Immune Tolerance by Selectively Targeting the IL-2 Receptor on Regulatory T Cells. J Immunol 201, 2579–2592 (2018). [DOI] [PMC free article] [PubMed] [Google Scholar]
- 9.Chorro L et al. Interleukin 2 modulates thymic-derived regulatory T cell epigenetic landscape. Nat Commun 9, 5368 (2018). [DOI] [PMC free article] [PubMed] [Google Scholar]
- 10.Fontenot JD, Rasmussen JP, Gavin MA & Rudensky AY A function for interleukin 2 in Foxp3-expressing regulatory T cells. Nat Immunol 6, 1142–1151 (2005). [DOI] [PubMed] [Google Scholar]
- 11.Toomer KH et al. Essential and non-overlapping IL-2Ralpha-dependent processes for thymic development and peripheral homeostasis of regulatory T cells. Nat Commun 10, 1037 (2019). [DOI] [PMC free article] [PubMed] [Google Scholar]
- 12.Ward NC et al. Persistent IL-2 Receptor Signaling by IL-2/CD25 Fusion Protein Controls Diabetes in NOD Mice by Multiple Mechanisms. Diabetes 69, 2400–2413 (2020). [DOI] [PMC free article] [PubMed] [Google Scholar]
- 13.Grasshoff H et al. Low-Dose IL-2 Therapy in Autoimmune and Rheumatic Diseases. Front Immunol 12, 648408 (2021). [DOI] [PMC free article] [PubMed] [Google Scholar]
- 14.Chen EY et al. Enrichr: interactive and collaborative HTML5 gene list enrichment analysis tool. BMC Bioinformatics 14, 128 (2013). [DOI] [PMC free article] [PubMed] [Google Scholar]
- 15.Gregory MA, Qi Y & Hann SR Phosphorylation by glycogen synthase kinase-3 controls c-myc proteolysis and subnuclear localization. J Biol Chem 278, 51606–51612 (2003). [DOI] [PubMed] [Google Scholar]
- 16.Loftus RM et al. Amino acid-dependent cMyc expression is essential for NK cell metabolic and functional responses in mice. Nat Commun 9, 2341 (2018). [DOI] [PMC free article] [PubMed] [Google Scholar]
- 17.Oh H et al. An NF-kappaB Transcription-Factor-Dependent Lineage-Specific Transcriptional Program Promotes Regulatory T Cell Identity and Function. Immunity 47, 450–465 e455 (2017). [DOI] [PMC free article] [PubMed] [Google Scholar]
- 18.Rovira-Clave X, Angulo-Ibanez M, Tournier C, Reina M & Espel E Dual role of ERK5 in the regulation of T cell receptor expression at the T cell surface. J Leukoc Biol 99, 143–152 (2016). [DOI] [PubMed] [Google Scholar]
- 19.Geiman TM & Muegge K Lsh, an SNF2/helicase family member, is required for proliferation of mature T lymphocytes. Proc Natl Acad Sci U S A 97, 4772–4777 (2000). [DOI] [PMC free article] [PubMed] [Google Scholar]
- 20.Tameni A et al. The DNA-helicase HELLS drives ALK(−) ALCL proliferation by the transcriptional control of a cytokinesis-related program. Cell Death Dis 12, 130 (2021). [DOI] [PMC free article] [PubMed] [Google Scholar]
- 21.Nevins JR The Rb/E2F pathway and cancer. Hum Mol Genet 10, 699–703 (2001). [DOI] [PubMed] [Google Scholar]
- 22.Saravia J et al. Homeostasis and transitional activation of regulatory T cells require c-Myc. Sci Adv 6, eaaw6443 (2020). [DOI] [PMC free article] [PubMed] [Google Scholar]
- 23.Rath S et al. MitoCarta3.0: an updated mitochondrial proteome now with sub-organelle localization and pathway annotations. Nucleic Acids Res 49, D1541–D1547 (2021). [DOI] [PMC free article] [PubMed] [Google Scholar]
- 24.Dias S et al. Effector Regulatory T Cell Differentiation and Immune Homeostasis Depend on the Transcription Factor Myb. Immunity 46, 78–91 (2017). [DOI] [PubMed] [Google Scholar]
- 25.Choy JS et al. DNA methylation increases nucleosome compaction and rigidity. J Am Chem Soc 132, 1782–1783 (2010). [DOI] [PMC free article] [PubMed] [Google Scholar]
- 26.Lobanenkov VV et al. A novel sequence-specific DNA binding protein which interacts with three regularly spaced direct repeats of the CCCTC-motif in the 5'-flanking sequence of the chicken c-myc gene. Oncogene 5, 1743–1753 (1990). [PubMed] [Google Scholar]
- 27.Nora EP et al. Molecular basis of CTCF binding polarity in genome folding. Nat Commun 11, 5612 (2020). [DOI] [PMC free article] [PubMed] [Google Scholar]
- 28.Nagraj VP, Magee NE & Sheffield NC LOLAweb: a containerized web server for interactive genomic locus overlap enrichment analysis. Nucleic Acids Res 46, W194–W199 (2018). [DOI] [PMC free article] [PubMed] [Google Scholar]
- 29.Nasmyth K & Haering CH Cohesin: its roles and mechanisms. Annu Rev Genet 43, 525–558 (2009). [DOI] [PubMed] [Google Scholar]
- 30.Margueron R & Reinberg D The Polycomb complex PRC2 and its mark in life. Nature 469, 343–349 (2011). [DOI] [PMC free article] [PubMed] [Google Scholar]
- 31.Pasini D et al. JARID2 regulates binding of the Polycomb repressive complex 2 to target genes in ES cells. Nature 464, 306–310 (2010). [DOI] [PubMed] [Google Scholar]
- 32.Assenov Y et al. Comprehensive analysis of DNA methylation data with RnBeads. Nat Methods 11, 1138–1140 (2014). [DOI] [PMC free article] [PubMed] [Google Scholar]
- 33.Parelho V et al. Cohesins functionally associate with CTCF on mammalian chromosome arms. Cell 132, 422–433 (2008). [DOI] [PubMed] [Google Scholar]
- 34.Wendt KS & Peters JM How cohesin and CTCF cooperate in regulating gene expression. Chromosome Res 17, 201–214 (2009). [DOI] [PubMed] [Google Scholar]
- 35.Bronner C, Alhosin M, Hamiche A & Mousli M Coordinated Dialogue between UHRF1 and DNMT1 to Ensure Faithful Inheritance of Methylated DNA Patterns. Genes (Basel) 10 (2019). [DOI] [PMC free article] [PubMed] [Google Scholar]
- 36.Han M et al. A role for LSH in facilitating DNA methylation by DNMT1 through enhancing UHRF1 chromatin association. Nucleic Acids Res 48, 12116–12134 (2020). [DOI] [PMC free article] [PubMed] [Google Scholar]
- 37.Petracovici A & Bonasio R Distinct PRC2 subunits regulate maintenance and establishment of Polycomb repression during differentiation. Mol Cell 81, 2625–2639 e2625 (2021). [DOI] [PMC free article] [PubMed] [Google Scholar]
- 38.Haring JS, Badovinac VP & Harty JT Inflaming the CD8+ T cell response. Immunity 25, 19–29 (2006). [DOI] [PubMed] [Google Scholar]
- 39.Prlic M & Bevan MJ Exploring regulatory mechanisms of CD8+ T cell contraction. Proc Natl Acad Sci U S A 105, 16689–16694 (2008). [DOI] [PMC free article] [PubMed] [Google Scholar]
- 40.Martin MD & Badovinac VP Antigen-dependent and -independent contributions to primary memory CD8 T cell activation and protection following infection. Sci Rep 5, 18022 (2015). [DOI] [PMC free article] [PubMed] [Google Scholar]
- 41.Sakaguchi S, Vignali DA, Rudensky AY, Niec RE & Waldmann H The plasticity and stability of regulatory T cells. Nat Rev Immunol 13, 461–467 (2013). [DOI] [PubMed] [Google Scholar]
- 42.Geginat J et al. Plasticity of human CD4 T cell subsets. Front Immunol 5, 630 (2014). [DOI] [PMC free article] [PubMed] [Google Scholar]
- 43.Wan YY & Flavell RA Regulatory T-cell functions are subverted and converted owing to attenuated Foxp3 expression. Nature 445, 766–770 (2007). [DOI] [PubMed] [Google Scholar]
- 44.Dobin A et al. STAR: ultrafast universal RNA-seq aligner. Bioinformatics 29, 15–21 (2013). [DOI] [PMC free article] [PubMed] [Google Scholar]
- 45.Liao Y, Smyth GK & Shi W featureCounts: an efficient general purpose program for assigning sequence reads to genomic features. Bioinformatics 30, 923–930 (2014). [DOI] [PubMed] [Google Scholar]
- 46.Love MI, Huber W & Anders S Moderated estimation of fold change and dispersion for RNA-seq data with DESeq2. Genome Biol 15, 550 (2014). [DOI] [PMC free article] [PubMed] [Google Scholar]
- 47.Buenrostro JD, Wu B, Chang HY & Greenleaf WJ ATAC-seq: A Method for Assaying Chromatin Accessibility Genome-Wide. Curr Protoc Mol Biol 109, 21 29 21–21 29 29 (2015). [DOI] [PMC free article] [PubMed] [Google Scholar]
- 48.Buenrostro JD, Giresi PG, Zaba LC, Chang HY & Greenleaf WJ Transposition of native chromatin for fast and sensitive epigenomic profiling of open chromatin, DNA-binding proteins and nucleosome position. Nat Methods 10, 1213–1218 (2013). [DOI] [PMC free article] [PubMed] [Google Scholar]
- 49.Stowers RS et al. Matrix stiffness induces a tumorigenic phenotype in mammary epithelium through changes in chromatin accessibility. Nat Biomed Eng 3, 1009–1019 (2019). [DOI] [PMC free article] [PubMed] [Google Scholar]
- 50.Li H & Durbin R Fast and accurate short read alignment with Burrows-Wheeler transform. Bioinformatics 25, 1754–1760 (2009). [DOI] [PMC free article] [PubMed] [Google Scholar]
- 51.Zhang Y et al. Model-based analysis of ChIP-Seq (MACS). Genome Biol 9, R137 (2008). [DOI] [PMC free article] [PubMed] [Google Scholar]
- 52.Li QH, Brown JB, Huang HY & Bickel PJ Measuring Reproducibility of High-Throughput Experiments. Ann Appl Stat 5, 1752–1779 (2011). [Google Scholar]
- 53.Lawrence M et al. Software for computing and annotating genomic ranges. PLoS Comput Biol 9, e1003118 (2013). [DOI] [PMC free article] [PubMed] [Google Scholar]
- 54.Heinz S et al. Simple combinations of lineage-determining transcription factors prime cis-regulatory elements required for macrophage and B cell identities. Mol Cell 38, 576–589 (2010). [DOI] [PMC free article] [PubMed] [Google Scholar]
- 55.Ernst J & Kellis M ChromHMM: automating chromatin-state discovery and characterization. Nat Methods 9, 215–216 (2012). [DOI] [PMC free article] [PubMed] [Google Scholar]
- 56.Bhasin JM & Ting AH Goldmine integrates information placing genomic ranges into meaningful biological contexts. Nucleic Acids Res 44, 5550–5556 (2016). [DOI] [PMC free article] [PubMed] [Google Scholar]
- 57.Oliveros JC Venny. An interactive tool for comparing lists with Venn's diagrams. . 2007-2015 [cited 2021]Available from: https://bioinfogp.cnb.csic.es/tools/venny/index.html [Google Scholar]
- 58.Kramer A, Green J, Pollard J Jr. & Tugendreich S Causal analysis approaches in Ingenuity Pathway Analysis. Bioinformatics 30, 523–530 (2014). [DOI] [PMC free article] [PubMed] [Google Scholar]
- 59.Mookerjee SA, Gerencser AA, Nicholls DG & Brand MD Quantifying intracellular rates of glycolytic and oxidative ATP production and consumption using extracellular flux measurements. J Biol Chem 293, 12649–12652 (2018). [DOI] [PMC free article] [PubMed] [Google Scholar]
Associated Data
This section collects any data citations, data availability statements, or supplementary materials included in this article.
Supplementary Materials
Supplementary Table 1 Significant Differentially Expressed Genes from RNA-seq
Supplementary Table 2 Gene Set Enrichment Analysis results
Supplementary Table 3 Significant Differentially Accessible Regions from ATAC-seq
Supplementary Table 4 Locus Overlap Analysis results
Data Availability Statement
Gene Expression Omnibus: RNA-seq data have been deposited under accession code GSE163946; ATAC-seq data is available under accession code: GSE162030. Other data will be made available upon reasonable request.