

Abstract
Type I innate lymphoid cells (ILC1) are critical regulators of inflammation and immunity in mammalian tissues. However, their function in cancer is mostly undefined. Here we show that a high density of ILC1s induces leukemia stem cell (LSC) apoptosis in mice. At a lower density, ILC1s prevent LSCs from differentiating into leukemia progenitors and promote their differentiation into non-leukemic cells, thus blocking the production of terminal myeloid blasts. All of these effects, which require ILC1s to produce interferon-γ after cell–cell contact with LSCs, converge to suppress leukemogenesis in vivo. Conversely, the anti-leukemia potential of ILC1s wanes when JAK-STAT or PI3K-AKT signaling is inhibited. The relevant anti-leukemic properties of ILC1s are also functional in healthy people and impaired in patients with acute myeloid leukemia (AML). Collectively, these findings identify ILC1s as anti-cancer immune cells that might be suitable for AML immunotherapy, and provide a potential strategy to treat AML and prevent relapse of the disease.
Main
Allogeneic hematopoietic stem cell transplantation (HSCT) cures a small fraction of patients with acute myeloid leukemia (AML), but the vast majority of other patients relapse largely due to the persistence of leukemia stem cells (LSCs) that accumulate a multitude of mutations1, 2.
How immune cells interact with LSCs to prevent AML relapse is largely unknown. Identifying and exploiting the underlying mechanisms is an unmet medical need. Innate lymphoid cells (ILCs), a heterogeneous population of non-B and non-T lymphocytes that originates from the common lymphoid progenitor. ILCs are classified into three groups: (i) group 1 ILCs, comprised of natural killer (NK) cells and type I innate lymphoid cells (ILC1), (ii) group 2 ILCs (ILC2), and (iii) group 3 ILCs (ILC3)3. Different from ILC2s and ILC3s, ILC1s usually reside in the liver, where they produce interferon-(IFN)-γ, granulocyte macrophage-colony stimulating factor (GM-CSF), tumor necrosis factor (TNF), TNF-related apoptosis-inducing ligand, etc. ILC2s and ILC3s play key roles in antiviral and antimicrobial immune responses, tumor surveillance, and tumorigenesis, while ILC1s appear to have diverse functions, including promoting host defense against infection/microbiota, regulating tissue inflammation, and protecting against acute tissue damage4, 5, 6, 7, 8, 9, 10. The roles of ILC1s in cancer remain unclear, and no available studies have examined the interaction of ILC1s and cancer stem-like cells.
To address this, we conducted a series of functional and mechanistic in vitro and in vivo studies. We demonstrated that ILC1s isolated from healthy mice or humans (healthy ILC1) induced LSC apoptosis. Further, these ILC1s target LSCs to suppress leukemogenesis by preventing their differentiation into leukemia progenitors, thus blocking their differentiation into terminal myeloid blasts. These effects occurred via the production of IFN-γ by ILC1s. Moreover, ILC1s produced more IFN-γ than NK cells through the receptors DNAM-1 and IL-7R interacting with LSCs. Because these functions are impaired in AML, ILC1s can no longer effectively target LSCs, which can then differentiate into terminal myeloid blasts. Collectively, we define an essential protective role for ILC1s in AML: inducing apoptosis and targeting differentiation of LSCs.
Results
Healthy ILC1s induce apoptosis of AML LSCs in vitro by secreting IFN-γ
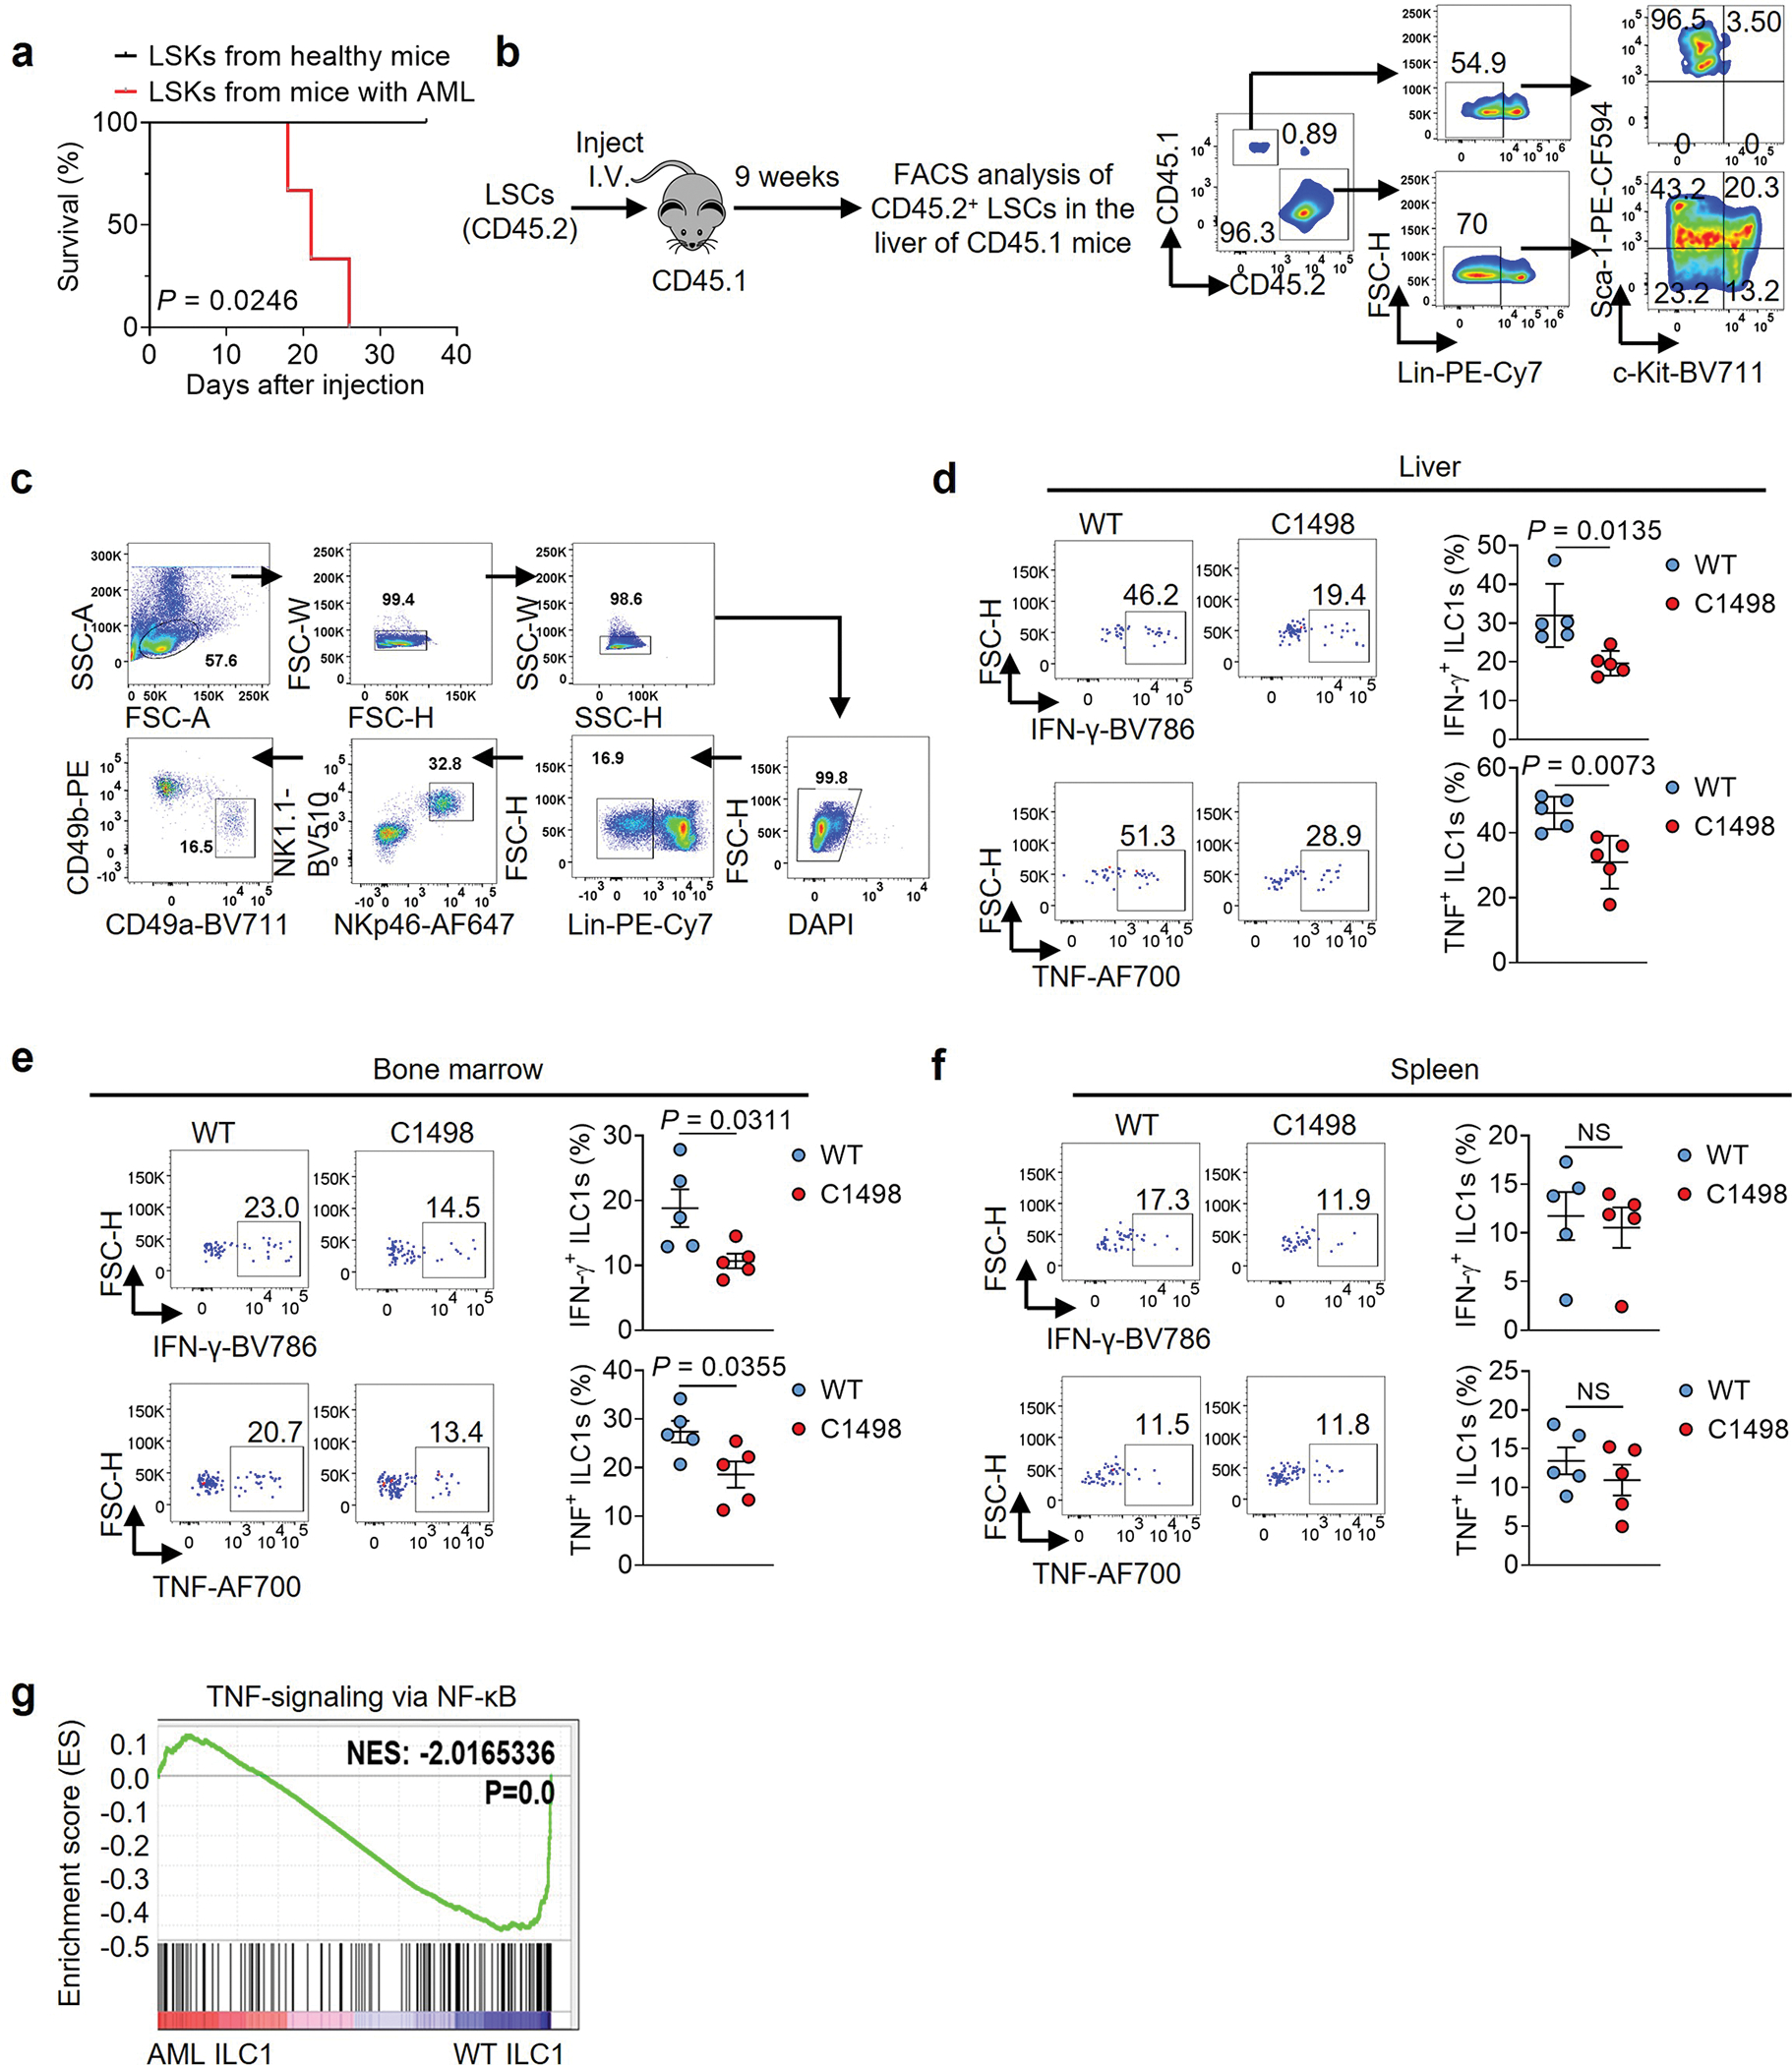
LSCs and normal hematopoietic stem cells (Lin−Sca-1+c-Kit+, or LSK) cannot be phenotypically distinguished in mice. Both are found mainly in bone marrow (BM) and spleen in AML11, while ILC1s reside in the liver. We isolated normal LSKs from the liver of healthy mice and LSCs from the liver of MllPTD/WT: Flt3ITD/ITD mice with AML12 for injection into immunodeficient Rag2−/−γc−/− mice. Mice injected with LSKs isolated from the liver of healthy mice lived, while all mice injected with LSKs from the liver of mice with AML died of AML, suggesting that LSCs are present in the liver of mice with AML (Extend Data Fig. 1a). This was validated by using a transplantable mouse LSCs model in which CD45.1 mice were injected with LSCs (CD45.2+ cells) isolated from the spleen of MllPTD/WT: Flt3ITD/ITD mice with AML (Extended data Fig. 1b). CD45.2+ LSCs trafficked into the liver of CD45.1 mice (~20% of total Lin− cells) nine weeks after adoptive transfer (Extended data Fig. 1b), consistent with a previous report13.
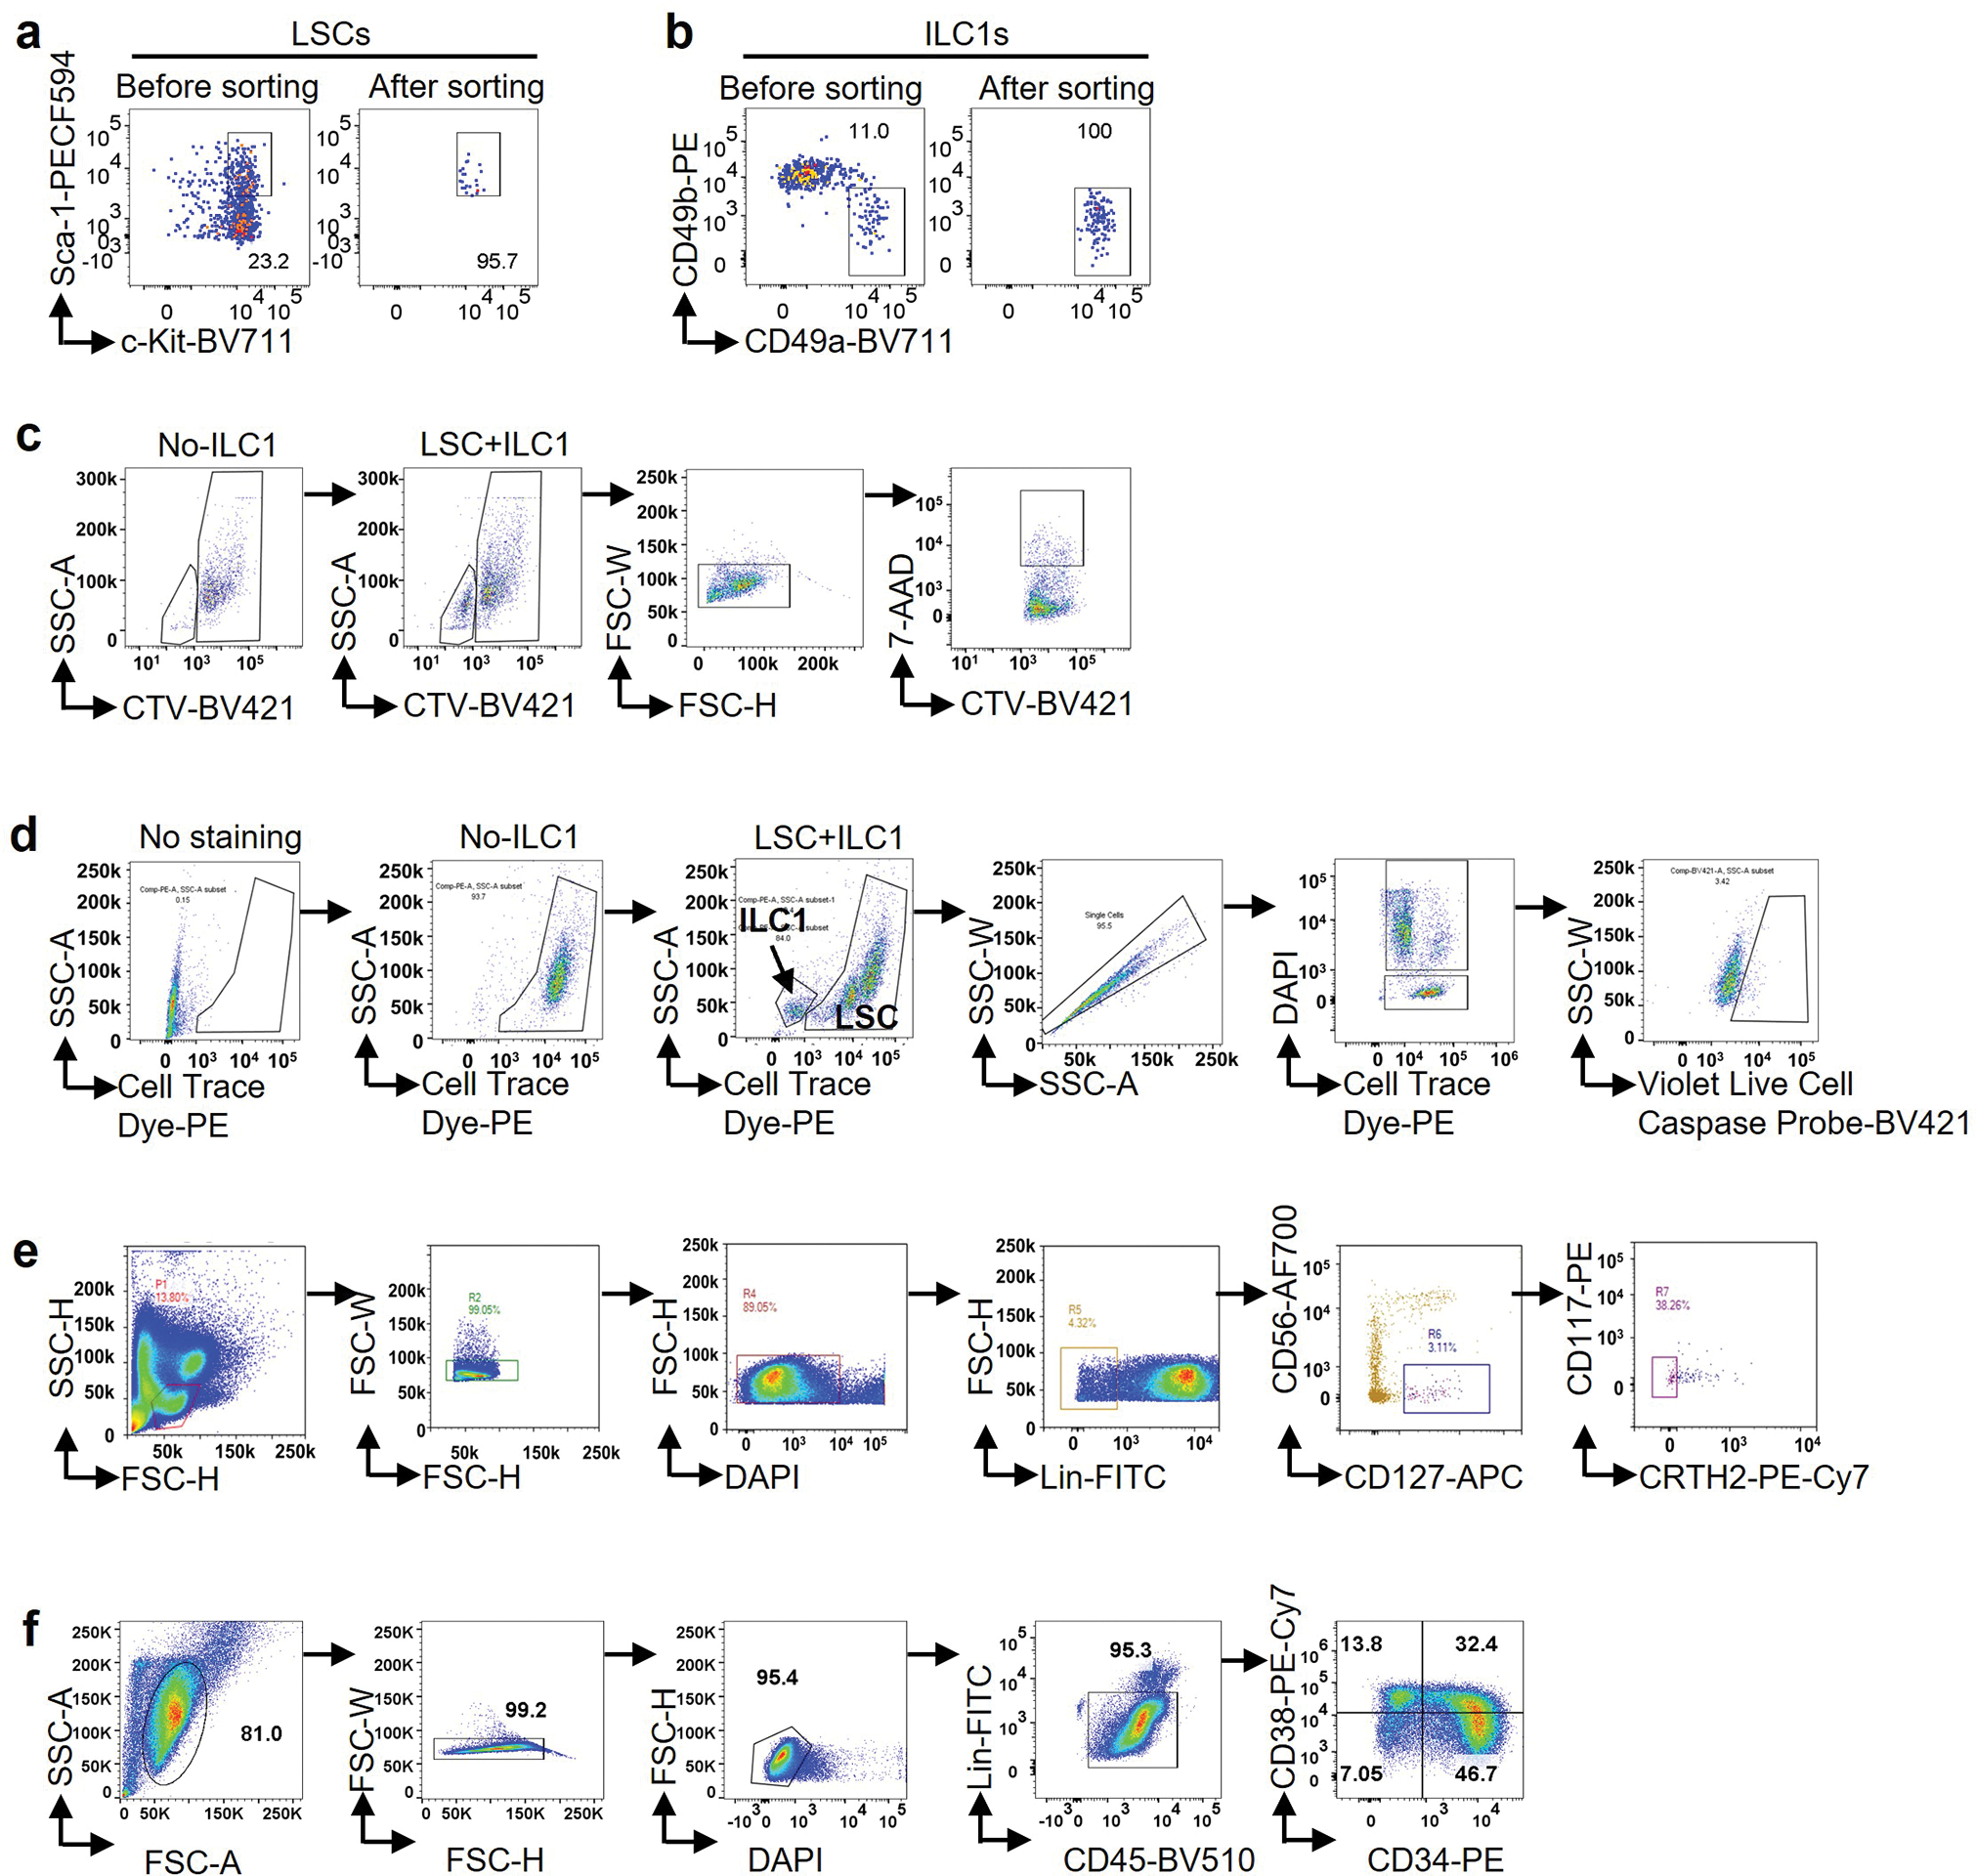
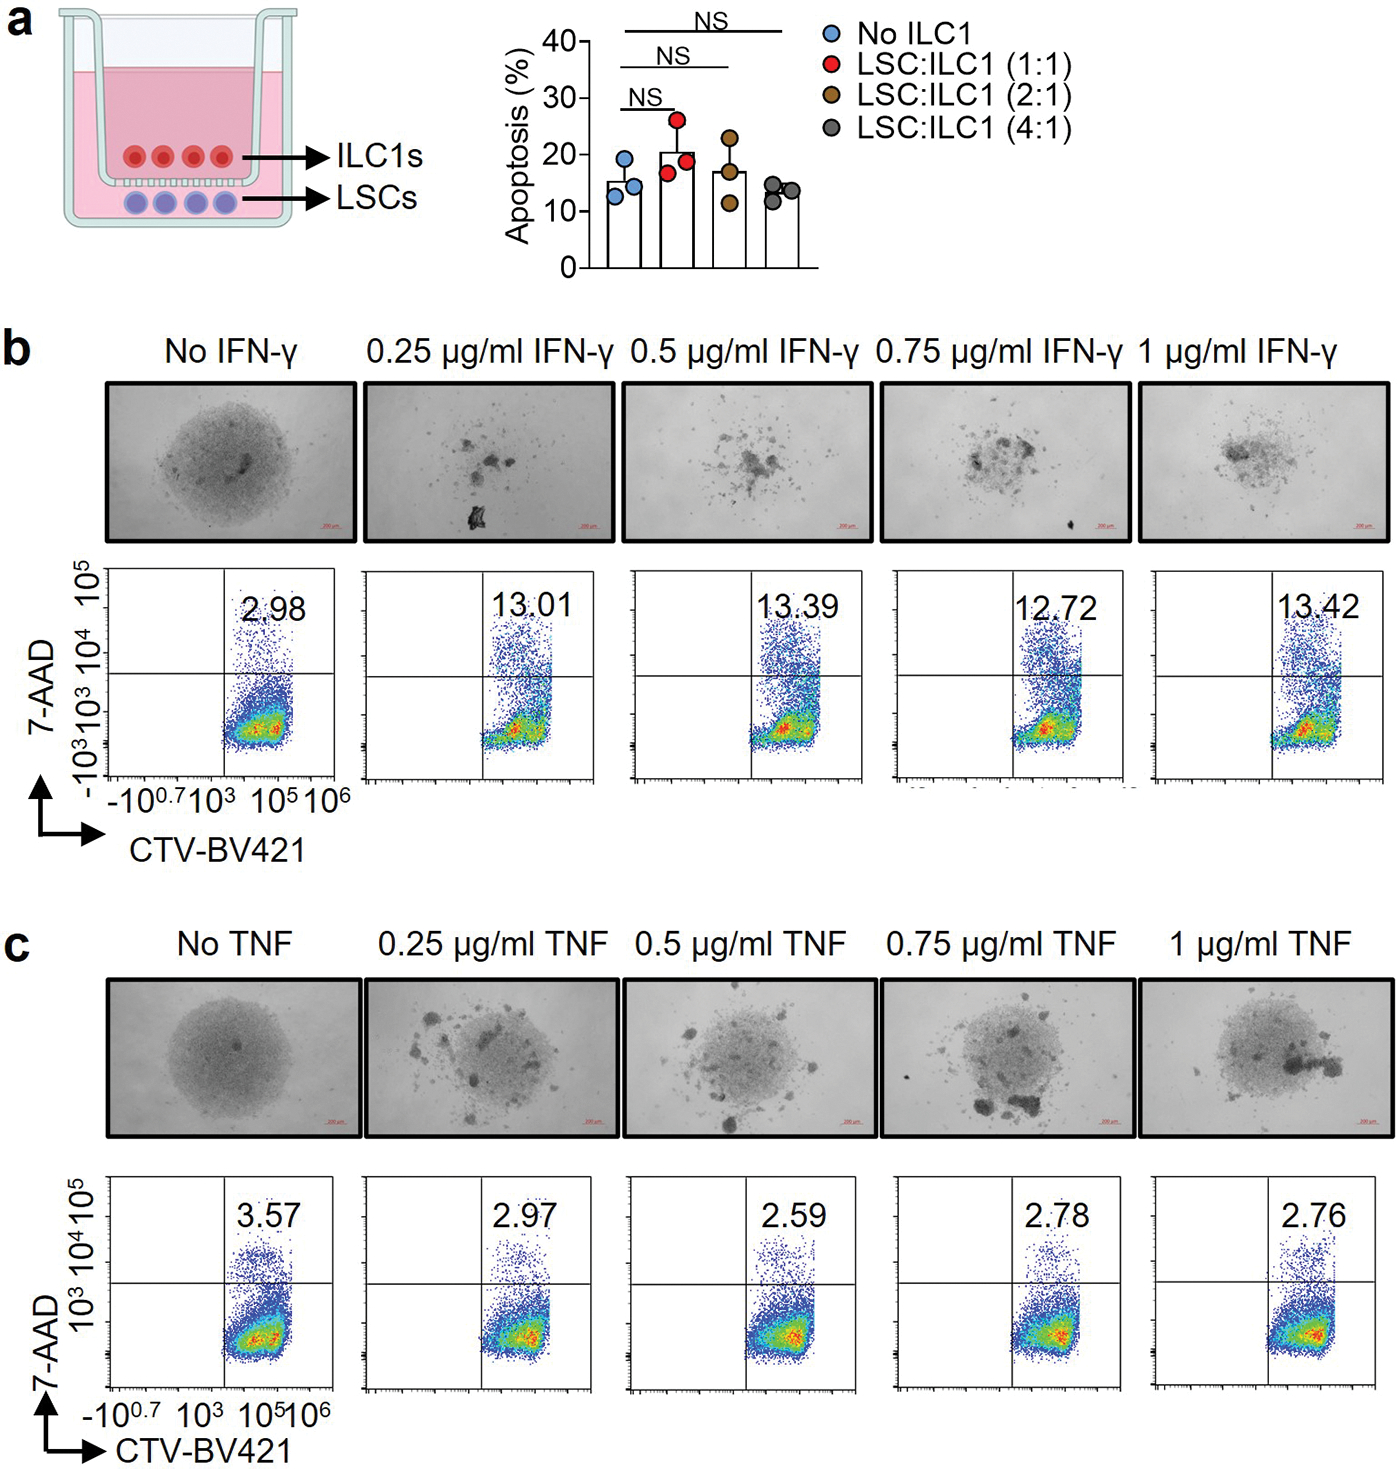
Using an AML mouse model (C1498 AML cells i.v. injected into C57BL/6J mice), we noted that the function of ILC1s (Lin−NK1.1+NKp46+CD49b−CD49a+) (Extended Data Fig. 1c) from the liver and BM, but not the spleen, was impaired, as indicated by decreased production of IFN-γ and TNF in AML mice compared to healthy mice (Extended Data Fig. 1d–f). Consistent with this, RNA sequencing (RNA-seq) of ILC1s indicated that nuclear factor-κB (NF-κB) signaling, a pathway that controls ILC1 function14, was inhibited in AML mice (Extended Data Fig. 1g). Since AML seemed to exert an immunosuppressive effect on ILC1s, we asked if ILC1s have an adverse effect on the genesis of AML. Thus, sorted healthy liver ILC1s were co-cultured for 3 days with splenic LSCs from the MllPTD/WT: Flt3ITD/ITD AML mice. The purity of LSCs and ILC1s was over 95% (Extended Data Fig. 2a,b). LSCs were lysed by ILC1s at the ratio of 1:1 or 1:2, evidenced by a decrease in the absolute number of live LSCs and an increase in the fraction of apoptotic LSCs compared to co-culture without ILC1s (Fig. 1a–c and Extended Data Fig. 2c). Additionally, total caspase and caspase3/7 activation of LSCs and the expression of the pro-apoptotic gene Bak1 significantly increased in co-culture with ILC1s compared to co-culture without ILC1s (Fig. 1d–f and Extended Data Fig. 2d). We achieved similar results using ILC1s (Lin−CD56−CD127+c-Kit−CRTH2−) isolated from healthy human blood (PB) that were co-cultured with LSCs (CD45dimLin−CD34+CD38−) from patients with AML (Fig. 1g–1k and Extended Data Fig. 2e,f), further suggesting that healthy ILC1s induce apoptotic death of LSCs.
Fig. 1|. ILC1s induce apoptosis in leukemia stem cells.
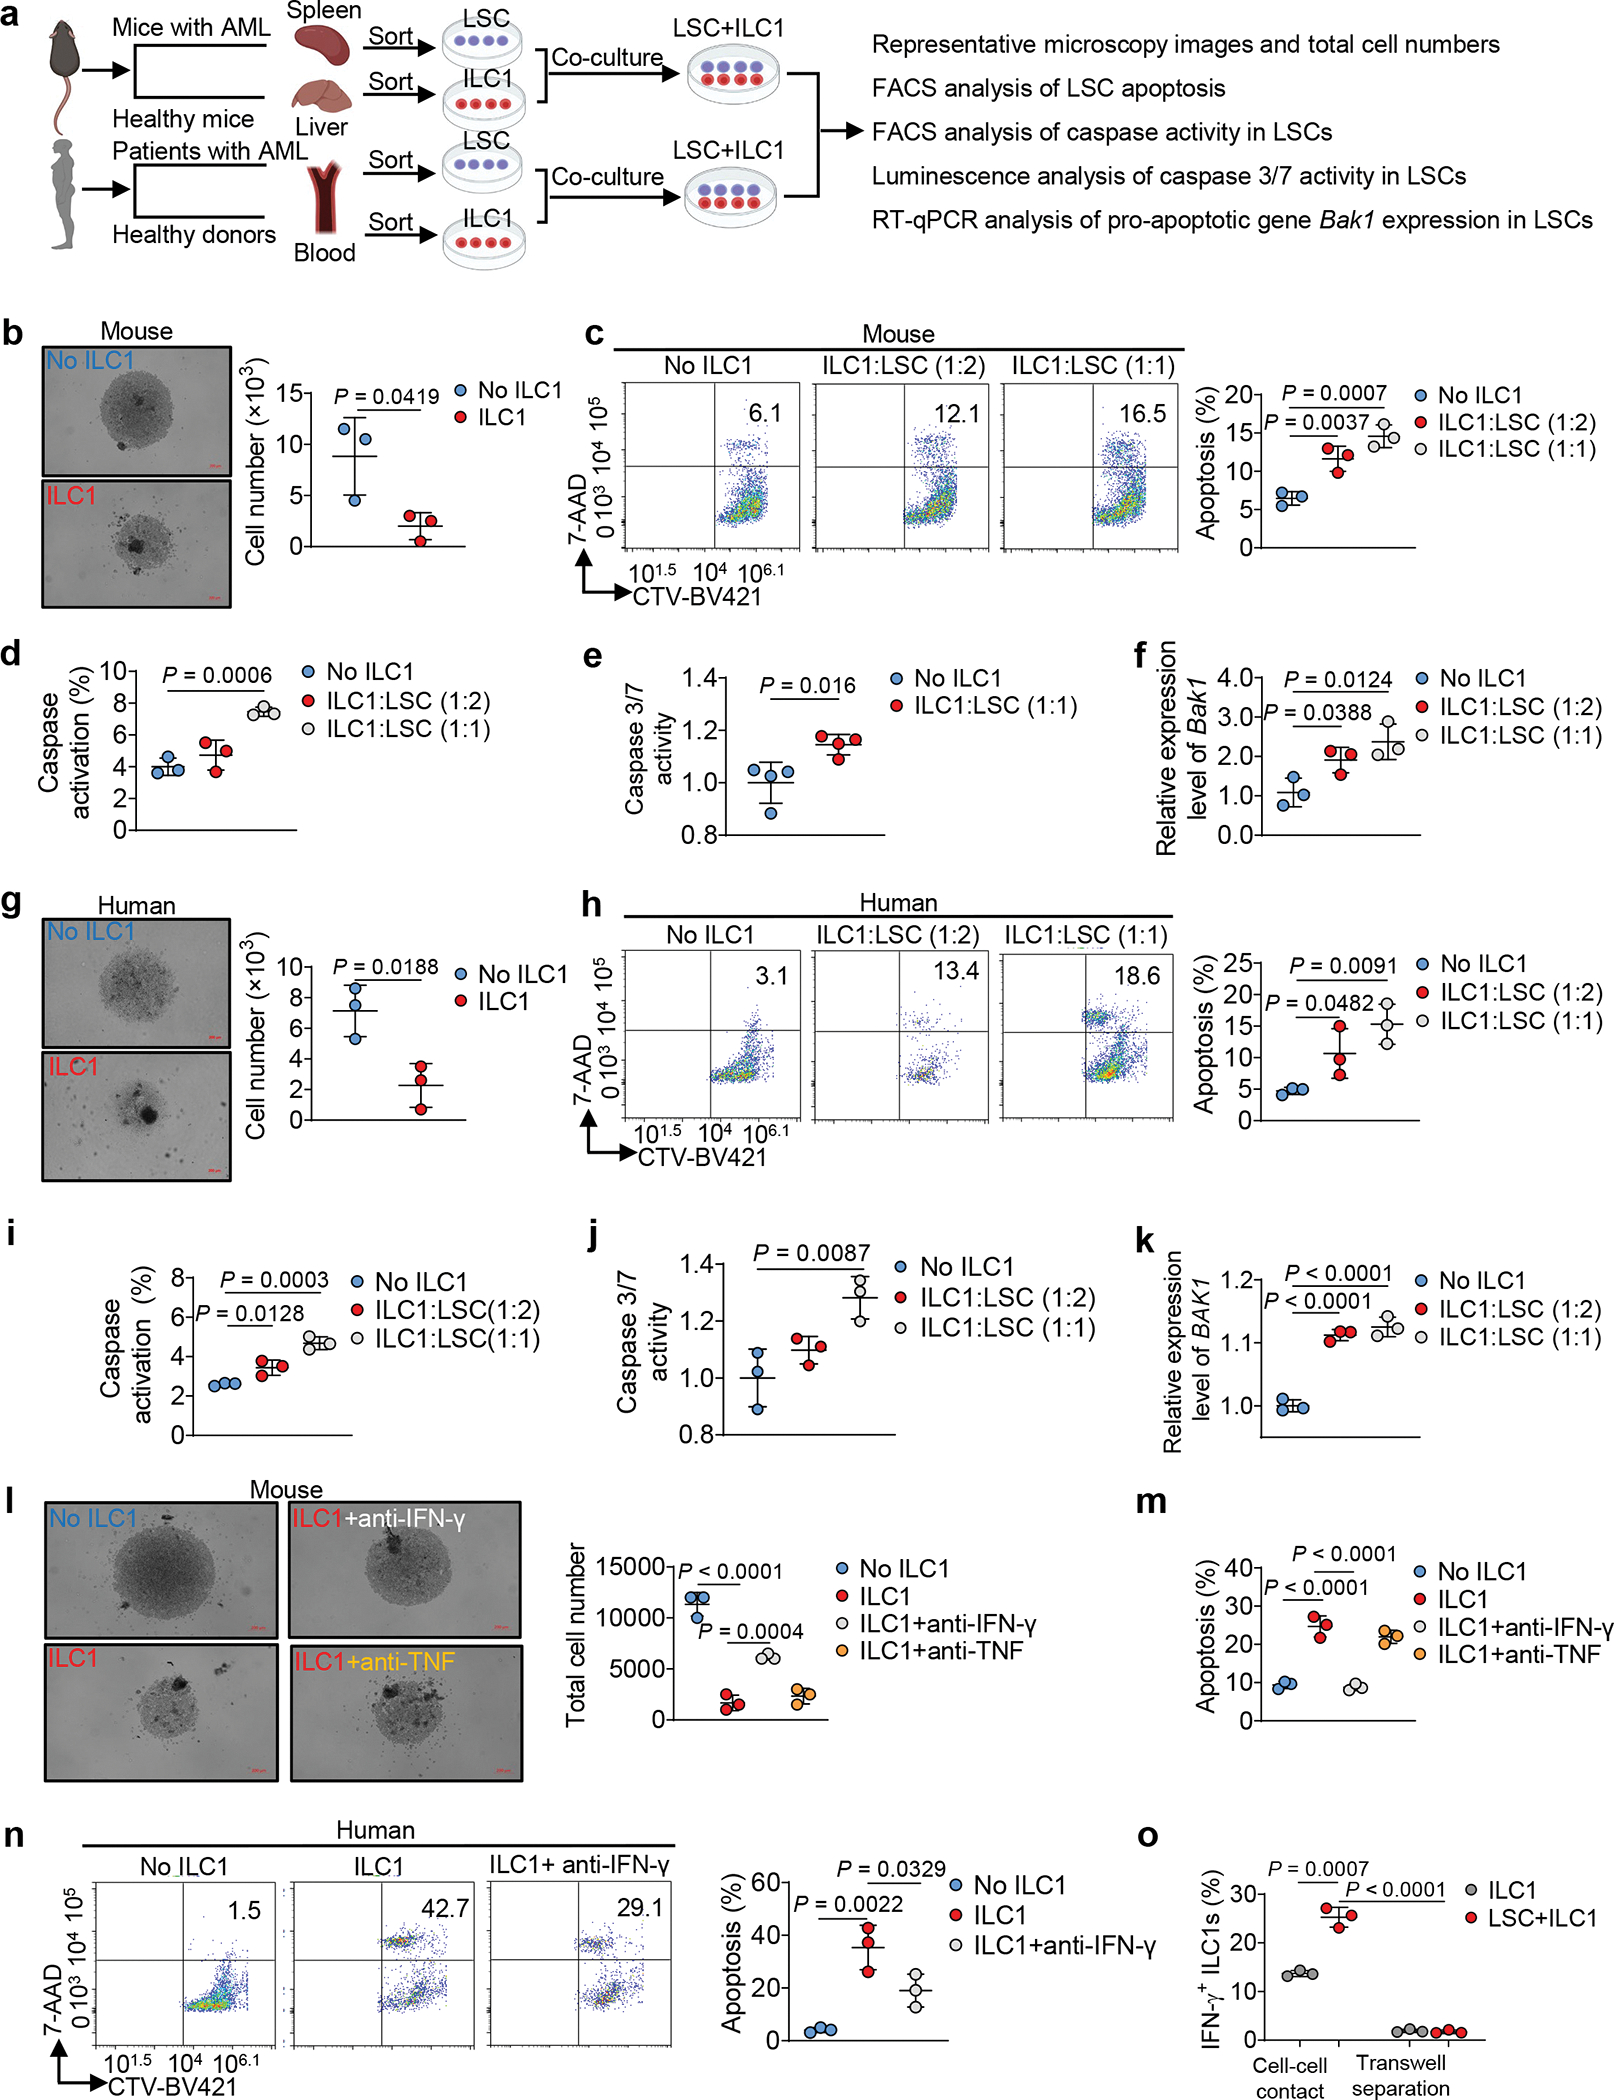
a, Experimental design for detecting LSC apoptosis in vitro. The images were created with BioRender.com. b, Representative images (left; 5× magnification, scale bar, 200 μm) and statistics of absolute cell numbers (right, n = 3 individual mice). c, Representative flow cytometry plots and statistics of the percentages of apoptotic cells in mouse LSCs (n = 3 individual mice). d, Percentages of caspase+ (positive) apoptotic cells in mouse LSCs (n = 3 individual mice). e, Statistics of caspase 3/7 activity in mouse LSCs. Results are expressed as fold changes compared to co-culture without ILC1s (n = 4 individual mice). f, qRT-PCR analyses for Bak1 gene in mouse ILCs (n = 3 individual mice). g, Human LSCs were co-cultured with or without human ILC1s for 3 days. Representative images (5× magnification, scale bar, 200 μm) and statistics of LSC numbers (n = 3 individual donors). h, Representative flow cytometry plots and statistics of the percentages of apoptotic cells in human LSCs (n = 3 individual donors). i, Percentages of caspase+ apoptotic cells in human LSCs (n = 3 individual donors). j, Statistics of caspase 3/7 activity in human LSCs. Results are expressed as fold changes compared to co-culture without human ILC1s (n = 3 individual donors). k, qRT-PCR analyses for BAK1 gene in human LSCs (n = 3 individual donors). l, Representative images (5× magnification, scale bar 200 μm) and statistics of LSC numbers (n =3 individual mice). m, Statistics of the percentages of apoptotic LSCs (n = 3 individual mice). n, Representative flow cytometry plots and statistics of the percentages of apoptotic cells in LSCs (n = 3 individual donors). o, Percentages of IFN-γ+ ILC1s were calculated (n = 3 individual mice). Data are representative of three independent experiments in b, e, g, and o and shown as the means ± s.d., compared by unpaired two-tailed Student’s t tests. Data are representative of at least three independent experiments in c, d, f, i, j, k, l, m, and n, and shown as the means ± s.d., and compared among multiple groups by one-way ANOVA.
ILC1s lack a high level of cytolytic activity; they function primarily as immunoregulatory cells by secreting cytokines including IFN-γ and TNF15. To determine this affects leukemogenesis, we repeated our co-culture experiment using healthy mouse ILC1s and LSCs in the presence of neutralizing antibodies against IFN-γ or TNF. Neutralizing IFN-γ—but not TNF—prevented ILC1s from mediating the death of LSCs (Fig. 1l, m). This requirement for IFN-γ was validated using human cells (Fig. 1n). We co-cultured the two cell types separately in a transwell, but did not observe LSC apoptosis (Extended Data Fig. 3a). Strikingly, IFN-γ production by ILC1s significantly increased without the transwell (Fig. 1o). Next, we observed LSC apoptosis when cultured with mouse IFN-γ (Extended Data Fig. 3b) but not with TNF (Extended Data Fig. 3c). Collectively, our data demonstrate that cell–cell contact allows ILC1s to produce IFN-γ, which induces LSC apoptosis.
ILC1s and their secreted IFN-γ inhibit differentiation of LSCs into leukemia progenitor cells
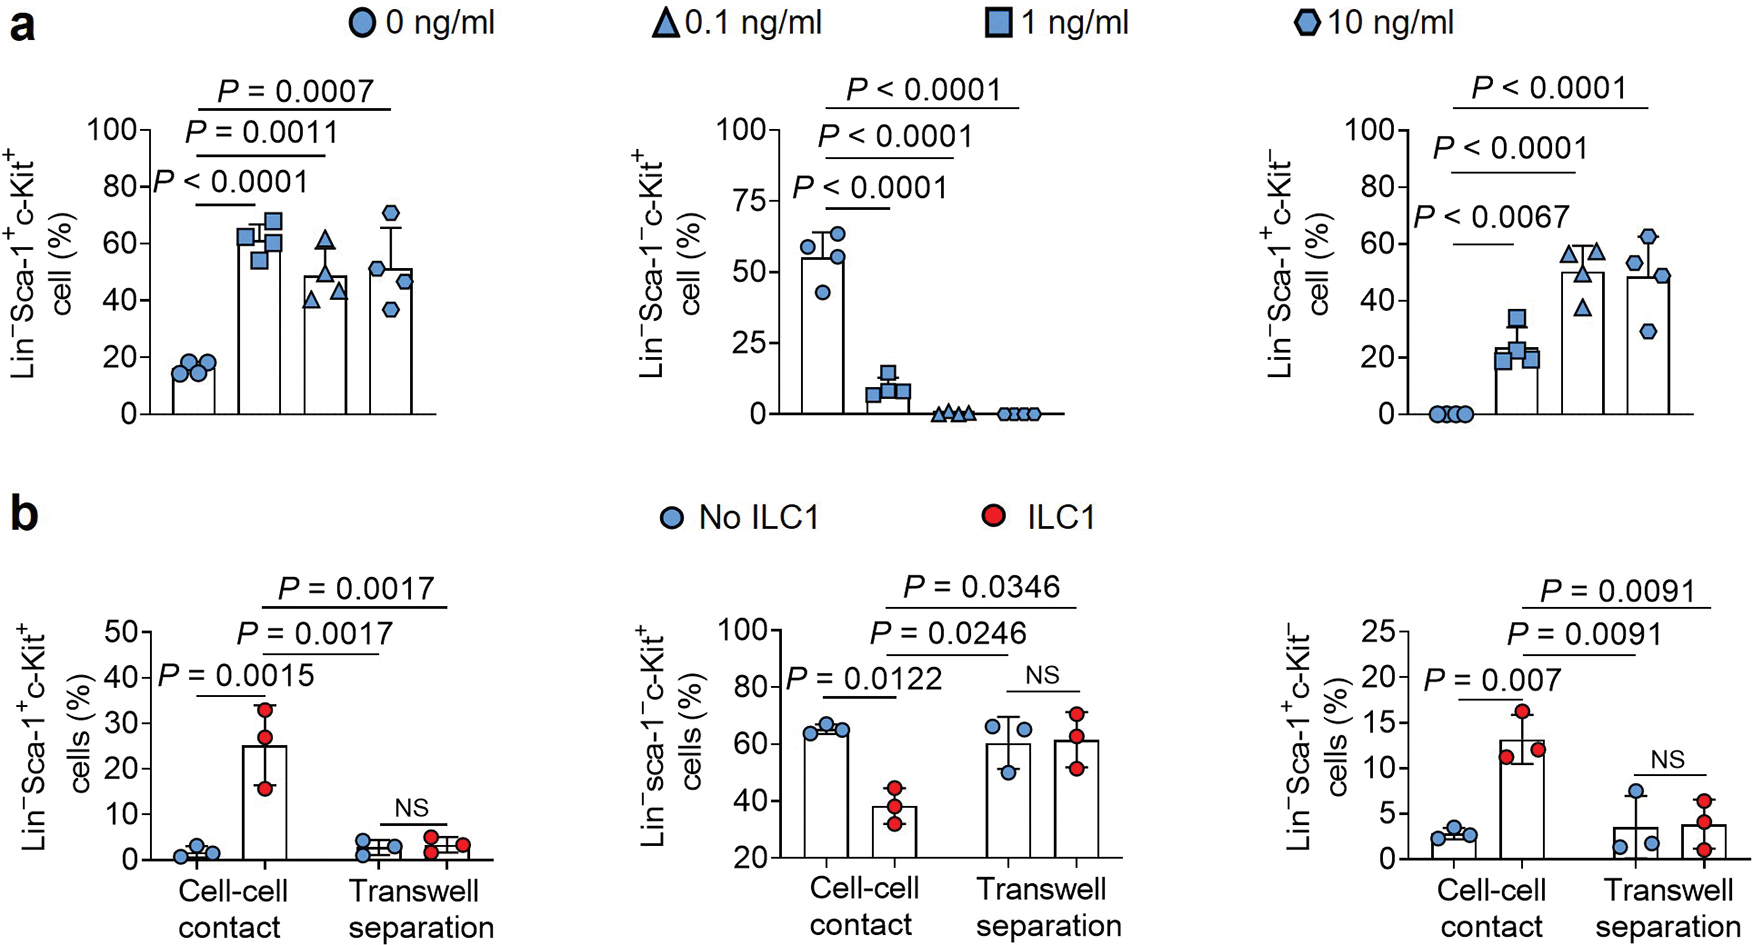
Initiation and differentiation of LSCs into leukemia progenitor cells drive the propagation of AML16. To assess the effects of ILC1s on LSC differentiation, we co-cultured LSCs isolated from the spleen of AML mice with or without ILC1s isolated from the liver of healthy mice for 4 days. The ratio of ILC1s: LSCs was 1:4, which was lower than in the apoptosis assay. Cultures with ILC1s contained a higher number of LSCs and a lower number Lin−Sca-1−c-Kit+ leukemia progenitor cells (LS−K+ cells) compared to the group co-cultured without ILC1s (Fig. 2a–c). Furthermore, the percentages and absolute cell numbers of Lin−Sca-1+c-Kit− non-leukemic cells (LS+K−cells)17 were significantly higher after co-culture with ILC1s (Fig. 2d). No obvious difference was found in the Lin−Sca-1−c-Kit− cell population (Fig. 2e). Previous studies demonstrated that non-leukemic LS+K− cells contain early lymphoid-committed precursors18 that are highly apoptotic in mice with chronic myelogenous leukemia17. Thus, ILC1s inhibit the differentiation of LSCs into LS−K+ leukemia progenitor cells while promoting their differentiation into non-leukemic LS+K− cells. To determine the mechanism, we included neutralizing antibodies against IFN-γ and TNF in an ILC1–LSC co-culture. IFN-γ but not TNF neutralizing antibody inhibited both ILC1-mediated suppression of LSC differentiation into LS−K+ leukemia progenitor cells and induction of LSC differentiation into non-leukemic LS+K− cells (Fig. 2f–j). Results were validated by comparing LSCs co-cultured with ILC1s from IFN-γ−/− or TNF−/− mice with ILC1s from wild-type (WT) mice. ILC1s from IFN-γ−/− mice could no longer inhibit the differentiation of LSCs into LS−K+ leukemia progenitor cells or promote their differentiation into non-leukemic LS+K− cells. However, ILC1s isolated from TNF−/− mice acted similarly to ILC1s from healthy mice (Fig. 2f–j). Moreover, mouse IFN-γ inhibited the differentiation of LSCs into LS−K+ leukemia progenitor cells and facilitated their differentiation into non-leukemic LS+K− cells (Fig. 2k,l and Extended Data Fig. 4a).
Fig. 2|. ILC1s secreted-IFN-γ controls the direction of LSC differentiation.
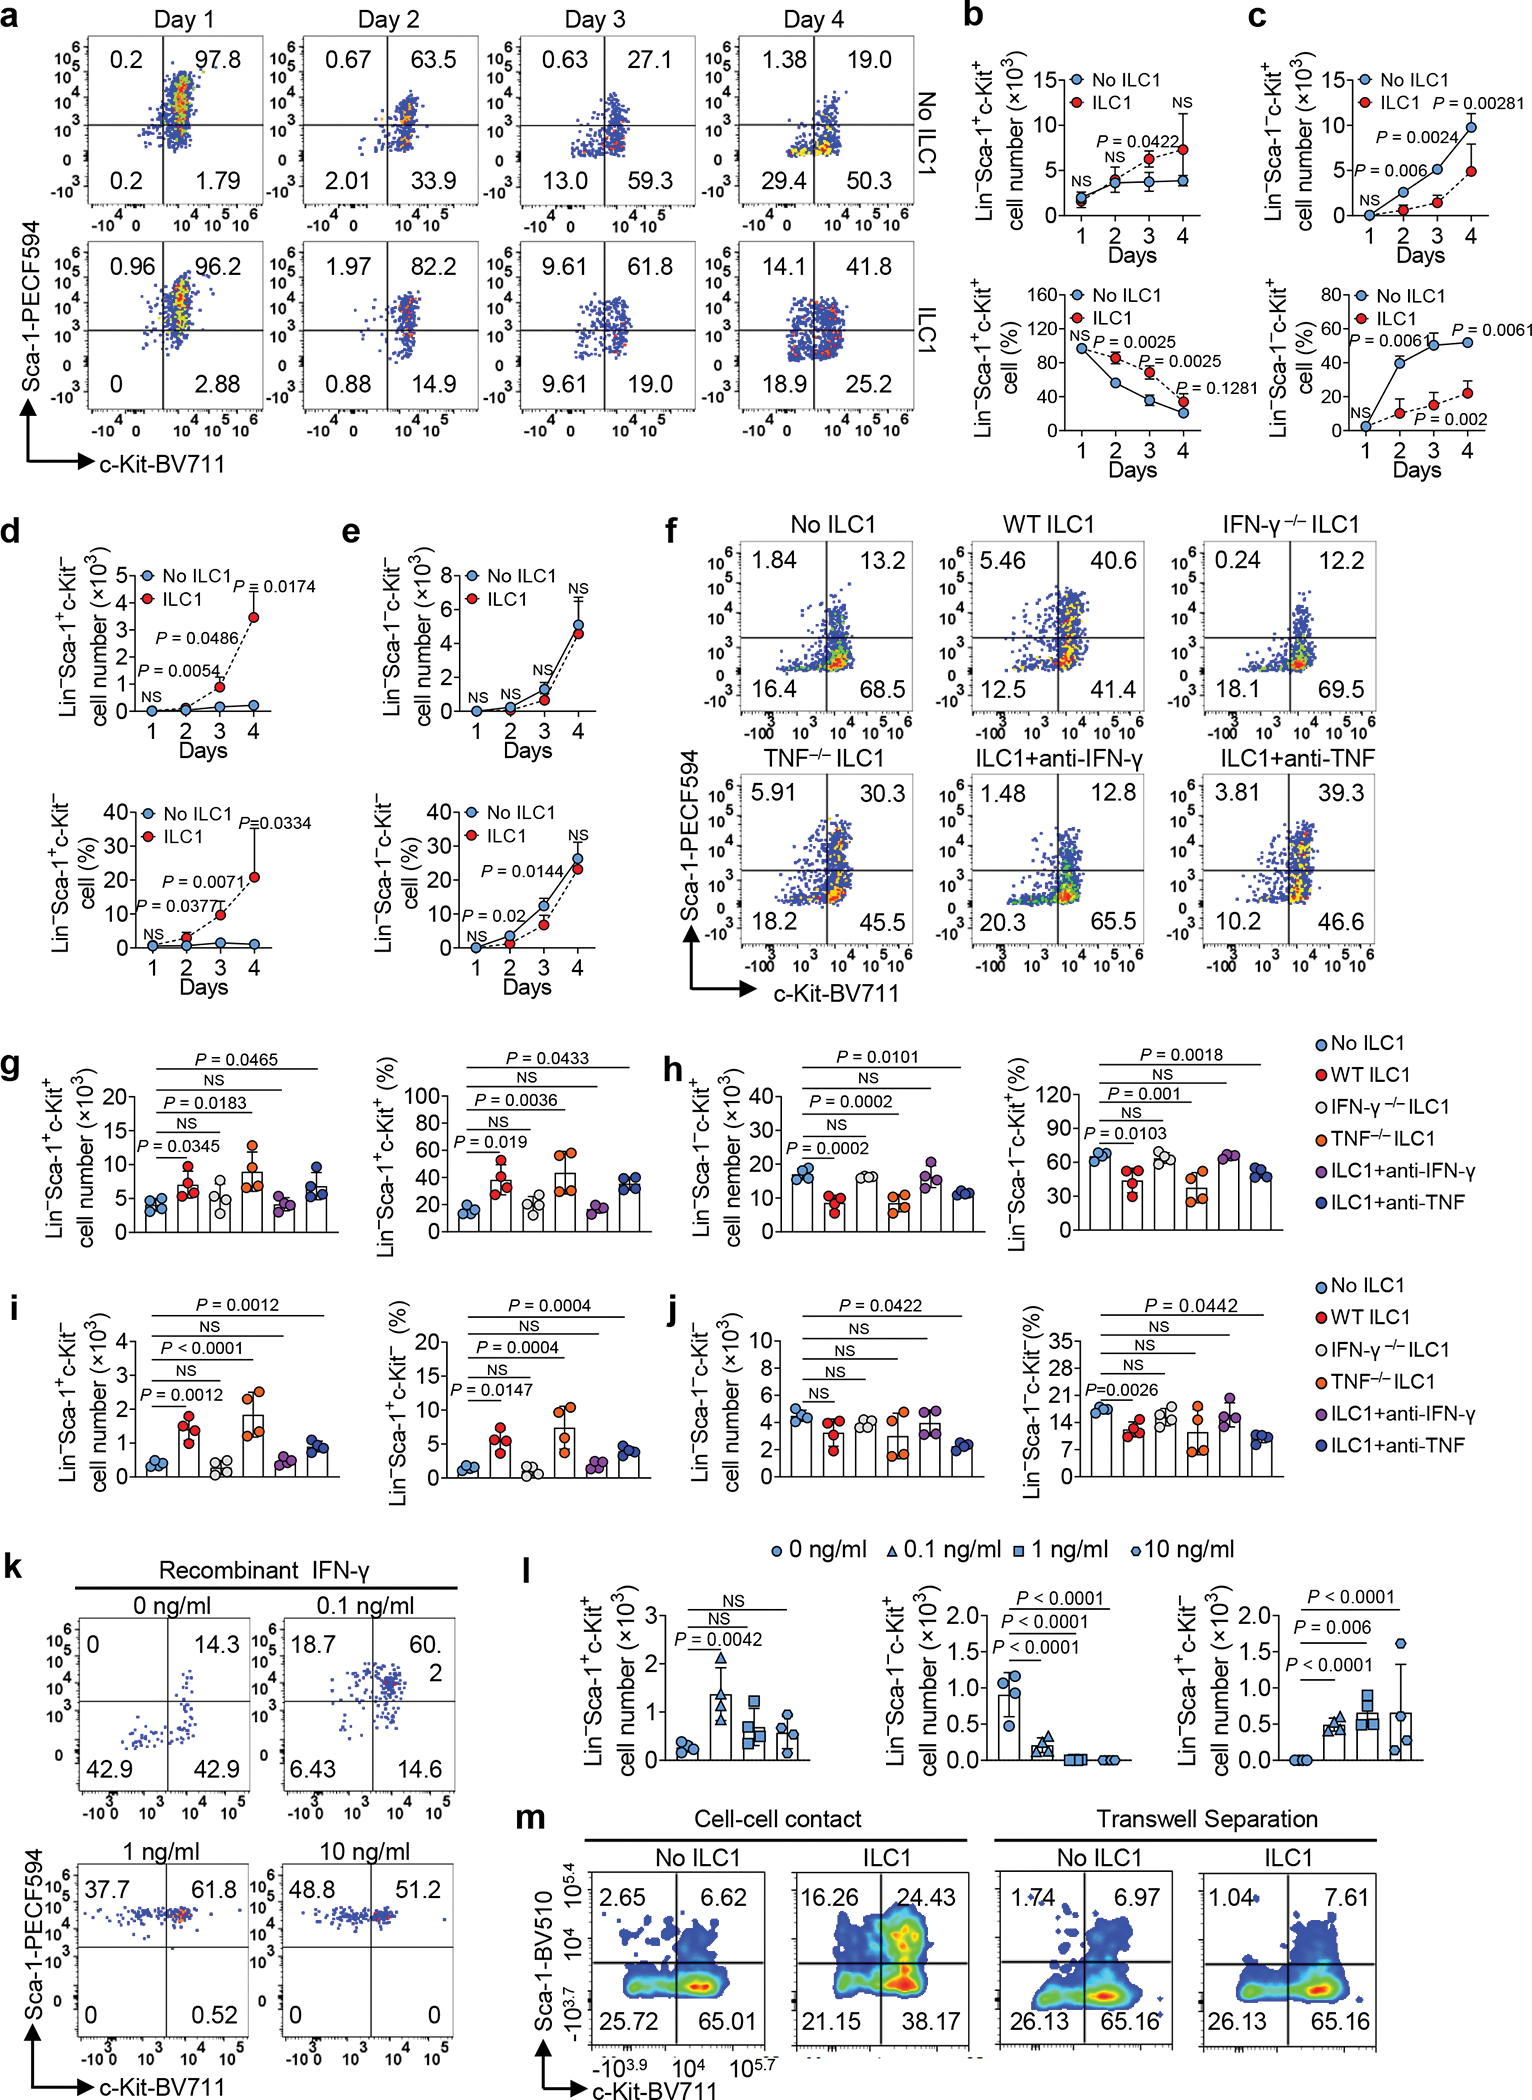
a-e, Mouse LSCs were co-cultured with or without mouse ILC1s. Representative flow cytometry plots (a), statistics of absolute cell numbers (b-e, top) and percentages (b-e, bottom) of Lin−Sca-1+c-Kit+, Lin−Sca-1−c-Kit+, Lin−Sca-1+c-Kit−, and Lin−Sca-1−c-Kit− cells (n = 4 individual mice). f-j, Mouse LSCs were co-cultured with or without WT, IFN-γ−/−, or TNF−/− ILC1s in the presence or absence of anti-IFN-γ or anti-TNF antibody. Representative flow cytometry plots (f), statistics (g-j) of absolute cell numbers (left) as well as percentages (right) of Lin− Sca-1+c-Kit+, Lin− Sca-1− c-Kit+, Lin−Sca-1+c-Kit−, and Lin− Sca-1− c-Kit− cells (n = 4 individual mice). k,l, Mouse LSCs were co-cultured with or without 0.1 ng/ml, 1 ng/ml, or 10 ng/ml recombinant mouse IFN-γ. Representative flow cytometry plots (k) and statistics of absolute cell numbers (l) of Lin− Sca-1+c-Kit+, Lin−Sca-1−c-Kit+, and Lin− Sca-1+c-Kit− cells are shown (n = 4 individual mice). m, ILC1s were transferred into the top well of a 96-well Transwell plate, the bottom chambers of the plate were loaded with LSCs from the spleen of MllPTD/WT: Flt3ITD/ITD mice, and the cells were co-cultured for 3 days. Representative flow cytometry plots of the Lin− Sca-1+c-Kit+, Lin− Sca-1− c-Kit+, Lin− Sca-1+c-Kit−, and Lin−Sca-1−c-Kit− cells are shown (n = 3 individual mice). Graphical data for (m) are shown in Extended Data Fig. 4b. Data are representative of three independent experiments in b, c, d, and e, and shown as the means ± s.d., compared among multiple groups with repeated measures by linear mixed models. Data in g, h, i, j, and l are representative of three independent experiments and shown as the means ± s.d., as calculated by one-way ANOVA models. NS, not significant.
To determine if ILC1s regulate LSC differentiation through cell–cell contact (as proved to be critical for LSC apoptosis), we separated LSCs and ILC1s in a transwell chamber. As expected, the percentages of LSCs, LS−K+ leukemia progenitor cells, and LS+K− non-leukemic cells varied between LSCs cultured with and without ILC1s (Fig. 2m and Extended Data Fig. 4b). In contrast, the percentages were similar whether LSCs were separated from ILC1s by a transwell or cultured without ILC1s (Fig. 2m and Extended Data Fig. 4b). These data suggest that cell–cell interaction is required for ILC1s to regulate LSC differentiation by inhibiting the differentiation of LSCs into LS−K+ leukemia progenitor cells while promoting their differentiation into non-leukemic LS+K− cells.
ILC1s and their secreted IFN-γ suppress differentiation of LSCs into terminal myeloid blasts
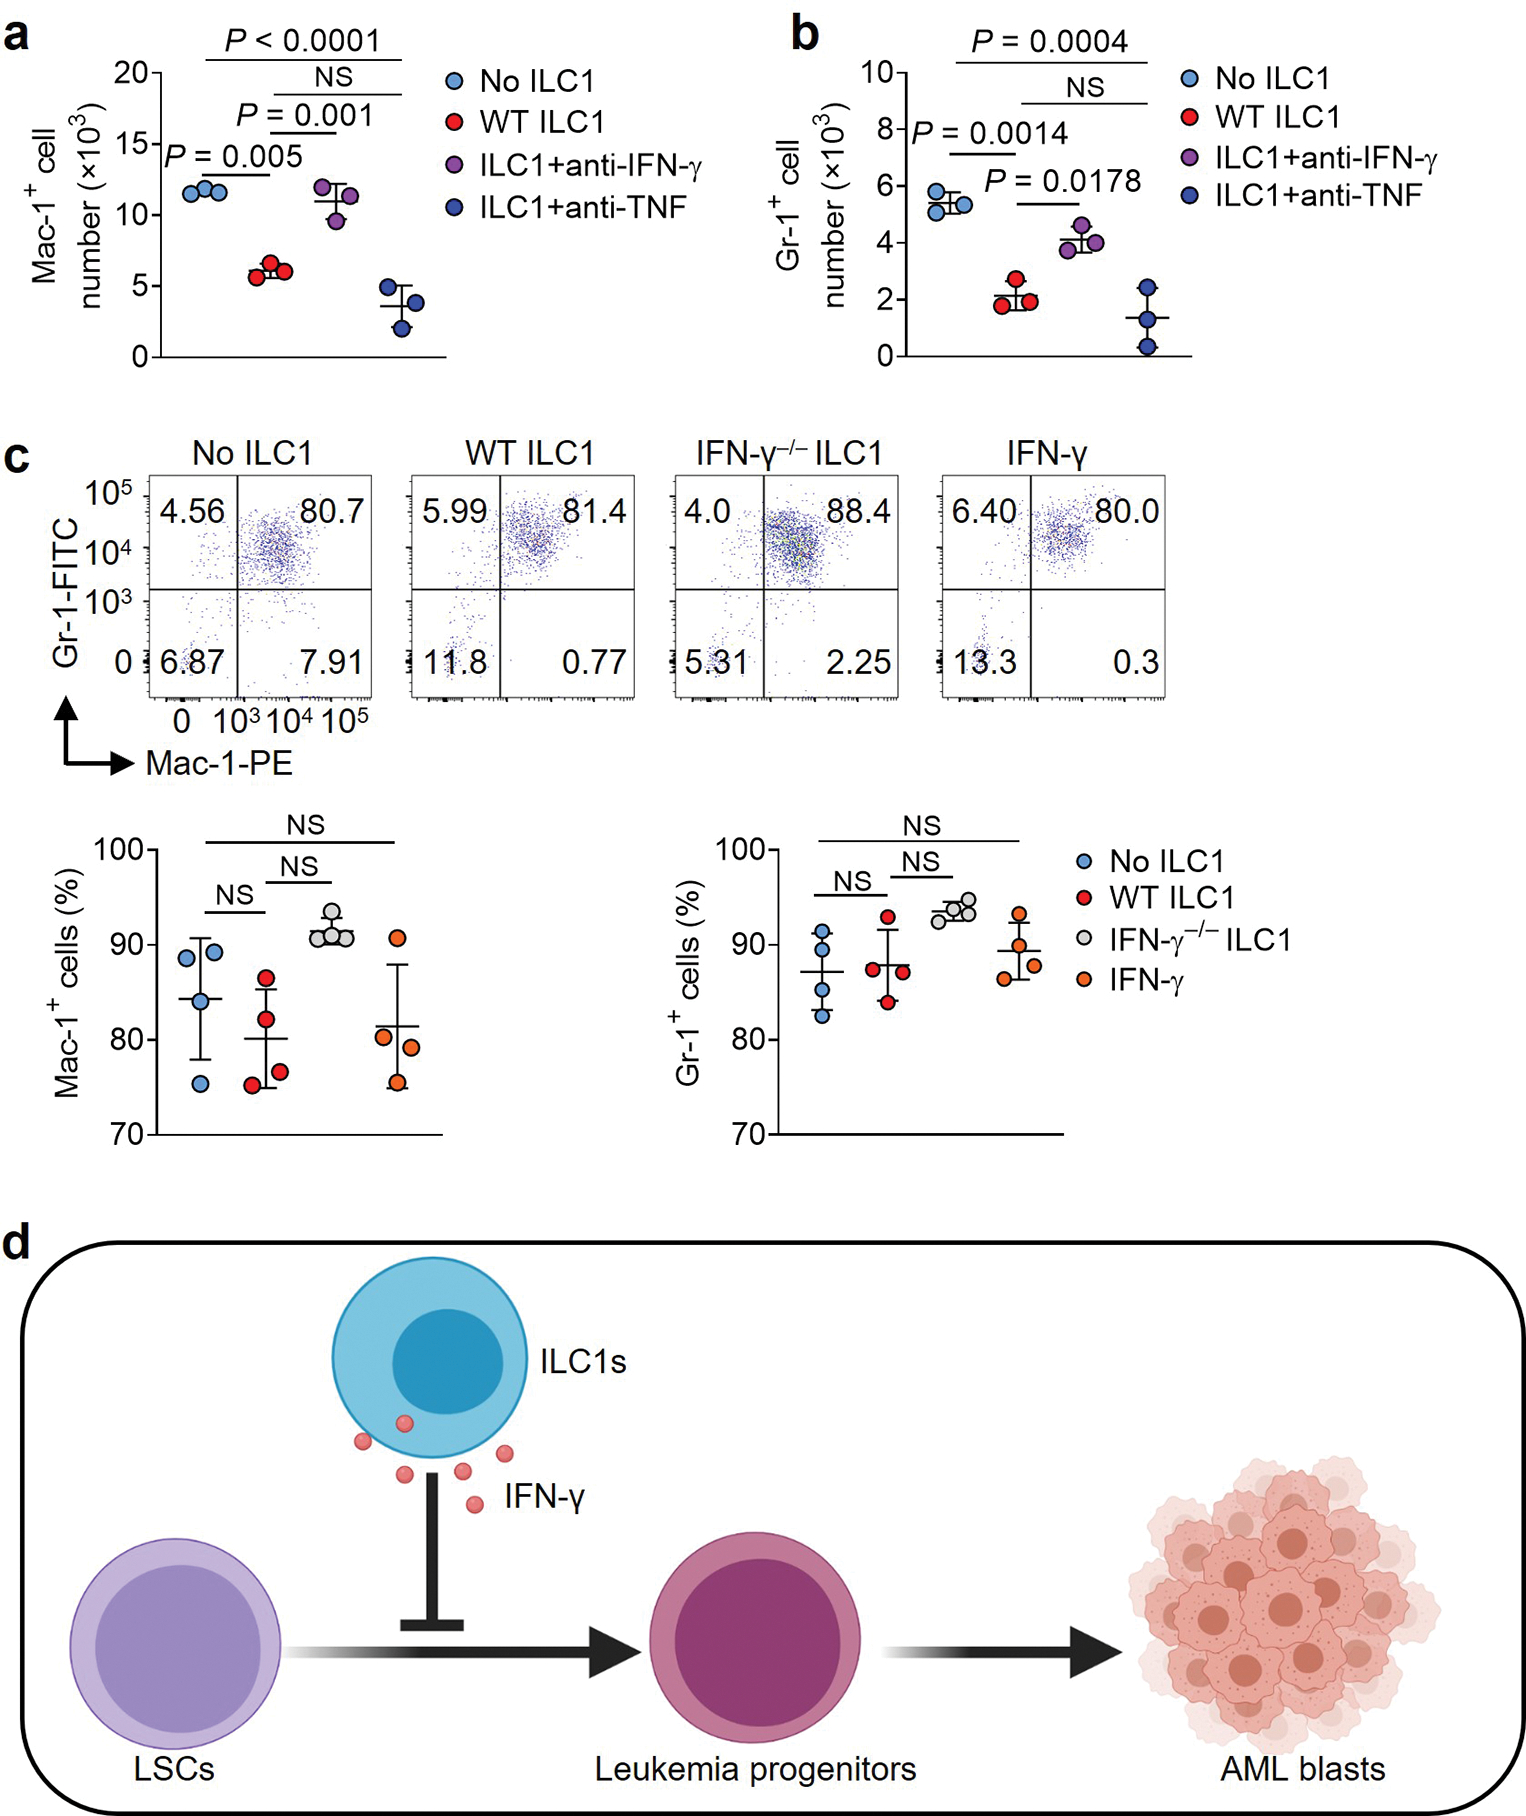
LSCs are hierarchical cells that differentiate to the terminal myeloid blasts that sustain AML19. When LSCs were co-cultured with healthy ILC1s compared to no ILC1s, ILC1s significantly inhibited LSC differentiation into terminal myeloid blasts, as indicated by reduced populations of cells expressing macrophage-1 antigen (Mac-1) and myeloid differentiation antigen Gr-1 (Fig. 3a,b). When LSCs were co-cultured with IFN-γ−/− or TNF−/− ILC1s compared to WT ILC1s, we observed significantly increased populations of cells expressing Mac-1 and Gr-1 in the co-culture with IFN-γ−/− ILC1s—but not in the co-culture with TNF−/− ILC1s (Fig. 3c,d). Similar results were obtained in the presence of neutralizing antibodies against IFN-γ or TNF ( Extended Data Fig. 5a,b). Histological analysis demonstrated that the number of cells with differentiated morphology decreased when LSCs were co-cultured with WT ILC1s or TNF−/− ILC1s, compared to LSCs cultured with no ILC1s or with IFN-γ−/− ILC1s (Fig. 3e). We also performed a colony-forming unit assay, starting with an equal number of LSCs. Compared to LSCs co-cultured without ILC1s, LSCs co-cultured with IFN-γ−/− ILC1s formed a similar number of colonies, whereas LSCs co-cultured with WT or TNF−/− ILC1s formed significantly fewer colonies (Fig. 3f). To confirm that IFN-γ produced by ILC1s impairs LSC differentiation into terminal myeloid blasts, we treated LSCs with mouse IFN-γ. This treatment suppressed the differentiation of LSCs into cells expressing Mac-1 and Gr-1 (Fig. 3g,h). Additionally, we cultured LSCs with ILC1s, IFN-γ, or no treatment (control) and then separated the LSCs from the ILC1s using FACS, followed by RNA-seq analysis. Compared to untreated LSCs, LSCs co-cultured with ILC1s or treated with IFN-γ reduced the expression of S100a8, S100a9, Chil3, Serpinb1a, and Slc28a2 genes, which associate with myeloid differentiation20, 21, 22 but increased expression of Gimap4, Gbp4, and the interferon regulatory factor genes Irf8 and Irf1 (Fig. 3i), which associate with lymphoid differentiation23, 24.
Fig. 3|. ILC1s inhibit the differentiation of LSCs into myeloid blasts.
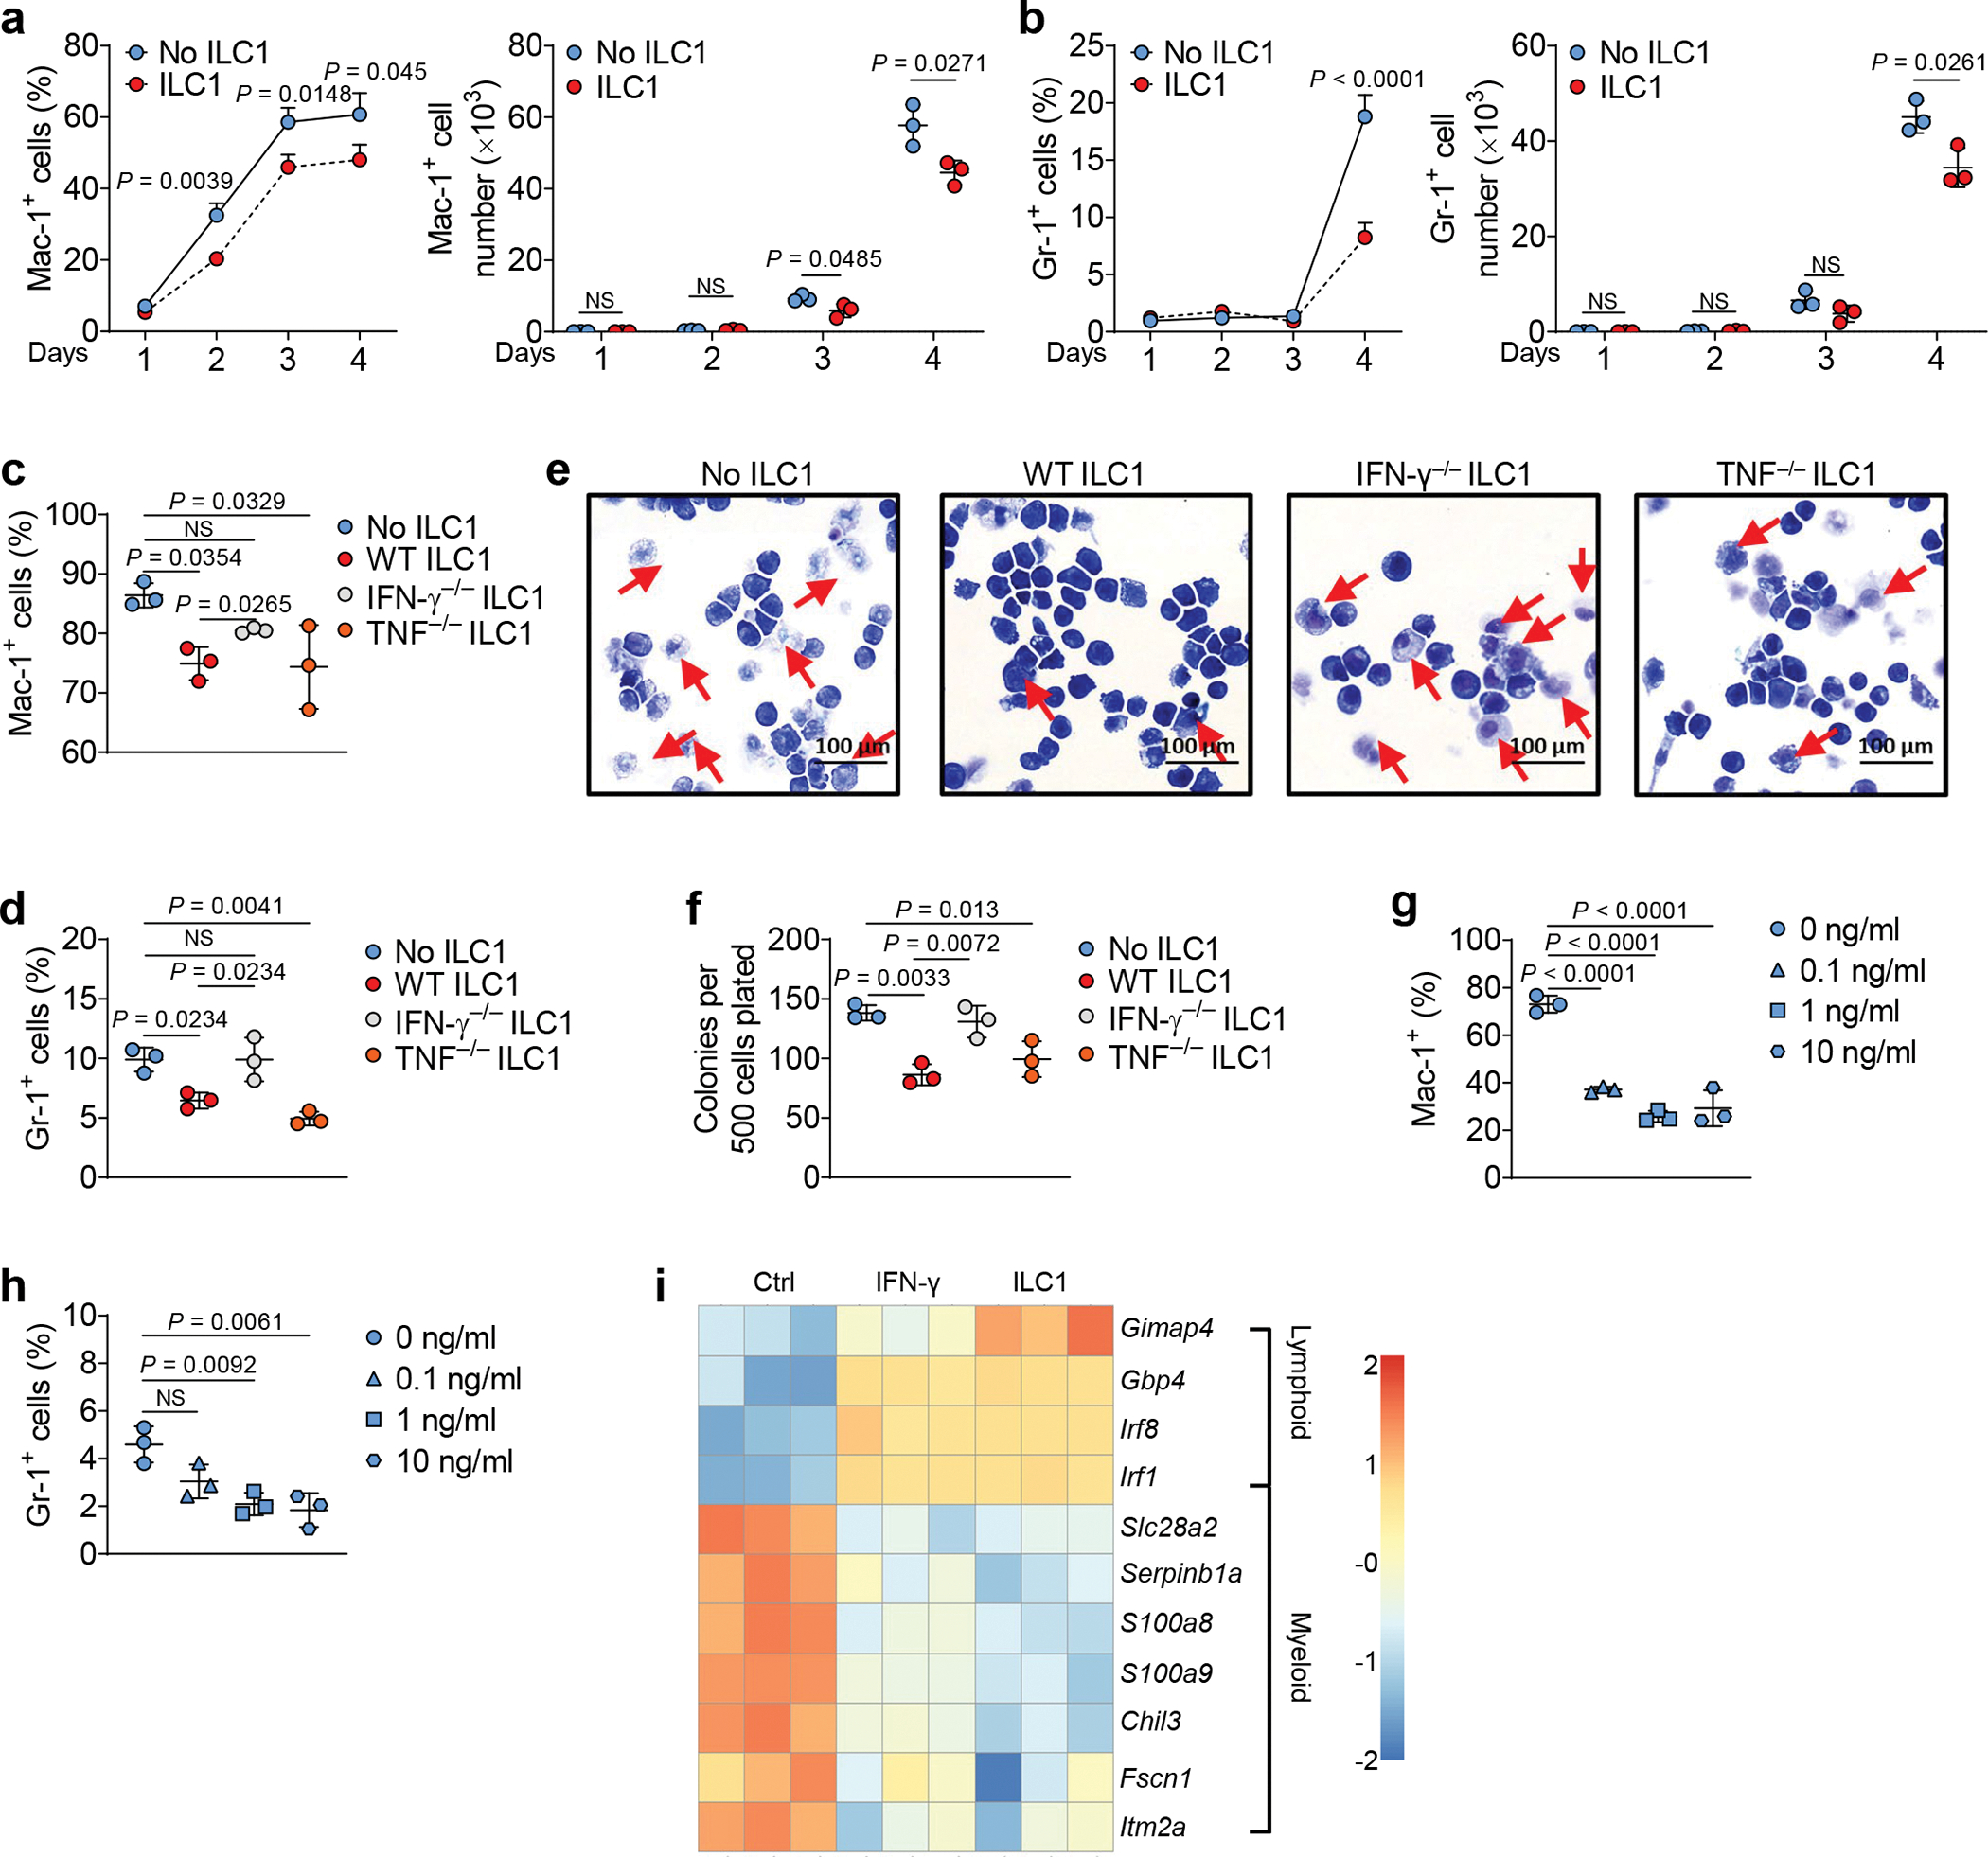
a,b, Mouse LSCs were co-cultured with or without mouse ILC1s for days 1–4, and the percentages (left) and absolute cell numbers (right) of Mac-1+ (a) and Gr-1+ (b) cells were calculated by flow cytometry (n = 3 individual mice). c,d, Mouse LSCs were co-cultured with or without mouse WT, IFN-γ−/−, or TNF−/− ILC1s, and percentages of Mac-1+ (c) and Gr-1+ (d) cells were measured by flow cytometry (n = 3 individual mice). e, Representative images of Wright-Giemsa staining of cells (20× magnification, scale bar 100 μm, n = 3). f, Colony-forming cells were counted at each round of plating (n = 3 individual mice); triplicate replicates are shown. g,h, Mouse LSCs were treated with or without 0.1 ng/ml, 1 ng/ml, or 10 ng/ml recombinant mouse IFN-γ, and percentages of Mac-1+ (g) and Gr-1+ (h) cells were measured by flow cytometry (n = 3 individual mice). i, Mouse LSCs were sorted and co-cultured with or without sorted ILC1s or treated with IFN-γ for 3 days. LSCs were separated from co-cultured ILC1s using FACS before RNA-seq. Heatmap showing differential expression of RNA from terminal myeloid differentiation and lymphoid differentiation genes (n = 3 individual mice). Data in a-h are representative of three independent experiments. Data in a, b, c, d, f, g, and h are shown as the means ± s.d., and were assessed by unpaired two-tailed Student’s t tests (a and b) or one-way ANOVA (c, d, f, g, and h). NS, not significant.
LSCs transition into LS−K+ leukemia progenitor cells before becoming AML blasts. To investigate which step in this sequence is affected by ILC1s and IFN-γ, we sorted LS−K+ leukemia progenitor cells from mice with AML, and then treated them with WT or IFN-γ−/− ILC1s or IFN-γ for 5 days. The percentages of cells expressing Mac-1 and Gr-1 remained constant among the groups (Extended Data Fig. 5c).
These data indicate that ILC1s suppress LSC differentiation into AML blasts via IFN-γ. This suppression occurs during the first transition —from LSCs into LS−K+ leukemia progenitor cells—rather than during the subsequent step that converts progenitor cells into AML blasts (Extended Data Fig. 5d).
ILC1s do not significantly affect apoptosis and differentiation of normal HSCs
We next investigated whether ILC1s could promote apoptosis of normal hematopoietic stem cells (termed HSC or WT LSKs or Lin−Sca-1+c-Kit+ cells). After sorting ILC1s from the liver of healthy mice, we co-cultured them for 3 days with HSCs isolated from BM of healthy mice at ILC1: HSC ratios of 1:1 or 1:2. The ILC1s did not significantly induce HSC apoptosis (Extended Data Fig. 6a). We achieved similar results when co-culturing human ILC1s and HSCs (Lin−CD34+ cells) from PB of the same healthy donors (Extended Data Fig. 6b). Further, a co-culture of HSCs with or without ILC1s did not display a significant difference in absolute cell numbers and percentages of HSCs or differentiated myeloid progenitor cells or Mac-1+Gr-1+ cells (Extended Data Fig. 6c–f), suggesting that ILC1s do not impair HSC self-renewal and differentiation in vitro. Next, we sorted HSCs from healthy CD45.2 mice and i.v. injected them into lethally irradiated CD45.1 mice. One day later, we injected the mice once with or without ILC1s from the liver of healthy mice. Three weeks later, we euthanized the mice and analyzed donor hematopoietic and progenitor, myeloid cell subsets, and white blood cells (WBC) (Extended Data Fig. 6g). Consistent with our in vitro experiment, ILC1s did not significantly alter the absolute cell numbers of LSKs, myeloid progenitor cells (LS−K+), early lymphoid-committed precursors (LS+K−), short-term hematopoietic stem cells (STHSC), long-term hematopoietic stem cells (LTHSC), multipotent progenitors 1 and 2 (MPP1 and MPP2), Mac-1+Gr-1+ cell subsets, or WBCs (Extended Data Fig. 6h–j).
ILC1s and their secreted IFN-γ control LSC-derived AML in vivo
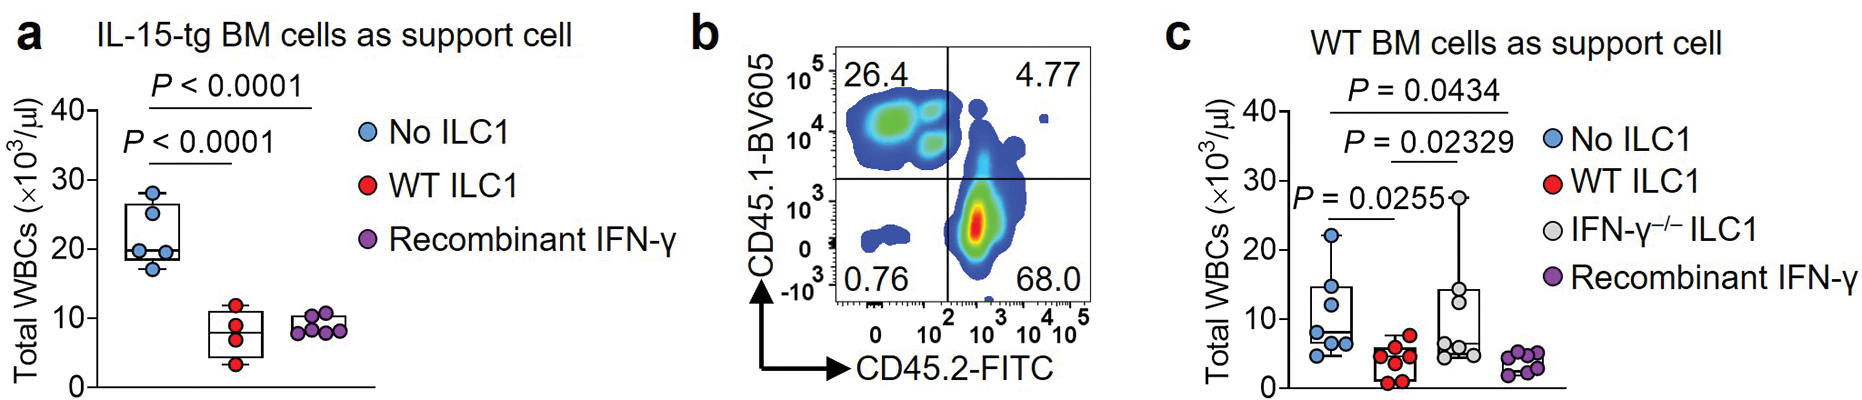
Next, we hypothesized that ILC1s could suppress leukemia development and growth in vivo. When we initiated the in vivo efficacy experiment, we did not know whether ILC1s could survive well in vivo after their adoptive transfer. Since IL-15 supports survival of ILC1s25, we first tested whether adoptively transferred WT ILC1s can suppress the development of LSCs co-injected with BM cells from IL-15 transgenic (IL-15tg) mice26 (Fig. 4a). The model mice treated with WT ILC1s had significantly fewer total WBCs when compared to treated with IFN-γ−/− ILC1s and untreated groups, the latter two of which did not differ significantly from each other (Fig. 4b). A substantial reduction of the immature blast cell population in the blood and significantly prolonged survival were observed in mice treated with WT ILC1s compared to untreated mice or those treated with IFN-γ−/− ILC1s (Fig. 4c,d). Using mouse IFN-γ to replace WT ILC1s in this experiment, an effect similar to that of WT ILC1s was observed, that is, the recombinant IFN-γ had significantly fewer total WBCs when compared to untreated group (Extended Data Fig. 7a).
Fig. 4|. ILC1s and IFN-γ improve survival of leukemic mice.
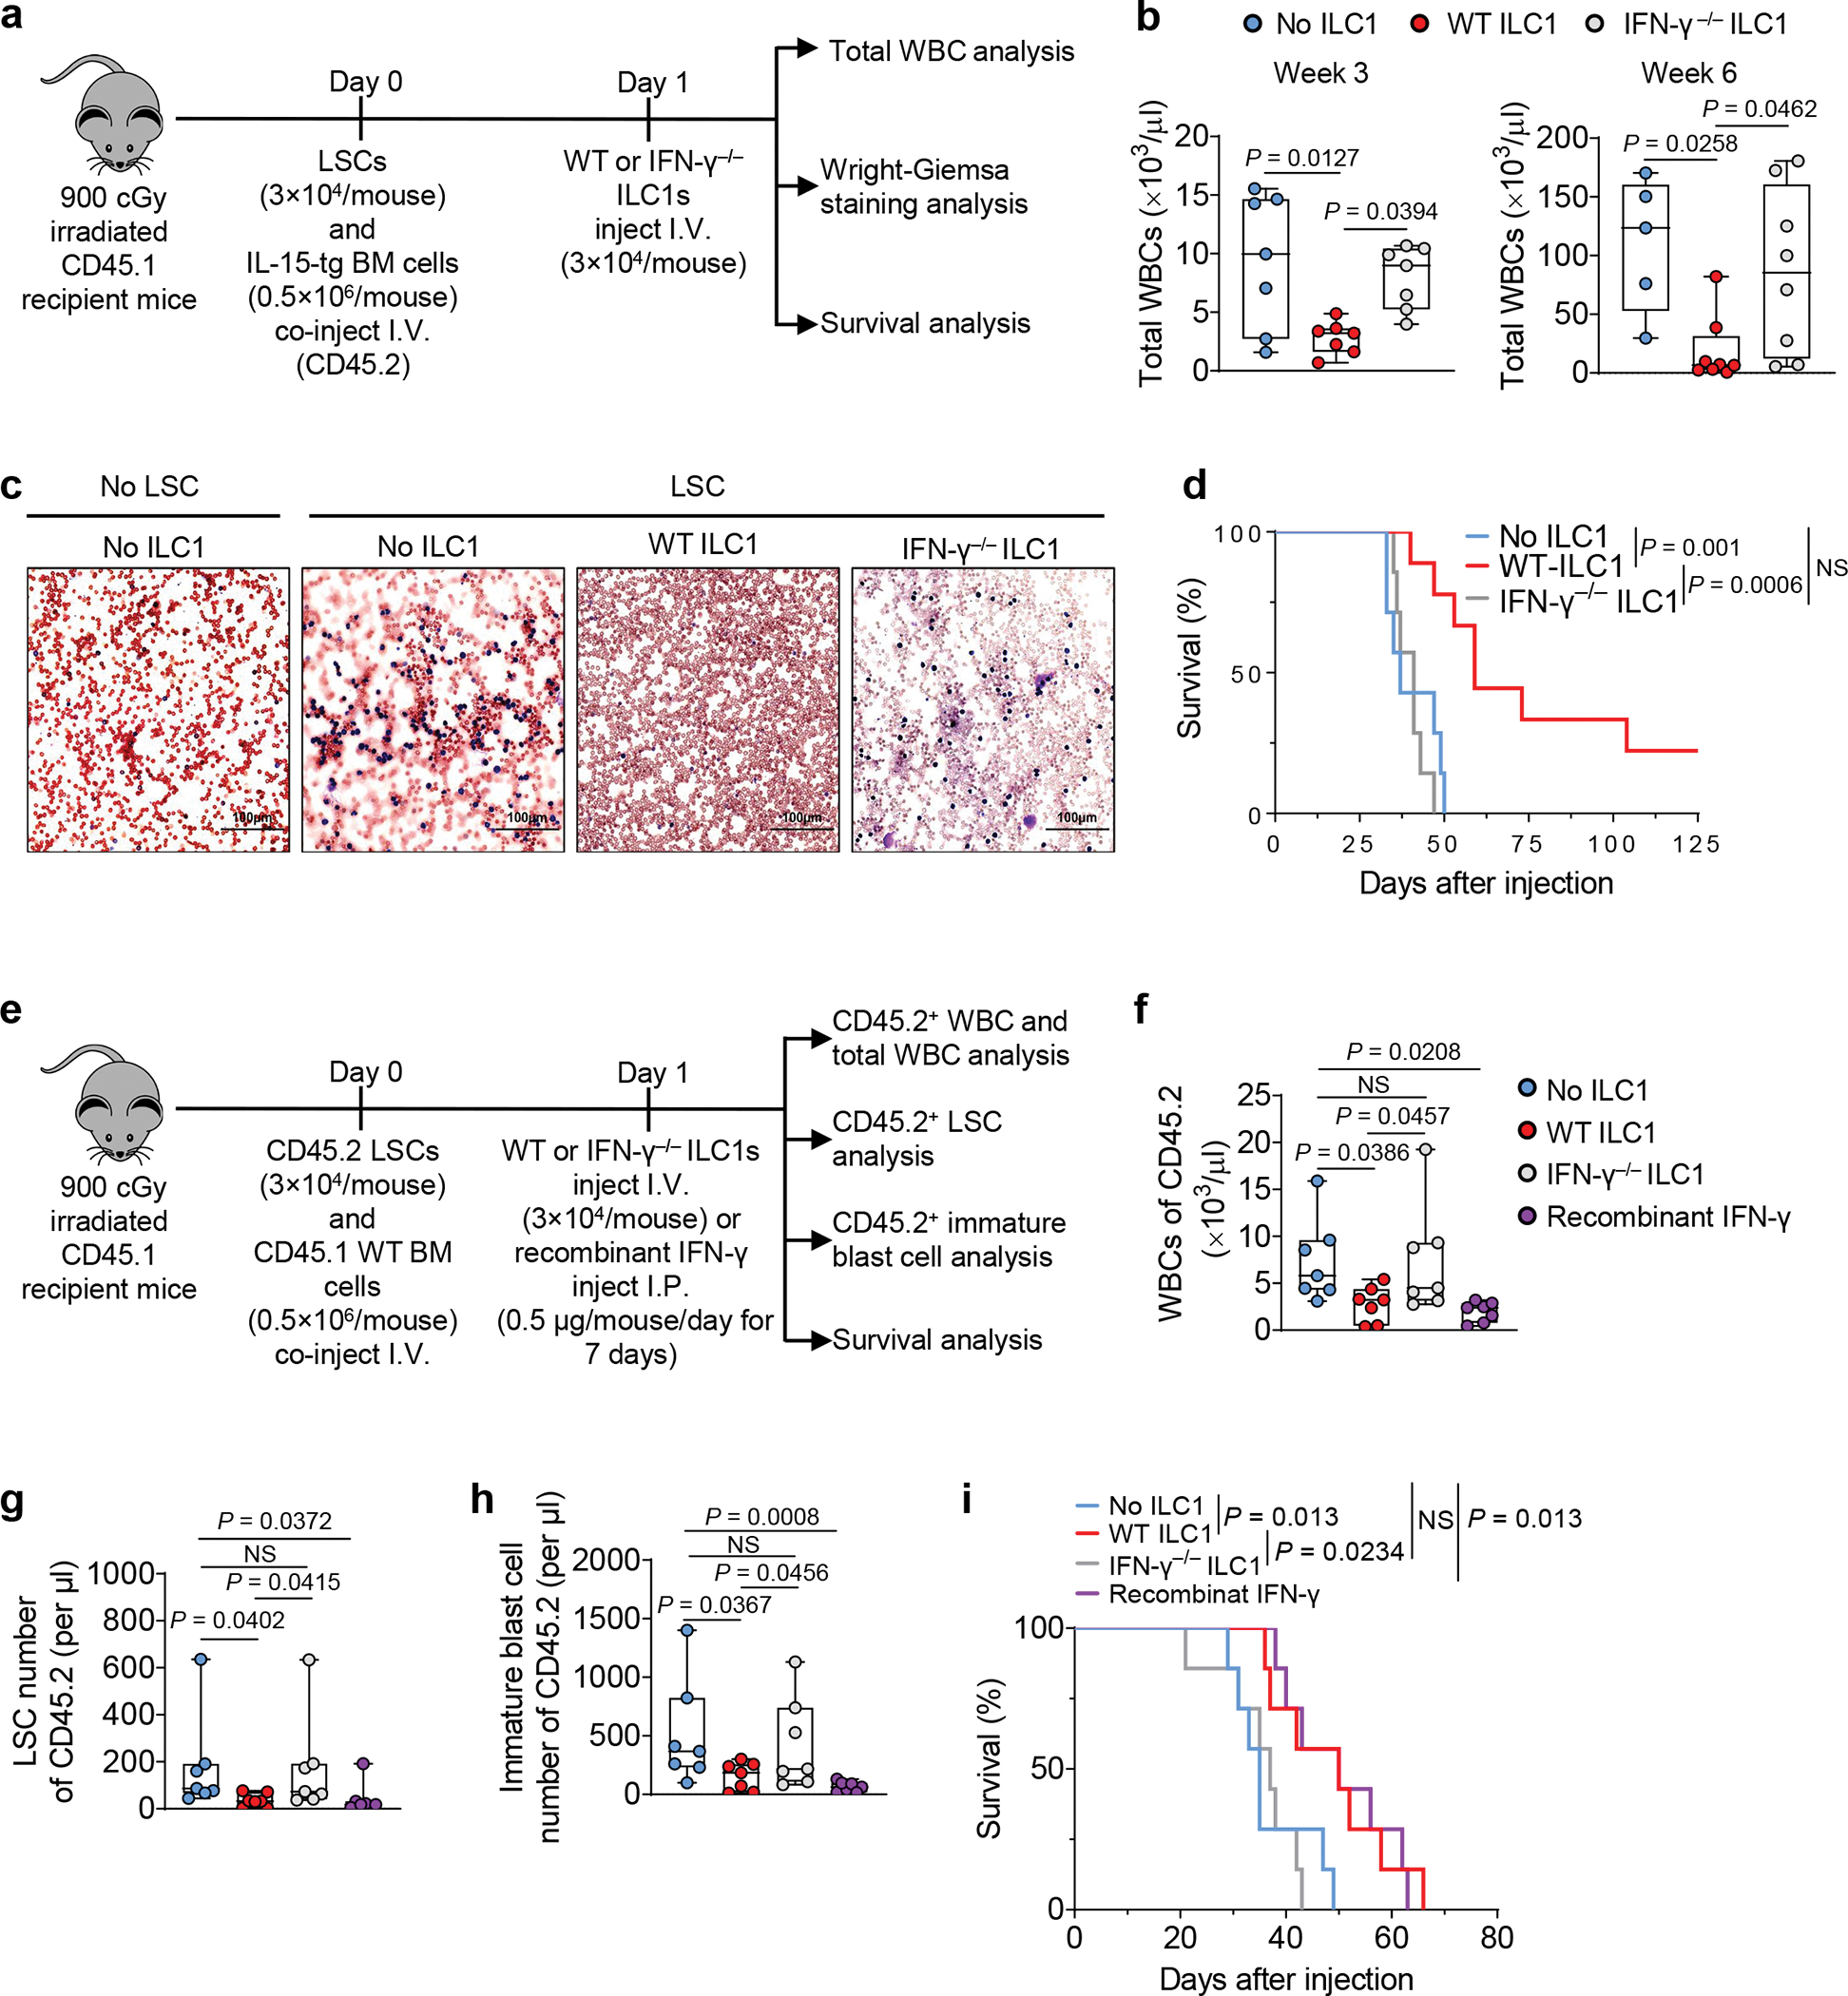
a, Design and procedures for (b-d). Day 0, LSCs plus bone marrow cells from IL-15 transgenic mice (CD45.2) (as support cells) were co-injected into lethally irradiated CD45.2 mice. Day 1, the transplanted mice were treated with CD45.2+ WT or IFN-γ− /− ILC1s. b, Statistics of total WBCs at weeks 3 and 6 (n = 7 individual mice per group in week 3; n = 5 in No ILC1 group, n = 8 in WT ILC1 and IFN-γ−/− ILC1 groups in week 6); c, Representative images of peripheral blood smears (20× magnification, scale bar 100 μm, n = 3 individual mice in No LSC group; n = 4 individual mice in No ILC1, WT ILC1, and IFN-γ−/− ILC1 groups; Red, red blood cells; Blue, nucleated cells or tumor cells). d, Survival of the mice injected with or without WT ILC1s or IFN-γ−/− ILC1s (n = 7 individual mice in No ILC1 and IFN-γ−/− ILC1 groups; n = 9 individual mice in WT ILC1 group). e, Design and procedures for (f-i). Day 0, LSCs were co-injected into lethally irradiated CD45.1 mice along with CD45.1+ bone marrow cells (as support cells). Day 1, mice were injected with WT or IFN-γ− /− ILC1s or injected with IFN-γ for 7 days. f-h, Statistics on the number of CD45.2+ WBCs (f), LSCs (g), and immature blast cells (Mac-1+c-Kit+ cells; h) in the blood of recipient mice (n = 7 individual mice). i, Survival of the mice injected with or without WT ILC1s or IFN-γ−/− ILC1s or treated with IFN-γ (n = 7 individual mice). Data are representative of three (c) or two (b, f, g, and h) independent experiments. The log transformation was used in f-h. Boxplots (b, f, g, and h) display the median and interquartile range (25th percentile –75th percentile) with whiskers representing the upper- and lower-quartile (1.5× the 75th and 25th percentile values), shown as the means ± s.d., and were assessed by one-way ANOVA. Survival data are representative of two independent experiments and were analyzed by Kaplan-Meier survival analysis and log-rank test (d and i). NS, not significant.
However, the above model could not distinguish LSC-derived and IL-15tg BM-derived WBCs. Therefore, co-injected mouse CD45.2+ LSCs from AML mice along with WT CD45.1+ BM support cells into lethally irradiated CD45.1 recipient mice. The next day, we injected WT ILC1s or IFN-γ−/− ILC1s i.v. or IFN-γ intraperitoneally (i.p.) (Fig. 4e). Total WBCs (CD45.1+ and CD45.2+ WBCs), CD45.2+ WBCs, CD45.2+ LSCs, and CD45.2+ immature blast cells (which have been reported to accumulate in AML27) were counted 3 weeks post LSC implantation (Fig. 4e). Donor and host cells were distinguished by flow cytometry using anti-CD45.2 and anti-CD45.1 antibodies (Extended Data Fig. 7b). In this model, we also observed that compared to untreated or IFN-γ−/− ILC1s-treated mice, mice treated with WT ILC1s or IFN-γ had a significantly reduced CD45.2+ WBCs (Fig. 4f) and total WBCs in PB (Extended Data Fig. 7c) and possessed significantly CD45.2+ LSCs and immature blasts (Fig. 4g,h). The treated mice also survived significantly longer than the untreated or IFN-γ−/− ILC1-treated mice (Fig. 4i). Both mouse models indicate that ILC1s and IFN-γ derived from them are sufficient to suppress leukemogenesis in vivo.
ILC1s—but not NK cells—require DNAM-1 and IL-7Rα for LSC-stimulated IFN-γ production
Both ILC1s and NK cells express IFN-γ and thus, we assessed each for their ability to produce IFN-γ in the presence or absence of AML or LSCs. We sorted these two cell types from the liver of healthy mice and AML mice and co-cultured each preparation separately with LSCs. The ILC1s isolated from AML mice produced significantly less IFN-γ than those from healthy mice. This difference was not observed with the NK cells (Fig. 5a). Additionally, healthy ILC1s co-cultured with LSCs produced more IFN-γ than the co-cultured NK cells (Fig. 5a). These results suggest that AML impairs IFN-γ production by liver ILC1s but not by liver NK cells, and that healthy liver ILC1s produce more IFN-γ than healthy liver NK cells when they interact with LSCs. Finally, ILC1s are a critical supplier of IFN-γ and appear to play a more important direct role than NK cells against LSCs.
Fig. 5|. ILC1s produce more IFN-γ than NK cells when interacting with LSCs.
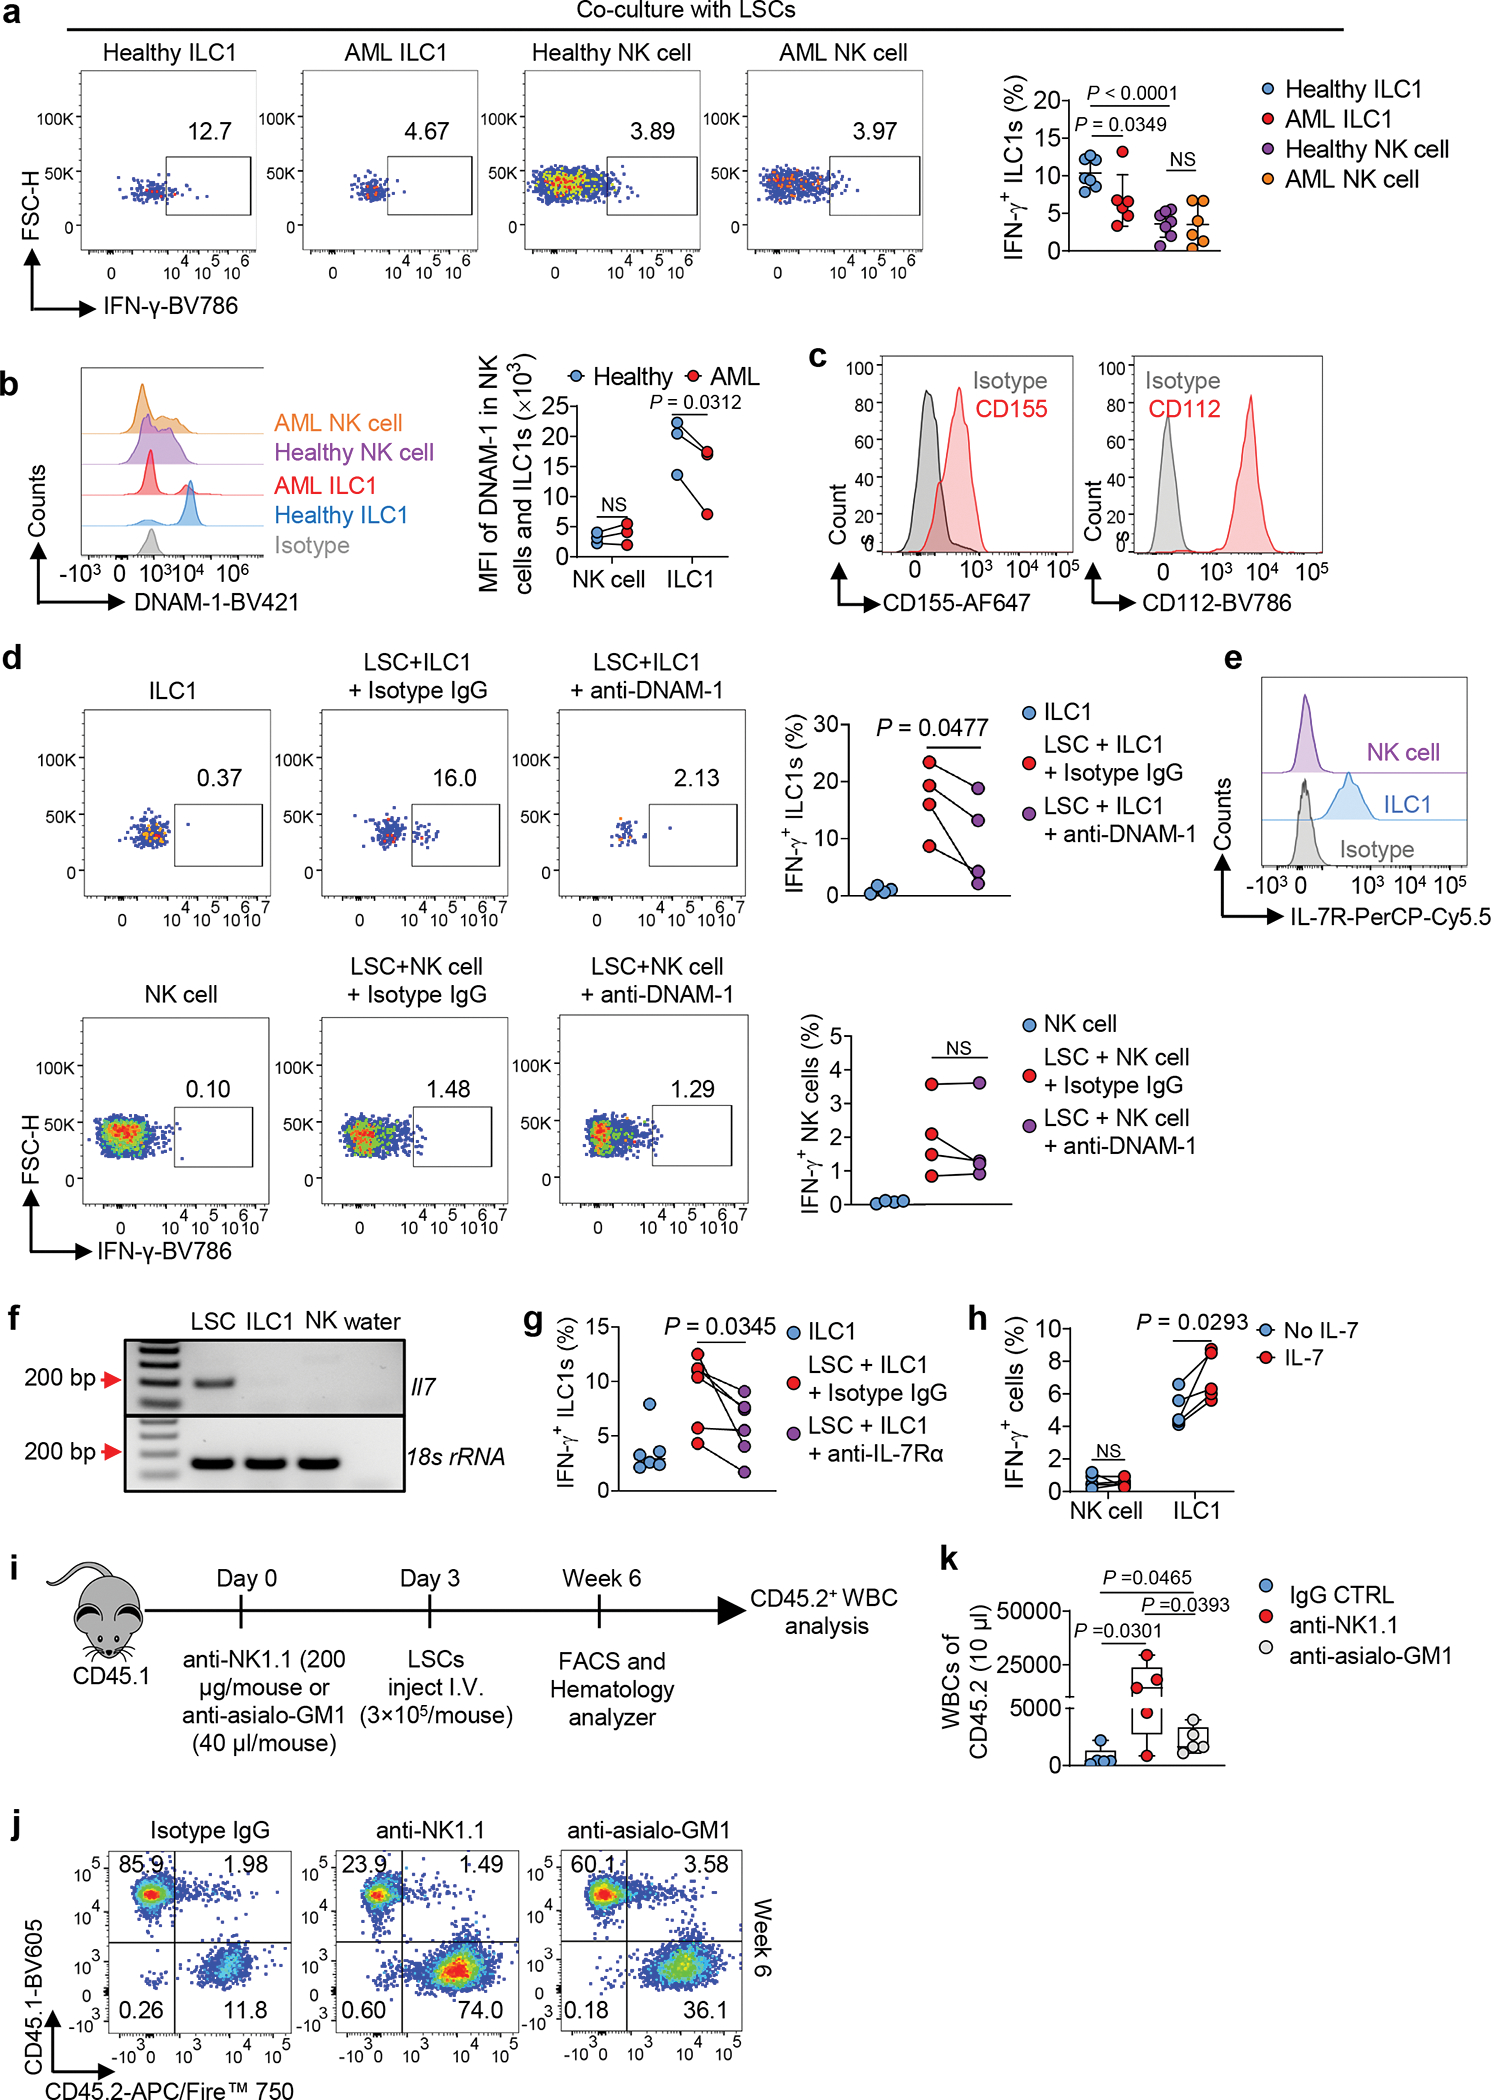
a, Mouse LSCs were co-cultured with or without ILC1s or NK cells in the presence of IL-12 plus IL-15. Representative flow cytometry plots and statistics of IFN-γ+ ILC1s or NK cells (n = 7 individual mice in healthy ILC1 and healthy NK cell groups, n = 6 individual mice in AML ILC1 and AML NK cell groups). b, Representative histograms and statistics of DNAM-1 on ILC1s or NK cells (n = 3 individual mice). c, Representative histograms of CD155 and CD112 on mouse LSCs. d, Representative flow cytometry plots and statistics of IFN-γ+ ILC1s or NK cells after co-cultured with or without LSCs in the presence or absence of an anti-DNAM-1 or isotype IgG control (n = 4 individual mice). e, Expression of IL-7R on liver ILC1s or NK cells. f, RT-PCR analysis of mouse Il7 mRNA expression in LSCs, ILC1s, and NK cells. g, Healthy ILC1s or NK cells were co-cultured with or without LSCs in the presence or absence of an anti-IL-7R or isotype IgG. Statistics of IFN-γ+ ILC1s (n = 6 individual mice). h, Percentages of IFN-γ+ cells in ILC1s or NK cells after treatment with or without IL-7 in the presence of IL-12 plus IL-15 (n = 5 individual mice). i, Overall experimental design for (j-l). j, Representative flow cytometry plots of the percentages of CD45.1 and CD45.2 cells. k, Statistical analysis of CD45.2+ WBC numbers (n = 5 individual mice). Boxplots display the median and interquartile range (25th percentile –75th percentile) with whiskers representing the upper- and lower-quartile (1.5× the 75th and 25th percentile values). Data are representative of two (c, e, f, j, and k) or three (a, d, g, and h) independent experiments. Data are presented as mean ± s.d. and were assessed by unpaired (a) and paired (b, d, g, and h) Student’s t tests (two-tailed), or one-way ANOVA (k). NS, not significant.
Our previous data showed that ILC1s need cell–cell contact with LSCs to produce IFN-γ (Fig. 1o). This led us to identify receptors and ligands required for the effector and target cells to interact. The activating receptor DNAM-1 is expressed more highly on ILC1s than on NK cells and is critical for IFN-γ production6, 28. We confirmed that the receptor was differentially expressed on these two types of innate immune cells and further showed that DNAM-1 expression on AML ILC1s was significantly downregulated compared to its expression on healthy ILC1s but not on NK cells (Fig. 5b). We also discovered that both ligands of DNAM-1—CD155 and CD112—were highly expressed on LSCs (Fig. 5c). Thus, we hypothesized that ILC1s recognize LSCs at least partially through DNAM-1. As expected, DNAM-1 neutralizing antibody significantly blocked the production of IFN-γ in healthy ILC1s but not in healthy NK cells (compared to the control without DNAM-1 neutralizing antibody) (Fig. 5d). That blockade was only partial, however, so we searched for an additional mechanism underlying the interaction of ILC1s with LSCs. We focused on IL-7 receptor α (IL-7Rα), which is expressed during the development and maturation of all ILC subsets, including ILC1s, but is not expressed on liver NK cells 29. Likewise, IL-7 plays an important role in the development of ILC1s but not NK cells7. Similarly, we observed high expression of IL-7R on liver ILC1s but not on liver NK cells (Fig. 5e). We also discovered that LSCs produced IL-7 (Fig. 5f). Therefore, we suspected that the IL-7–IL-7R signaling pathway upregulates IFN-γ in ILC1s from healthy mice that were co-cultured with LSCs, as recently described in a non-cancer, liver-injury model6. Indeed, blockading IL-7–IL-7R signaling with an IL-7R neutralizing antibody downregulated the production of IFN-γ in ILC1s from healthy mice—but not in NK cells—after interaction with LSCs (Fig. 5g and Extended Data Fig. 8a). On the other hand, treatment with IL-7 significantly increased IFN-γ production in ILC1s but not in NK cells of healthy mice (Fig. 5h and Extended Data Fig. 8b). These results indicate that LSCs’ cognate ligands to DNAM-1 and IL-7R induce more potent IFN-γ in healthy ILC1s compared to NK cells, which in turn assists ILC1s in becoming more effective suppressors of leukemia.
ILC1s collaborate with NK cells to control LSCs in vivo
The above results do not exclude that liver NK cells are potent against LSCs, as their co-culture enhanced LSC apoptosis to some extent (Extended Data Fig. 8c–f). However, IFN-γ neutralizing antibody did not affect their action, suggesting that, unlike ILC1s, the induction of LSC apoptosis by liver NK cells is not occurring primarily through IFN-γ (Extended Data Fig. 8c–f).
To evaluate whether NK cells would slow the progression of AML in vivo, we i.p. injected anti-NK1.1 antibody (resulting in depletion of both NK cells and ILC1s) or an optimized dose of anti-asialo GM1 antibody (resulting in depletion of NK cells alone)6 into immunocompetent recipient CD45.1 mice (Fig. 5i and Extended Data Fig. 8g). Three days later, we isolated LSCs from the spleen of CD45.2 MllPTD/WT: Flt3ITD/ITD mice with AML and, i.v. injected CD45.2 LSCs into the mouse depletion model. The preferential depletion of NK cells resulted in a small but significant increase in LSC-derived WBC counts when compared to non-depletion, while depletion of both ILC1s and NK cells produced a ~20-fold increase in WBC cells when compared to IgG control and >6-fold increase when compared to the anti-asialo GM1 antibody group with NK depletion alone (Fig. 5j–k).
The JAK-STAT and PI3K-AKT signaling in LSCs exploited by ILC1s or IFN-γ
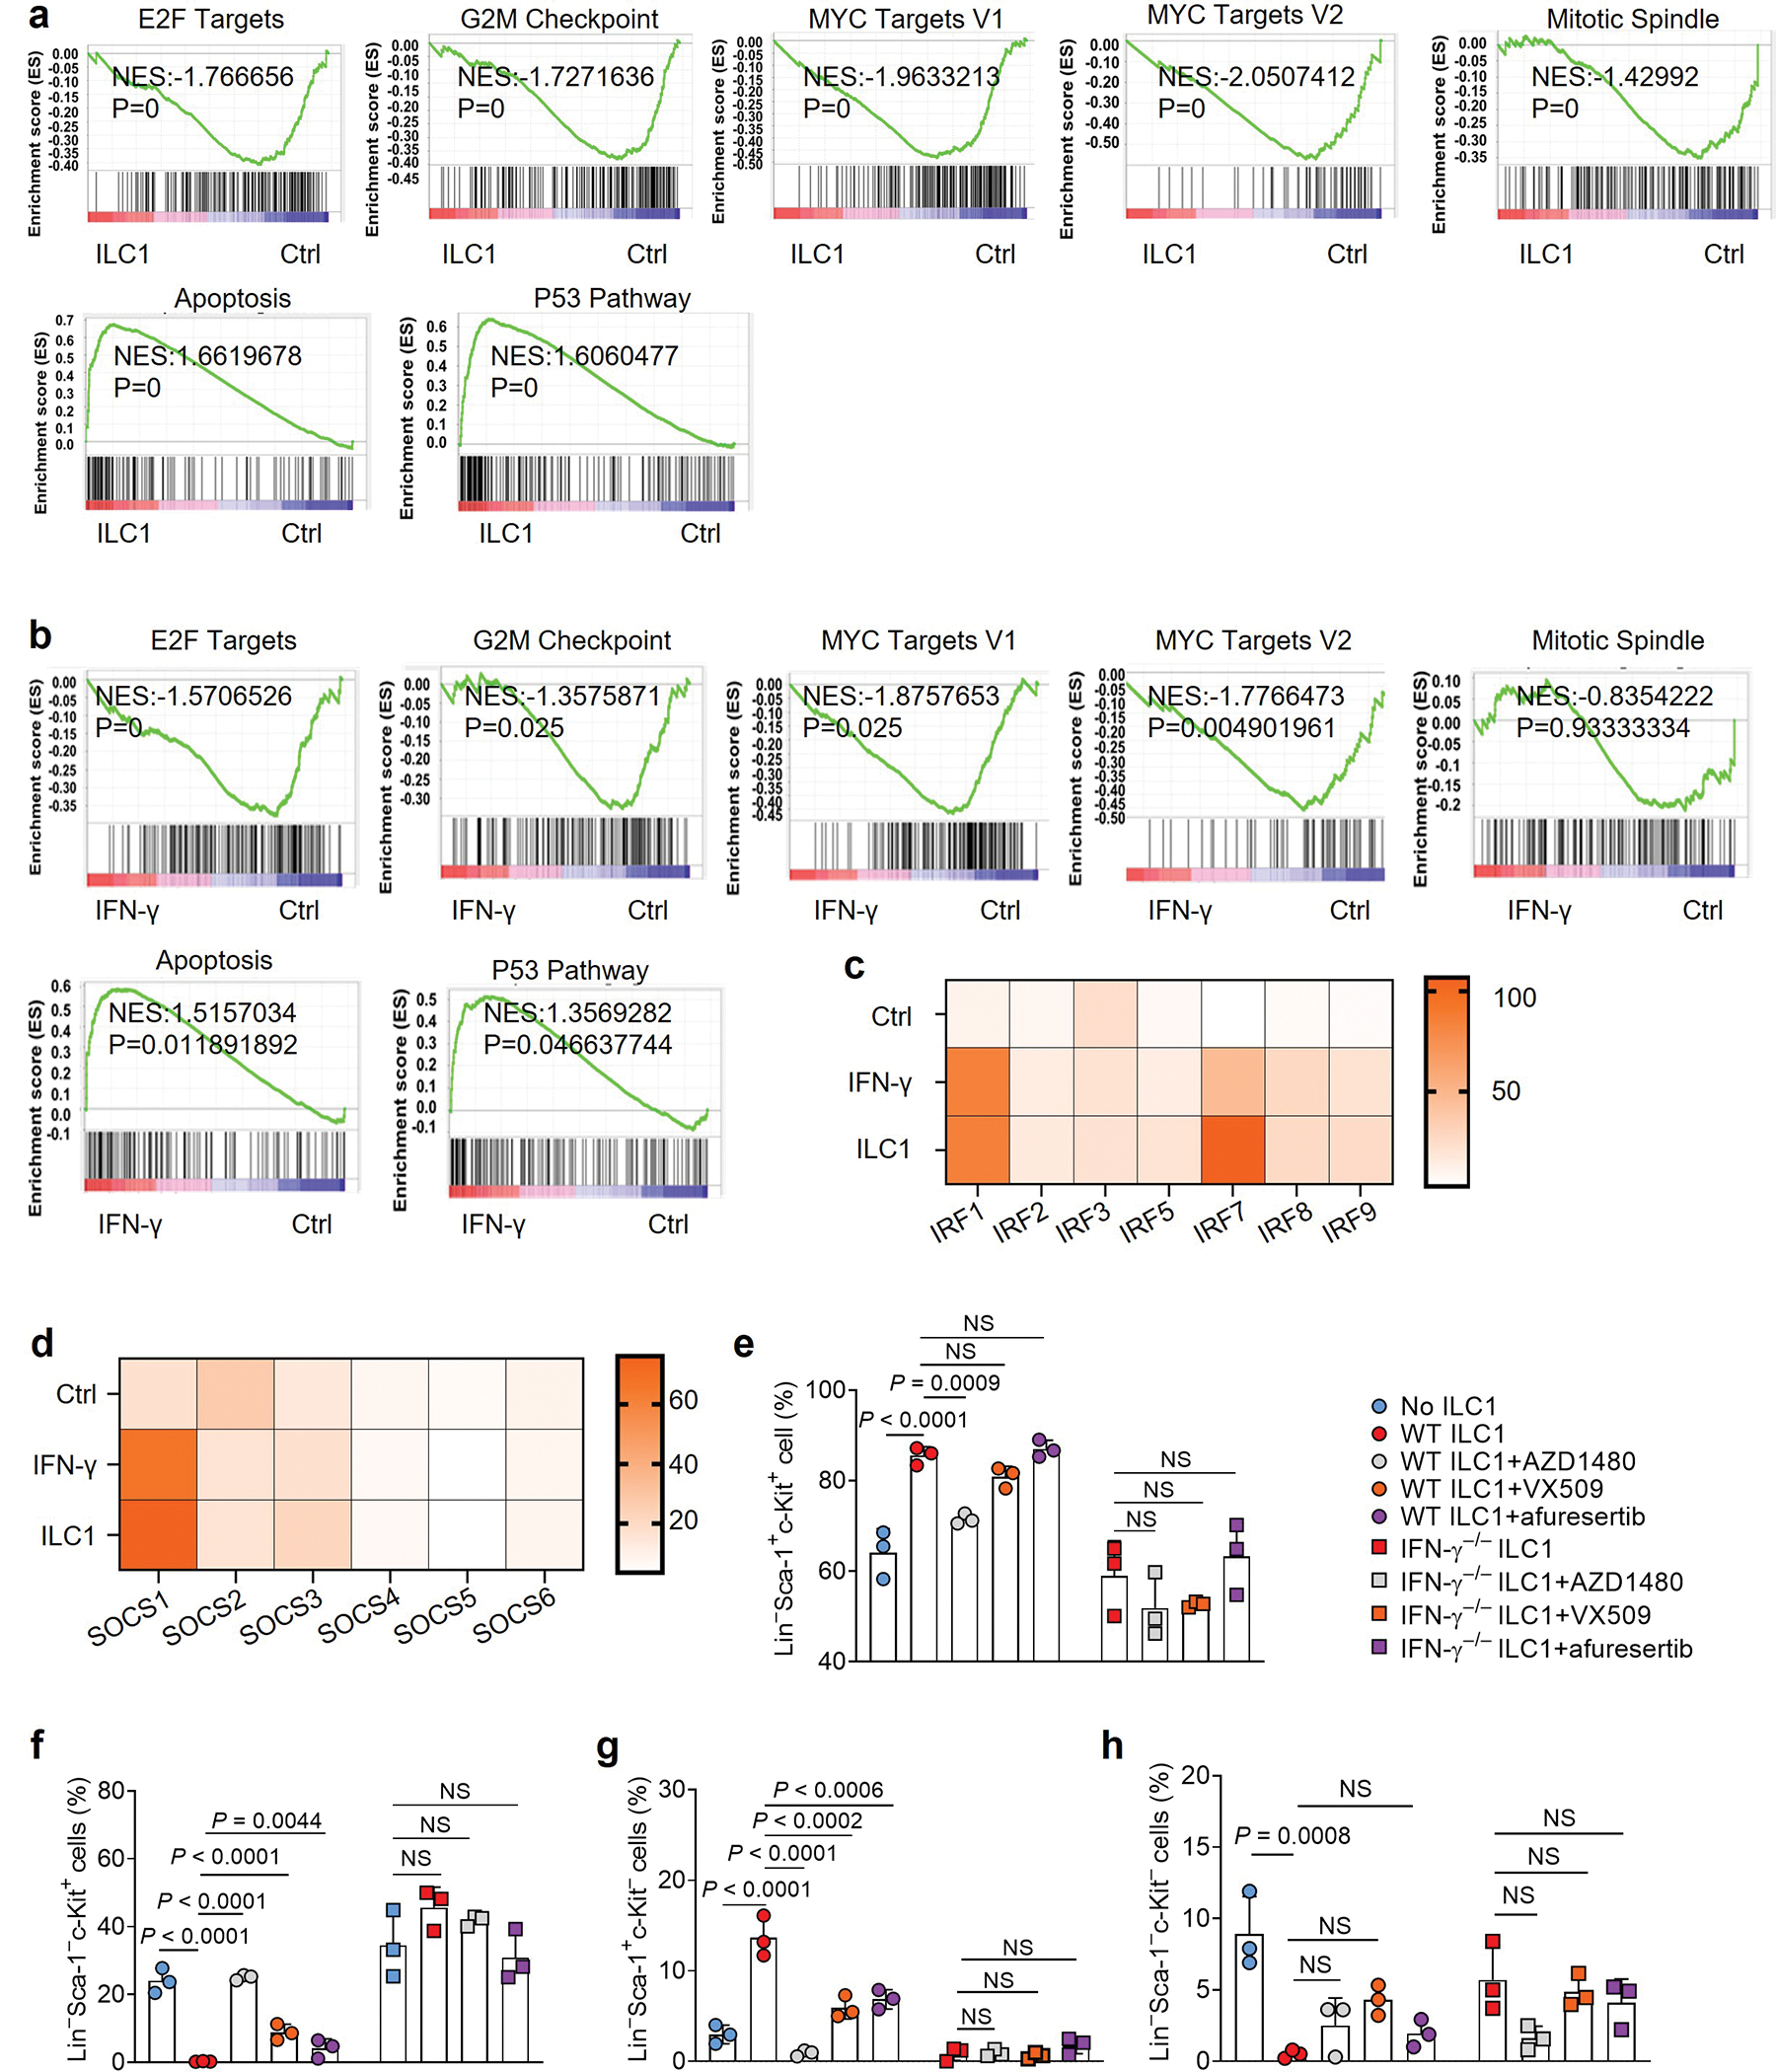
To uncover the mechanisms by which ILC1s regulate LSCs, we conducted RiboZero RNA-seq analysis of LSCs co-cultured with or without ILC1s isolated from healthy mice or mouse IFN-γ. Of note, after ILC1–LSC co-culture, we separated the LSCs from the ILC1s using FACS (Extended Data Fig. 9a,b). Subsequent RNA-seq revealed that, compared with untreated LSCs, the LSCs co-cultured with ILC1s had 445 significantly upregulated genes and 93 downregulated genes. In LSCs treated with IFN-γ, 320 genes were significantly upregulated and 82 downregulated (Extended Data Fig. 9c). Furthermore, LSCs co-cultured with ILC1s or IFN-γ had a large number of upregulated and downregulated genes in common (Fig. 6a and Extended Data Fig. 9d,e), supporting our conclusion that ILC1s regulate LSCs by producing IFN-γ. Among the upregulated LSC genes unique to the ILC1–LSC co-culture, 3 of the top 10 were chemokines (Ccl3, Ccl4, and Xcl1) (Extended Data Fig. 9f), suggesting that the interaction of ILC1s with LSCs may recruit additional immune cells into the tumor microenvironment (TME) to suppress the development of AML. Using gene set enrichment analysis (GSEA), we identified the top 10 pathways associated with those upregulated and downregulated genes (Fig. 6b and Extended Data Fig. 9g). LSCs co-cultured with ILC1s or IFN-γ activated apoptotic pathways in LSCs while significantly suppressing E2F targets, G2M checkpoints, MYC targets, and mitotic spindle pathways (Extended Data Fig. 10a,b), consistent with our finding that ILC1-secreted IFN-γ increased LSC apoptosis. Additionally, after co-culture with ILC1s or IFN-γ, LSCs showed activation of JAK-STAT and PI3K-AKT signaling (Fig. 6c) and increased expression of Akt3, Jak2, Stat1/2, Irf1/2/7/8/9, and suppressor of cytokine signaling 1 (Socs1), all of which are downstream of IFN-γ signaling30 (Fig. 6d–f and Extended Data Fig. 10c,d). This unbiased analysis strengthened our conclusion that ILC1s regulate LSCs via IFN-γ. It also suggests that ILC1s or their secreted IFN-γ utilize JAK-STAT or PI3K-AKT signaling to regulate LSCs. To confirm this, we pretreated LSCs for 30 min with inhibitors of signaling components involved in these two pathways; then we co-cultured them with WT ILC1s or IFN-γ−/− ILC1s. Compared to co-culture with ILC1s alone, the JAK2 inhibitor AZD1480 or the JAK1/2/3 inhibitor VX-509 combined with ILC1s significantly increased LSC differentiation into LS−K+ leukemic progenitor cells and decreased their differentiation into non-leukemic LS+K− cells. There was no significant alteration in Lin−Sca-1−c-Kit− cell population (Fig. 6g–k and Extended Data Fig. 10e–h). Predictably, the two JAK inhibitors did not affect LSCs co-cultured with IFN-γ−/− ILC1s. We obtained similar results using afuresertib, an AKT inhibitor (Fig. 6g,h and Extended Data Fig. 10e–h). These data suggest that ILC1-derived IFN-γ regulates the differentiation of LSCs through JAK-STAT or PI3K-AKT signaling.
Fig. 6|. ILC1-derived IFN-γ inhibits LSC differentiation via JAK-STAT and PI3K-AKT signaling.
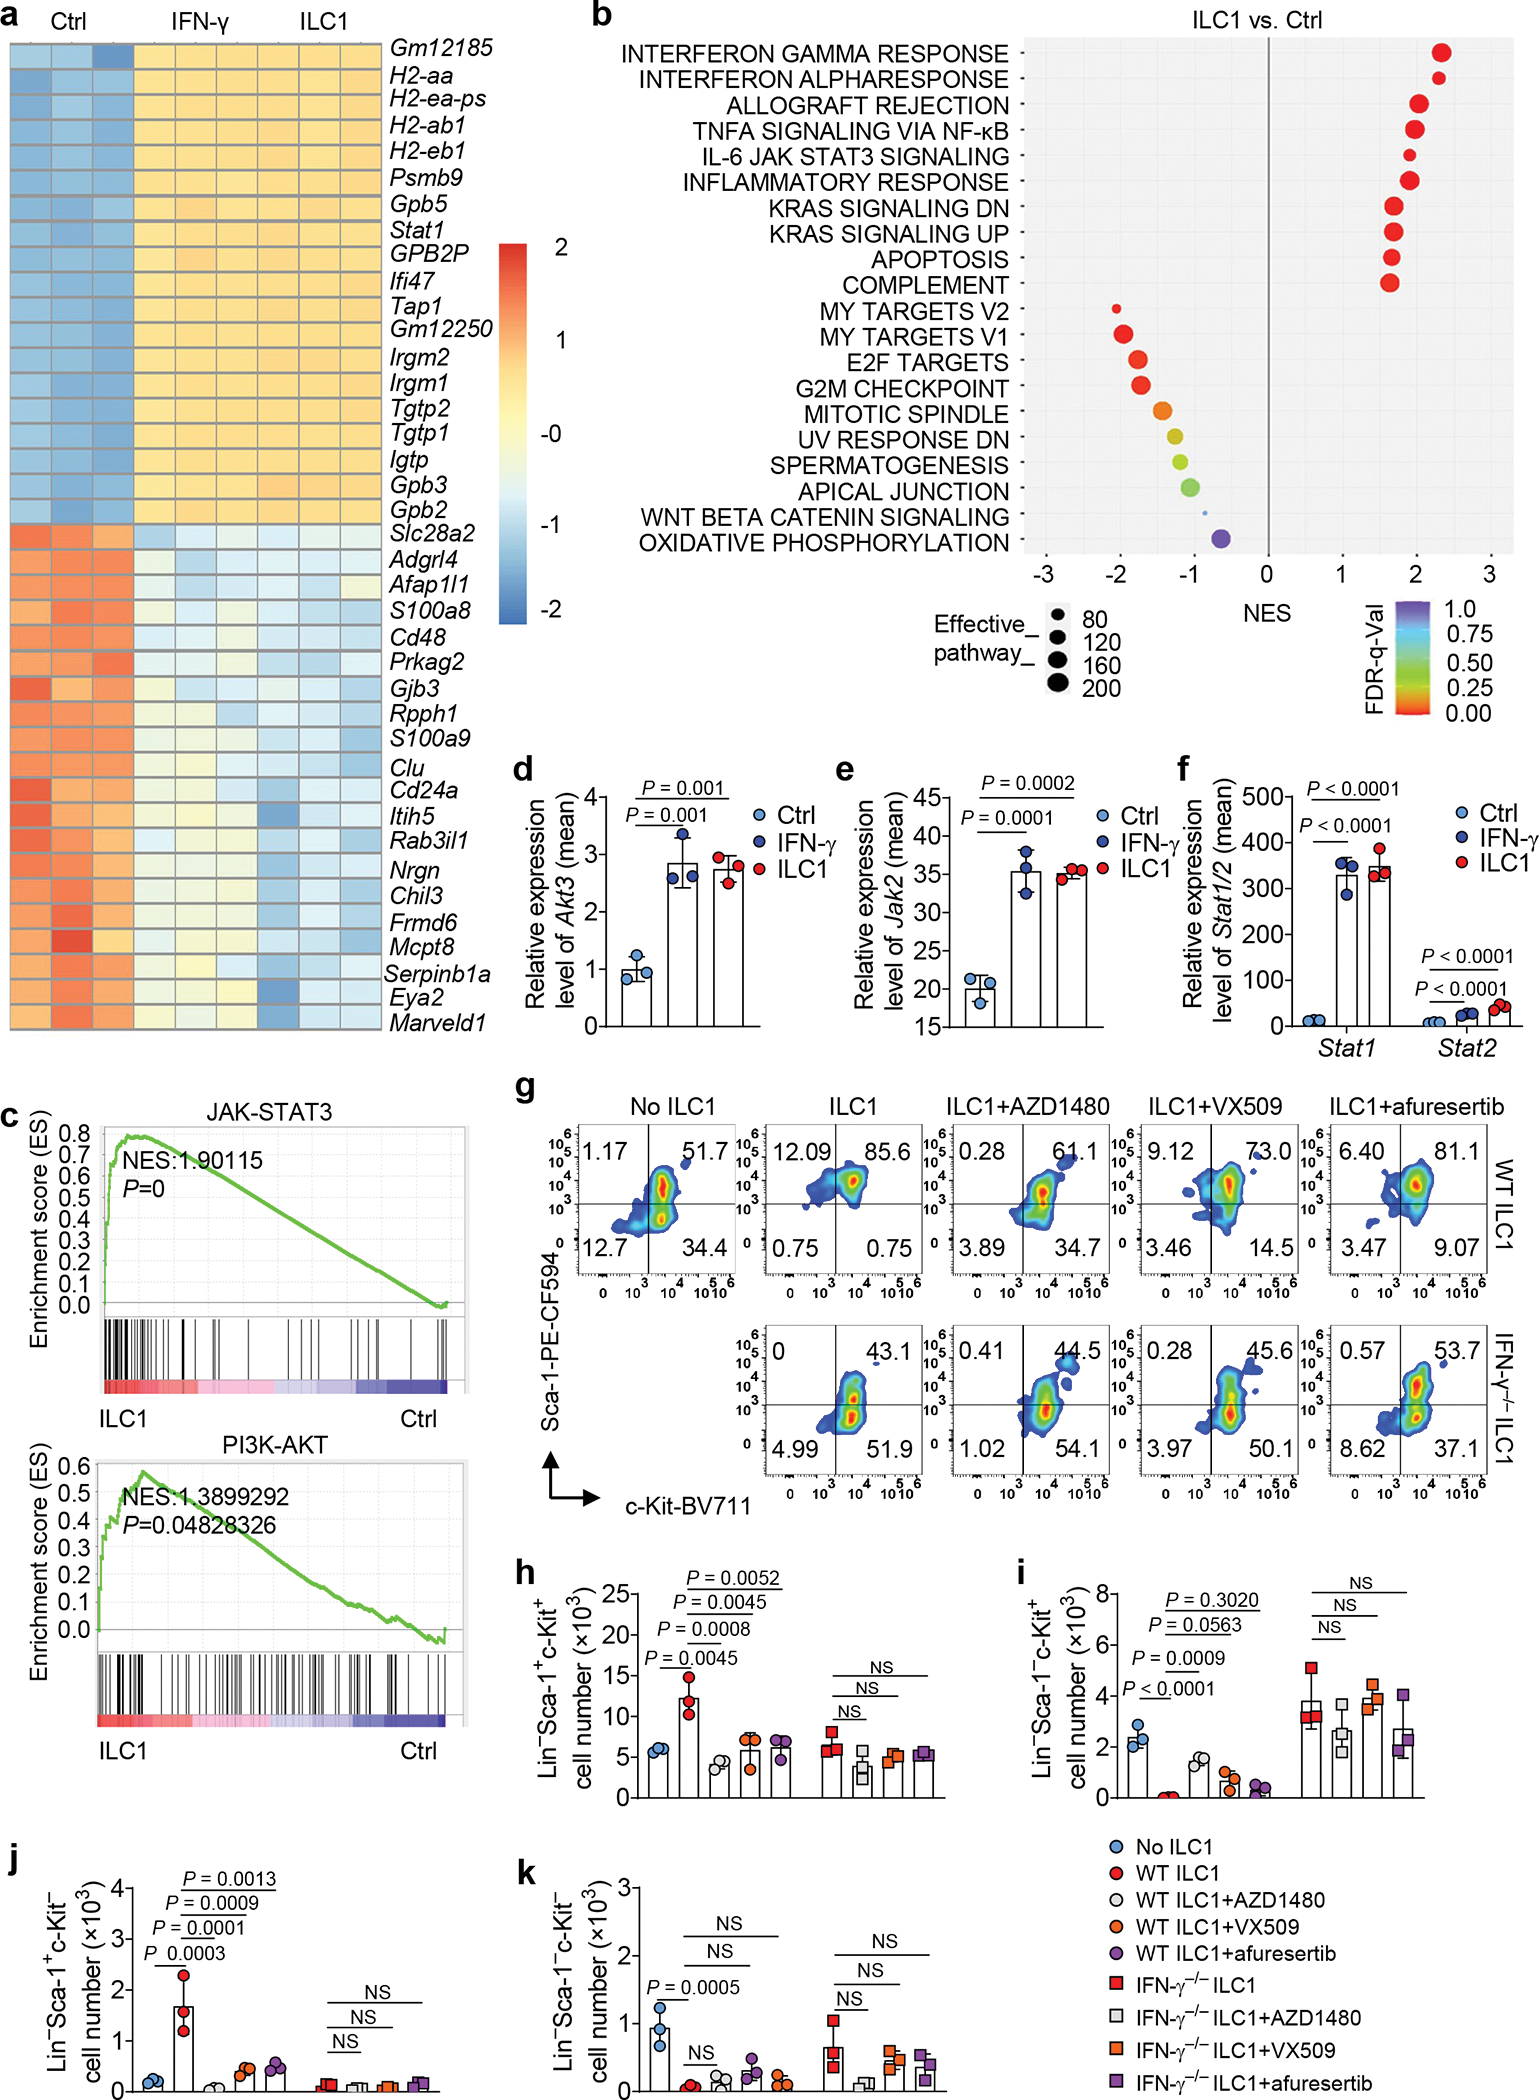
a, Mouse LSCs were co-cultured with or without ILC1s or IFN-γ for 3 days. LSCs were separated from co-cultured ILC1s using FACS before RNA-seq. Heatmap showing RNA differential expression of the top 20 upregulated and downregulated genes (n = 3 individual mice). b, Hallmark pathway analysis in LSC RNA pools (ILC1-treated vs. untreated Ctrl). Left panel shows signaling pathways downregulated in LSCs. Right panel shows signaling pathways upregulated in LSCs (n = 3 individual mice). c, Gene Set Enrichment Analysis (GSEA) plots showing enrichment of selected target genes in LSCs co-cultured with ILC1s. The rank orders (ILC1 vs. Ctrl) of all the genes (n = 3 individual mice) are shown on the X-axis. d-f, Differential expression of RNA from Akt3 (d), Jak2 (e), and Stat1, and Stat2 (f) genes. Results are expressed as means compared with the Ctrl (n = 3 individual mice). g-k, Mouse LSCs were treated with or without the indicated JAK and AKT inhibitors for 30 min and then co-cultured with or without WT or IFN-γ−/− ILC1s in the presence of IL-12 plus IL-15 for 3 days. Representative flow cytometry plots (g) and statistics of absolute cell numbers (h-k) of Lin− Sca-1+c-Kit+, Lin− Sca-1− c-Kit+, Lin− Sca-1+c-Kit−, and Lin−Sca-1−c-Kit− cells are shown (n = 3 individual mice). Data in g, h, i, j, and k are representative of three independent experiments and are presented as mean ± s.d. and were assessed by one-way ANOVA models. NS, not significant.
ILC1s become less able to target LSCs in AML
Our data showed that ILC1s isolated from the liver of AML mice produced less IFN-γ and TNF than ILC1s isolated from healthy mice (Extended Data Fig. 1d). To determine whether ILC1s in AML are less able to target LSCs, we sorted ILC1s from the liver of healthy mice and from the liver of AML mice, and co-cultured each of them with splenic LSCs isolated from the AML for 3 days. ILC1s isolated from AML mice were less able to lyse LSCs compared to ILC1s from healthy mice (Fig. 7a), resulting in increased LSC viability (Fig. 7b). We obtained similar results when we compared ILC1s from patients with AML with those from healthy donors (Fig. 7c,d). Thus, healthy ILC1s co-cultured with LSCs produced significantly more IFN-γ than AML ILC1s (Fig. 7e). Compared to healthy ILC1s, AML ILC1s also induced less LSC differentiation into Lin−Sca-1+c-Kit− non-leukemic cell and were less able to suppress LSC differentiation into Lin−Sca-1−c-Kit+ leukemia progenitor cells (Fig. 7f–h). However, when the IFN-γ neutralizing antibody was added to the culture, healthy mouse ILC1s and AML ILC1s were similarly ineffective against LSCs (Fig. 7f–h). These data suggest that the anti-leukemic function of ILC1s in humans with AML is as impaired as it is in mice.
Fig. 7|. ILC1s are functionally impaired in AML.
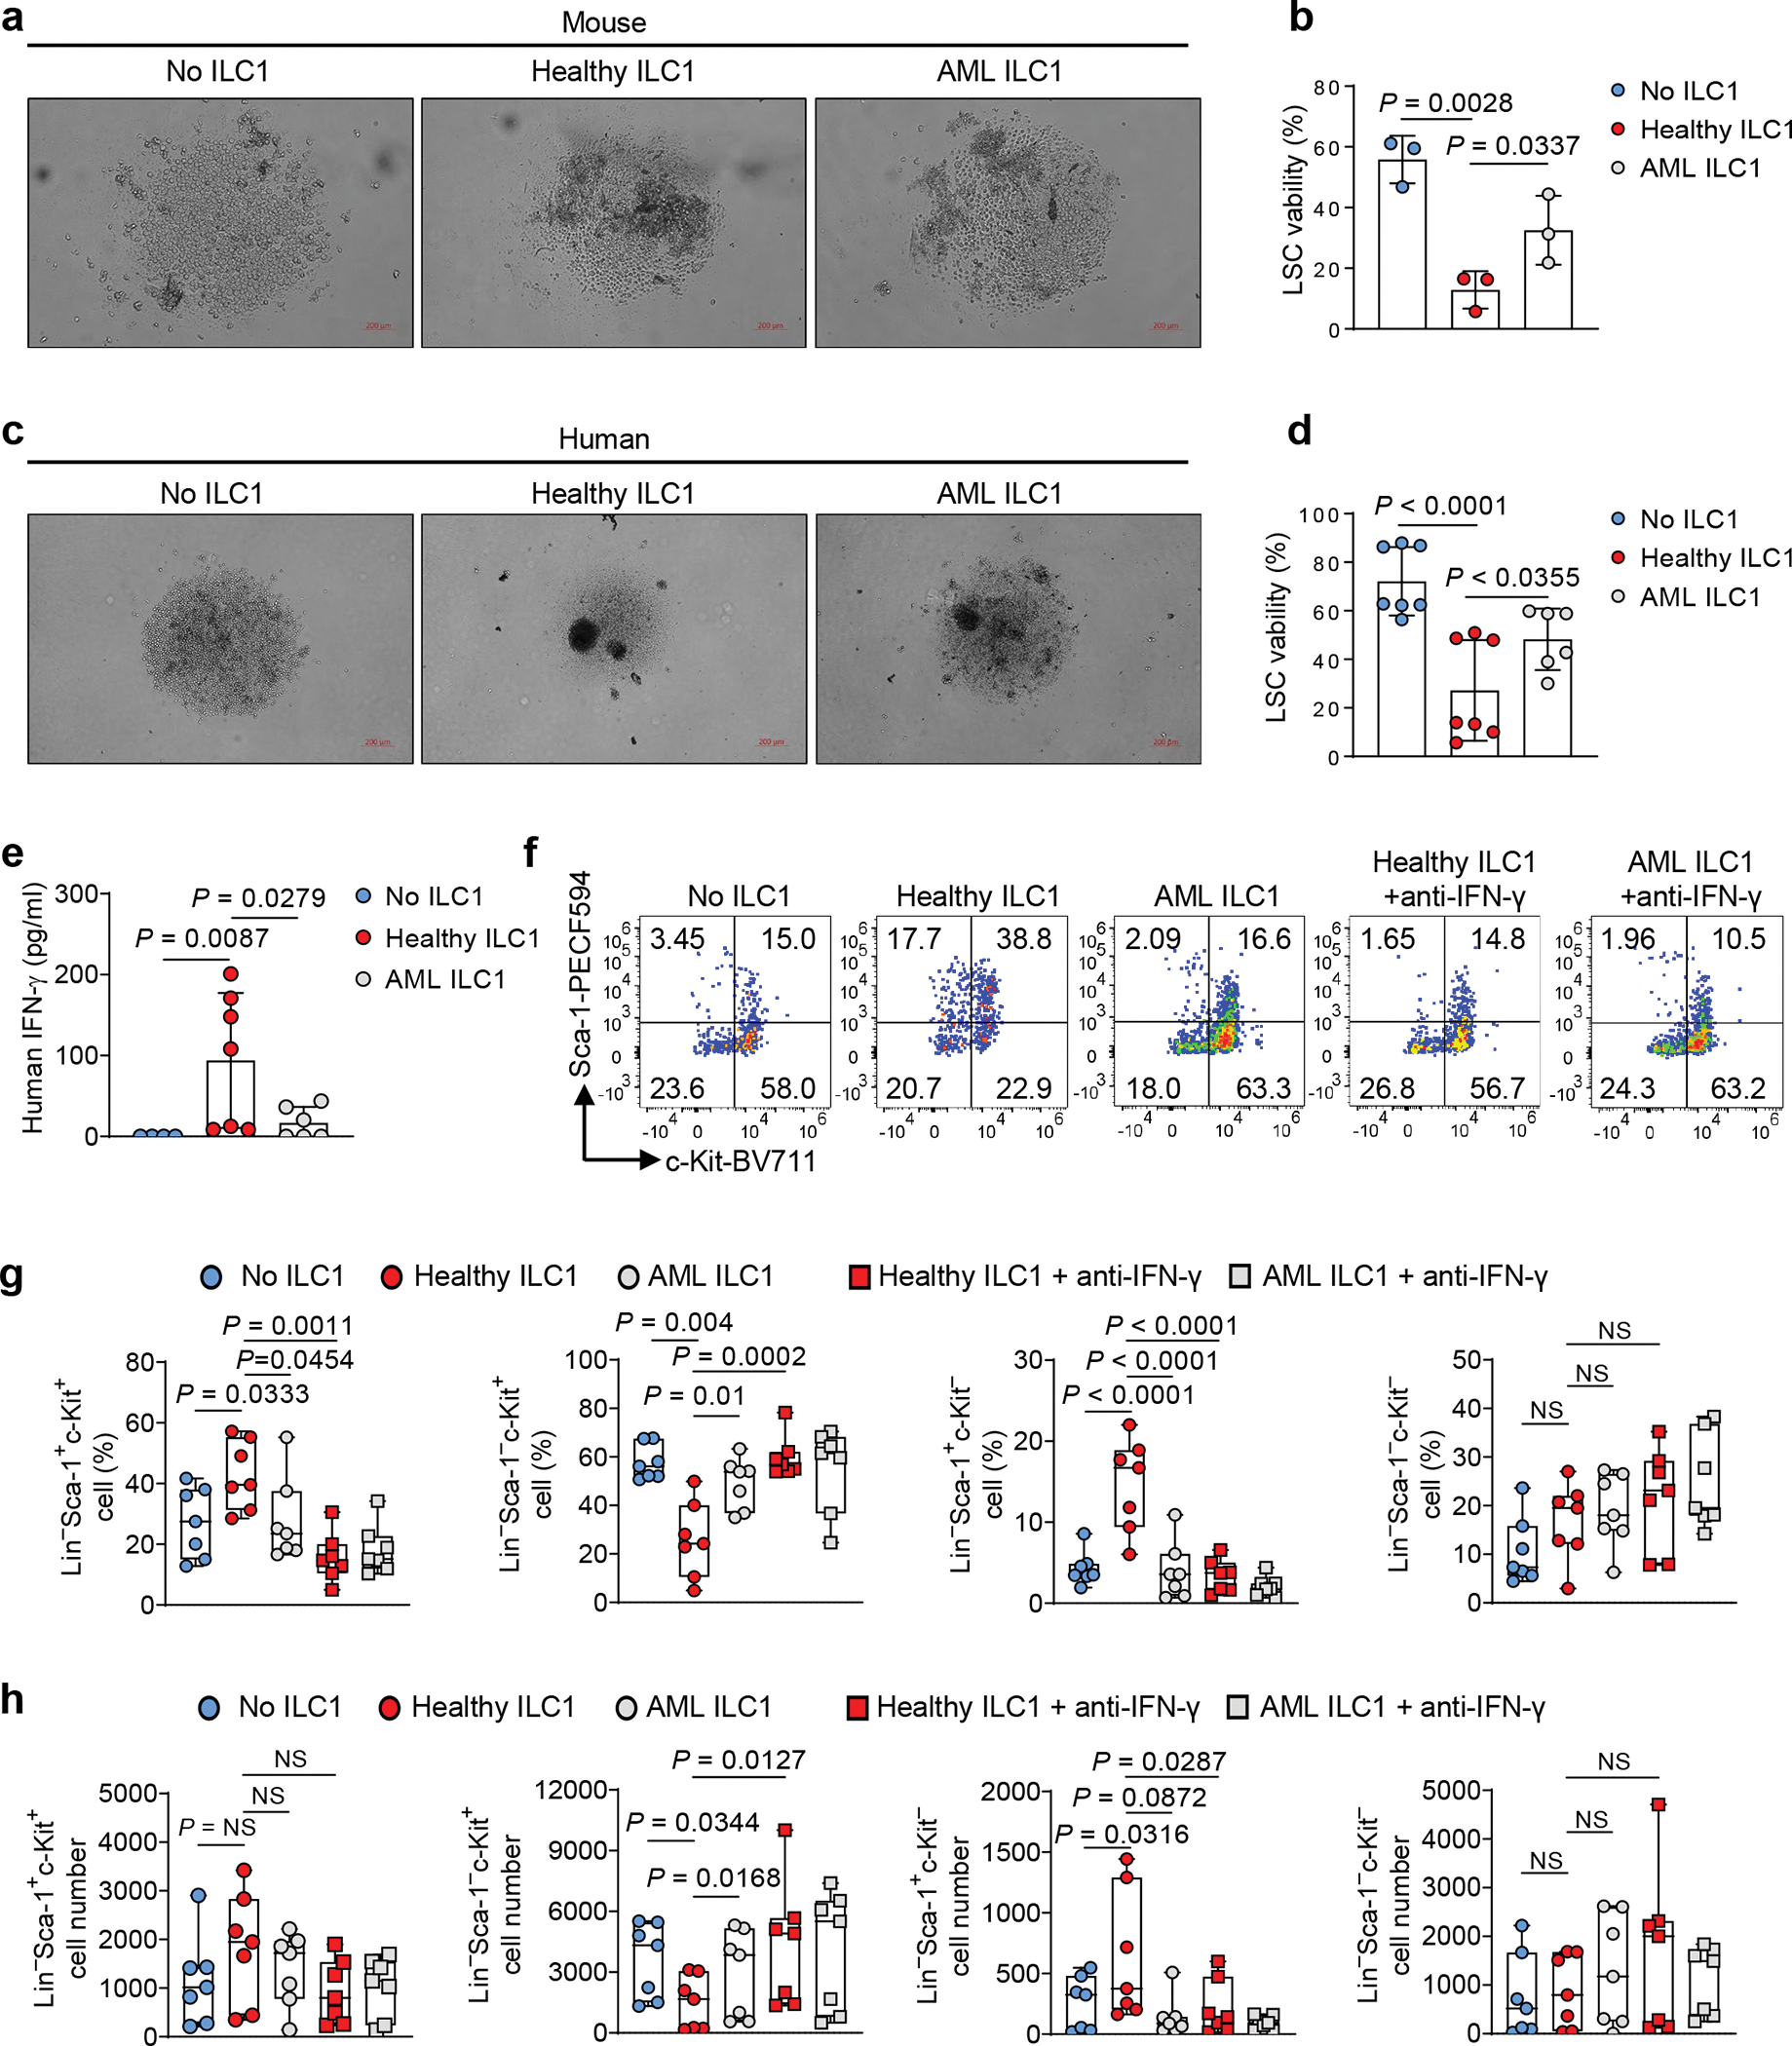
a, Mouse LSCs were co-cultured with or without ILC1s isolated from healthy mice (Healthy ILC1) or MllPTD/WT: Flt3ITD/ITD mice with AML (AML ILC1). Representative images of apoptotic LSCs (5× magnification, scale bar 200 μm, n = 3 individual mice). b, Statistics of the percentages of viable of LSCs (n = 3 individual mice). c, Human LSCs from peripheral blood of patients with AML were co-cultured with or without ILC1s isolated from healthy donors (Healthy ILC1) or patients with AML (AML ILC1). Representative images of apoptotic LSCs (5× magnification, scale bar 200 μm, n = 3 individual donors). d, Statistics of the percentages of viable human LSCs (n = 7 individual donors in No ILC1 group and healthy ILC1 group; n = 6 individual donors in AML ILC1 group). e, Supernatants from LSCs co-cultured with or without healthy ILC1s or AML ILC1s were collected and subjected to ELISA to determine levels of IFN-γ (n = 7 individual donors in No ILC1 group and healthy ILC1 group; n = 6 individual donors in AML ILC1 group). f-h, Mouse LSCs were co-cultured with or without healthy ILC1s or AML ILC1s in the presence or absence of anti-IFN-γ for 3 days. Representative flow cytometry plots of the percentages (f) and statistics of the percentages (g) and absolute cell numbers (h) of Lin−Sca-1+c-Kit+, Lin−Sca-1− c-Kit+, Lin−Sca-1+c-Kit−, and Lin−Sca-1−c-Kit− cells are shown (n = 7 individual mice). Data are representative of two independent experiments (a, b, f, g, and h) or pooled from three independent experiments (d and e) and presented as mean ± s.d., and were assessed by one-way ANOVA models. The log transformation was used in g-h. Boxplots (g and h) display the median and interquartile range (25th percentile –75th percentile) with whiskers representing the upper- and lower-quartile (1.5× the 75th and 25th percentile values). NS, not significant.
Discussion
ILC1s play critical roles in inflammation and the early anti-viral response9, 31. However, their role in preventing and/or promoting cancer, including AML, has not been explored. We showed that the progression of AML can be controlled by healthy ILC1s interacting with LSCs. ILC1s have dual roles in regulating LSCs in AML: 1) ILC1s induce apoptosis of LSCs at high effector to target ratios; 2) At a lower dose of effector cells, ILC1s suppress the differentiation of LSCs into leukemia progenitor cells and then to myeloid blasts while facilitating the differentiation of LSCs into non-leukemic cells. However, ILC1s do not affect the apoptosis and differentiation of HSCs. Mechanistically, although both IFN-γ and TNF are secreted by ILC1s, IFN-γ mediates ILC1s to act on LSCs via JAK-STAT or PI3K-AKT signaling. Additionally, ILC1s produce higher levels of IFN-γ to control LSCs than do NK cells when DNAM-1 and IL-7Rα expressed on ILC1s interact with their cognate ligands expressed on LSCs. Thus, ILC1s may normally perform critical surveillance by spotting and destroying LSCs; consequently, a dysfunction in this innate immune cell population can facilitate tumorigenesis.
In relapsed AML, a small population of LSCs is resistant to standard chemotherapy32. Elucidating the mechanism(s) of LSC resistance is a critical unmet challenge, and developing novel approaches to targeting LSCs offers a potential strategy for prolonging relapse-free survival of patients with AML. Chemotherapy and targeted therapy can kill leukemic blasts but may also enrich LSCs33. Healthy ILC1s act directly on LSCs to control AML progression. Therefore, given the special biologic function of ILC1s, expanding autologous in vivo or administration of allogeneic ILC1s expanded ex vivo during times of remission or the combination of expanded ILC1s with an FDA-approved drug may have a positive impact on prolonging relapse-free survival of patients with AML.
IFN-γ plays important roles in anti-viral and anti-tumor immunity, and has been used clinically to treat several diseases34. However, IFN-γ-based therapies have at least two limitations that preclude routine clinical use for cancer patients: 1) systemic delivery of IFN-γ is difficult to reach local tumor sites to subsequently achieve effective concentrations in the TME without significant toxicity35; 2) IFN-γ is rapidly cleared from the blood after intravenous administration, further limiting the ability to achieve effective local concentrations. These clinical disadvantages necessitate the development of alternative methods to ensure the effectiveness of IFN-γ in the local milieu of the marrow and/or other organs while limiting toxicity. Additionally, IFN-γ can act on tumors, tumor stem cells, and immune cells, resulting in PD-L1 induction, which can block T cell responses to tumor cells and cancer stem-like cells36, differentiation of cancer stem-like cells, and activation of immune cells37. Although these roles are complex and should be considered before the clinical use of IFN-γ, the ability of an anti-PD-L1 antibody to block the adverse effects of IFN-γ-upregulated PD-L1 provides a good rationale for combining IFN-γ or if too toxic, combining cells that produce this cytokine, such as ILC1s, with anti-PD-L1 antibody to treat cancers, including AML.
Our study provides a promising approach to treating AML: using a cell-based source of IFN-γ to target LSCs. Although ILC1s are a minute cell population, they express abundant IFN-γ, especially when interacting with tumor cells in the TME. ILC1s also express high levels of chemokine receptors, including CXCR3 and CXCR6, the respective receptors for CXCL9–11 and CXCL16 expressed by AML cells9, 38. These receptor–ligand interactions may help recruit ILC1s to BM or tumor sites, where most LSCs reside39. Leveraging chemotaxis to drive immune cells, including ILC1s, toward tumor cells may be important for controlling the disease. Furthermore, ILC1s rapidly and persistently produce IFN-γ locally after contacting LSCs or more mature tumor cells, yielding sufficient cytokine to locally target AML blasts40. Our data suggest that ILC1s can also induce apoptosis and differentiation of LSCs within the TME. Moreover, ILC1s are associated with reducing severe progression of graft-versus-host disease (GVHD) after allogeneic HSCT treatment for AML41. This suggests that ILC1s can control outcomes in AML through their multifaceted roles.
Like ILC1s, NK cells also belong to group 1 ILCs3. Although more than a dozen studies have assessed the efficacy of infusing NK cells into patients in remission following AML treatment, some of which showed promising results42, none have yet explored therapeutic ex vivo expansion and infusion of ILC1s during AML remission. Our data provide a strong rationale for developing methodologies to expand ILC1 populations rapidly and reproducibly for application as a cellular therapy to prolong relapse-free survival in patients with AML who achieve complete remission but may carry quiescent LSCs. This would be especially valuable for patients who are ineligible for HSCT, such as the elderly.
In summary, we identified previously unknown functions of ILC1s: they can closely regulate AML LSCs by inducing apoptosis; they prevent LSCs from differentiating into leukemia progenitors and then myeloid blasts; and they promote the differentiation of LSCs into a non-leukemic lineage. All these actions are mediated by IFN-γ that ILC1s secrete when they form cell–cell contact with LSCs. We therefore believe that, by uncovering the mechanisms underlying these processes, our study could unveil an innovative immunotherapeutic approach—administration of ILC1s that have been multiplied ex vivo—to prolong relapse-free survival of patients diagnosed with AML.
Methods
Human samples
Human specimens were collected from patients with AML registered at City of Hope National Medical Center who consented to an Institutional Review Board approved protocol (IRB# 18067); healthy donor specimens were collected from patients who consented to IRB# 06229. Mononuclear cells were isolated from peripheral blood samples of healthy donors or patients with AML using Ficoll separation. Lin−CD45dimCD34+CD38− cells were sorted using a BD FACSAria™ Fusion (BD Biosciences).
Mouse studies
C57BL/6J (B6, CD45.2), Rag2−/−γc−/−, IFN-γ−/−, TNF−/− and CD45.1 (B6.SJL-PtprcaPepcb/BoyJ) were purchased from the Jackson Laboratory. MllPTD/WT: Flt3ITD/ITD mice30 and IL-15 transgenic mice43 on the B6 background were generated by our group. All mice were maintained by the Animal Resource Center of COH. Six- to twelve-week-old CD45.2 and CD45.1 mice of both sexes were used as recipients for AML cell transplantation; Eighteen- to twenty-eight-week-old MllPTD/WT: Flt3ITD/ITD mice with AML of both sexes were used as donor mice. For animal studies, mice with same age and sex were divided randomly into experimental groups. Experimenters were blinded to observe survival of mice. No mice were excluded from the analyses unless clearly indicated. Mice were fed with PicoLab Rodent Diet 20 (Catalogue number: 5053) and housed in City of Hope Animal Facility with light cycle: a 12-light/12-dark cycle and temperatures of 65–75°F (~18–23°C) with 40–60% air humidity. Mouse care and experimental procedures were performed in accordance with federal guidelines and protocols approved by the Institutional Animal Care and Use Committee at City of Hope under the protocol number 18108 and 20003. Tumor-bearing mice are monitored on a twice per week basis and at more frequent intervals depending on the status of the mice. Mice exhibiting evidence of distress, discomfort, pain, lethargy, inability to properly groom, or inability to obtain food and/or water are euthanized immediately via CO2 inhalation. Tumor-bearing mice with 20% weight loss from the age-matched controls without receiving tumor cell inoculation will be euthanized.
Cells and cell culture
Human LSCs were cultured in StemSpan™ Serum-Free Expansion Medium II (STEMCELL, USA) with penicillin (100 U/mL), streptomycin (100 mg/mL), stem cell factor (SCF, 20 ng/ml), thrombopoietin (TPO, 20 ng/ml), Flt3-L (20 ng/ml), IL-3 (10 ng/ml), and IL-6 (10 ng/ml). Mouse LSCs were cultured in Iscove’s Modified Dulbecco’s Media (Thermo Fisher Scientific, USA) with 10% fetal bovine serum (FBS), penicillin (100 U/mL), streptomycin (100 mg/mL), SCF (20 ng/ml), TPO (20 ng/ml), Flt3-L (20 ng/ml), IL-3 (10 ng/ml), and IL-6 (10 ng/ml). Human and mouse ILC1s or NK cells were cultured in RPMI 1640 (Thermo Fisher Scientific, USA) with 10% FBS, penicillin (100 U/mL), streptomycin (100 mg/mL), IL-12 (10 ng/ml), and IL-15 (100 ng/ml). The mouse AML cell line C1498 (American Type Culture Collection) was cultured in RPMI 1640 with 10% FBS, penicillin (100 U/mL), and streptomycin (100 mg/mL). Cultures were incubated at 37°C in a humidified atmosphere of 5% CO2. All cytokines were from PeproTech. Penicillin and streptomycin were from Thermo Fisher Scientific.
Flow cytometry
ILC1s from human peripheral blood were identified using surface staining with a live/dead cell viability cell staining kit (Invitrogen) and the following monoclonal antibodies: lineage (FITC-conjugated anti-CD3, anti-CD4, anti-CD8, anti-CD14, anti-CD15, anti-CD16, anti-CD19, anti-CD20, anti-CD33, anti-CD34, anti-CD203c, anti-FceRI), CD56 (FITC, AF700 or BV421-conjugated anti-CD56), CD127 (APC-conjugated anti-CD127), CRTH2 (PE-Cy7-conjugated anti-CRTH2), and c-Kit (CD117, PE-conjugated anti-c-Kit). ILC1s from mice were identified using live/dead cell viability dyes and the following monoclonal antibodies: lineage (PE-Cy7-conjugated anti-CD3 and anti-CD19), NK1.1 (BV510-conjugated anti-NK1.1), NKp46 (AF647-conjugated anti-NKp46), CD49b (BUV395- or PE-conjugated anti-CD49b), and CD49a (BV711-conjugated anti-CD49a). Human LSCs were identified by lineage (FITC-conjugated anti-CD2, anti-CD3, anti-CD4, anti-CD8, anti-CD14, anti-CD19, anti-CD20, anti-Mac-1, anti-CD56, and anti-CD235a), CD45 (BV510-conjugated anti-CD45), CD34 (PE-conjugated anti-CD34), and CD38 (BV605- or PE-Cy7-conjugated anti-CD38). Mouse LSCs were identified by lineage (PE-Cy7-conjugated anti-CD3, anti-CD19, anti-B220, anti-Ly6G/C, anti-Mac-1, and anti-Ter119), Sca-1 (PE-CF594 or BV510-conjugated anti-Sca-l), and c-Kit (CD117, BV711-conjugated anti-c-Kit). Mouse long-term hematopoietic stem cells (LTHSC), short-term hematopoietic stem cells (STHSC), and multipotent progenitors (MPP) 1 and 2 were identified by lineage, Sca-1, c-Kit, Flt3 (APC-conjugated anti-Flt3), CD150 (PE-conjugated anti-CD150), and CD48 (FITC or BV786-conjugated anti-CD48). The expression of CD155 and CD112 on mouse LSCs was identified by APC-conjugated anti-CD155 and BV786-conjugated anti-CD112, respectively. The expression of DNAM-1 and IL-7R on mouse ILC1s was identified by BV421-conjugated anti-DNAM-1 and PerCP-Cy5.5-conjugated anti-IL-7R, respectively. The expression of CD45.1 and CD45.2 were identified by BV605-conjugated-anti-CD45.1 and APC/Fire™ 750- or FITC- conjugated-anti-CD45.2, respectively. Human ILC1s were gated by Lin−CD56−CD127+CRTH2−c-Kit−. Mouse ILC1s were gated by Lin−NK1.1+NKp46+CD49b−CD49a+. Mouse NK cells were gated by Lin−NK1.1+NKp46+CD49b+CD49a−. Human LSCs were gated by Lin−CD45dimCD34+CD38−. Mouse LSCs were gated by Lin−Sca-1+c-Kit+. Mouse LTHSCs were gated by Lin−Sca-1+c-Kit+Flt3−CD150+CD48−. Mouse STHSCs were gated by Lin−Sca-1+c-Kit+Flt3−CD150−CD48−. Mouse MPP1s were gated by Lin−Sca-1+c-Kit+Flt3−CD150−CD48+. Mouse MPP2s were gated by Lin−Sca-1+c-Kit+Flt3−CD150+CD48+. Myeloid cells were gated by Mac-1+Gr-1+. To examine intracellular cytokine production, we stimulated mouse ILC1s or NK cells co-cultured with or without LSCs in the presence of IL-12 (10 ng/ml) plus IL-15 (100 ng/ml) or IL-7 (100 ng/ml) for 4 h or 12 h, with BD GolgiPlug™ to block cytokine secretion. Intracellular staining for IFN-γ or TNF was performed using a Fix/Perm kit (eBiosciences), followed by staining with a BV786-conjugated anti-IFN-γ antibody or an AF700-conjugated anti-TNF antibody, respectively. All mouse antibodies were used at 1:200. All human antibodies were used at 1:50, except for CD34, CD38, CRTH2, and CD117, which were used at 1:100. All analyses were performed on a Fortessa X-20 flow cytometer (BD Biosciences), and sorting was performed using a BD FACSAria™ Fusion (BD Biosciences). Flow Cytometry data were analyzed by FlowJo V10 (Treestar) or Novoexpress 1.3.0 (Agilent).
Isolation of ILC1s and NK cells
To isolate ILC1s or NK cells from mouse liver, we washed harvested liver and pressed it through a 100 μm mesh to make single cells, which were washed once with PBS. The cells were re-suspended in 40% Percoll (Sigma-Aldrich) and then gently overlaid on 70% Percoll, followed by centrifugation according to the manufacturer’s instructions. Mononuclear cells (MNCs) were collected from the interphase and washed twice with PBS. The washed MNCs were stained with anti-CD3, anti-CD19, anti-NK1.1, anti-NKp46, anti-CD49b, and anti-CD49a antibodies. Thirty minutes later, the cells were washed 3 times and then sorted using BD FACSAria™ Fusion.
To isolate ILC1s from human peripheral blood, we diluted blood cone samples 1:1 with phosphate-buffered saline (PBS). We layered the blood on the top of Ficoll-Paque (GE Healthcare), and centrifuged it according to the manufacturer’s instructions. The mononuclear cell fraction was aspirated and washed with PBS, and then the red blood cells were lysed. The mononuclear cells were stained with lineage (anti-CD3, anti-CD4, anti-CD8, anti-CD14, anti-CD15, anti-CD16, anti-CD19, anti-CD20, anti-CD33, anti-CD34, anti-CD203c, anti-FceRI, and anti-CD56), anti-CD127, anti-CRTH2, and anti-c-Kit antibodies. Thirty minutes later, the cells were washed 3 times and then sorted using BD FACSAria™ Fusion.
LSCs and ILC1s in vitro co-culture assay
For mouse LSC co-culture assays, LSCs from MllPTD/WT: Flt3ITD/ITD mice with AML were labeled with 5 mM CellTrace Violet (CTV, Thermo Fisher Scientific, USA) and co-cultured in the presence of mouse IL-12 (10 ng/ml) and IL-15 (100 ng/ml) with various numbers of ILC1s or NK cells isolated from the liver of healthy mice or mice with AML. For human LSC co-culture assays, LSCs from patients with AML were labeled with 5 mM CTV and co-cultured in the presence of human IL-12 (10 ng/ml) plus IL-15 (100 ng/ml) with various numbers of ILC1s isolated from peripheral blood of healthy donors or patients with AML. For co-culture of LSCs and ILC1s in the Transwell co-culture system, LSCs were seeded in the lower chamber of a 96-well Transwell plate, while varying numbers of mouse ILC1s were seeded in the upper chamber. For co-culture assays with cytokines and antibodies, mouse or human LSCs were co-cultured with various doses of mouse TNF (0.25 μg/ml, 0.5 μg/ml, 0.75 μg/ml, and 1 μg/ml), mouse IFN-γ (0.1 ng/ml, 1 ng/ml, 10 ng/ml, 0.25 μg/ml, 0.5 μg/ml, 0.75 μg/ml, and 1 μg/ml), anti-TNF (10 μg/ml) antibody, or anti-IFN-γ antibody (10 μg/ml). For all co-culture assays, cells were harvested after 3 days and analyzed using flow cytometry. 7-amino-actinomycin D (7-AAD, BD Biosciences) was used to identify dead cells following the manufacturer’s instructions. Cell images were taken by microscope (Zeiss AxioCam 702).
For the LSC differentiation assay, LSCs were isolated from MllPTD/WT: Flt3ITD/ITD mice with AML and co-cultured with or without ILC1s isolated from the liver of healthy mice or MllPTD/WT: Flt3ITD/ITD mice with AML for 1 to 4 days in the presence or absence of anti-TNF (10 μg/ml) antibody or anti-IFN-γ antibody (10 μg/ml). Cells were harvested and analyzed using flow cytometry.
Caspase3/7 activity assay
ILC1s were co-cultured with LSCs at a ratio of 1:1 or 1:2 for 6 h. Next, 100 μl of Caspase-Glo 3/7 reagent was added to each well. Plates were then shaken at 300 rpm for 1 min, incubated for 60 min at room temperature, and then read on a luminometer (Promega, Glomax). Background luminescence was determined with 100 μl of culture medium without cells and subtracted before fold changes were calculated.
In vitro colony-forming unit assay
LSCs were obtained from MllPTD/WT: Flt3ITD/ITD mouse spleen and co-cultured with or without WT, IFN-γ−/− or TNF−/− ILC1s for 3 days. Cells were then plated into mouse methylcellulose complete medium (R&D, HSC007) supplied with human transferrin (200 μg/ml), recombinant human insulin (10 μg/ml), recombinant human SCF (50 ng/ml), mouse recombinant IL-3 (10 ng/ml), IL-6 (10 ng/ml), and recombinant mouse EPO (5 IU/ml). Cultures were incubated at 37°C in a humidified atmosphere of 5% CO2 for 10–14 days. Colony numbers were counted using a microscope.
In vivo HSC transplantation assay
In all transplantation experiments, recipient mice were fed with sulfatrim-based food (Catalogue number: 5W8F; TestDiet, Richmond, IN) post-transplantation to avoid any infection/toxicity associated with irradiation. 3×10⁴ HSCs were isolated from bone marrow cells of 6- to 12-week-old healthy CD45.2 male mice and i.v. co-injected with 5×10⁵ 6- to 12-week-old female CD45.1 bone marrow cells (as support cells) into lethally irradiated (900 cGy) 6- to 12-week-old female C57BL/6J (CD45.1) recipient mice. One day later, 3×10⁴ ILC1s (CD45.2) isolated from the liver of healthy mice were i.v. injected into these recipient mice. The LSKs, Lin−Sca-1−c-Kit+ cells, Lin−Sca-1+c-Kit−cells, STHSCs, LTHSCs, MPP1, MPP2, Mac-1+Gr-1+ cells, and WBCs derived from donor mice were analyzed 3 weeks post HSC transplantation using Element HT5 hematology analyzer (Heska, USA) and flow cytometry (BD Biosciences).
In vivo LSC transplantation assay
In all transplantation experiments, recipient mice were fed with sulfatrim-based food (Catalogue number: 5W8F; TestDiet, Richmond, IN) post-transplantation to avoid any infection/toxicity associated with irradiation. 0.5×10⁶ bone marrow cells from 6- to 12-week-old female CD45.1 WT mice or bone marrow cells isolated from male IL-15 transgenic mice (CD45.2) depleted of NK1.1+NKp46+ cells were transplanted by i.v injection with 3×10⁴ LSCs obtained from 18- to 28-week-old MllPTD/WT: Flt3ITD/ITD mice with AML into lethally (900 cGy, 96 cGy/min, γ-rays) irradiated 6- to 12-week-old C57BL/6J (CD45.1) recipient mice. Next, WT or IFN-γ−/− ILC1s (CD45.2), which were purified from WT or IFN-γ−/− C57BL/6J mice, were injected via i.v. into recipient mice (3×10⁴ cells/mouse). In some experiments, animal-free recombinant mouse IFN-γ (0.5 μg/mouse) was i.p. injected into recipient mice daily for 7 days. For all transplantations, the numbers of WBCs, LSCs, or immature blast cells in peripheral blood were counted at the indicated times using Element HT5 hematology analyzer and flow cytometry. (Peripheral blood was also collected for making blood smear slides). Blood smear slides were stained with Wright-Giemsa (Polysciences). Leukemic mice were euthanized using CO2 inhalation when they showed signs of systemic illness.
In vitro stimulation of ILC1s and NK cells
Mouse ILC1s or NK cells were sorted from the liver of healthy mice or mice with AML and then were co-cultured with or without LSCs for 12 h in the presence of IL-12 (10 ng/ml) plus IL-15 (100 ng/ml).
For stimulation by anti-DNAM-1 or anti-IL-7R neutralizing antibody or isotype IgG control, mouse ILC1s or NK cells were sorted from the liver of healthy mice and co-cultured with or without an anti-DNAM-1 (10 μg/ml) or anti-IL-7R neutralizing antibody (10 μg/ml) at 5% CO2 and 37°C in RPMI-1640 culture medium supplemented with 10% FBS, penicillin (100 U/mL), streptomycin (100 mg/mL), IL-12 (10 ng/ml ), and IL-15 (100 ng/ml). Thirty minutes later, LSCs were added at an equal ratio to some of the cultures of the ILC1s or NK cells and then co-cultured for 12 h.
For stimulation with recombinant mouse IL-7, mouse ILC1s or NK cells were sorted from the liver of healthy mice and then were treated with or without recombinant mouse IL-7 (100 ng/ml) for 12 h at 5% CO2 and 37○C in RPMI-1640 culture medium supplemented with 10% FBS, penicillin (100 U/mL), streptomycin (100 mg/mL), IL-12 (10 ng/ml), and IL-15 (100 ng/ml).
For all of the above stimulation assays, BD GolgiPlug™ was added to the cultures 4 h before cells were collected. Then cells were harvested, washed, and stained for surface molecules and intracellular IFN-γ. Percentages of IFN-γ+ ILC1s or NK cells were calculated by flow cytometry.
NK cell or ILC1 depletion in vivo
In vivo, NK cells and ILC1s were depleted by i.p. injection with 200 μg/mouse anti-mouse NK1.1 antibody (clone PK136; BioXcell, USA); NK cells alone were depleted by i.p. injection with 40 μl/mouse anti-asialo-GM1 antibody (clone Poly21460; BioLegend, USA). To maintain the depletion, the same injections were given on days 7, 14, and 21.
Gene expression analyses
For mouse ILC1 RNA-sequencing, mouse ILC1s were sorted from the liver of healthy mice or AML mice using BD FACSAria™ Fusion. For LSC RNA-sequencing, 2,000 mouse LSCs sorted from MllPTD/WT: Flt3ITD/ITD mice with AML were co-cultured with 1,000 ILC1s or treated with 10 ng/ml IFN-γ for 3 days; then the LSCs were re-sorted using BD FACSAria™ Fusion. Total RNA was isolated from ILC1s or LSCs using a miRNeasy mini kit (QIAGEN). PolyA RNA-seq was performed in the Integrative Genomics Core of City of Hope National Medical Center. SMART-Seq® Ultra Low Input RNA Kit for Sequencing–v4 (Takara Bio) was used for getting double-strand cDNA from each sample with 2 ng of input total RNA. The resulting cDNA was sheared using a Covaris LE220 sonicator. The sheared DNA was used to prepare a sequencing library, using a KAPA HyperPrep Kit. The final libraries were quantified using the Qubit Assay Kit (Thermo Fisher Scientific) and Bioanalyzer (Agilent). Sequencing was performed using the single-read mode of 51 cycles of read1 and 7 cycles of index read with V4 reagents on a Hiseq 2500 system (Illumina). Real-time analysis (RTA) 2.2.38 software was used to process the image analysis and base calling.
For quantitative (q) reverse transcription (RT)-PCR and regular PCR analyses, RNA was isolated from 1,000 cells using a miRNeasy mini kit (QIAGEN) and reverse-transcribed using the PrimeScript™ RT Reagent Kit with gDNA Eraser (TAKARA). qPCR reactions were run on a QuantStudio 7 Flex Real-Time PCR System (Applied Biosystems) using SYBR Green reagents (Thermofisher). Values were normalized to 18s rRNA expression levels. qRT-PCR analysis was conducted to assess the expression of mouse Bak1 (Forward: 5’-CAGCTTGCTCTCATCGGAGAT-3’, Reverse: 5’-GGTGAAGAGTTCGTAGGCATTC-3’), human BAK1 (Forward: 5’-GTTTTCCGCAGCTACGTTTTT-3’, Reverse:5’-GCAGAGGTAAGGTGACCATCTC-3’), and 18S rRNA (Forward: 5’-GTAACCCGTTGAACCCCATT-3’; Reverse: 5’-CCATCCAATCGGTAGTAGCG-3’). Regular RT-PCR reactions to determine the expression of mouse Il7 (Forward: 5’-TTCCTCCACTGATCCTTGTTCT-3’, Reverse: 5’- AGCAGCTTCCTTTGTATCATCAC-3’) were performed on a ProFlex PCR System (Applied Biosystems) using 2×MyTaq Red Mix (Meridian Bioscience). The primers were purchased from Integrated DNA Technologies (IDT).
In vitro kinase inhibitor experiments
LSCs isolated from the spleen of MllPTD/WT: Flt3ITD/ITD mice with AML were treated with the JAK2 inhibitor AZD1480 (10 nM), the JAK1/2/3 inhibitor decernotinib (VX-509, 10 nM), or the AKT inhibitor afuresertib (10 nM) for 30 min. Then LSCs were co-cultured with ILC1s isolated from the liver of WT or IFN-γ−/− mice labeled with CTV at a ratio of 4:1, or treated with IFN-γ (10 ng/ml). Three days later, cells were harvested and analyzed using flow cytometry.
ELISA
Cell supernatants were collected and analyzed for cytokine content by ELISA according to the manufacturer’s protocols. LSCs isolated from the peripheral blood of patients with AML were co-cultured with the ILC1s isolated from healthy donors or patients with AML in the presence of IL-12 (10 ng/ml) and IL-15 (100 ng/ml) for 3 days. Levels of IFN-γ in culture supernatants were measured using the human IFN-γ Quantikine ELISA Kit (Cat# DIF50C, R&D). Samples for each condition were assayed in three duplicates.
Statistical analyses
For continuous endpoints, Student’s t test or paired t test was used to compare two independent or matched conditions, and one-way ANOVA models were used to compare three or more independent conditions. Linear mixed models were used to account for the variance-covariance structure due to repeated measures. Mouse survival functions were estimated by the Kaplan–Meier method and compared by log-rank tests. All tests were two-sided. P values were adjusted for multiple comparisons by Holm’s procedure. No statistical methods were used to pre-determine sample sizes but our sample sizes are similar to those reported in previous publications11. Data distribution was assumed to be normal, but this was not formally tested. For RNA-seq analysis, sequencing reads were trimmed from sequencing adapters using Trimmomatic44 and polyA tails using FASTP45, and then mapped back to the mouse genome (mm10) using STAR (v. 020201)46. The gene-level count table was created by High-throughput sequence (HTSeq v.0.6.0)47 and normalized by the trimmed mean of M values (TMM)48 method. General linear models based on negative binomial distributions (R package “EdgeR”) were used to compare gene expression levels between two specific cell types. Genes with a false discovery rate (FDR)-adjusted p-value less than 0.05 and a fold change (FC) greater than 1.5 (upregulated) or less than 0.7 (downregulated) were considered as differentially expressed genes (DEG). Pathway and gene set enrichment analyses were performed using the GSEA49, 50 program, which runs the GSEAPreranked algorithm on a ranked list of genes. Data are presented as mean ± s.d. Prism software v.8 (GraphPad, CA, USA) and SAS v.9.4 (SAS Institute. NC, USA) were used to perform statistical analyses.
Reporting Summary
Further information on research design is available in the Nature Research Reporting Summary linked to this article.
Data availability
Sequencing datasets are accessible from GEO with accession number (GSE 198783). The hyperlink to deposited Geo data is https://www.ncbi.nlm.nih.gov/geo/query/acc.cgi?acc=GSE198783.
All source data are provided with this paper.
Extended Data
Extended Data Fig. 1.
ILC1s are functionally impaired in mice with AML. a, 0.2×10⁶ LSKs isolated from the liver of healthy mice or MllPTD/WT: Flt3ITD/ITD mice with AML were i.v. injected into immunodeficient Rag2−/−γc−/− mice. The survival of those mice was analyzed by the Kaplan-Meier method and log-rank test (n = 3 individual mice). b, LSCs were isolated from the spleen of MllPTD/WT: Flt3ITD/ITD mice with AML (CD45.2) and then transplanted into lethally irradiated mice (CD45.1). The percentages of LSCs in the liver of the CD45.1 mice were analyzed 9 weeks after LSC transplantation using flow cytometry. c, Gating strategy for flow cytometry analysis of the mouse ILC1s isolated from livers. The mouse ILC1s were defined as CD3−CD19−NK1.1+NKp46+CD49b−CD49a+. d-f, 2×10⁶ C1498 cells were i.v. injected into C57BL/6J mice. Twenty-one days later, the production of IFN-γ and TNF by ILC1s from the liver (d), bone marrow (e), and spleen (f) of those healthy mice or mice with AML are shown (n = 5 individual mice). g, GSEA plot shows the relative abundance of genes involved in the TNF-α–NF-κB signaling pathways in liver ILC1s isolated from mice with AML or healthy mice (n = 3 individual mice). Data are representative of two (a, b, d, e, and f) independent experiments. Data (d-f) are shown as mean ± s.d. and are assessed by unpaired two-tailed Student’s t test. NS, not significant.
Extended Data Fig. 2.
Cell purity and gating strategy for flow cytometry analysis. a,b, Purity of LSCs (a) and ILC1s (b) after cell sorting. c, Gating strategy for flow cytometric analysis of apoptosis of LSCs co-cultured with or without ILC1s, using 7-AAD. CTV: CellTrace™ Violet. d, Gating strategy for flow cytometry analysis of apoptosis of LSCs co-cultured with ILC1s using the Violet Live Cell Caspase Probe. e, Gating strategy for flow cytometry analysis of human ILC1s isolated from peripheral blood. Lineage markers: CD3, CD4, CD8, CD14, CD15, CD16, CD19, CD20, CD33, CD34, CD203c, and FceRI. Human ILC1s were defined as Lin−CD56−CD127+c-Kit−CRTH2−. f, Gating strategy for flow cytometry analysis of human LSCs. Lineage markers: CD2, CD3, CD4, CD8, CD14, CD16, CD19, Mac-1, CD56, and CD235a. Human LSCs were defined as Lin−CD45dimCD34+CD38−.
Extended Data Fig. 3.
IFN-γ—but not TNF—induces apoptosis of LSCs. a, 5,000–10,000 mouse liver ILC1s were sorted and transferred into the top wells of a 96-well Transwell plate. The bottom chambers of the plate were loaded with 10,000–20,000 LSCs from the spleens of MllPTD/WT: Flt3ITD/ITD mice with AML. The cells were then co-cultured for 3 days. The percentages of LSCs that were apoptotic were measured by flow cytometry (n = 3 individual mice). b,c, LSCs from the spleen of MllPTD/WT: Flt3ITD/ITD mice with AML were treated with or without the indicated doses of IFN-γ or TNF for 3 days. Representative images (top, 5× magnification, scale bar 200 μm) and flow cytometry plots (bottom) of the percentages of apoptotic cells in LSCs are shown. Data in a are shown as mean ± s.d. and are assessed by one-way ANOVA models. Data in a, b, and c are representative of two independent experiments. NS, not significant.
Extended Data Fig. 4.
ILC1s and IFN-γ transform the differentiation of LSCs. a, LSCs from the spleen of MllPTD/WT: Flt3ITD/ITD mice with AML were co-cultured with or without 0.1 ng/ml, 1 ng/ml, or 10 ng/ml recombinant mouse IFN-γ. The percentages of Lin−Sca-1+c-Kit+, Lin−Sca-1−c-Kit+, and Lin−Sca-1+c-Kit− cells were measured by flow cytometry (n = 4 individual mice). b, ILC1s from healthy mouse liver were sorted and transferred into the top well of a 96-well Transwell plate. The bottom chamber of the plate was loaded with LSCs from the spleen of MllPTD/WT: Flt3ITD/ITD mice with AML, and co-incubated for 3 days (n = 3 individual mice). Then the percentages of Lin−Sca-1+c-Kit+, Lin−Sca-1−c-Kit+, and Lin−Sca-1+c-Kit− cells were measured by flow cytometry. All data are representative of three independent experiments, shown as mean ± s.d., and assessed by one-way ANOVA.
Extended Data Fig. 5.
ILC1s and IFN-γ do not affect leukemia progenitor cell differentiation into myeloid blasts. a,b, Mouse LSCs labeled with CTV were co-cultured with or without mouse ILC1s in the presence or absence of anti-IFN-γ or anti-TNF antibody. Statistics of absolute cell numbers of Mac-1+ (a) and Gr-1+ (b) cells are shown (n = 3 individual mice). c, Leukemia progenitor cells were sorted from the spleen of MllPTD/WT: Flt3ITD/ITD mice with AML and co-cultured with or without WT ILC1s, IFN-γ−/− ILC1s, or IFN-γ. Representative flow cytometry plots (top) and statistics of the percentages (bottom) of Mac-1+ and Gr-1+ cells are shown (n = 4 individual mice). d, A working model of how ILC1s and their secreted IFN-γ regulate differentiation of LSCs. Data in a, b, and c are representative of three independent experiments, shown as mean ± s.d., and assessed by one-way ANOVA models. NS, not significant.
Extended Data Fig. 6.
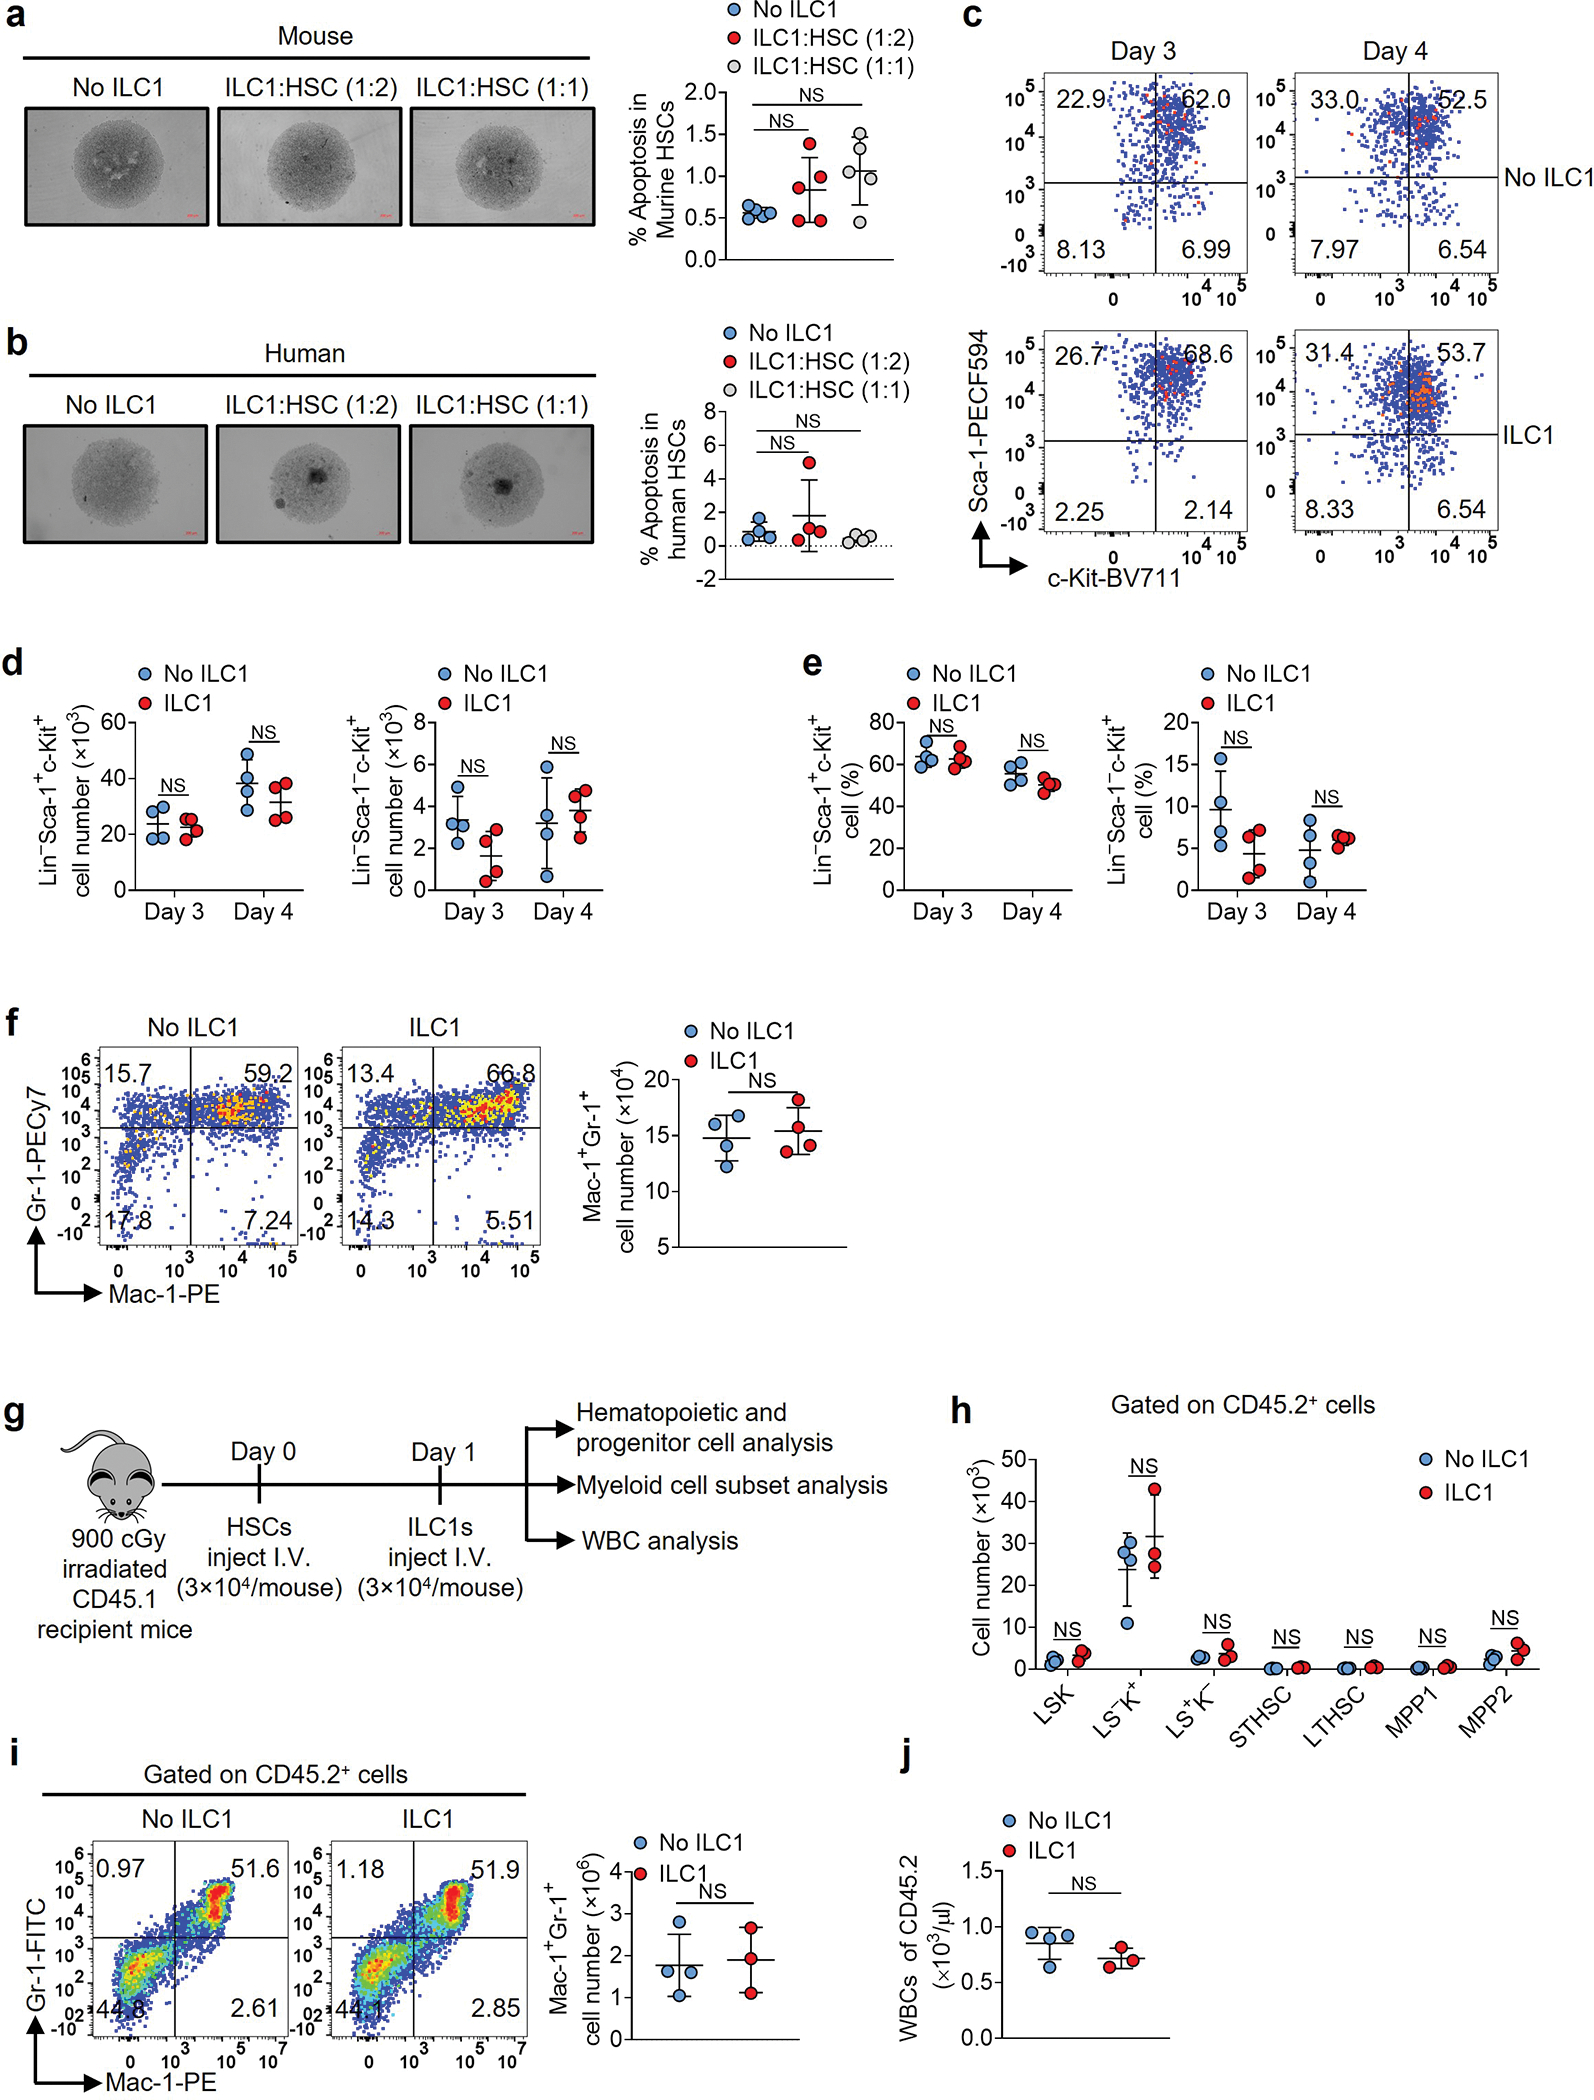
ILC1s do not induce HSC apoptosis nor impair their differentiation. a, Wild-type mouse HSCs from bone marrow of mice were co-cultured with or without ILC1s. Representative images and statistics of the percentages of apoptotic cells (5× magnification, scale bar 200 μm, n = 5 individual mice). b, HSCs from blood of healthy donors were co-cultured with or without ILC1s. Representative images and statistics of the percentages of apoptotic cells (n = 4 individual donors). c-e, Mouse HSCs were co-cultured with or without ILC1s, and representative flow cytometry plots (c), statistics of cell numbers (d), and percentages (e) of Lin−Sca-1+c-Kit+ and Lin−Sca-1−c-Kit+ cells (n = 4 individual mice). f, Representative flow cytometry plots and statistics of cell numbers of Mac-1+Gr-1+ cells (n = 4 individual mice). g, Experimental scheme for (h-j). Mouse HSCs from CD45.2 mice were injected into lethally irradiated CD45.1 mice. One day later, ILC1s were injected into those CD45.1 mice. Three weeks later, donor hematopoietic and progenitor cells, myeloid cell subsets, and WBCs were analyzed. h, The cell numbers of donor LSKs, myeloid progenitor cells (L−S−K+, Lin−Sca-1−c-Kit+ cells), early lymphoid-committed precursors (L−S+K−, Lin−Sca-1+c-Kit− cells), short-term hematopoietic stem cells (STHSC, Lin−Sca-1+c-Kit+Flt3−CD150−CD48− cells), long-term hematopoietic stem cells (LTHSC, Lin−Sca-1+c-Kit+Flt3−CD150+CD48− cells), multipotent progenitors 1 and 2 (MPP1, Lin−Sca-1+c-Kit+Flt3−CD150+CD48+ cells; MPP2, Lin−Sca-1+c-Kit+Flt3−CD150−CD48+ cells), Mac-1+Gr-1+ cell subsets, and WBCs derived from CD45.2 mice were analyzed (n = 4 individual mice in No ILC1 group; n = 3 individual mice in ILC1 group). i, Representative flow cytometry plots and statistics of cell numbers of Mac-1+Gr-1+ cells derived from CD45.2 mice (n = 4 individual mice in No ILC1 group; n = 3 individual mice in ILC1 group). j, Statistics of cell numbers of WBCs (n = 4 individual mice in No ILC1 group; n = 3 individual mice in ILC1 group). Data in a, b, d, e, f, h, i, and j are representative of two independent experiments and shown as mean ± s.d.. Statistics are assessed by one-way ANOVA (a and b) or unpaired two-tailed Student’s t test (d, e, h, i, and j). NS, not significant.
Extended Data Fig. 7.
ILC1s control the leukemia burden in mice transplanted with LSCs. a, LSCs were i.v. co-injected into lethally irradiated (900 cGy) CD45.2 recipient mice on day 0 along with bone marrow cells isolated from IL-15 transgenic mice (CD45.2) as support cells. On day 1, the mice were i.v. injected with WT ILC1s from the liver of C57BL/6J (CD45.2) mice or i.p. injected daily with recombinant mouse IFN-γ (0.5 μg/mouse/day). Statistics of the numbers of total WBCs at week 5 (n = 5 individual mice in No ILC1 group; n = 4 individual mice in WT ILC1group; n = 6 individual mice in Recombinant IFN-γ group). All absolute cell numbers of WBCs were determined by cell counting with the Element HT5 Hematology Analyzer. b, Representative flow cytometry plots of the percentages of CD45.1+ and CD45.2+ cells. c, LSCs were co-injected into lethally irradiated (900 cGy) CD45.1 recipient mice on day 0 along with bone marrow cells isolated from CD45.1 mice (as support cells). Mice were injected with WT ILC1s or IFN-γ− /− ILC1s from the liver of C57BL/6J (CD45.2) mice on day 1 or injected daily with recombinant mouse IFN-γ (0.5 μg/mouse/day). Statistics of the number of total WBCs at week 3 (n = 7 individual mice). All absolute cell numbers of WBCs were determined by cell counting with the Element HT5 Hematology Analyzer followed by flow cytometry. For box plots, Boxplots (a and c) display the median and interquartile range (25th percentile –75th percentile) with whiskers representing the upper- and lower-quartile (1.5× the 75th and 25th percentile values). Data in a and c are representative of two independent experiments and shown as mean ± s.d. and assessed by one-way ANOVA.
Extended Data Fig. 8.

The role of ILC1s and ILC1-derived IFN-γ in controlling LSCs. a, Healthy mouse liver ILC1s or NK cells were co-cultured with or without LSCs in the presence or absence of anti-IL-7R neutralizing antibody or isotype IgG control for 12 h along with IL-12 plus IL-15. Representative flow cytometry plots of IFN-γ production by ILC1s (n = 6 individual mice). b, Representative flow cytometry plots of IFN-γ production in healthy liver ILC1s or healthy liver NK cells after treatment with or without IL-7 (100 ng/ml) in the presence of IL-12 plus IL-15 (n = 5 individual mice). c,d, Mouse LSCs were co-cultured with or without mouse ILC1s or NK cells for 3 days in the presence or absence of mouse anti-IFN-γ antibody. Representative images (c; 5× magnification, scale bar 200 μm) and statistics of absolute cell numbers (d) are shown (n = 3 individual mice). e,f, Representative flow cytometry plots (e) and statistics of the percentages of apoptotic LSCs (f; n = 3 individual mice). g, To deplete ILC1s or NK cells, WT mice were i.p. injected with IgG control (CTRL), anti-NK1.1, or anti-asialo-GM1 antibody. Three days later, the percentages of NK cells (Lin–NK1.1+NKp46+CD49b+) and ILC1s (Lin–NK1.1+NKp46+CD49a+) in the liver of WT mice were measured by flow cytometry. Data (d and f) are representative of two independent experiments and shown as mean ± s.d. and are assessed by one-way ANOVA models. NS, not significant.
Extended Data Fig. 9.

RNA-seq identifies gene transcriptional changes and signaling pathways in LSCs treated with ILC1s or IFN-γ. a, Experimental design for RNA sequencing (RNA-Seq). Mouse LSCs were sorted and treated with or without sorted ILC1s or IFN-γ for 3 days. LSCs were resorted from co-cultured ILC1s or IFN-γ using FACS before RNA-Seq. b, Purity of LSCs (left) and ILC1s (right) after cell sorting. c, Heat map showing differential expression of RNA of 627 genes (n = 3 individual mice). d-f, Volcano plots showing significantly differentially expressed genes in RNA pools from AML LSCs treated with ILC1s vs. Ctrl (untreated) (d), IFN-γ vs. Ctrl (e), and IFN-γ vs. ILC1s (f) (n = 3 individual mice). g, Hallmark pathway analysis in LSC RNA pools (IFN-γ vs. Ctrl). The left panel shows signaling pathways downregulated in LSCs. The right panel shows signaling pathways upregulated in LSCs (n = 3 individual mice). Genes with an FDR-adjusted P-value < 0.05 and a fold change (FC) > 1.5 or < 0.7 were considered as significantly upregulated and downregulated genes, respectively.
Extended Data Fig. 10.
ILC1s or IFN-γ inhibit LSC differentiation via the JAK-STAT and AKT signaling pathways. a, GSEA plots show enrichment of the indicated target genes in LSCs co-cultured with ILC1s. The X-axis shows the rank orders (ILC1s vs. Ctrl) of all the genes. b, GSEA plots show enrichment of the indicated target genes in LSCs treated with IFN-γ. The X-axis shows the rank orders (IFN-γ vs. Ctrl) of all the genes. c,d, Heat maps showing differential expression of RNAs of genes downstream of IFN-γ. e-h, Mouse LSCs labeled with CTV were treated with or without the indicated JAK and AKT inhibitors for 30 min and then co-cultured with or without WT or IFN-γ−/− ILC1s in the presence of IL-12 and IL-15 for 3 days. Statistics of the percentages of Lin− Sca-1+c-Kit+, Lin− Sca-1− c-Kit+, Lin− Sca-1+c-Kit−, and Lin− Sca-1−c-Kit− cells (n = 3 individual mice). Genes with an FDR-adjusted P-value < 0.05 and a fold change (FC) > 1.5 or < 0.7 were considered to be significantly upregulated or downregulated. Data in e-h are representative of three independent experiments, shown as mean ± s.d., and assessed by one-way ANOVA models. NS, not significant.
Supplementary Material
Acknowledgments
This work was supported by grants from the National Institutes of Health (CA210087, CA265095, and CA163205 to M.A. Caligiuri; NS106170, AI129582, CA247550, CA264512, and CA223400 to J. Yu) and the Leukemia and Lymphoma Society (1364–19 to J. Yu). Research reported in this publication also included work performed in the Hematopoietic Tissue Biorepository Core supported by the National Cancer Institute of the National Institutes of Health under grant number P30CA033572. The authors appreciate Sarah T. Wilkinson and Linda Sage for editing the manuscript. The images were created with BioRender.com and Adobe Photoshop.
Footnotes
Conflict of interest
The authors declare no conflict of interest
References
- 1.Nair R, Salinas-Illarena A & Baldauf HM New strategies to treat AML: novel insights into AML survival pathways and combination therapies. Leukemia (2020). [Google Scholar]
- 2.Ballester G, Tirona MT & Ballester O Hematopoietic stem cell transplantation in the elderly. Oncology (Williston Park, N.Y.) 21, 1576–1583; discussion 1587, 1590–1571, 1606 (2007). [Google Scholar]
- 3.Klose CSN & Artis D Innate lymphoid cells control signaling circuits to regulate tissue-specific immunity. Cell research 30, 475–491 (2020). [DOI] [PMC free article] [PubMed] [Google Scholar]
- 4.Goc J et al. Dysregulation of ILC3s unleashes progression and immunotherapy resistance in colon cancer. Cell (2021). [Google Scholar]
- 5.Moral JA et al. ILC2s amplify PD-1 blockade by activating tissue-specific cancer immunity. Nature 579, 130–135 (2020). [DOI] [PMC free article] [PubMed] [Google Scholar]
- 6.Nabekura T, Riggan L, Hildreth AD, O’Sullivan TE & Shibuya A Type 1 Innate Lymphoid Cells Protect Mice from Acute Liver Injury via Interferon-γ Secretion for Upregulating Bcl-xL Expression in Hepatocytes. Immunity 52, 96–108.e109 (2020). [DOI] [PMC free article] [PubMed] [Google Scholar]
- 7.Klose CSN et al. Differentiation of type 1 ILCs from a common progenitor to all helper-like innate lymphoid cell lineages. Cell 157, 340–356 (2014). [DOI] [PubMed] [Google Scholar]
- 8.Klose CS et al. A T-bet gradient controls the fate and function of CCR6-RORγt+ innate lymphoid cells. Nature 494, 261–265 (2013). [DOI] [PubMed] [Google Scholar]
- 9.Weizman OE et al. ILC1 Confer Early Host Protection at Initial Sites of Viral Infection. Cell 171, 795–808.e712 (2017). [DOI] [PMC free article] [PubMed] [Google Scholar]
- 10.Shannon JP et al. Group 1 innate lymphoid-cell-derived interferon-γ maintains anti-viral vigilance in the mucosal epithelium. Immunity 54, 276–290.e275 (2021). [DOI] [PMC free article] [PubMed] [Google Scholar]
- 11.Zhang B et al. Bone marrow niche trafficking of miR-126 controls the self-renewal of leukemia stem cells in chronic myelogenous leukemia. Nat Med 24, 450–462 (2018). [DOI] [PMC free article] [PubMed] [Google Scholar]
- 12.Zorko NA et al. Mll partial tandem duplication and Flt3 internal tandem duplication in a double knock-in mouse recapitulates features of counterpart human acute myeloid leukemias. Blood 120, 1130–1136 (2012). [DOI] [PMC free article] [PubMed] [Google Scholar]
- 13.Shipounova Nifontova IN, Bigil’diev AE, Svinareva DA & Drize NI Characteristics of leukemia stem cells of murine myeloproliferative disease involving the liver. Bulletin of experimental biology and medicine 149, 293–297 (2010). [DOI] [PubMed] [Google Scholar]
- 14.Almishri W et al. TNFα Augments Cytokine-Induced NK Cell IFNγ Production through TNFR2. Journal of innate immunity 8, 617–629 (2016). [DOI] [PMC free article] [PubMed] [Google Scholar]
- 15.Artis D & Spits H The biology of innate lymphoid cells. Nature 517, 293–301 (2015). [DOI] [PubMed] [Google Scholar]
- 16.Appelbaum FR, Rowe JM, Radich J & Dick JE Acute myeloid leukemia. Hematology. American Society of Hematology. Education Program, 62–86 (2001). [DOI] [PubMed] [Google Scholar]
- 17.Peng C et al. LSK derived LSK- cells have a high apoptotic rate related to survival regulation of hematopoietic and leukemic stem cells. PLoS One 7, e38614 (2012). [DOI] [PMC free article] [PubMed] [Google Scholar]
- 18.Kumar R, Fossati V, Israel M & Snoeck HW Lin-Sca1+kit- bone marrow cells contain early lymphoid-committed precursors that are distinct from common lymphoid progenitors. Journal of immunology (Baltimore, Md. : 1950) 181, 7507–7513 (2008). [Google Scholar]
- 19.Joshi K, Zhang L, Breslin SJP & Zhang J Leukemia Stem Cells in the Pathogenesis, Progression, and Treatment of Acute Myeloid Leukemia. Advances in experimental medicine and biology 1143, 95–128 (2019). [DOI] [PMC free article] [PubMed] [Google Scholar]
- 20.Adane B et al. The Hematopoietic Oxidase NOX2 Regulates Self-Renewal of Leukemic Stem Cells. Cell reports 27, 238–254.e236 (2019). [DOI] [PMC free article] [PubMed] [Google Scholar]
- 21.Park SM et al. IKZF2 Drives Leukemia Stem Cell Self-Renewal and Inhibits Myeloid Differentiation. Cell stem cell 24, 153–165.e157 (2019). [DOI] [PMC free article] [PubMed] [Google Scholar]
- 22.Laouedj M et al. S100A9 induces differentiation of acute myeloid leukemia cells through TLR4. Blood 129, 1980–1990 (2017). [DOI] [PubMed] [Google Scholar]
- 23.Filén JJ et al. Quantitative proteomics reveals GIMAP family proteins 1 and 4 to be differentially regulated during human T helper cell differentiation. Molecular & cellular proteomics : MCP 8, 32–44 (2009). [DOI] [PMC free article] [PubMed] [Google Scholar]
- 24.Sharma A et al. Constitutive IRF8 expression inhibits AML by activation of repressed immune response signaling. Leukemia 29, 157–168 (2015). [DOI] [PubMed] [Google Scholar]
- 25.Bank U et al. c-FLIP is crucial for IL-7/IL-15-dependent NKp46(+) ILC development and protection from intestinal inflammation in mice. Nature communications 11, 1056 (2020). [Google Scholar]
- 26.Ma S et al. The RNA m6A reader YTHDF2 controls NK cell antitumor and antiviral immunity. J Exp Med 218 (2021). [Google Scholar]
- 27.Smith M et al. Adult acute myeloid leukaemia. Critical reviews in oncology/hematology 50, 197–222 (2004). [DOI] [PubMed] [Google Scholar]
- 28.Gao Y et al. Tumor immunoevasion by the conversion of effector NK cells into type 1 innate lymphoid cells. Nature immunology 18, 1004–1015 (2017). [DOI] [PubMed] [Google Scholar]
- 29.Robinette ML et al. Transcriptional programs define molecular characteristics of innate lymphoid cell classes and subsets. Nat Immunol 16, 306–317 (2015). [DOI] [PMC free article] [PubMed] [Google Scholar]
- 30.Villarino AV, Kanno Y & O’Shea JJ Mechanisms and consequences of Jak-STAT signaling in the immune system. Nature immunology 18, 374–384 (2017). [DOI] [PMC free article] [PubMed] [Google Scholar]
- 31.Shannon JP et al. Group 1 innate lymphoid-cell-derived interferon-γ maintains anti-viral vigilance in the mucosal epithelium. Immunity (2021). [Google Scholar]
- 32.Yamashita M, Dellorusso PV, Olson OC & Passegué E Dysregulated haematopoietic stem cell behaviour in myeloid leukaemogenesis. Nature reviews. Cancer 20, 365–382 (2020). [DOI] [PMC free article] [PubMed] [Google Scholar]
- 33.Levis M & Perl AE Gilteritinib: potent targeting of FLT3 mutations in AML. Blood advances 4, 1178–1191 (2020). [DOI] [PMC free article] [PubMed] [Google Scholar]
- 34.Castro F, Cardoso AP, Gonçalves RM, Serre K & Oliveira MJ Interferon-Gamma at the Crossroads of Tumor Immune Surveillance or Evasion. Frontiers in immunology 9, 847 (2018). [DOI] [PMC free article] [PubMed] [Google Scholar]
- 35.Razaghi A, Owens L & Heimann K Review of the recombinant human interferon gamma as an immunotherapeutic: Impacts of production platforms and glycosylation. Journal of biotechnology 240, 48–60 (2016). [DOI] [PubMed] [Google Scholar]
- 36.Srivastava S et al. Immunogenic Chemotherapy Enhances Recruitment of CAR-T Cells to Lung Tumors and Improves Antitumor Efficacy when Combined with Checkpoint Blockade. Cancer cell (2020). [Google Scholar]
- 37.Song M et al. Low-Dose IFNγ Induces Tumor Cell Stemness in Tumor Microenvironment of Non-Small Cell Lung Cancer. Cancer research 79, 3737–3748 (2019). [DOI] [PubMed] [Google Scholar]
- 38.Maloy KJ & Uhlig HH ILC1 populations join the border patrol. Immunity 38, 630–632 (2013). [DOI] [PubMed] [Google Scholar]
- 39.Houshmand M et al. Bone marrow microenvironment: The guardian of leukemia stem cells. World journal of stem cells 11, 476–490 (2019). [DOI] [PMC free article] [PubMed] [Google Scholar]
- 40.Dunn GP, Koebel CM & Schreiber RD Interferons, immunity and cancer immunoediting. Nature reviews. Immunology 6, 836–848 (2006). [Google Scholar]
- 41.Munneke JM et al. Activated innate lymphoid cells are associated with a reduced susceptibility to graft-versus-host disease. Blood 124, 812–821 (2014). [DOI] [PubMed] [Google Scholar]
- 42.Berrien-Elliott MM et al. Multidimensional Analyses of Donor Memory-Like NK Cells Reveal New Associations with Response after Adoptive Immunotherapy for Leukemia. Cancer discovery 10, 1854–1871 (2020). [DOI] [PMC free article] [PubMed] [Google Scholar]
- 43.Fehniger TA et al. Fatal leukemia in interleukin 15 transgenic mice follows early expansions in natural killer and memory phenotype CD8+ T cells. J Exp Med 193, 219–231 (2001). [DOI] [PMC free article] [PubMed] [Google Scholar]
- 44.Bolger AM, Lohse M & Usadel B Trimmomatic: a flexible trimmer for Illumina sequence data. Bioinformatics (Oxford, England) 30, 2114–2120 (2014). [Google Scholar]
- 45.Chen S, Zhou Y, Chen Y & Gu J fastp: an ultra-fast all-in-one FASTQ preprocessor. Bioinformatics (Oxford, England) 34, i884–i890 (2018). [Google Scholar]
- 46.Dobin A et al. STAR: ultrafast universal RNA-seq aligner. Bioinformatics (Oxford, England) 29, 15–21 (2013). [Google Scholar]
- 47.Anders S & Huber W Differential expression analysis for sequence count data. Genome biology 11, R106 (2010). [DOI] [PMC free article] [PubMed] [Google Scholar]
- 48.Robinson MD, McCarthy DJ & Smyth GK edgeR: a Bioconductor package for differential expression analysis of digital gene expression data. Bioinformatics (Oxford, England) 26, 139–140 (2010). [Google Scholar]
- 49.Mootha VK et al. PGC-1alpha-responsive genes involved in oxidative phosphorylation are coordinately downregulated in human diabetes. Nature genetics 34, 267–273 (2003). [DOI] [PubMed] [Google Scholar]
- 50.Subramanian A et al. Gene set enrichment analysis: a knowledge-based approach for interpreting genome-wide expression profiles. Proceedings of the National Academy of Sciences of the United States of America 102, 15545–15550 (2005). [DOI] [PMC free article] [PubMed] [Google Scholar]
Associated Data
This section collects any data citations, data availability statements, or supplementary materials included in this article.
Supplementary Materials
Data Availability Statement
Sequencing datasets are accessible from GEO with accession number (GSE 198783). The hyperlink to deposited Geo data is https://www.ncbi.nlm.nih.gov/geo/query/acc.cgi?acc=GSE198783.
All source data are provided with this paper.