

Abstract
BACKGROUND:
A neural substrate of alcohol-related instability of gait and balance is the cerebellum. Whether disruption of neural communication between cerebellar and cortical brain regions exerts an influence on ataxia in alcohol use disorder (AUD) was the focus of this study.
METHODS:
Study groups comprised 32 abstinent AUD participants and 22 age- and sex-matched healthy controls (CTL). All participants underwent clinical screening, motor testing, and resting-state functional MR imaging analyzed for functional connectivity (FC) among 90 regions across the whole cerebrum and cerebellum. Ataxia testing quantified gait and balance with the Fregly-Graybiel Ataxia Battery conducted with and without vision.
RESULTS.
The AUD group achieved lower scores than the CTL group on balance performance, which was disproportionately worse for eyes open than eyes closed in the AUD relative to the CTL group. Differences in ataxia were accompanied by differences in FC marked by cerebellar-frontal and cerebellar-parietal hyperconnectivity and cortico-cortical hypoconnectivity in the AUD relative to the control group. Lifetime alcohol consumption correlated significantly with AUD-related FC aberrations, which explained upwards of 69% of the AUD ataxia score variance.
CONCLUSION.
Heavy, chronic alcohol consumption is associated with disorganized neural communication among cerebellar–cortical regions and contributes to ataxia in AUD. Ataxia, which is known to accelerate with age and be exacerbated with AUD, can threaten functional independence. Longitudinal studies are warranted to address whether extended sobriety quells ataxia and normalizes aberrant FC contributing to instability.
Keywords: Ataxia, Cerebellum, Alcohol Use Disorder, Resting-state fMRI, Functional Connectivity
Graphical abstract

1. INTRODUCTION
The cerebellum plays a critical role in affective, cognitive, and motor processes and is particularly vulnerable to the effects of alcohol use disorder (AUD) observed as disrupted neural communication between cerebellar and cortical brain regions (Dupuy and Chanraud, 2016; Fitzpatrick and Crowe, 2013; Moulton et al., 2014). The cerebellum influences cognition and behavior through large scale cerebellar-cortical networks via thalamic (Honnorat et al., 2021; Middleton and Strick, 2001), pontine (Sullivan et al., 2010), and striatal subcortical connections (Bostan et al., 2010). Injury to the cerebellum (Sullivan et al., 2019) and its extensive circuity in AUD implicates a broad range of functions (Abdallah et al., 2020; Oscar-Berman and Marinkovic, 2007; Sullivan and Pfefferbaum, 2005). One of the prominent symptoms from long-term chronic alcohol consumption is instability of gait and balance (Fein and Greenstein, 2013; Smith and Fein, 2011), which is associated with atrophy of brain cerebellar and cortical motor systems (postmortem: Harper and Kril, 1993; Torvik, 1987; Victor et al., 1989) (in vivo: Cardenas et al., 2020; Sullivan et al., 2000; Sullivan et al., 2015). These large scale cerebellar-cortical networks process the multiple sensory inputs (visual, vestibular, somatosensory) needed to correct disorientation and adjust body posture to prevent falls (Vassar and Rose, 2014).
Much of what we know about the role of the cerebellum and cerebellar-cortical circuits in ataxia of stance and gait in AUD comes from structural MR imaging studies (Rosenbloom et al., 1995; Sawyer et al., 2016; Shanmugarajah et al., 2016; Sullivan et al., 2006; Zhao et al., 2020). Supporting the notion that interconnected networks play a role in motor disturbances in AUD, recent functional MRI studies reported disruptions in the intrinsic dynamics of functional connectivity (FC) in cerebello-thalamo-striato-cortical circuits with prolonged use of alcohol (Gerchen et al., 2021; Hong et al., 2018; Honnorat et al., 2021; Zhu et al., 2018). Whereas some identified a specific role of nodal connections for certain functional compromise, e.g., thalamic nuclei connectivity with the hippocampus for memory and the cerebellum for balance (Honnorat et al., 2021), others highlighted the disruption of the overall brain topological architecture of the motor execution network in AUD (e.g., Abdallah et al., 2021; Zhu et al., 2018). For example, investigating whole brain topological properties, Zhu et al. (2018) found evidence for functional network reconfigurations in AUD relative to controls marked by greater local specialization and lower global coordination, greater nodal degree (i.e., sum of connections, where highly connected nodes are categorized as hubs) for cerebellar connectedness highlighting its sensitivity in AUD, and heightened connectivity strengths between cerebellar-thalamic and -striatal regions but weaker connectivity strength among cortico-subcortical nodes. Similarly, Abdallah et al. (2021) focused on whole brain dynamics of functional connections between the cerebrum and the cerebellum but did not find a specific cerebellar disruption or interregional connection in AUD individuals. Rather, an overall disturbed organization of FC dynamics emerged between the cerebellum and several cortical regions describing greater FC variability between the cerebellum and frontoparietal executive control and attention networks. Notably, cortical networks closely interact with cerebellar networks for integrating sensory, cognitive, and motor processes (Caligiore et al 2017). Conceivably, not only cerebellar functional connectivity but interacting cortico-cortical and subcortical connections are important for describing the pathophysiological brain changes in AUD (cf., Hong et al. 2018, Parks et al., 2020). These functional neuroimaging findings contribute to understanding postural control as a dynamic multi-sensorimotor integration process that relies on complex interactions among cerebello-thalamo-striato-cortical circuits (Horak and Macpherson, 2011). In people with AUD, ataxia may result from a disturbance in any one or several of these interactions among cerebellar and cortical brain regions that are reciprocally affecting each other (cf., Sullivan et al., 2015). In summary, previous neuroimaging studies observed smaller regional brain volumes, compromised interconnecting fiber integrity, and differences in functional connectivity (FC) in cerebello-thalamo-striato-cortical circuits in AUD compared to controls; however, none of these studies specifically tested a potential link between whole-brain FC aberration and ataxia in AUD.
In this study, we pursued the effect of chronic alcohol consumption on whole brain network functional connections in relation to ataxia and relative to non-AUD controls. Accordingly, we sought to determine group differences in the cerebellar-cortical and cortico-cortical FC and their relations to ataxia and drinking histories. We hypothesized that middle age to older people with a history of AUD, relative to controls, would exhibit (1) ataxia of gait and balance and (2) aberrations in the intrinsic cerebellar-cortical and cortico-cortical functional connectivity. Within the AUD group, we expected (3) that more severe disruption of cerebellar-cortical FC would be associated with greater lifetime alcohol consumption.
2. MATERIALS AND METHODS
2.1. Study design.
This study employed a cross-sectional design assessing the effects of chronic alcohol consumption on the brain’s functional network connectivity and testing relations between functional connectivity and ataxia. The study was conducted in accordance with protocols approved by the Institutional Review Boards of Stanford University and SRI International.
2.2. Sample Characteristics.
Of the 55 study participants, 33 (10 women) were diagnosed with alcohol use disorder (AUD), and 22 (10 women) were healthy control (CTL) participants. After providing written informed consent in accordance with the Declaration of Helsinki, all study participants underwent a breathalyzer screening, a clinical examination, neuropsychological testing, and magnetic resonance imaging (MRI). All participants were screened using the Structured Clinical Interview for DSM-IV (SCID) (American Psychiatric Association, 2000) (First et al., 1998) and were determined to have a SCID-5 diagnosis of AUD if they met DSM-IV criteria for alcohol dependence. Controls did not meet DSM-IV criteria for any Axis I disorder. In the AUD group, nine participants reported past nicotine use disorder (> 1 year); 16 were current smokers. One AUD participant reported current cannabis use, eight had past cannabis use disorder (> 3.8 years), 17 had past cocaine (> 1.3 years), and three past opioid (> 2.2 years) use disorders. In the CTL group, one participant had nicotine use disorder in the remote past (> 30 years), and no CTL participant reported any other drug use. AUD and CTL groups differed in the number of smokers (Chi-square = 6.49, p = .039); groups did not differ in any other drug co-use (all p’s > .05). AUD and control groups were matched in age and sex ratio. Demographic and clinical characteristics and group differences statistics are listed in Table 1. Socioeconomic status (SES) was measured using the Hollingshead index (Hollingshead, 1965), that includes education in the scoring. Higher scores correspond to poorer SES. Groups differed in years of education and SES with the CTL group having more years of education and higher SES than the AUD group; both groups had average education level beyond high school. The AUD group had not met AUD diagnostic criteria for an average of 23 months (median 5.5 months) at the time of the study. Half of the AUD sample (n=17) reported having had a drink in the past 90 days; the other half had the last drink more than 3 months before examination; 12% (n=4) maintaining alcohol abstinence for more than 1 year. Relative to the CTL group, individuals in the AUD group had higher AUDIT scores and had consumed significantly more alcohol over their lifetime (Table 1).
Table 1.
Characteristics of the study groups
| AUD M (SD) | CTL M (SD) | p | Effect Size | |
|---|---|---|---|---|
| N | 33 | 22 | ||
| Sex (M/F) | 23/10 | 12/10 | .25 | φ = 0.15 |
| Age (yrs.) | 52.4 (6.1) | 53.4 (6.5) | .97 | g = 0.00 |
| Education (yrs.) | 13.2 (2.7) | 15.7 (1.8) | <.001 | g = 1.05 |
| SES | 43.7 (18.6) | 27.9 (14.4) | .001 | g = 0.93 |
| BMI | 27.5 (5.0) | 27.5 (4.2) | .98 | g = 0.00 |
| BDI-II | 8.5 (6.8) | 0.8 (1.2) | <.001 | g = 1.44 |
| DRS-2 | 136 (5.2) | 140 (2.9) | <.001 | g = 0.90 |
| GAF | 72.4 (12.3) | 84.9 (5.7) | <.001 | g = 1.22 |
| ADL-p | 2.2 (2.8) | 1.0 (1.6) | .05 | g = 0.50 |
| ADL-i | 0.7 (0.9) | 0.1 (0.2) | <.001 | g = 0.26 |
| Lifetime alcohol consumption in kg | 1262.8 (1073.6) | 22.4 (28.3) | <.001 | g = 1.49 |
| in log kg | 3.0 (0.3) | 1.1 (0.7) | <.001 | g = 3.81 |
| AUDIT | 16.5 (11.1) | 1.6 (1.1) | <.001 | g = 1.72 |
| Age at AUD onset (years) | 27.0 (9.2) | -- | -- | -- |
| Weeks since last AUD episode | 89.8 (158.8) | -- | -- | -- |
| in log weeks | 1.5 (0.7) | -- | -- | -- |
| Days since last drink | 373.1 (935.6) | 935.8 (3279.1)a | .35 | g = 0.26 |
| in log days | 1.8 (0.9) | 1.4 (1.0) | .20 | g = 0.32 |
M (SD) = mean (standard deviation); Effect size = Chi square φ, Hedges’ g; Between group t-tests; significance level was set at p < .05, 2-tailed;
the large SD in CTL is due to 3 participants, who last drank an alcoholic beverage 4, 10, and 42 years ago
Abbreviations: AUD=Alcohol Use Disorder; CTL=controls; men/women (m/w); Age (years), education (years), socioeconomic status (SES): lower values correspond with higher SES; body mass index (BMI); Beck’s depression inventory (BDI); dementia rating scale (DRS-2); global assessment of functioning (GAF); physical activities of daily living (ADL-p); instrumental activities of daily living (ADL-i); alcohol use disorder identification test (AUDIT)
2.3. Global cognition and functioning and depressive symptoms.
Participants completed the Wechsler Test of Adult Reading (WTAR) estimating a premorbid intelligence quotient (IQ) (Wechsler, 2001), the Dementia Rating Scale (DRS-2) estimating the current general cognitive capacity (Jurica et al., 2004; Springate et al., 2014), a global assessment of functioning (GAF) (Endicott et al., 1976), and a self-assessment of depressive symptoms using the Beck Depression Inventory-II (BDI-II) (Beck et al., 1996).
Compared with the CTL group, the AUD group had lower scores on general cognitive functioning (DRS-2), global assessment of functioning (GAF), and estimated premorbid IQ (WTAR). The AUD group further reported more depressive symptoms (BDI-II) and more difficulties performing physical and instrumental activities for daily living (ADL-p, ADL-i) than the control group, which was age- and sex-matched to the AUD group (Table 1).
2.4. Ataxia Testing.
Gait and balance were tested with the Fregly-Graybiel Ataxia Battery (Fregly et al., 1972; Sullivan et al., 2000; Sullivan et al., 2019). Testing proceeded first with eyes open and then with eyes closed, under three conditions: (1) tandem standing where participants stood heel-to-toe (60 s/trial), (2) one-leg balancing where participant stood on one leg (30 s/trial for each leg), and (3) tandem walking where participants walked heel-to-toe on a line for a maximum of 10 steps. Each condition was conducted twice. If a maximum score was achieved on the first trial, the score would by default be the maximum for two trials (e.g., 60 s for trial 1 of standing heel-to-toe would result in the maximum (best) score of 120 s). Individual raw scores were transformed into percent score [for standing (xi * 100)/120 s (maximum score), for balancing (xi * 100)/60 s (maximum score), for walking (xi * 100)/20 steps (maximum score)] and the mean percent scores derived for each participant for ataxia eyes open and eyes closed conditions separately.
2.5. Magnet Resonance (MR) image acquisition and analysis
2.5.1 Structural and functional MR imaging data were acquired using a clinical whole-body GE 3T scanner. During the resting-state fMRI scan session, participants were instructed to lie relaxed in the scanner with their eyes open and not to think about anything in particular. Whole-brain structural and functional MRI data were acquired with an 8-channel head coil. Structural image series were inspected for residual motion. Whole-brain fMRI data were acquired with a T2*-weighted gradient echo planar pulse sequence (2D axial, TE=30ms; TR=2200ms; flip angle=90°; in plane resolution=3.75mm; thick=5mm; skip=0mm; slices=36; FOV=240mm; 1 NEX). Instructions were reviewed with the subject by the examiner via the scanner intercom system before the onset of the resting-state scan. A dual-echo FSE (2D axial; TR=5000ms; TE=17/102ms; thick=5 mm; skip=0mm; xy matrix=256; flip angle=90°; slices=36; FOV=240mm; 1 NEX) was used for spatially registering the fMRI data. A field map for correction of spatial distortions in the echo-planar images was generated from a gradient-recalled echo sequence pair (TR=460ms, TE=3/5ms, thickness=5mm, skip=0mm, slices=36). T1-weighted Inversion-Recovery Prepared SPGR images (TR=6.55/5.92ms, TE=1.56/1.93ms, TI=300/300ms, matrix=256×256, thick=1.25mm, skip=0 mm, 124 slices) were based on an axial structural sequence that was used for volumetric analysis.
2.5.2 Functional image preprocessing was performed using the standard preprocessing pipeline in the CONN 14.c toolbox (www.nitrc.org/projects/conn/) compatible with SPM software (Wellcome Department of Cognitive Neurology;www.fil.ion.ucl.ac.uk/spm/software/spm12/). The fMRI analysis included the whole brain and cerebellum. All images were inspected and incomplete volumes, e.g., with inferior cutoffs of the cerebellum, were excluded from the analysis. Functional images were corrected for geometric distortion (field map) and realigned. The FSE structural images were co-registered to the mean unwarped and motion-corrected functional image for each subject and functional and structural MR images were normalized to Montreal Neurological Institute (MNI) space. In addition, a scrubbing approach (Power et al., 2015) as implemented in the CONN toolbox was invoked to correct for outlier frames in resting-state time series analysis within each subject (Power et al. 2010). Framewise displacements above 1 mm or global BOLD signal changes above 3 SD were flagged as outliers. Functional volumes were smoothed with a Gaussian kernel of 8mm (FWHM). We employed the standard denoising step in the CONN toolbox; the waveform of each brain voxel was filtered using a bandpass filter (0.008/s < f < 0.09/s) to reduce the effect of low-frequency drift and high-frequency noise. Motion parameters were considered in the analyses using the component-based noise correction method (CompCor) of noise reduction along with the efficient rejection of motion and the frame-wise displacement values of each individual were calculated by ArtRepair tool (http://cibsr.stanford.edu/tools/human-brain-project/artrepair-software/artrepairinstructions.html) using the six realignment parameters. The translational movement and rotational absolute motion of all images did not exceed 2 mm and 2 degrees in any direction. The AUD and CTL groups did not differ in the number of outlier frames (mean number of outliers: CTL 1.14, AUD 2.52; P = 0.13). For first-level analyses, realignment parameters, outlier frames, and CompCor parameters were entered at the subject level. Corrected images were used in the second level between-groups random-effects analysis, allowing for improved interpretation of functional connectivity results for both correlated and anticorrelated networks (Whitfield-Gabrieli and Nieto-Castanon, 2012). Second-level between-groups, random-effects analysis. Interregional functional connectivity maps for each group were derived via individual time series correlations of activity over 135 time points, an index of synchronous activity. The regions of interest (ROI) for ROI-to-ROI analysis were derived from the Stanford 90ROI functional atlas (Shirer et al., 2012) (findlab.stanford.edu/functional_ROIs.html). Testing for differences in interregional FC between the two groups, a statistical threshold of pFDR-corrected<0.05 was considered significant.
2.5.3. Brain structural image preprocessing.
An analysis of brain regional volumes from high resolution structural SPGR scans was conducted as previously described (Fama et al., 2021; Pfefferbaum et al., 2018). In brief, preprocessing of the SPGR data involved noise removal (Coupe et al., 2008), correcting field inhomogeneity via N4ITK (Tustison et al., 2011), and segmenting the brain mask by majority voting (Rohlfing et al., 2004). Brain tissue segmentation (gray matter, white matter, and cerebrospinal fluid) of the skull-stripped T1-weighted MRI was generated via Atropos (Avants et al., 2011). The label map was further parcellated into the regions defined by the SRI24 atlas (Rohlfing et al., 2010) by non-rigidly registering the atlas to the MRI via ANTS (Avants et al., 2008). All brain volumes used in analyses were age- and head-size (intracranial volume) corrected based on 238 healthy controls, age 25 to 75 years old. To test if group differences in regional gray matter volumes underlying BOLD signal were influencing group differences in interregional FC, brain regional volumes showing group differences (Supplemental Table 1) were entered as covariates to a MANCOVA on FC in AUD and CTL.
2.6. Statistical analyses
To examine group differences in ataxia, ANOVAs were conducted using IBM SPSS v.27 (Armonk, NY, USA) with group (AUD, CTL) as between-subjects factor and condition (eyes open, closed) as within-subject factor for (1) stand heel-to-toe, (2) walk heel-to-toe, and (3) balance on one leg, with the latter having leg (left, right) as an additional within-subject factor. For potential inclusion of age as a covariate to the regression models, correlation analyses first tested the relation between age and ataxia and between age and FC aberration over all participants. Multiple regressions analyses tested for the amount of ataxia variance explained by FC abnormalities in AUD (relative to CTL). The directional hypothesis of greater FC aberration (that is, AUD difference in FC from CTL) with higher lifetime alcohol consumption was tested with one-tailed Pearson correlations. All alcohol-history measures were log-transformed for the whole sample to reduce skewness in the data distribution. The alpha level was set to 0.05 for all statistical tests, and FDR-corrected p-levels were applied for multiple comparisons where applicable (Benjamini et al., 2001; Benjamini and Hochberg, 1995).
3. RESULTS
3.1. Resting-state functional connectivity (FC)
SPM-based analyses included all 90 ROIs comparing FC differences between AUD and CTL groups. Table 2 summarizes significant group differences after correction for multiple comparisons.
Table 2.
Group differences in resting-state interregional functional connectivity
| ROI (BA) | ROI (BA) | t (53) | p FDR |
|---|---|---|---|
| AUD > CTL | |||
| L. lobules VIII, VIIb; cerebellum | R. MFG (BA 46,9) | 4.11 | .0121 |
| L. Crus I, Crus II, lobule VI; cerebellum | Bi. precuneus (BA 7,5) | 4.00 | .0175 |
| L. MFG, SFG, precentral gyrus (BA 6) | Bi. MCC (BA 23) | 4.06 | .0145 |
| CTL > AUD | |||
| R. IFG (BA 47,45) | R. SMA (BA 6) | −4.32 | .0060 |
| R. IFG (BA 45,48) | R. insula (BA 48,47,13) | −4.06 | .0141 |
| Bi. mPFC, ACC, OFC (BA 9,10,24,32,11) | L. MOG, SOG (BA 18,19,17) | −3.86 | .0275 |
| R. caudate | L. MFG, SFG, precentral gyms (BA 6) | −3.48 | .0440 |
Abbreviations: ROI = region of interest; BA = Brodmann Areas; ACC = anterior cingulate cortex; IFG = inferior frontal gyrus; MFG = middle frontal gyrus; mPFC = medial prefrontal cortex; OFC = orbitofrontal cortex; SMA = supplementary motor area; MCC = middle cingulate cortex; MOG = middle occipital gyrus; SOG = superior occipital gyrus; L = left, R = right, Bi = bilateral; for ROIs, see the Stanford FIND lab 90 ROI atlas (Shirer et al., 2012), https://findlab.stanford.edu/functional_ROIs.html
Relative to the CTL group, the AUD group exhibited greater interregional FC between the left cerebellum (lobules VIII, VIIb) and the right middle frontal cortex (R. MFG, BA 46,9), between the left cerebellum (Crus I, Crus II, lobule VI) and the right precuneus, and between the left middle frontal gyrus (L. MFG, SFG, precentral gyrus, BA 6) and the middle cingulate cortex (MCC, BA 23) (Figure 1, red lines). Further, the AUD group showed a pattern of lower FC relative to the CTL group between the left MFG and right caudate nucleus, between the supplementary motor area (R. SMA, BA 6) and right inferior frontal gyrus (R. IFG, BA 47,45), between the right inferior frontal gyrus (R. IFG, BA 45,48) and right insula (BA 48,47,13), and between the anterior cingulate cortex (mPFC, ACC, OFC, BA 9,10,24,32,11) and left middle occipital gyrus (L. MOG, SOG, BA 18,19,17) (Figure 1, blue lines).
Figure 1.

Functional connectivity (FC). Group differences in resting-state FC between AUD and CTL groups (p FDR corrected < 0.05, 2-tailed). Red lines illustrate hyper-connectivity and blue lines illustrate hypo-connectivity in the AUD group relative to the CTL group.
Abbreviations: L = left; R = right; ACC = anterior cingulate cortex; Crus I, II and lobule VIII, VIIb = cerebellar sub-regions; IFG = inferior frontal gyrus; MCC = middle cingulate cortex; MFG = middle frontal gyrus; MOG = middle occipital gyrus; mPFC = medial prefrontal cortex; SFG = superior frontal gyrus; SMA = supplementary motor area
Exploratory analyses.
A MANOVA with group and sex as between-subjects factors revealed sex effects for left cerebellar (lobules VIII, VIIb)–MFC FC (F(1,54) = 4.47, p = .040), IFG–SMA FC (F(1,54) = 5.10, p = .028) and a trend for a group-by-sex interaction for IFG–insula FC (F(1,54) = 3.48, p = .068), all showing more AUD-related FC aberrations in men than women (Supplemental Figure S1). A MANCOVA with group and current nicotine use as between-subject factors did not show a significant effect of nicotine use on AUD-related FC aberrations (Pillai’s Trace F(7,38) = 0.72, p = .66; univariate tests ROI–ROI FC, all p’s > .05).
3.1.1. Controlling for gray matter volumes.
Group differences emerged for precentral, inferior frontal, orbitofrontal, and insula volumes of structural substrates, such that the volumes of the AUD group were smaller than those of the CTL group (Supplemental Table S1). Statistically controlling for these volume differences indicated a moderate effect of precentral volumes on FC aberrations between the cerebellum and the MFG (BA 46,9); yet the group difference for all FC including the cerebellar-MFC FC remained significant (Supplemental Table S2).
3.2. FC aberration predictions of ataxia test performance
3.2.1. Ataxia.
Mean ataxia scores (all tests) differed between groups (F (1,45) = 7.81, p = .008, partial η2 = .15) and condition (eyes open, closed) (F (1,45) = 293.5, p < .001, partial η2 = .87) but did not show a group-by-condition interaction (F (1,45) = 2.63, p = .11, partial η2 = .06). In ataxia subtests, groups differed significantly on one-leg balancing, showed a trend for tandem standing, and did not differ in tandem walking (Table 3 A, Figure 2). Group differences in one-leg balance performance was not related to leg tested. Table 3 B shows ataxia scores for each measure and group.
Table 3 A.
Ataxia. Group Differences per Ataxia Test Condition
| (1) Stand heel-to-toe | |||
|---|---|---|---|
|
| |||
| Predictor | F (1,45) | p | partial η2 |
| group (AUD, CTL) | 3.818 | .057 | .078 |
| condition (eyes open, closed) | 56.583 | <.001 | .558 |
| group x condition | 0.408 | .526 | .009 |
| (2) Walk heel-to-toe | |||
| group (AUD, CTL) | 1.021 | .318 | .022 |
| condition (eyes open, closed) | 204.478 | <.001 | .820 |
| group x condition | 0.020 | .889 | .000 |
| (3) Balance on one leg | |||
| group (AUD, CTL) | 17.087 | <.001 | .275 |
| condition1 (eyes open, closed) | 152.407 | <.001 | .772 |
| condition2 (leg left, right) | 0.439 | .511 | .010 |
| condition1 x condition2 | 0.038 | .846 | .001 |
| group x condition1 | 6.081 | .018 | .119 |
| group x condition2 | .239 | .628 | .005 |
| group x condition1 x condition2 | .363 | .550 | .008 |
Mixed-measures ANOVAs with group (AUD, CTL) as between-subjects factor and condition (eyes open, closed) as within-subject factor for (1) stand heel-to-toe, (2) walk heel-to-toe, and for (3) balance on one leg, here with balance leg (condition2: left leg, right leg) as additional within-subject factor.
Note: The findings are confirmed when controlling for SES and BDI-II as covariates.
Figure 2.
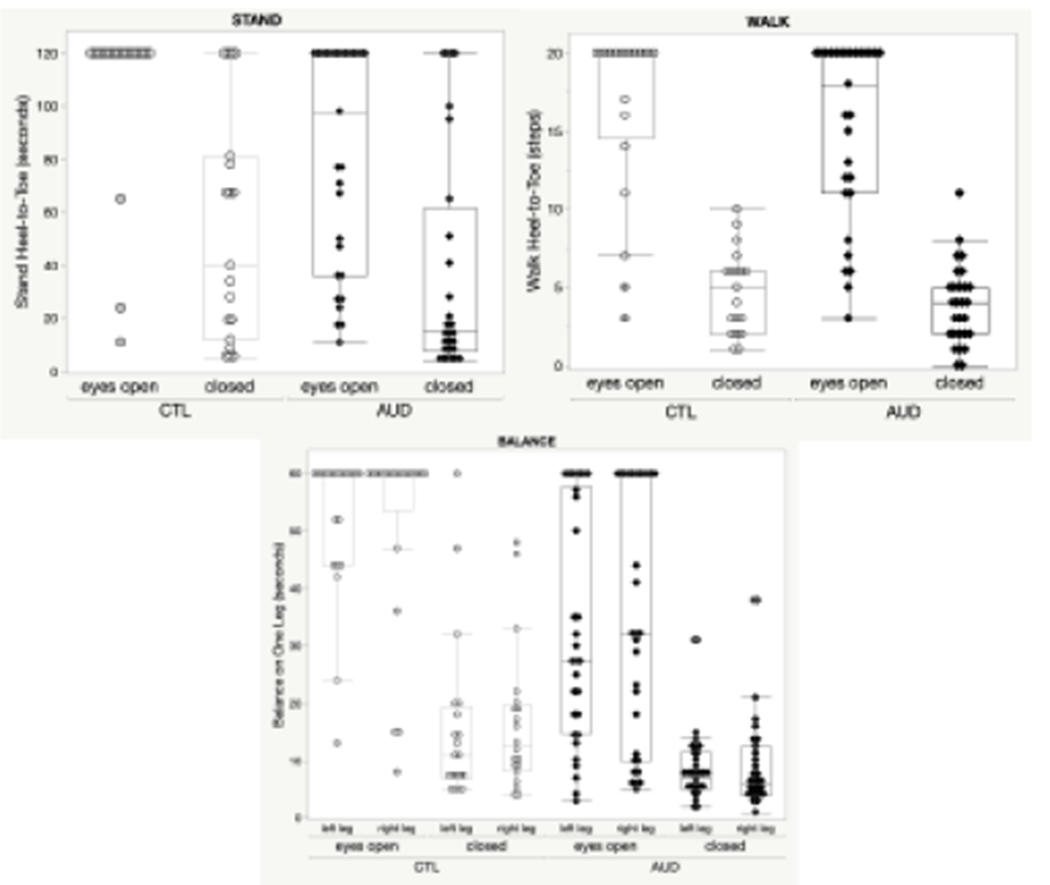
Scatter Box Plots for Ataxia Tests. Stand Heel-to-Toe Stand, Walk Heel-to-Toe Walk, and Balance on One Leg using performance raw scores. All measures are depicted for group (AUD, CTL) and condition eyes (open, closed), and for balance, the condition leg (left, right). CTL = Controls; AUD = Alcohol Use Disorder.
Table 3 B.
Ataxia Raw Scores in the Study Groups
| AUD | CTL | |
|---|---|---|
| M (SD) | M (SD) | |
| Raw scores in seconds 1 or steps 2 | ||
| Stand heel-to-toe 1 – eyes open | 81.7 (43.2) | 106.3 (81.7) |
| Stand heel-to-toe – eyes closed | 37.2 (42.8) | 53.5 (43.4) |
| Walk heel-to-toe 2 – eyes open | 15.6 (5.4) | 16.7 (5.8) |
| Walk heel-to-toe – eyes closed | 3.9 (2.6) | 4.6 (2.9) |
| Balance on left leg 1 – eyes open | 32.1 (20.2) | 53.1 (11.9) |
| Balance on left leg – eyes closed | 8.3 (5.6) | 15.7 (15.1) |
| Balance on right leg – eyes open | 34.4 (22.0) | 53.0 (15.9) |
| Balance on right leg – eyes closed | 8.8 (7.5) | 16.4 (13.0) |
| Mean scores in seconds | ||
| Balance – eyes open | 33.3 (20.1) | 53.1 (11.9) |
| Mean B – eyes closed | 8.6 (6.0) | 16.0 (13.0) |
| Percent2 of maximum scores achieved (all tests) | ||
| Ataxia – eyes open | 67.1 (24.8) | 86.8 (19.8) |
| Ataxia – eyes closed | 21.5 (16.3) | 31.7 (19.8) |
Abbreviations: AUD = Alcohol Use Disorder, CTL = controls; M (SD) = mean (standard deviation)
mean (left leg, right leg) balance scores
lower precent = poorer performance
3.2.2. FC aberration in AUD predicted ataxia.
Multiple regression analyses tested the predictive value of FC aberrations in AUD for mean ataxia measures with eyes open and eyes closed. All identified FC aberrations in AUD together explained 69% of ataxia scores with eyes open (F (7,21) = 6.60, p < .001, R2 = .69) and 50% of ataxia scores with eyes closed (F (7,21) = 2.85, p = .031, R2 = .50). Four FCs were independent predictors of ataxia scores with eyes open: Insula – IFG (t = 3.37, p = .003), SMA – IFG (t = −4.20, p < .001), Cereb. – Precuneus (t = −2.99, p = .007), and Cereb. – MFC (t = −4.72, p < .001). Two FCs were independent predictors of ataxia with eyes closed: Insula – IFG (t = 2.92, p = .008) and SMA – IFG (t = −2.26, p = .035). Figure 3 depicts the partial regression plots of the significant predictors of ataxia for eyes open and closed.
Figure 3.
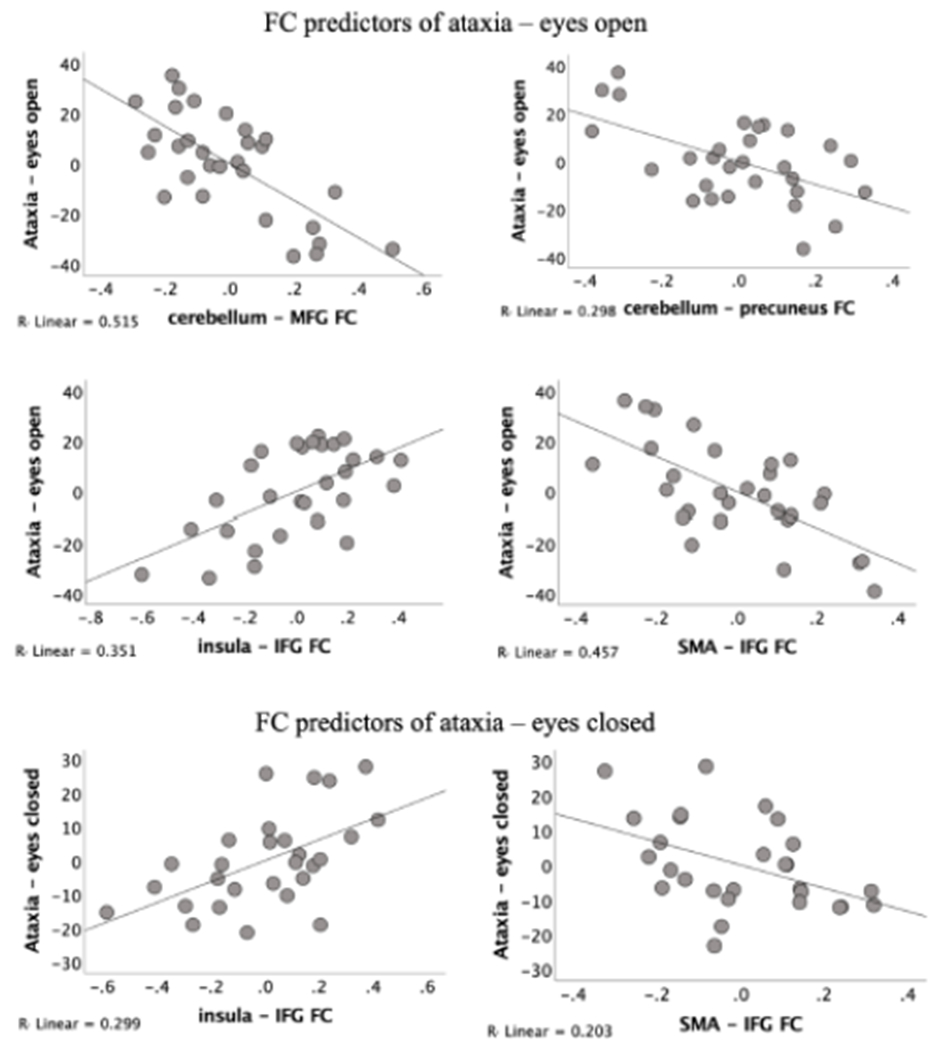
Partial regression plots in AUD. Relations between interregional functional connectivity (FC) and ataxia (mean percent of maximum scores achieved – all tests) in AUD. Y-axis: Residual values of the partial regression and positive if they are above the regression line (reflecting better ataxia performance or stronger FC aberration), negative if they are below the regression line (reflecting poorer ataxia performance or weaker FC aberration), and zero if the regression line actually passes through the point. X-axis: correlation values, normalized to a Z scale (Zr) denoting functional connectivity (FC) strength between two brain regions (SPM12; www.fil.ion.ucl.ac.uk/spm/software/spm12/).
In addition, Table 4 summarizes six multiple regression analyses, one conducted for each of the three ataxia tests (walk heel-to-toe, stand heel-to-toe, balance on one leg) and condition (eyes open, closed). Cerebellar-prefrontal FC was a significant independent predictor for all three ataxia subtests with eyes open in the AUD group.
Table 4.
FC Abnormalities in AUD as Predictors of Performance for Each Ataxia Test Condition
| Multiple Regression | Eyes open | Eyes closed | ||||
|---|---|---|---|---|---|---|
|
| ||||||
| Analyses 1-6 | Stand | Walk | Balance | Stand | Walk | Balance |
| F value | 2.02 | 3.87 | 3.66 | 2.33 | 2.51 | 1.27 |
| p value | .027 | .007 | .01 | .07 | .05 | .31 |
| Effect size (R2) in % | 49% | 56% | 55% | 45% | 47% | 31% |
| Predictors | (t-Ratio) p | (t-Ratio) p | (t-Ratio) p | (t-Ratio) p | (t-Ratio) p | (t-Ratio) p |
| (+) MFG – MCC | (0.02) .98 | (1.88) .074 | (−0.47) .65 | (−0.32) .76 | (−0.43) .67 | (−0.76) .46 |
| (−) MFG – caudate | (−0.08) .94 | (−2.68) .014 | (−0.43) .67 | (1.65) .12 | (0.08) .94 | (0.12) .90 |
| (−) IFG – insula | (2.63) .016 | (0.76) .46 | (2.74) .012 | (2.10) .049 | (3.84) .001 | (1.15) .26 |
| (−) IFG – SMA | (−1.42) .17 | (−4.14) .001 | (−2.80) .011 | (−2.11) .048 | (−0.79) .44 | (−1.80) .088 |
| (+) Cereb. – precuneus | (−0.55) .59 | (−2.37) .028 | (−3.00) .007 | (0.68) .50 | (−0.37) .71 | (−0.87) .39 |
| (+) Cereb. – MFG | (−3.80) .001 | (−2.72) .013 | (−2.32) .031 | (−0.88) .39 | (−2.09) .05 | (−1.80) .088 |
| (−) ACC – MOG | (−0.80) .43 | (0.62) .54 | (−1.01) .32 | (−0.69) .50 | (−1.01) .33 | (−0.30) .77 |
Note. FC aberration in AUD relative to CTL: (+) hyper-connectivity; (−) hypo-connectivity;
Abbreviations: MFG = middle frontal gyrus; MCC = middle cingulate cortex; IFG = inferior frontal gyrus; Cereb. = cerebellar ROIs; ACC = anterior cingulate cortex; MOG = middle occipital gyrus
3.2.3. Relation between alcohol consumption histories and FC aberrations.
In the AUD group, cerebellar-prefrontal hyper-connectivity correlated with greater alcohol consumption (r = .46, p < .05 corrected for multiple comparisons) (Figure 4). Correlations exploring regional FC and abstinence measures of days since last drink and time since last AUD episode failed to yield relations that survived correction for multiple comparisons.
Figure 4.

Correlation plots on FC and alcohol. Relationship between cerebellar-prefrontal cortical (R. MFG) hyper-connectivity and higher lifetime alcohol consumption (log kg) in AUD (left panel) and controls (CTL, right panel). Values on y-axis are correlation values, normalized to a Z scale (Zr) denoting functional connectivity (FC) strength between two brain regions (SPM12; www.fil.ion.ucl.ac.uk/spm/software/spm12/).
4. DISCUSSION
This study identified aberrations in selective intrinsic functional network connections that were related to ataxia in AUD. Relative to an age- and sex-matched control group, the AUD group exhibited poorer postural stability together with regional cerebellar-cortical hyperconnectivity and cortico-cortical hypoconnectivity. These neurofunctional aberrations explained upwards of 69% of the ataxia variance in the AUD group.
Our whole-brain interregional FC analysis revealed a mirror pattern that is consistent with a recent FDG-PET study (Ritz et al., 2019), which reported complementary cerebellar hypermetabolism and cortical hypometabolism in premotor and frontal regions related to ataxia in AUD. The specific neurofunctional connections affected in AUD showed overlapping and discrete mechanisms for balance and gait deficits. Cortico-cortical hypoconnectivity was associated with worse ataxia, for both eyes open and closed. Regression analyses identified IFG–insular and IFG–SMA hypoconnectivity as independent predictors over and above the contribution of all other FC aberrations. These regions are part of larger sensorimotor (Kipping et al., 2013) and executive control systems (Fama et al., 2019) suggesting that top-down control mechanisms are essential for postural balance and that disruption of these mechanisms results in postural instability in AUD. The only neurofunctional aberration in AUD that was related to better balance performance was the IFG–SMA hypoconnectivity, suggesting the converse, that is, that this connection has the potential of contributing to signs of ataxia if engaged or exhibiting hyperconnectivity.
Exploratory analyses revealed sex differences in alcohol-related aberrations for IFG–SMA, IFG–insular, and cerebellar – MFG connections that were more pronounced in men than women with AUD for both hyper- and hypoconnectivities. Although these findings indicate that certain AUD-related FC aberrations are differently sensitive in women and men, they do not support a greater neurofunctional vulnerability to alcohol insult in women compared to men (e.g., Lingford-Hughes et al, 2000; Kirson el al., 2021). It should be noted that our exploration of sex differences focused on alcohol-sensitive functional connections, not FC per se, and was limited by the small number of women in the sample. The question of sex effects in relation to cerebellar connections that are sensitive to chronic alcohol insult warrants further investigation with larger samples and equal sex distribution.
Irrespective of group, balance and gait were poorer with eyes closed and improved with eyes open. Thus, similar to controls, AUD were able to use visual information to reduce postural instability (see also Sullivan et al., 2006). The ability to balance is a multicomponent process, involving cortical visual, vestibular, and cerebellar pathways (Grimaldi and Manto, 2012). For example, in the absence of visual feedback, cerebellar patients have difficulty estimating the direction of finger pointing (Synofzik et al., 2008). The cerebellum provides feedback to one’s own movement based on sensory, vestibular, and visual information and triggers appropriate corrections (D’Angelo and Casali, 2012). Consistent with this feedback in the current study, we found that cerebellar-MFG and cerebellar-precuneus FC in AUD were significant independent predictors of ataxia with eyes open, but not eyes closed. Supporting the role of AUD in our findings, abnormalities in cerebellar-MFG FC were greater with higher levels of lifetime alcohol consumption. Thus, we speculate that these sensory-dependent mechanisms, both liable for disturbance in AUD yet available with vision, may underlie the hyperconnectivity in cerebellar sensorimotor feedback loops in attempting to overcome balance deficits.
Functional connections generally can adapt to demands. Accordingly, some studies have considered cerebellar hypermetabolism (Blum et al., 2018; Pitel et al., 2009; Ritz et al., 2016), heightened cerebellar activation (Desmond et al., 2003), and cerebellar hyper-connectivity during tasks (Chanraud et al., 2013) to reflect compensatory mechanisms to overcome cortically-based impairment. When such heightened cerebellar activation patterns occur in the context of cortical deficits and are related to preserved or enhanced performance, compensation can be deduced (cf., Chanraud et al., 2013). However, no such pattern was observed in the regression models for balance and gait performance measures herein. Rather, cerebellar-prefrontal hyperconnectivity was consistently negatively related to balance, tandem standing, and tandem walking with eyes open. Also, cerebellar-parietal hyperconnectivity predicted ataxia with poorer balance and tandem walking. In the presence of cortical circuit abnormalities, cerebellar hyperactivation and connectivity were predictive of greater ataxia, as reported in the PET study of Ritz and colleagues (Ritz et al., 2019). In our study, the cerebellar regions exhibiting hyperconnectivity to precuneus and prefrontal cortices are part of the default mode network (DMN) (Habas et al., 2009) with some overlap for the cognitive control network and touching the sensory-motor network (Buckner et al., 2011) (see Supplemental Figure S2), and are particularly sensitive to AUD. For example, we previously observed that the normal DMN deactivation pattern during task processing was disturbed in AUD (Schulte et al., 2012). Failure to suppress the DMN when engaged in a task is associated with poor performances (Whitfield-Gabrieli et al., 2009). Chanraud et al. (2011) specifically noted a desynchronization of the dynamic coupling for various cerebellar DMN nodes that modulate task and rest in AUD. Consistent with these observations, our data suggest that ataxia in AUD is, at least in part, attributable a corrupted intrinsic synchronization of cerebellar-cortical nodes and interconnected cortico-cortical networks. Notably, the identified FC aberrations in our study were not due to regional gray matter volume differences between groups. Although smaller precentral volumes were modestly correlated with cerebellar-MFG FC, frontal-based connectivity endured correction for this volume deficit.
4.1. Limitations.
Our study has several limitations including a relatively small sample size, a restricted age range (42 to 69 years), and a cross-sectional design. Accordingly, with age-matched study groups, we did not investigate aging effects on FC and ataxia in AUD. As normal aging is associated with degradation of sensory and motor abilities, aging may place AUD individuals at a heightened risk for neurofunctional impairment with consequences for daily life activities such as dressing, getting in and out of a car, which require balancing on one leg. For example, in a recent longitudinal study that employed a larger sample with an age range spanning from 25 to 75 years, age was a strong predictor of one-leg standing in AUD (Sullivan et al., 2021). Longitudinal studies are thus warranted that measure cerebellar and cortical FC in relation to ataxia and drinking behaviors.
Finally, our sample had not met AUD criteria in 1 ½ years on average, which suggests long-term differences in the intrinsic functional brain circuitry underwriting ataxia in AUD. Rosenbloom et al. (Rosenbloom et al., 2004) found that deficits in cognition and postural stability persisted after 3 months of abstinence or reduced drinking in AUD individuals. Although improvement of balance can occur with longer abstinence, recovery may not be complete (Fein and Greenstein, 2013; Schmidt et al., 2014; Smith and Fein, 2011). Further to this point, Smith and Fein (Smith and Fein, 2011) found less severe ataxia in long-term than shortterm abstinent AUD individuals. Morphometric studies also indicate recovery of cerebellar volume deficits with longer duration of abstinence (Cardenas et al., 2020). Because our study is cross-sectional, we cannot estimate recovery of function and neural networking with length of abstinence. In addition, our findings of cerebellar FC relevance for ataxia in AUD warrant future analyses with greater focus on cerebellar subregional FC, e.g., using the Buckner cerebellar ROI atlas (Bruckner et al., 2011). Despite these limitations, our study provided evidence for measurable deficits in the ability to maintain balance in abstinent AUD that were explained in large part by abnormalities in cerebellar and cortical neurofunctional network connections.
4. CONCLUSION
FC aberrations observed herein are consistent with other neurofunctional studies confirming relevance of cerebellar–cortical pathophysiology for ataxia in AUD (Abdallah et al., 2021; Ritz et al., 2019; Sullivan et al., 2006; Zhu et al., 2018). Our study provides evidence for a disorganized neural communication with cerebellar-based hyperconnectivity and cortical-based hypoconnectivity contributing to ataxia in abstinent AUD individuals. Ataxia has the potential of threatening functional independence, a potential that is heightened with aging and exacerbated with AUD but diminished with extended sobriety.
Supplementary Material
Highlights.
Chronic alcohol consumption is associated with postural instability
Ataxia remains in people with an alcohol use disorder (AUD) despite sobriety
Neurofunctional communication is altered in abstinent AUD relative to controls
Dysfunctional cerebellar-cortical connectivity predicts up to 69% of ataxia scores
AUD-related ataxia can potentially threaten functional independence
Acknowledgements
We thank Ryan Goodcase, Joshua Karpf, Ember Kalon, Eden Gallanter, Priya Asok, Stephanie Sassoon for assistance with recruitment, screening, clinical interviewing, and testing of study participants and data oversight.
Funding
This work was supported by the National Institute on Alcohol Abuse and Alcoholism AA010723.
Abbreviations:
- AUD
alcohol use disorder
- CTL
non-AUD age- and sex-matched controls
- FC
functional connectivity
- rs-fMRI
resting-state functional MR imaging
Footnotes
Publisher's Disclaimer: This is a PDF file of an unedited manuscript that has been accepted for publication. As a service to our customers we are providing this early version of the manuscript. The manuscript will undergo copyediting, typesetting, and review of the resulting proof before it is published in its final form. Please note that during the production process errors may be discovered which could affect the content, and all legal disclaimers that apply to the journal pertain.
All authors report no financial interest or potential conflict of interest.
References
- Abdallah M, Farrugia N, Chirokoff V, Chanraud S, 2020. Static and dynamic aspects of cerebro-cerebellar functional connectivity are associated with self-reported measures of impulsivity: A resting-state fMRI study. Netw Neurosci 4, 891–909. [DOI] [PMC free article] [PubMed] [Google Scholar]
- Abdallah M, Zahr NM, Saranathan M, Honnorat N, Farrugia N, Pfefferbaum A, Sullivan EV, Chanraud S, 2021. Altered Cerebro-Cerebellar Dynamic Functional Connectivity in Alcohol Use Disorder: a Resting-State fMRI Study. Cerebellum. [DOI] [PMC free article] [PubMed] [Google Scholar]
- Avants BB, Epstein CL, Grossman M, Gee JC, 2008. Symmetric diffeomorphic image registration with cross-correlation: evaluating automated labeling of elderly and neurodegenerative brain. Medical image analysis 12, 26–41. [DOI] [PMC free article] [PubMed] [Google Scholar]
- Avants BB, Tustison NJ, Song G, Cook PA, Klein A, Gee JC, 2011. A reproducible evaluation of ANTs similarity metric performance in brain image registration. Neuroimage 54, 2033–2044. [DOI] [PMC free article] [PubMed] [Google Scholar]
- Beck AT, Steer RA, Brown GK, 1996. Beck depression inventory-II. San Antonio 78, 490–498. [Google Scholar]
- Benjamini Y, Drai D, Elmer G, Kafkafi N, Golani I, 2001. Controlling the false discovery rate in behavior genetics research. Behav Brain Res 125, 279–284. [DOI] [PubMed] [Google Scholar]
- Benjamini Y, Hochberg Y, 1995. Controlling the false discovery rate: a practical and powerful approach to multiple testing. Journal of the Royal Statistical Society: Series B (Methodological) 57, 289–300. [Google Scholar]
- Blum D, la Fougere C, Pilotto A, Maetzler W, Berg D, Reimold M, Liepelt-Scarfone I, 2018. Hypermetabolism in the cerebellum and brainstem and cortical hypometabolism are independently associated with cognitive impairment in Parkinson’s disease. Eur J Nucl Med Mol Imaging 45, 2387–2395. [DOI] [PubMed] [Google Scholar]
- Bostan AC, Dum RP, Strick PL, 2010. The basal ganglia communicate with the cerebellum. Proc Natl Acad Sci U S A 107, 8452–8456. [DOI] [PMC free article] [PubMed] [Google Scholar]
- Buckner RL, Krienen FM, Castellanos A, Diaz JC, & Yeo BT (2011). The organization of the human cerebellum estimated by intrinsic functional connectivity. J Neurophysiol 106(5), 2322–2345. [DOI] [PMC free article] [PubMed] [Google Scholar]
- Caligiore D, Pezzulo G, Baldassarre G, Bostan AC, Strick PL, Doya K, … & Herreros I, 2017. Consensus paper: towards a systems-level view of cerebellar function: the interplay between cerebellum, basal ganglia, and cortex. The Cerebellum, 16(1), 203–229. [DOI] [PMC free article] [PubMed] [Google Scholar]
- Cardenas VA, Hough CM, Durazzo TC, Meyerhoff DJ, 2020. Cerebellar Morphometry and Cognition in the Context of Chronic Alcohol Consumption and Cigarette Smoking. Alcohol Clin Exp Res 44, 102–113. [DOI] [PMC free article] [PubMed] [Google Scholar]
- Chanraud S, Pitel AL, Pfefferbaum A, & Sullivan EV, 2011. Disruption of functional connectivity of the default-mode network in alcoholism. Cereb Cortex 21(10), 2272–2281. [DOI] [PMC free article] [PubMed] [Google Scholar]
- Chanraud S, Pitel AL, Müller-Oehring EM, Pfefferbaum A, Sullivan EV, 2013. Remapping the brain to compensate for impairment in recovering alcoholics. Cereb Cortex 23, 97–104. [DOI] [PMC free article] [PubMed] [Google Scholar]
- Coupe P, Yger P, Prima S, Hellier P, Kervrann C, Barillot C, 2008. An optimized blockwise nonlocal means denoising filter for 3-D magnetic resonance images. IEEE Trans Med Imaging 27, 425–441. [DOI] [PMC free article] [PubMed] [Google Scholar]
- D’Angelo E, Casali S, 2012. Seeking a unified framework for cerebellar function and dysfunction: from circuit operations to cognition. Front Neural Circuits 6, 116. [DOI] [PMC free article] [PubMed] [Google Scholar]
- Desmond JE, Chen SH, DeRosa E, Pryor MR, Pfefferbaum A, Sullivan EV, 2003. Increased frontocerebellar activation in alcoholics during verbal working memory: an fMRI study. Neuroimage 19, 1510–1520. [DOI] [PubMed] [Google Scholar]
- Dupuy M, Chanraud S, 2016. Imaging the Addicted Brain: Alcohol. Int Rev Neurobiol 129, 1–31. [DOI] [PubMed] [Google Scholar]
- Endicott J, Spitzer RL, Fleiss JL, Cohen J, 1976. The global assessment scale. A procedure for measuring overall severity of psychiatric disturbance. Arch Gen Psychiatry 33, 766–771. [DOI] [PubMed] [Google Scholar]
- Fama R, Le Berre AP, Sassoon SA, Zahr NM, Pohl KM, Pfefferbaum A, Sullivan EV, 2019. Relations between cognitive and motor deficits and regional brain volumes in individuals with alcoholism. Brain Struct Funct 224, 2087–2101. [DOI] [PMC free article] [PubMed] [Google Scholar]
- Fama R, Le Berre AP, Sassoon SA, Zahr NM, Pohl KM, Pfefferbaum A, Sullivan EV, 2021. Memory impairment in alcohol use disorder is associated with regional frontal brain volumes. Drug Alcohol Depend 228, 109058. [DOI] [PMC free article] [PubMed] [Google Scholar]
- Fein G, Greenstein D, 2013. Gait and balance deficits in chronic alcoholics: no improvement from 10 weeks through 1 year abstinence. Alcohol Clin Exp Res 37, 86–95. [DOI] [PMC free article] [PubMed] [Google Scholar]
- First M, Spitzer R, Gibbon M, Williams J, 1998. Structured clinical interview for DSM-IV axis I disorders: patient edition (February 1996 final). SCID-I/P. [Google Scholar]
- Fitzpatrick LE, Crowe SF, 2013. Cognitive and emotional deficits in chronic alcoholics: a role for the cerebellum? Cerebellum 12, 520–533. [DOI] [PubMed] [Google Scholar]
- Fregly AR, Graybiel A, Smith MJ, 1972. Walk on floor eyes closed (WOFEC): a new addition to an ataxia test battery. Aerosp Med 43, 395–399. [PubMed] [Google Scholar]
- Gerchen MF, Weiss F, Kirsch M, Rentsch A, Halli P, Kiefer F, Kirsch P, 2021. Dynamic frontostriatal functional peak connectivity (in alcohol use disorder). Hum Brain Mapp 42, 36–46. [DOI] [PMC free article] [PubMed] [Google Scholar]
- Grimaldi G, Manto M, 2012. Topography of cerebellar deficits in humans. Cerebellum 11, 336–351. [DOI] [PubMed] [Google Scholar]
- Habas C, Kamdar N, Nguyen D, Prater K, Beckmann CF, Menon V, & Greicius MD, 2009. Distinct cerebellar contributions to intrinsic connectivity networks. J Neurosci, 29, 8586–8594. [DOI] [PMC free article] [PubMed] [Google Scholar]
- Harper CG, Kril JJ, 1993. Neuropathological changes in alcoholics. In: Hunt WA, Nixon SJ (Eds.), Alcohol induced brain damage: NIAAA Research Monograph No. 22. National Institute of Health, Rockville, MD, pp. 39–69. [Google Scholar]
- Hollingshead AB, 1965. Two factor index of social position. 1957. Yale University: New Haven, Connecticut. [Google Scholar]
- Hong JY, Müller-Oehring EM, Pfefferbaum A, Sullivan EV, Kwon D, Schulte T, 2018. Aberrant blood-oxygen-level-dependent signal oscillations across frequency bands characterize the alcoholic brain. Addiction biology 23, 824–835. [DOI] [PMC free article] [PubMed] [Google Scholar]
- Honnorat N, Saranathan M, Sullivan EV, Pfefferbaum A, Pohl KM, Zahr NM, 2021. Performance ramifications of abnormal functional connectivity of ventral posterior lateral thalamus with cerebellum in abstinent individuals with Alcohol Use Disorder. Drug Alcohol Depend 220, 108509. [DOI] [PMC free article] [PubMed] [Google Scholar]
- Horak FB, Macpherson JM, 2011. Postural orientation and equilibrium. In: Terjung R (Ed.), Comprehensive Physiology. John Wiley, Hoboken, NJ, USA. [Google Scholar]
- Jurica P, Leitten C, Mattis S, 2004. DRS-2 dementia rating scale-2: Professional manual. Psychological Assessment 631. [Google Scholar]
- Kipping JA, Grodd W, Kumar V, Taubert M, Villringer A, Margulies DS, 2013. Overlapping and parallel cerebello-cerebral networks contributing to sensorimotor control: an intrinsic functional connectivity study. Neuroimage 83, 837–848. [DOI] [PubMed] [Google Scholar]
- Lingford-Hughes AR, Acton PD, Gacinovic S, Boddington SJA, Costa DC, Pilowsky LS, … & Kerwin RW, 2000. Levels of γ-Aminobutyric Acid-Benzodiazepine Receptors in Abstinent, Alcohol-Dependent Women: Preliminary Findings From an 123I-Iomazenil Single Photon Emission Tomography Study. Alcohol Clin Exp Res 24(9), 1449–1455. [PubMed] [Google Scholar]
- Middleton FA, Strick PL, 2001. Cerebellar projections to the prefrontal cortex of the primate. J Neurosci 21, 700–712. [DOI] [PMC free article] [PubMed] [Google Scholar]
- Moulton EA, Elman I, Becerra LR, Goldstein RZ, Borsook D, 2014. The cerebellum and addiction: insights gained from neuroimaging research. Addict Biol 19, 317–331. [DOI] [PMC free article] [PubMed] [Google Scholar]
- Oscar-Berman M, Marinkovic K, 2007. Alcohol: effects on neurobehavioral functions and the brain. Neuropsychol Rev 17, 239–257. [DOI] [PMC free article] [PubMed] [Google Scholar]
- Parks MH, Greenberg DS, Nickel MK, Dietrich MS, Rogers BP, & Martin PR, 2010. Recruitment of additional brain regions to accomplish simple motor tasks in chronic alcohol-dependent patients. Alcoholism, Clinical and Experimental Research 34(6), 1098–1109. [DOI] [PubMed] [Google Scholar]
- Pfefferbaum A, Zahr NM, Sassoon SA, Kwon D, Pohl KM, Sullivan EV, 2018. Accelerated and Premature Aging Characterizing Regional Cortical Volume Loss in Human Immunodeficiency Virus Infection: Contributions From Alcohol, Substance Use, and Hepatitis C Coinfection. Biol Psychiatry Cogn Neurosci Neuroimaging 3, 844–859. [DOI] [PMC free article] [PubMed] [Google Scholar]
- Pitel AL, Aupee AM, Chetelat G, Mezenge F, Beaunieux H, de la Sayette V, Viader F, Baron JC, Eustache F, Desgranges B, 2009. Morphological and glucose metabolism abnormalities in alcoholic Korsakoff’s syndrome: group comparisons and individual analyses. PLoS One 4, e7748. [DOI] [PMC free article] [PubMed] [Google Scholar]
- Power JD, Schlaggar BL, Petersen SE, 2015. Recent progress and outstanding issues in motion correction in resting state fMRI. Neuroimage 105, 536–551. [DOI] [PMC free article] [PubMed] [Google Scholar]
- Ritz L, Segobin S, Lannuzel C, Boudehent C, Vabret F, Eustache F, Beaunieux H, Pitel AL, 2016. Direct voxel-based comparisons between grey matter shrinkage and glucose hypometabolism in chronic alcoholism. J Cereb Blood Flow Metab 36, 1625–1640. [DOI] [PMC free article] [PubMed] [Google Scholar]
- Ritz L, Segobin S, Lannuzel C, Laniepce A, Boudehent C, Cabe N, Eustache F, Vabret F, Beaunieux H, Pitel AL, 2019. Cerebellar Hypermetabolism in Alcohol Use Disorder: Compensatory Mechanism or Maladaptive Plasticity? Alcohol Clin Exp Res 43, 2212–2221. [DOI] [PubMed] [Google Scholar]
- Rohlfing T, Brandt R, Menzel R, Maurer CR Jr, 2004. Evaluation of atlas selection strategies for atlas-based image segmentation with application to confocal microscopy images of bee brains. Neuroimage 21, 1428–1442. [DOI] [PubMed] [Google Scholar]
- Rohlfing T, Zahr NM, Sullivan EV, Pfefferbaum A, 2010. The SRI24 multichannel atlas of normal adult human brain structure. Hum Brain Mapp 31, 798–819. [DOI] [PMC free article] [PubMed] [Google Scholar]
- Rosenbloom MJ, Pfefferbaum A, Sullivan EV, 1995. Structural Brain Alterations Associated With Alcoholism. Alcohol Health Res World 19, 266–272. [PMC free article] [PubMed] [Google Scholar]
- Rosenbloom MJ, Pfefferbaum A, Sullivan EV, 2004. Recovery of short-term memory and psychomotor speed but not postural stability with long-term sobriety in alcoholic women. Neuropsychology 18, 589–597. [DOI] [PubMed] [Google Scholar]
- Sawyer KS, Oscar-Berman M, Mosher Ruiz S, Galvez DA, Makris N, Harris GJ, Valera EM, 2016. Associations Between Cerebellar Subregional Morphometry and Alcoholism History in Men and Women. Alcohol Clin Exp Res 40, 1262–1272. [DOI] [PMC free article] [PubMed] [Google Scholar]
- Schmidt TP, Pennington DL, Durazzo TC, Meyerhoff DJ, 2014. Postural stability in cigarette smokers and during abstinence from alcohol. Alcohol Clin Exp Res 38, 1753–1760. [DOI] [PMC free article] [PubMed] [Google Scholar]
- Schulte T, Müller-Oehring EM, Sullivan EV, & Pfefferbaum A, 2012. Synchrony of corticostriatal-midbrain activation enables normal inhibitory control and conflict processing in recovering alcoholic men. Biol Psychiatry 71(3), 269–278. [DOI] [PMC free article] [PubMed] [Google Scholar]
- Shanmugarajah PD, Hoggard N, Currie S, Aeschlimann DP, Aeschlimann PC, Gleeson DC, Karajeh M, Woodroofe N, Grunewald RA, Hadjivassiliou M, 2016. Alcohol-related cerebellar degeneration: not all down to toxicity? Cerebellum Ataxias 3, 17. [DOI] [PMC free article] [PubMed] [Google Scholar]
- Shirer WR, Ryali S, Rykhlevskaia E, Menon V, Greicius MD, 2012. Decoding subject-driven cognitive states with whole-brain connectivity patterns. Cerebral Cortex 22, 158–165. [DOI] [PMC free article] [PubMed] [Google Scholar]
- Smith S, Fein G, 2011. Persistent but less severe ataxia in long-term versus short-term abstinent alcoholic men and women: a cross-sectional analysis. Alcohol Clin Exp Res 35, 2184–2192. [DOI] [PMC free article] [PubMed] [Google Scholar]
- Springate BA, Tremont G, Papandonatos G, Ott BR, 2014. Screening for Mild Cognitive Impairment Using the Dementia Rating Scale-2. J Geriatr Psychiatry Neurol 27, 139–144. [DOI] [PubMed] [Google Scholar]
- Sullivan EV, Deshmukh A, Desmond JE, Lim KO, Pfefferbaum A, 2000. Cerebellar volume decline in normal aging, alcoholism, and Korsakoff’s syndrome: relation to ataxia. Neuropsychology 14, 341–352. [DOI] [PubMed] [Google Scholar]
- Sullivan EV, Pfefferbaum A, 2005. Neurocircuitry in alcoholism: a substrate of disruption and repair. Psychopharmacology (Berl) 180, 583–594. [DOI] [PubMed] [Google Scholar]
- Sullivan EV, Rohlfing T, Pfefferbaum A, 2010. Pontocerebellar volume deficits and ataxia in alcoholic men and women: no evidence for “telescoping”. Psychopharmacology (Berl) 208, 279–290. [DOI] [PMC free article] [PubMed] [Google Scholar]
- Sullivan EV, Rose J, Pfefferbaum A, 2006. Effect of vision, touch and stance on cerebellar vermian-related sway and tremor: a quantitative physiological and MRI study. Cereb Cortex 16, 1077–1086. [DOI] [PubMed] [Google Scholar]
- Sullivan EV, Zahr NM, Rohlfing T, Pfefferbaum A, 2015. Cognitive demands during quiet standing elicit truncal tremor in two frequency bands: differential relations to tissue integrity of corticospinal tracts and cortical targets. Front Hum Neurosci 9, 175. [DOI] [PMC free article] [PubMed] [Google Scholar]
- Sullivan EV, Zahr NM, Saranathan M, Pohl KM, Pfefferbaum A, 2019. Convergence of three parcellation approaches demonstrating cerebellar lobule volume deficits in Alcohol Use Disorder. Neuroimage Clin 24, 101974. [DOI] [PMC free article] [PubMed] [Google Scholar]
- Sullivan EV, Zahr NM, Sassoon SA, Pfefferbaum A, 2021. Disturbed sensory physiology underlies poor balance and disrupts activities of daily living in alcohol use disorder. Addict Biol 26, e12966. [DOI] [PMC free article] [PubMed] [Google Scholar]
- Synofzik M, Lindner A, Thier P, 2008. The cerebellum updates predictions about the visual consequences of one’s behavior. Curr Biol 18, 814–818. [DOI] [PubMed] [Google Scholar]
- Torvik A, 1987. Brain lesions in alcoholics: neuropathological observations. Acta Med Scand Suppl 717, 47–54. [DOI] [PubMed] [Google Scholar]
- Tustison NJ, Avants BB, Siqueira M, Gee JC, 2011. Topological well-composedness and glamorous glue: a digital gluing algorithm for topologically constrained front propagation. IEEE Trans Image Process 20, 1756–1761. [DOI] [PubMed] [Google Scholar]
- Vassar RL, Rose J, 2014. Motor systems and postural instability. Handb Clin Neurol 125, 237–251. [DOI] [PubMed] [Google Scholar]
- Victor M, Adams RD, Collins GH, 1989. The Wernicke-Korsakoff syndrome and related neurologic disorders due to alcoholism and malnutrition, 2nd Edition ed. F. A. Davis Co, Philadelphia. [Google Scholar]
- Wechsler D, 2001. Wechsler Test of Adult Reading: WTAR. Psychological Corporation. [Google Scholar]
- Whitfield-Gabrieli S, Nieto-Castanon A, 2012. Conn: a functional connectivity toolbox for correlated and anticorrelated brain networks. Brain Connect 2, 125–141. [DOI] [PubMed] [Google Scholar]
- Whitfield-Gabrieli S, Thermenos HW, Milanovic S, Tsuang MT, Faraone SV, McCarley RW, … & Seidman LJ, 2009. Hyperactivity and hyperconnectivity of the default network in schizophrenia and in first-degree relatives of persons with schizophrenia. Proceedings of the Natio nal Academy of Sciences (PNAS) 106(4), 1279–1284. [DOI] [PMC free article] [PubMed] [Google Scholar]
- Zhao Q, Pfefferbaum A, Podhajsky S, Pohl KM, Sullivan EV, 2020. Accelerated aging and motor control deficits are related to regional deformation of central cerebellar white matter in alcohol use disorder. Addict Biol 25, e12746. [DOI] [PMC free article] [PubMed] [Google Scholar]
- Zhu J, Zhao W, Zhang C, Wang H, Cheng W, Li Z, Qian Y, Li X, Yu Y, 2018. Disrupted topological organization of the motor execution network in alcohol dependence. Psychiatry Res Neuroimaging 280, 1–8. [DOI] [PubMed] [Google Scholar]
Associated Data
This section collects any data citations, data availability statements, or supplementary materials included in this article.