

SUMMARY:
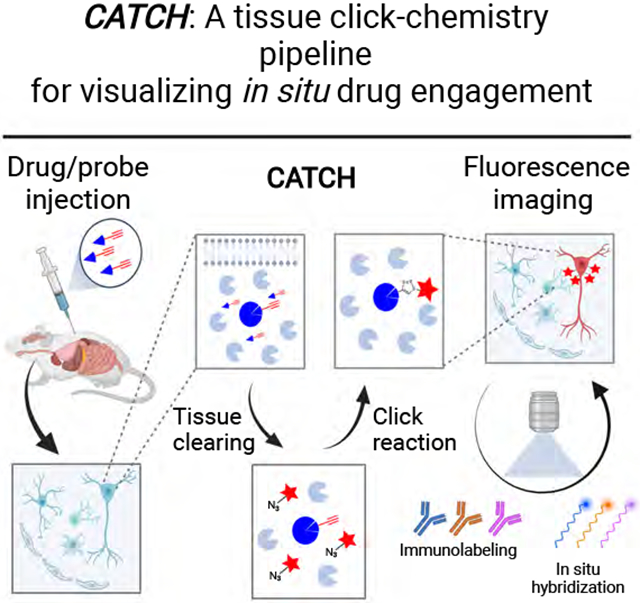
The lack of tools to observe drug-target interactions at cellular resolution in intact tissue has been a major barrier to understanding in vivo drug actions. Here, we develop Clearing-Assisted Tissue Click Chemistry (CATCH) to optically image covalent drug targets in intact mammalian tissues. CATCH permits specific and robust in situ fluorescence imaging of target-bound drug molecules at subcellular resolution and enables the identification of target cell types. Using well-established inhibitors of endocannabinoid hydrolases and monoamine oxidases, direct or competitive CATCH not only reveals distinct anatomical distributions and predominant cell targets of different drug compounds in the mouse brain, but also uncovers unexpected differences in drug engagement across and within brain regions, reflecting rare cell types, as well as dose-dependent target shifts across tissue, cellular and subcellular compartments that are not accessible by conventional methods. CATCH represents a valuable and differentiated platform for interrogating in vivo small molecule-target interactions.
Keywords: drug-target engagement, drug distribution, molecular imaging, click chemistry
Graphical Abstract
In Brief:
Clearing Assisted Tissue Click Chemistry (CATCH) allows for the in vivo visualization of target bound drug molecules and enables the identification of drug distribution and engagement in mammalian tissue.
INTRODUCTION
Target identification and validation for small molecules has been a longstanding challenge in chemical biology and drug discovery. Although remarkable advances have been made to probe drug-target interactions at the molecular scale (Ha et al., 2021; Scott et al., 2016), these approaches are generally less suitable for such relationships at the tissue level in vivo. Traditional pharmacokinetics and pharmacodynamics often quantify drug concentrations or drug-target interactions in homogenized organs, eliminating the spatial resolution that is critical for understanding in vivo target engagement. Imaging-based methods, such as positron emission tomography (PET), are widely used to profile small molecule distribution in vivo, but lack sufficient resolution to differentiate drug binding states at the cellular level to precisely identify drug-target interactions (Pancholi, 2012). An ideal method should allow in situ visualization of target-bound drugs at single-cell resolution, while at the same time, being compatible with multiplexed molecular characterization of their drug-target interactions. These objectives are particularly important for drugs that target the central nervous system, which is markedly heterogeneous in cellular composition and spatial organization.
Fluorescence light microscopy has revolutionized high-resolution in situ imaging of endogenous biomolecules such as proteins and nucleic acids. However, exogenous small molecules are more difficult to image because appending a fluorescent tag alters the size and chemical properties of the parent compound, potentially distorting drug distribution and on- and off- target engagement (Speers et al., 2003). Biorthogonal reactions, including the Cu(I)-catalyzed azide-alkyne cycloaddition (CuAAC) click reaction (Rostovtsev et al., 2002), can partly address these problems by enabling incorporation of larger tags after a drug has reached its target using small and inert alkyne/azide handles (Cañeque et al., 2018). While this click chemistry (CC) strategy combined with chemical proteomic methods such as activity-based protein profiling (CC-ABPP) has proven effective for identifying drug targets in various biological settings, including animal models (Cañeque et al., 2018; Niphakis and Cravatt, 2014; Parker and Pratt, 2020; Porte et al., 2021; Speers et al., 2003), such approaches have not yet enabled high-resolution spatial imaging of drug-target interactions in vivo due to the poor signal-to-noise ratio (SNR) in intact tissues.
Here, by modifying and integrating click chemistry with tissue clearing, we develop a method to allow small molecule drug-target interactions to be labeled and imaged at subcellular resolution in mammalian tissues in situ (Figure 1A). We demonstrate the specificity, dynamic range, and versatility of Clearing-Assisted Tissue Click Chemistry (CATCH) using multiple well-established covalent drugs and our results designate this technology as a powerful way to visualize drug action in vivo with unprecedented cellular and molecular resolution.
Figure 1. High resolution drug mapping via CATCH.

(A) Schematic of drug mapping pipeline. After drug administration (1 mg/kg PF7845-yne, 4 h, i.p.), unbound drug molecule is washed off by whole body perfusion and target bound drug is retained in tissue. Lipids are removed by tissue clearing. Cleared tissue is then subject to click reaction to label drug with a fluorophore. Labeled tissue can be further stained by antibodies or mRNA probes before imaging acquisition.
(B) Click reaction ligand optimization with CLARITY brain sections. TBTA is 90 μM. For all the other ligands, copper ligand ratio is 1:2. Reaction under CC-ABPP conditions (TBTA) generates high background in vehicle control. Images represent S1. Scale bar, 20 μm.
(C) Click reaction in PFA or CLARITY sections, with RapiClear (RI 1.45) or 80% glycerol (RI 1.44) as RI matching media. Zoomed-in regions of interests (ROIs) highlight cellular drug positive structures. Images represent S1. Scale bar, 20 μm.
(D) Signal profile along the dashed line in figure 1C of PFA fixed and CLARITY cleared tissue in RapiClear or 80% glycerol as RI matching media. Arrows indicate signal peaks and their corresponding location on the line. Signal intensity normalized to the average intensity of all the values in the same measurement. N = 4 cells analyzed in each condition, error bar indicates SD.
(E) CATCH labeling in PFA fixed and cleared tissues. CATCH is compatible with all five clearing techniques. Cleared tissues are rehydrated and immersed in RapiClear for RI matching. Images represent S1. Scale bar, 20 μm.
RESULTS
CATCH enables specific labeling and imaging of drugs in situ
Over the past decade, there has been a resurgent interest in chemical probes and drugs that operate by a covalent mechanism, as their irreversible engagement of protein targets can improve potency of engagement for challenging targets and afford superior pharmacodynamic properties in vivo (Singh et al., 2011; Vita, 2020). The irreversibility also makes it particularly crucial to understand the cellular targets of covalent drugs with high precision to minimize toxicity. To establish a model system from which the visualization of drug targets could be evaluated, we explored a set of well-characterized covalent inhibitors of endocannabinoid hydrolytic enzymes, with the potential to treat a range of human neurological disorders. Initial experiments were performed using the fatty acid amide hydrolase (FAAH) inhibitor PF-04457845 (or PF7845; Figure S1A) (Johnson et al., 2011), whose urea backbone forms a covalent bond with the active serine residue of FAAH to irreversibly inhibit enzyme activity. Previous work has shown that an alkyne-modified analogue PF7845-yne retained similar selectivity as PF7845 and was able to selectively detect FAAH in whole-brain lysates by CC-ABPP combined with an in-gel fluorescence readout (SDS-PAGE) (Niphakis et al., 2012). However, attempts to directly image drug-bound FAAH in brain sections from mice treated with PF7845-yne with an azide-Alexa647 tag under CC-ABPP condition failed to reveal the cellular target due to poor SNR (Figure S1B).
We reasoned that the complex composition of tissue, particularly dense lipid membranes, might hinder the CuAAC reaction. Recently, brain clearing techniques have greatly advanced the visualization of endogenous biomolecules in tissues by removing lipids using detergents, solvents, and polymer scaffolds (Sylwestrak et al., 2016; Ueda et al., 2020; Wang et al., 2018). Therefore, we tested whether CLARITY, a polyacrylamide-based aqueous clearing method (Chung et al., 2013), could improve the SNR of CuAAC labeling. After applying CC-ABPP click conditions to brain sections from mice treated with PF7845-yne, CLARITY treatment rendered a membrane-like fluorescence signal in the primary somatosensory cortex (S1) after clicking with an azide-Alexa647, consistent with the expected FAAH engagement (Egertová et al., 2003). However, background nuclear signal was observed in vehicle-treated samples, indicating the occurrence of substantial side reactions under this condition (Figure 1B).
Because a ligand is used to protect the catalytic Cu (I) from generating excessive reactive oxygen species (ROS) and side reactions with CuAAC (Besanceney-Webler et al., 2011; Wang et al., 2011), we speculated that although the original CC-ABPP protocol using 1 mM CuSO4 and the first-generation ligand TBTA yields satisfactory results in homogenized systems (Figure S1C), the high concentration of Cu2+ may lead to significant side reactions in intact tissues. We thus compared a range of newer generation ligands that allow lower concentration of Cu2+. THPTA, BTTPA and BTTP (Li and Zhang, 2016) significantly eliminated the background signal in vehicle-treated samples (Figure 1B and S1C). Furthermore, BTTP resulted in weak but distinct membrane-like signals in PF7845-yne treated tissue using only 50 μM CuSO4 (Figure 1B). By gradually increasing Cu2+ concentration, we found that 150 μM CuSO4 resulted in robust fluorescent labeling with minimal background staining in controls (Figure. 1B and S1D). As expected, fluorescent labeling was strictly dependent on the presence of each component of the CuAAC reaction (Figure S1E and S1F). Importantly, rendering tissues optically transparent using reflective index matching alone was not sufficient to generate a satisfactory SNR, suggesting that the delipidation associated with tissue clearing was necessary to facilitate in situ CuAAC labeling (Figure 1C and 1D). Similar results were achieved with different drug delivery routes including oral and subcutaneous (Figure S1G-I) and in non-brain peripheral tissues (Figure S1J). Other common tissue clearing methods, including SHIELD (Park et al., 2018), DISCOs (Erturk et al., 2012; Qi et al., 2019; Renier et al., 2014), and CUBIC3.0 (Tainaka et al., 2018), all yielded similar labeling profiles after in situ click reactions (Figure 1E). For simplicity, we chose to adopt a combination of CLARITY, 150 μM CuSO4 and 300 μM BTTP in our standard CATCH protocol for all subsequent experiments.
We next sought to determine whether CATCH signals were specific to in vivo PF7845-yne engagement of FAAH by first performing a pharmacological blocking experiment (Figure 2A). Pre-treatment with the parent compound PF7845 completely abolished PF7845-yne-generated CATCH signals across the brain (Figure 2B, 2C and S2A). We also compared PF7845-yne CATCH signals in wild-type (FAAH+/+) mice with FAAH−/− mice (Figure 2D). In wild-type mice, robust PF7845-yne labeling was observed throughout the brain that showed high overlap with FAAH immunostaining and mRNA hybridization chain reaction (Choi et al., 2018; Sylwestrak et al., 2016) (Figure 2E, 2F, S2B and S2C). In contrast, negligible PF7845-yne signals were detected in FAAH−/− mice (Figure S2B and S2C). Taken together, pharmacological and genetic results demonstrated that CATCH could visualize target engagement with high specificity in tissues from drug-treated mice. In addition, we demonstrated drug binding can be visualized in large tissue volume for 3D characterizations (Figure S2D and S2E).
Figure 2. CATCH specificity validation.

(A) Schematic of non-alkyne PF7845 drug pretreatment test. After injection of parental PF7845 (1 mg/kg, 4 h, i.p.), the target enzyme FAAH is blocked and no longer accessible to subsequent injection of PF7845-yne (1 mg/kg, 4 h, i.p.).
(B) Pretreatment test drug labeling in hippocampus dentate gyrus (DG). No alkyne drug labeling observed in PF7845 pretreatment group. Scale bar, 50 μm.
(C) Quantification of fluorescence intensity across different brains regions. Intensity is normalized to the vehicle samples in each region. No significant difference between vehicle and PF pretreatment groups. N = 5 mice for each condition (Two-way ANOVA, Tukey multiple comparisons test). M1, primary motor cortex; S2, secondary somatosensory cortex; Pir, piriform cortex; CA1, hippocampus CA1; BLA, basolateral amygdaloid nucleus; V1, primary visual cortex; V2, secondary visual cortex; AuD, secondary auditory cortex, dorsal area; AuV, secondary auditory cortex, ventral area; PMCo, posteromedial cortical amygdaloid nucleus.
(D) Schematic of PF7845-yne injection in FAAH−/− mice (1 mg/kg, 4 h, i.p.). The absence of target enzyme should prevent PF7845-yne binding.
(E-F) PF7845-yne mapping specificity test in FAAH−/− mice. Images taken in DG. FAAH expression validated by both FAAH immunostaining (E) and mRNA in situ hybridization chain reaction (HCR, F). No alkyne drug labeling observed in FAAH−/− mice. HCR requires high magnification (40X) to be resolved. Scale bar, 50 μm for immunostaining (E) and 5 μm for HCR (F).
Data points represent mean ± SD. ns: not significant; ****P<0.0001.
CATCH reveals brain-wide drug-target interactions and detects rare targets
Having verified the ability of CATCH to detect interactions between PF7845-yne and FAAH, we evaluated its broader utility by investigating two other covalent drug-target combinations: the structurally distinct FAAH inhibitor BIA-10-2474 (Kiss et al., 2018) and the monoamine oxidase (MAO) inhibitor pargyline (Krysiak et al., 2012) (Figure S3A). Like PF7845, BIA10-2474 has a urea backbone and inhibits FAAH via a nucleophilic substitution reaction with its active serine residue (Kiss et al., 2018). In contrast, pargyline inhibits MAO by forming a covalent adduct via an oxidation-addition reaction (Krysiak et al., 2012). Alkyne analogs of both drugs have been developed in previous studies (Figure 3A and S3A) (Huang et al., 2019; Krysiak et al., 2012). CATCH imaging revealed similar labeling patterns following in vivo administration ofPF7845-yne and BIA10-2474-yne, characterized by strong signals in the neocortex, thalamus and hippocampus (Figure 3B). In contrast, pargyline-yne administration resulted in a distinct pattern of labeling that was enriched in hypothalamus, pons, and lateral ventricles (Figure 3B). CATCH permitted immunostaining of FAAH after CuAAC reaction, confirming that PF7845-yne and BIA10-2474-yne signals are predominantly associated with FAAH. No such correlation was observed in pargyline-yne-treated animals (Figure 3C-E). On the contrary, MAO-A staining revealed no correlation for PF7845-yne, but better correlation for pargyline-yne (Figure S3B-D). Imaging at higher resolution revealed that the FAAH inhibitors primarily targeted neuron-like structures in the neocortex and hippocampus. Conversely, pargyline-yne was predominantly bound to vasculature-like structures throughout the brain, with the exception of sparse but specific labeling of neuron-like structures in the hypothalamus and pons (Figure 3F).
Figure 3. Visualization of brain-wide drug binding.

(A) Chemical structures of PF7845-yne, BIA10-2474-yne and pargyline-yne.
(B) Sagittal view of FAAH expression with PF7845-yne (1 mg/kg, 4 h, i.p.), BIA10-2474-yne (1 mg/kg, 4 h, i.p.), and pargyline-yne (20 mg/kg, 4 h, i.p.) drug mapping. Scale bar, 1 mm.
(C-E) Quantification of pixel wise FAAH immunostaining intensity with PF7845-yne (C), BIA10-2474-yne (D) and pargyline-yne (E) labeling intensity. Simple linear regression with R squared values quantified.
(F) Zoomed-in view of Fig. 2A. Images represent orbital cortex (OC), S1, CA1, thalamus, hypothalamus, and pons. White color indicates overlapping signal of FAAH immunostaining and drug labeling. Scale bar, 50 μm.
Unanticipated toxicity of BIA-10-2474 has been reported in humans, likely due to greater off-target activity compared to PF7845 (Kerbrat et al., 2016; Van Esbroeck et al., 2017). Accordingly, we observed a lower correlation between FAAH expression and BIA-10-2474-yne CATCH labeling than PF7845-yne (Figure 3C and 3D). Furthermore, although the majority of PF7845-yne and BIA-10-2474-yne CATCH signal was abolished in FAAH−/− mice, including in the S1, CA1, and periaqueductal gray (PAG), surprisingly, some BIA-10-2474-yne labeling remained in the reticulotegmental nucleus of the pons (RtTg) (Figure S3E and S3F). These data indicated that BIA10-2474-yne binds to off-target sites in the RtTg and also demonstrated the ability of CATCH to uncover drug targets at cellular resolution.
CATCH can be multiplexed with fluorescent labeling to identify target cell types
Understanding the cell types affected by drug treatment in vivo is critical for accurately interpreting pharmacological mechanism of action, particularly for drugs targeting the CNS, which harbors diverse neural substrates and cell types. Having established that CATCH can visualize drug targets with single-cell resolution, we investigated whether it could be combined with molecular markers of cell identity to characterize and register cellular target identities. We postulated that the adaptation of stable polyacrylamide in CATCH would enable multiple rounds of reversible antibody and dye staining following the CuAAC reaction and tested this hypothesis by immunostaining for the pan-neuronal marker NeuN following treatment with PF7845-yne, BIA10-2474-yne and pargyline-yne. In accordance with previous reports (Egertová et al., 2003), we observed that PF7845-yne and BIA10-2474-yne were primarily associated with NeuN+ neurons in the neocortex, hippocampus and amygdala, and pargyline-yne with lectin+ blood vessels (Figure 4A-C, S4A and S4B). Furthermore, the resolving power of CATCH enabled the detection of a small but bright population of NeuN+ hypothalamic neurons targeted by pargyline-yne (Figure S4A). Further cell type characterization revealed that in cortex, PF7845-yne binds to Ctip2+ projecting neurons (DeNardo et al., 2015), but not astrocytes nor inhibitory neurons (Figure S4C-F). Meanwhile, in hypothalamus, pargyline-yne targets a subset of VGAT+ inhibitory neurons that are negative for parvalbumin or somatostatin (Figure S4G-J).
Figure 4. Cell type identification of drug targets.

(A) Schematics of brain regions studied in figure 4B, 4C and S4. IG, indusium griseum; Cg, cingulate cortex; CA3, hippocampus CA3; HPY, hypothalamus; VPM, ventral posteromedial thalamic nucleus.
(B-C) PF7845-yne (5 mg/kg, 4 h, i.p.), BIA10-2474 (5 mg/kg, 4 h, i.p.) and pargyline-yne (20 mg/kg, 4 h, i.p.) labeled tissue co-stained with NeuN for neuron (B) and lectin for blood vessels (C). Scale bar, 10 μm. Images represent S1, Cg, CA3, BLA and pons.
(D) Schematic of reversible marker identification. After click reaction and primary antibody staining, bound antibody is washed off by 8% PBS-SDS at 60°C for secondary staining.
(E) Registered pargyline positive, NeuN negative cells re-stained for TH to map NA neurons. Scale bar, 10 μm.
Even more surprising was the discovery of a small group of neuron-like structures in the pons that were NeuN negative but targeted by pargyline-yne (Figure 4B). Based on MAO gene expression data from the Allen Brain Atlas, we wondered if these cells represented noradrenergic (NA) neurons in the locus coeruleus (LC) of the pons (Figure S4K-M), which are commonly identified by tyrosine hydroxylase (TH) staining (Schmidt et al., 2019). We tested this by stripping off NeuN immunostaining from the brain sections and re-staining with a TH antibody on the same sample (Figure 4D). CATCH signals resulting from the CuAAC conjugation of Alexa647 were resistant to the high temperature and SDS elution protocol used to remove NeuN staining, and revealed colocalization of pargyline-yne and TH in the same cells (Figure 4E). Thus, our experiment identified that NeuN-negative, pargyline-yne-positive cells were LC-NA neurons and demonstrated that CATCH could support sequential rounds of drug targeted cell-type identification.
CATCH can reveal drug binding at subcellular resolution
We next asked whether CATCH could image drug-target interactions in subcellular compartments in tissue. To this end, we targeted monoacylglycerol lipase (MAGL), a key enzyme involved in terminating the signaling function of endocannabinoid 2-archidonoylglycerol (2-AG) (Di Marzo, 2018), using a well characterized alkyne analogue of the MAGL inhibitor MJN110 (Figure S5A) (Chang et al., 2013; Niphakis et al., 2013). We confirmed the specificity of MJN110-yne signals generated by CATCH using both pharmacological pretreatment of the parent compound MJN110 and MAGL−/− mice (Schlosburg et al., 2010) (Figure S5B and S5C).
As previously reported, we found that MJN110-yne selectively engaged MAGL at 1 mg/kg and showed substantial off-target engagement of FAAH at 20 mg/kg in gel-based CC-ABPP of whole brain lysates (Figure 5A). Because MAGL is restricted in localization to presynaptic axonal terminals, whereas FAAH is expressed in neuronal soma (Gulyas et al., 2004), we sought to determine whether CATCH could detect on- and off-target MJN110-yne binding across subcellular compartments (Figure 5B). We focused on the well-characterized CA3 to CA1 projection in the hippocampus as it allowed us to observe both axon terminals and soma in the same field of view (Figure 5C). As expected, we observed an overall higher fluorescence intensity in the hippocampus treated with 20 mg/kg MJN110-yne (Figure 5D). Higher resolution imaging combined with synapsin and microtubule-associated protein 2 (MAP2) immunostaining revealed that MJN110-yne signal was restricted to synapsin positive axon terminals at a low dose (1 mg/kg), and spread to the neuronal soma at the high dose (20 mg/kg), as indicated by the overlap of MJN110-yne and MAP2 fluorescence signals (Figure 5E, 5F, S5D and S5E). Pre-treating animals with PF7845 significantly suppressed MJN110-yne binding in the soma, but not axon terminals (Figure 5G, 5H, S5F and S5G), indicating that these signals originated from the off-target FAAH binding and on-target MAGL binding, respectively. It is possible that the residual soma fluorescence observed in PF7845-pretreated mice reflects MJN110-yne engagement of an alternative 2-AG hydrolase, ABHD6, which is known to cross-reacts with MJN110 and also localized to neuronal soma (Cao et al., 2019; Chang et al., 2013). These data thus demonstrate that CATCH can visualize drug binding to different protein targets at subcellular resolution.
Figure 5. Visualization of MJN110-yne binding in different subcellular compartments.

(A) In-gel click chemistry ABPP characterization of MJN110-yne binding in brain membrane proteome with ascending doses (i.p., 4 h).
(B) Schematic of sub-cellular localization of MAGL and FAAH. MJN110-yne binds to FAAH at high dose, which can be potentially blocked by PF7845 pretreatment.
(C) Schematic of projections from CA3 pyramidal neurons CA1 pyramidal neurons.
(D) Zoomed-out views of hippocampus at low resolution (10X, 0.6NA, 2.49 μm/pixel) indicating overall drug binding profiles at low and high dose. Scale bar, 200 μm.
(E) High resolution (40X, 1.28NA, 0.155 μm/pixel) imaging of hippocampus CA3 and CA1. Soma and presynaptic terminals marked by MAP2 and synapsin, respectively. Zoomed-in of MAP2 and synapsin positive pixels are highlighted in box. Scale bar, 10 μm.
(F) Quantification of ratios between soma and presynaptic terminal fluorescence intensities. Ratios were calculated based on the mean 1 mg/kg local presynaptic terminal intensities. N = 3 mice for each group; two fields of view generated from each mouse (Two-tailed unpaired Mann-Whitney test).
(G) MJN110-yne (20 mg/kg, 4 h, i.p.) staining after pretreatment with PF7845 (1 mg/kg, 4 h, i.p.) to block FAAH. Figures showing CA3 soma and CA1 presynaptic terminals with zoom-ins for MAP2 and synapsin positive pixels.
(H) Quantification of ratios between CA3 soma and CA1 presynaptic terminal intensities. Ratios were calculated based on the mean intensity of no pretreatment samples in each region. N = 3 mice for each group, three fields of view generated from each mouse (Two-tailed unpaired Mann-Whitney test).
Data points represent mean ± SD. ns: not significant; **P<0.01; ****P<0.0001.
CATCH can measure dose-dependent drug-target engagement
We next tested if CATCH can be used to resolve dose-dependent in vivo target engagement. For such quantitative applications, it is important to recognize that for any drug, it is possible that alkyne modification could alter its pharmacokinetic (PK) properties, such as drug distribution and half-life. This could lead to CATCH labeling patterns that do not reflect the parent drug. Thus, we determined PK properties of both the FAAH and MAGL probes, which showed minimal differences between the parent compounds and alkyne probes in terms of brain permeability (Figure S6A) and distribution (Figure S6B), but altered in vivo half-lives (Figure S6C and S6D). Therefore, we devised an inverse-labeling method to examine the distribution of CATCH probes for visualizing dose-dependency of drug-target interactions in vivo. In this competitive CATCH approach, animals are first treated with a dose range of the parental drugs, followed by a single high dose of the alkyne probes. The dose-dependent target engagement by the parental drug can be recorded based on the competitive blockade of signal in an anatomically specific manner (Figure 6A).
Figure 6. Visualization of dose-dependent PF7845 binding profiles.

(A) Schematics for dose-dependent in vivo blocking studies. At low dose, parental drug does not fully block target, leaving space for subsequent alkyne drug binding. At high dose, parental drug saturates target, thereby abolishing alkyne drug binding.
(B) Zoomed-out views of PF7845 blocking at indicated dose followed by PF7845-yne injection (1 mg/kg, 1 h, i.p.) in hippocampus and cortex. Scale bar, 500 μm.
(C-D) Quantification of fluorescence intensity upon dose dependent PF7845 blocking in S1 (C) and CA1 (D). Signal normalized to the mean intensity of samples blocked by 0.01 mg/kg PF7845. N = 3 mice for each condition, two field of views from each mouse (One-way ANOVA, Tukey multiple comparisons test).
(E) Zoomed-in views from samples blocked by 0.01 and 0.02 mg/kg PF7845. Samples were co-stained with lectin to visualize blood vessels. Images represent CA1. Dashed line indicates low drug binding regions. Scale bar, 40 μm.
(F) Quantification of fluorescence intensity in hippocampus CA1 at different distance to the nearest blood vessel. Intensity normalized to pixels within 15-20 μm to blood vessel. N = 3 mice for each condition. Error bar indicates SD (One-way ANOVA in each dose).
(G) Schematics for dose-dependent direct alkyne drug mapping. Higher target saturation should associate with higher CATCH labeling intensity.
(H) Zoomed-out view of PF7845-yne binding dynamics in hippocampus and cortex (4 h, i.p.). Scale bar, 500 μm.
(I-J) Quantification of fluorescence intensity of drug binding in S1 (I) and CA1 (J). Signal normalized to the mean intensity of vehicle control. N = 5 mice for each condition (One-way ANOVA, Tukey multiple comparisons test).
(K) PF7845-yne co-staining with lectin to visualize blood vessels. Images represent CA1. Dashed line indicates high drug binding regions. Scale bar, 40 μm.
(L) Quantification of fluorescence intensity in hippocampus CA1 at different distance to the nearest blood vessel. Intensity normalized to pixels within 5 μm to blood vessel. N = 3 mice for each condition. Error bar indicates SD (One-way ANOVA in each dose).
Data points represent mean ± SD. ns: not significant; **P<0.01; ****P<0.0001.
We treated mice with 0.01-1 mg/kg of parental PF7845 followed by 1 mg/kg PF7845-yne probe to readout the dose-dependent brain targets of PF7845 by competitive CATCH (Figure S6E-G). Consistent with previous in-gel analysis (Niphakis et al., 2012), no target binding was detected across the brain at 0.01 mg/kg by CATCH whereas full FAAH inhibition was achieved at 0.05 mg/kg or higher (Figure S2A, S6G-J). Interestingly, we found that, at an intermediary dose (0.02 mg/kg), FAAH was fully inhibited in the cortex but not in the hippocampus (Figure 6B-D, S6K). Specifically, a non-homogeneous, stripe-like pattern was observed in the hippocampal CA1 pyramidal cell layer (Figure 6E) and DG granular cell layer (Figure S6L), suggesting sub-maximal drug engagement in these regions. Next, we stained brain sections with lectin to mark vasculature structures, which revealed that regions with low probe intensity (i.e., cells pre-blocked by the parental PF7845) were associated with trespassing blood vessels (Figure 6E, 6F, S6L and S6M). Conversely, when an intermediary dose of alkyne PF7845-yne was directly visualized by CATCH (Figure 6G-J and S6N), we observed a mirrored intensity pattern where higher probe intensity was in proximity with the vasculature (Figure 6K, 6L, S6O and S6P).
Together, both competitive and direct labeling suggested that PF7845-FAAH interactions at intermediary doses might be limited by the distance between FAAH-expressing neurons and surrounding capillaries (Fig 6E-L, S6L-P). This would effectively create a drug gradient that results in sub-maximal engagement in neurons more distal to the vasculature. This heterogeneous distribution is unique to the hippocampus, suggesting that it might be attributed to particularly high levels of FAAH expression (Egertová et al., 2003) or relatively low vasculature volume in this region (Perosa et al., 2020).
Finally, as covalent inhibitors typically process prolonged target engagement (Ghosh et al., 2019), we found sustained FAAH blockage to competitive probe binding even 24 hours after PF7845 administration (Figure S6R-T). Collectively, by complementing competitive and direct labeling strategies, CATCH can reveal dose-dependent, quantitative target engagement across heterogeneous brain regions that are not easily accessible by traditional lysate-based methods.
DISCUSSION
We have developed a new method to visualize in vivo covalent drug-target interactions at subcellular resolution in intact tissue, in which the native anatomical and molecular features are preserved. Measuring target engagement of small molecules is critical for developing chemical probes and drugs, but existing biochemical methods are largely limited to cellular systems and tissue lysates. As we have shown herein, however, regional and cellular differences in drug-target interactions can be obscured in tissue lysates, especially if different areas of a complex organ type like the brain are subject to distinct drug exposure due to, for instance, variable proximity to vasculature structures (Figure 6), or if rare cell types harbor the majority of drug targets (Figure 3, S3 and 4). Such parameters are crucial for our understanding and optimization of drug efficacy and toxicity. For example, target cell types (Figure 4) identified from in vivo CATCH could guide the selection of relevant cell lines for in vitro compound optimization; conversely, CATCH can be used to screen against lead compounds prone to be enriched in brain regions or cell types associated with adverse side effects (Figure S3F). Additionally, CATCH can also complement and augment the information gleaned from other biochemical and imaging methods, so that target distribution and engagement can be coordinately measured, interpreted, and optimized.
Here we focused our method development on enabling click chemistry-based imaging of well-validated alkyne modified drugs. For future CATCH applications, it would be pivotal to acquire high quality alkyne probes designed for the drug of interest. First, CATCH requires alkyne probes to enter the same organs as the parent drugs, so bulk tissue distributions of probes should be validated as resembling those of the parent compounds prior to use. Additionally, the probes should retain similar target binding potency and specificity on the protein target as the parental drugs, which needs to be individually verified by biochemical approaches such as in-gel or mass spectrometry-based ABPP (Pichler et al., 2016) or label-free assays to identify targets with shifted thermal, proteolytic or chemical stability (Ha et al., 2021). As a routine part of the workflow, competitive CATCH should be done to ensure an inversed signal at intermediate parental drug doses and a full blockage at high dose, before analyzing a direct CATCH assay. However, it seems less critical that the alkyne probes directly match the parent drugs in terms of in vivo PK properties, as the competitive CATCH protocol described herein should enable visualization of parent drug engagement across ranges of both dose and time, assuming the alkyne probes can be administered at a dose that fully engages the target(s) of the parent drug.
In summary, by bringing unprecedented resolving power to small molecule drug-target imaging in situ, we believe that CATCH offers a valuable tool for both drug discovery and basic chemical biology research.
Limitations of the study.
Currently, CATCH is focused on covalent drugs. Although once sidelined by the pharmaceutical industry, covalent inhibitors have a long history in medicine (e.g., aspirin and penicillin) and are regaining recognition due to recent breakthrough medicines that irreversibly inhibit BTK (Brullo et al., 2021; Byrd et al., 2013), EGFR (Lu et al., 2022; Miller et al., 2012), and KRAS (Canon et al., 2019; Hong et al., 2020) for cancer therapies. CATCH has the potential to greatly accelerate our understanding and refinement of these exciting new covalent drugs by providing access to their cellular targets in vivo. Meanwhile, we foresee non-covalent drug binding can be potentially retained and visualized using clickable, photoreactive analogues (Li et al., 2015) or using a linker to crosslink drugs with the adjacent protein moieties (Yang et al., 2018; Zheng et al., 2019) through future studies. Finally, as the first step towards volumetric in situ drug imaging, we demonstrated that CATCH could be applied in thick brain sections (~500 μm). Expanding this capacity to whole brain, or even whole animal, would represent another technical milestone to allow unbiased screen drug targets across different tissue and cell types. However, scaling up homogeneous labeling to large tissues remains a general challenge for staining and in situ-based methods (Choi et al., 2021). Continued optimization for reaction and clearing conditions would be needed to reach this goal.
STAR METHODS
Resource availability
Lead Contact
Further information and requests for resources and reagents should be directed to and will be fulfilled by the lead contact, Li Ye (liye@scripps.edu)
Materials availability
All unique/stable reagents generated in this study are available from the lead contact with a completed materials transfer agreement.
Data and code availability
Microscope data reported in this paper will be shared by the lead contact upon request.
This paper does not report original code.
Any additional information required to reanalyze the data reported in this paper is available from the lead contact upon request.
EXPERIMENTAL MODEL AND SUBJECT DETAILS
Mouse model
Mice were group-housed on a 12-hr light dark cycle and fed a standard rodent chow diet. Both male and female, 6-9-week-old WT C57BL6J, FAAH−/− (Cravatt et al., 2001), MAGL−/− (Schlosburg et al., 2010) and VGAT-Ai14 mice were used. VGAT-Ai14 mice were obtained by crossing VGAT-ires-cre mice with Ai14 mice. All experimental protocols were approved by the Scripps Research Institute Institutional Animal Care and Use Committee and were in accordance with the guidelines from the NIH.
METHOD DETAILS
Sample collection
Inhibitors were administered to mice in a vehicle of 10% DMSO, 2% Tween-80 in saline for intraperitoneal (i.p.) injections. After drug injection at designated dose and time, mice were heavily anesthetized with isoflurane and then transcardially perfused with ice cold PBS followed by ice cold 4% PFA in PBS with sucrose. Mouse brains or other peripheral tissues were then dissected out and post fixed in 4% PFA overnight at 4°C. Tissues were washed with PBS, embedded in 2% agarose and sectioned as 100-micron or 500-micron tissue sections by vibratome (Leica VT1000S). Tissue sections were stored in PBS with 0.02% sodium azide at 4°C for further processing.
For in gel ABPP analysis, after anesthetizing, mice were decapitated and target tissues were harvested and flash frozen in liquid N2 without perfusion or fixation. Each mouse hemisphere and liver were washed with ice cold PBS on ice (2 x 1 mL) to remove excessive blood. Tissues were homogenized in 1 mL PBS and sonicated for 10 min in ice cold water. Tissues were centrifuged (1000 g, 10 min, 4°C) and supernatant was then centrifuged at high speed (100,000 g, 45 min, 4°C). Supernatant was discarded and remaining pellets were gently washed with ice cold PBS (2 x 0.5 mL). Pellets were resuspended by gentle pipetting and protein concentrations were quantified by the Bio-Rad DC Protein Assay Kit. Proteomes were then diluted to 1.0 mg/kg for immediate use or aliquoted and stored at −80°C.
For quantitative PK studies, at each collection timepoint (1 h, 2 h, 4 h, and 24 h), blood was collected by cardiac puncture into EDTA microtubes and mixed. Exactly 100 μL of blood was added to 400 μL of ice-cold acetonitrile to immediately inactivate blood esterase activity. Mice were then perfused using ice-cold PBS for 2 minutes at 5 mL/min until perfusate ran clear. The brain was collected in four sections (forebrain, cerebellum, brainstem, and backup forebrain) and snap frozen in liquid nitrogen. All acetonitrile-extracted blood samples were centrifuged at 17,000 x G for 3 minutes and the supernatant was transferred to new tube and frozen at −80 °C until bioanalysis.
In gel click chemistry ABPP assay
Click chemistry labeling of alkyne inhibitors was performed as previously reported (Niphakis et al., 2012). Click reaction buffer was prepared by mixing CuSO4 (50 mM in H2O, 1.0 μL/reaction), TBTA (1.7 mM in 1:4 DMSO/t-BuOH, 3.0 μL/reaction), freshly prepared TCEP (50 mM in H2O, 1.0 μL/reaction) and 5-TAMRA azide (1.25 mM in DMSO, 1.0 μL/reaction). For every 50 μL tissue proteome (1.0 mg/kg), 6 μL click buffer was added. Reaction mixture was gently mixed and kept in a dark drawer for 1 hour at RT. Reactions were quenched by addition of SDS loading buffer (4x, 18 μL) and run on SDS-PAGE.
Tissue clearing
CLARITY
PFA fixed tissues were incubated in A1P4 hydrogel (1% acrylamide, 0.125% Bis, 4% PFA, 0.025% VA-044 initiator (w/v), in 1X PBS at 4°C for CLARITY embedding as previously published (Sylwestrak et al., 2016). Samples were kept overnight with gentle agitation to allow sufficient monomer diffusion. Samples were flushed with nitrogen and degassed for 15 min at RT. After degassing, samples were polymerized at 37°C for 4 hours with gentle agitation. Samples were removed from hydrogel and washed with 8% PBS-SDS (pH=7.0) at 40°C for two days. After clearing, samples were washed with PBST (pH=7.0 with 0.2% Triton-X100, same for the following) 3 x 10 min at RT to remove residue SDS. Samples were briefly washed with PBS and then stored in PBS with 0.02% sodium azide at 4°C.
SHIELD
SHIELD processing was carried out as previously reported (Park et al., 2018). Tissue samples were incubated in SHIELD-OFF solution (25% dH2O, 25% SHIELD BUFFER solution, 50% SHIELD epoxy solution) at 4°C for 1 day with gentle agitation. Samples were then transferred to an equivalent volume of SHIELD-ON buffer and incubated at 37°C with shaking for 24 hours. Samples were washed with PBS 3 x 10 min at RT to remove residual SHIELD-ON buffer and then cleared with 8% PBS-SDS (pH=7.0) overnight at 40°C. Samples were washed with PBST 3 x 10 min at RT to remove residue SDS. Samples were briefly washed with PBS and then stored in PBS with 0.02% sodium azide at 4°C.
iDISCO
iDISCO was adapted from published protocols (Renier et al., 2014). All the washes with organic solvents were carried out at 4°C with shaking. Fixed samples were washed in 20%, 40%, 60%, 80% methanol in H2O/0.1% Triton X-100/0.3 M glycine (B1N buffer, pH 7), and then with 100% methanol twice. Samples were then delipidated with 100% dichloromethane (DCM), washed in 100% methanol three times, then in 80%, 60%, 40%, 20% methanol in B1N buffer. Each round of wash above was 15 min. Samples were then washed with PBST 3 x 10 min at RT to remove residue organic solvent. Samples were briefly washed with PBS and then stored in PBS with 0.02% sodium azide at 4°C.
fDISCO
fDISCO was adapted from published protocols (Qi et al., 2019). Samples were washed at RT with shaking. Fixed samples were washed in 50%, 70%, 80% tetrahydrofuran (THF) in 25% Quadrol (in 1X PBS to adjust to pH 9), then 100% THF twice. Samples were delipidated with 100% DCM, then washed with 100% THF three times followed by 80%, 70%, 50% THF. Each round of wash above was 15 min. Samples were then washed with PBST 3 x 10 min at RT to remove residual organic solvent. Samples were briefly washed with PBS and then stored in PBS with 0.02% sodium azide at 4°C.
CUBIC3.0
CUBIC protocol was adapted from the recent CUBIC3.0 protocol (Tainaka et al., 2018). Samples were cleared with CUBIC-L buffer (10% wt N-butyldiethanolamine, 10% wt TritonX-100 in dH2O) at 37°C for 4 hours. Samples were then washed with PBST 3 x 10 min at RT to remove residual detergents. Samples were briefly washed with PBS and then stored in PBS with 0.02% sodium azide at 4°C.
CATCH labeling
For 100-micron sections labeling, the full CATCH reaction buffer contains: 5 μM AF647-picolyl azide, 150 μM CuSO4, 300 μM BTTP, 2.5 mM sodium ascorbate, and 10% DMSO in PBS. Tissue sections were incubated in click incubation buffer (without sodium ascorbate) overnight at RT. Tissues were then transferred to newly prepared incubation buffer and 100 mM freshly prepared sodium ascorbate was subsequently added to initiate the reaction. After 1 hour at RT in the dark with minor agitation, the reaction was quenched by addition of 4 mM EDTA in PBS (pH=8.0) and samples were washed 3 x 10 min with PBST. After removing click reaction cocktail, samples were stained by DAPI (1:3000 dilution in PBS from 10 μM stock) for 15 min at RT and would be ready for RI matching and imaging. They could also undergo further staining for cell type registration. For 500-micron sections, 300 μM CuSO4 and 600 μM BTTP were used for incubation and reaction. To achieve full labeling, tissues were incubated at 37°C for 2 days, and underwent 4 rounds of 1 h click reaction at RT.
Immunostaining
Samples were incubated with primary antibodies in PBST overnight at 4°C unless otherwise noted. Samples were then washed with PBST, 3 x 30 min, RT and transferred to secondary antibodies diluted in PBST. Samples were incubated with secondary antibodies overnight, RT and washed with PBST 3 x 30 min. For antibody elution, imaged slides were dismounted, and tissues were washed by 8% PBS-SDS (pH=7.0) at 60°C for 8 hours. Samples were then washed by PBST 3 x 10 min at RT to remove residual SDS and could undergo the next round of staining.
Hybridization Chain Reaction (HCR)
Samples were pre-incubated in probe hybridization buffer for 30 min at 37°C. Samples were then transferred to new probe hybridization buffer with 16 nM FAAH-B1 or 4 nM SST-B1 probe and incubated overnight at 37°C. Samples were washed by probe washing buffer at 37°C, 3 x 30 min and then by 5 x SSCT (750 mM NaCl, 75 mM sodium citrate, 0.1% Tween-20 in H2O), 2 x 30 min, RT. Samples were pre incubated in amplification buffer for 30 min at RT. HCR hairpin was typically stored as 3μM, 12μL aliquots. For every hairpin aliquot, 4 μL of 20 x SSC (VWR, 10128-690) was added. Hairpins were heated to 95°C for 90 seconds and cooled to RT in a dark drawer. Hairpins were then added to new amplification buffer to afford final hairpin concentration of 360 nM. Samples were then transferred to hairpin containing amplification buffer and incubated overnight at RT. Samples were washed with 5 x SSCT, 3 x 30 min and would be ready for imaging.
Confocal microscopy
Labeled samples were immersed in RI matching media (RapiClear, 1.45 RI), then mounted to a glass microscope slide. Tissues were then imaged with the Olympus FV3000 confocal microscope with a 10X, 0.6 NA, water immersion objective (XLUMPlanFI, Olympus) for global characterizations, or a 40X, 1.25 NA, silicone oil immersion (UPlanSApo, Olympus) for detailed cell type, mRNA expression and subcellular compartment identification.
Drug in vivo concentration analysis
Compound concentration in blood and brain regions (forebrain and brainstem) was determined by LC/MS/MS. Acetonitrile-extracted blood samples were prepared as described above and the blood calibration curves were made using blood from naïve mice quenched following the same protocol spiked with serial dilutions of the test article, ranging 0.1-5000 ng/mL.
To each frozen brain tissue, 3 volumes (in μL) of ice-cold acetonitrile:water 3:1 (vol:vol) was added by tissue weight (mg) for compound extraction. Tissues were then homogenized for one minute at 30 Hz in a tissue lyser (Tissue Lyser II, Qiagen) with one stainless steel bead (5 mm diameter). Samples were incubated on ice for 45 minutes. Afterwards, samples were centrifuged at 2.400 x g at 4 C for 15 minutes and supernatants were transferred to another tube. The forebrain and brainstem calibration curves were made using a brain homogenate from naïve mice (extracted following the same protocol than the samples) spiked with serial dilutions of the test article, ranging 0.1-5000 ng/mL.
10 μL of the extracts were injected onto an Agilent 1290 UPLC system equipped with a G7120A pumps, a G7129B autosampler and a G1170A column manager (Agilent Technologies). Chromatographic separation was achieved using an Acquity UPLC BEH C18 Column (2.1 x 50 mm, 1.7 μm particle size, 130 Ǻ) coupled to an Acquity UPLC BEH C18 Column Guard (2.1 x 5 mm, 1.7 μm particle size, 130 Ǻ) (Waters Corporation). Mobile Phase A was composed by Water/Acetonitrile 95:5 by vol. and mobile phase B was composed by Acetonitrile/Water 95:5 by vol. 0.1% formic acid was added to both mobile phases. Gradient started with 0% B that was kept for 0.5 min before being increased linearly to 100% B in 4 min. Afterwards, solvent B was kept at 100% for 1 min, before switching to the initial conditions in 0.1 min. System was allowed to equilibrate for 1.4 minutes before next sample injection. Flow rate was kept at 0.6 mL/min. Column was heated at 50 °C.
Analytes were quantified using a 6460 triple quadrupole mass spectrometer equipped with an electrospray Jet Stream source (Agilent Technologies) operated in dynamic multiple reaction monitoring (dMRM) mode. The quantitative and qualitative transitions for each compound were optimized using the authentic standards in the Optimizer software (Agilent Technologies): MJN110 (Quant: 462.1→235, CE=10; Qual: 462.1→165, CE=45), MJN110-yne (Quant: 452.1→225, CE=10; Qual: 452.1→189.6, CE=45), PF7845 (Quant: 456.2→335.1, CE=22; Qual: 456.2→122, CE=30) and PF7845-yne (Quant: 470.2→349.2, CE=18; Qual: 470.2→320.2, CE=30). The following parameters were kept constant for all transitions: Fragmentor=140, Cell Accelerator Voltage=4, Polarity=Positive. Total cycle time was 500 ms. Source parameters were kept as follows: Dry Gas Temperature=350 °C, Dry Gas Flow=11 L/min, Sheath Gas Temperature=350 °C, Sheath Gas Flow=11 L/min, Nebulizer= 50 psi, Noozle voltage= 1500 V (positive) and Capillary= 3500 V (positive).
Compound concentrations were calculated by extrapolating the integrated area under the curve with the calibration curves for each particular compound prepared in the same matrix than the samples using the Masshunter Quantitative Analysis Software (Agilent Technologies).
QUANTIFICATION AND STATISTICAL ANALYSIS
Images were typically acquired with 10 μm intervals and analyzed with Fiji-ImageJ for 2D quantifications. 3D drug binding was visualized by Imaris 9.2.1. All images were stored and processed as TIFF format.
Signal profile analysis
A 40-micron straight line was drawn across a pyramidal cell in cortex layer V on tissue surface as previously reported (Pan et al., 2016). Signal profile was plotted along the line and data was recorded that included background, drug positive membrane pixels and nucleus. The plotted data was then normalized by dividing each value by the average intensity of all intensity values on the same line.
Click labeling signal analysis
Individual drug positive cell intensity was quantified as previously reported (Pan et al., 2016; Qi et al., 2019). A 150 x 150 pixel (pixel size 0.414 μm) ROI was generated on tissue surface in cortex layer V and an auto threshold was applied to measure the mean drug positive pixel intensity as Isignal. The mean intensity of the remaining pixel is used as background intensity as Ibackground. The mean labeling intensity is calculated as Ilabelling=Isignal-Ibackground. The signal to background ratio as a function of tissue depth was calculated as the ratio of Isignal and Ibackground as previously reported (Sylwestrak et al., 2016).
Regional drug abundance analysis
Images were stacked with max z projection covering the whole coronal brain section. Different ROIs were drawn to outline individual brain regions based on a mouse brain atlas (The Mouse Brain in Stereotaxic Coordinates, Second Edition) and their average intensity were recorded. Intensity values were then normalized to the average intensity of vehicle samples in the respective brain region.
Fluorescence intensity correlation analysis
To quantify the correlation of FAAH and MAO-A immunostaining signal and drug signal, images were first stacked by max intensity projection (MIP) to obtain a single plane image. The image was then compressed 10 times to obtain final pixel size of 24.9 μm. The whole tissue was then outlined by applying a threshold in the immunostaining channel and each X-Y coordinate intensity was saved in both channels. Intensity values for each pixel were then normalized to the average intensity of each measurement and plotted. Single linear regression was applied to analyze pixel wise signal correlation.
Drug binding capillary analysis
To quantify drug binding abundance in relation to the proximity to the nearest blood vessel, the pyramidal cell layer in CA1 and granular cell layer in DG were first cropped out. A threshold was applied to quantify the average nucleus (drug negative) pixels intensity as background intensity. Then different ROIs were cropped out based on distance to the nearest blood vessel and the same threshold value was applied to quantify average intensity in non-nucleus pixels. Average labeling intensity was then obtained by subtracting the average non-nucleus pixel intensity by the background intensity.
Subcellular compartment intensity analysis
For MJN110-yne characterization, images were acquired at 5 μm from the tissue surface where the highest immunostaining signal can be observed. Different cellular compartments were identified by applying a threshold in immunostaining signal and mean drug labeling intensity was measured in the selected threshold region. Three random squares were drawn in nucleus in different cells and their average intensity was used as background. The recorded intensity value in soma or axonal terminal was then subtracted by the intensity in the nucleus for background adjustment. Data was then normalized to the average intensity of the control group as indicated in each figure legends.
Unless otherwise specified, statistical analysis was evaluated with Graphpad Prism 9 using ordinary one-way and two-way ANOVA (* p < 0.05; ** p < 0.01; *** p < 0.001; **** p < 0.0001), followed by Tukey’s multiple comparisons test, Šidák’s multiple comparisons test or Dunnett’s multiple comparisons test. All data presented as mean ± SD with N given in figure legend as biological replicates unless otherwise noted. Brain wide correlation of immunostaining and drug intensity was evaluated with simple linear regression model and R squared was calculated for each drug. For intensity ratios across different subcellular compartments, unpaired Mann-Whitney (Wilcoxon rank-sum) test was used. Drug PK analysis was performed with t test.
Supplementary Material
Figure S6. PF7845 dose and time-dependent binding profile characterizations, related to Figure 6.
(A-B) Forebrain to blood ratio (A) and forebrain to brainstem ratio (B) at peak parental drug time point in forebrain (4 h for PF7845/PF7845-yne, 1 h for MJN110/MJN110-yne). No significant difference found between parental drug and the alkyne drug. N = 3 mice for each condition (Two-tailed unpaired t test).
(C) Quantitative PK analysis for PF7845 and PF7845-yne in blood, forebrain and brainstem. PF7845-yne shows lower in vivo concentration in blood and tissue. N = 3 mice for each condition, error bar indicates SD.
(D) Quantitative PK analysis for MJN110 and MJN110-yne in blood, forebrain and brainstem. MJN110-yne shows higher in vivo concentration in blood and tissue. N = 3 mice for each condition, error bar indicates SD.
(E-F) In gel CC-ABPP characterization of PF7845-yne binding in brain (E) and liver (F) membrane proteomes at ascending doses (4 h, i.p.).
(G) Zoomed-out views of PF7845 blocking at indicated dose followed by PF7845-yne injection (1 mg/kg, 1 h, i.p.) in hippocampus and cortex. Scale bar, 500 μm.
(H-J) Quantification of fluorescence intensity upon dose-dependent PF7845 blocking in S1 (H), CA1 (I) and DG (J). Signal normalized to the mean intensity of samples without blocking. N = 3 mice for each condition, two field of views from each mouse (One-way ANOVA, Tukey multiple comparisons test).
(K) Quantification of fluorescence intensity in figure 6B upon dose dependent PF7845 blocking in DG. Signal normalized to the mean intensity of samples blocked by 0.01 mg/kg PF7845. N = 3 mice for each condition, two field of views from each mouse (One-way ANOVA, Tukey multiple comparisons test).
(L) Zoomed-in views from samples blocked by 0.01 and 0.02 mg/kg PF7845. Samples were co-stained with lectin to visualize blood vessels. Images represent DG. 0.02 mg/kg blocked images were enhanced for better visualization. Dashed line indicates low drug binding regions. Scale bar, 40 μm.
(M) Quantification of fluorescence intensity in hippocampus DG at different distance to the nearest blood vessel. Intensity normalized to pixels within 15-20 μm to blood vessel. N = 3 mice for each condition. Error bar indicates SD (One-way ANOVA in each dose).
(N) Quantification of fluorescence intensity in figure 6H of drug binding in DG. Signal normalized to the mean intensity of vehicle control. N = 5 mice for each condition (One-way ANOVA, Tukey multiple comparisons test).
(O) PF7845-yne co-staining with lectin to visualize blood vessels. Images represent DG. Dashed line indicates high drug binding regions. Scale bar, 40 μm.
(P) Quantification of fluorescence intensity in hippocampus DG at different distance to the nearest blood vessel. Intensity normalized to pixels within 5 μm to blood vessel. N = 3 mice for each condition. Error bar indicates SD (One-way ANOVA in each dose).
(Q) Zoomed-out views of PF7845 blocking for indicated time followed by PF7845-yne injection (1 mg/kg, 1 h, i.p.) in hippocampus and cortex. Scale bar, 500 μm. (R-T) Quantification of fluorescence intensity of upon time-dependent PF7845 blocking in S1 (P), CA1 (Q) and DG (R). Signal normalized to the mean intensity of samples with 1 h blocking. N = 3 mice for each condition, two field of views from each mouse (One-way ANOVA, Tukey multiple comparisons test).
Data points represent mean ± SD. ns: not significant; **P<0.01; ****P<0.0001.
Figure S4. Brain wide drug binding cell type identification, related to Figure 4.
(A-B) PF7845-yne (5 mg/kg, 4 h, i.p.), BIA10-2474-yne (5 mg/kg, 4 h, i.p.) and pargyline-yne (20 mg/kg, 4 h, i.p.) binding co-stained with NeuN for neuron (A) and lectin for blood vessel (B) in various brain regions. Images represent M1, Pir, IG, hippocampal CA1, VPM, hypothalamus and V1. Scale bar, 10 μm.
(C) PF7845-yne binding co-stained with GFAP for astrocyte, parvalbumin (PV) and somatostatin (SST) for inhibitory interneurons and Ctip2 for excitatory projection neurons. Images represent S1. Scale bar, 10 μm.
(D) Quantification of marker positive cell overlap with PF7845-yne positive cell. No overlap found for GFAP, PV and SST. 87.0 ± 2.1% (mean ± sd) projection neurons have PF7845-yne binding. N = 3 mice for each condition.
(E) PF7845-yne binding in VGAT-Ai14 mice. VGAT-Ai14 mice express TdTomato in VGAT positive inhibitory neurons. Images represent S1. Scale bar, 10 μm.
(F) Quantification of VGAT positive inhibitory neurons overlap with PF7845-yne positive cell. No inhibitory neurons found to have PF7845-yne binding. N = 3 mice for each condition.
(G) Pargyline-yne binding co-stained with parvalbumin (PV) and somatostatin (SST) for inhibitory interneurons. Images represent hypothalamus. Scale bar, 10 μm.
(H) Quantification of marker positive cell overlap with pargyline-yne positive cell. No overlap found for PV and SST. N = 3 mice for each condition.
(I) pargyline-yne binding in VGAT-Ai14 mice. Images represent S1. Scale bar, 10 μm.
(J) Quantification of VGAT positive inhibitory neurons overlap with pargyline-yne positive neurons. 82.8 ± 4.5% (mean ± sd) pargyline-yne positive neurons are inhibitory. N = 3 mice for each condition.
(K-L) In situ expression profile of TH (K) and MAO-A (L) from Allen Brain Atlas. High TH expression can be found in ventral tegmental area (VTA) and substantial nigra (SNr), representing dopaminergic neuron in the region. Sparse TH and MAO-A expression can be found in LC, representing NA neurons in the pons.
(M) Zoomed-out sagittal view for figure 4E showing high TH expression in dopaminergic neurons in VTA and SNr, together with registered pargyline-yne positive cells in LC representing NA neurons. Scale bar, 500 μm.
Figure S5. MJN110-yne mapping validation in different subcellular compartments, related to Figure 5.
(A) Chemical structures of MJN110 and MJN110-yne.
(B) Pretreatment by parental non-alkyne MJN110 (5 mg/kg, 4 h, i.p.) prior to MJN110-yne injection (5 mg/kg, 4 h, i.p.). MAGL engagement is marked by presynaptic marker synapsin. Synapsin overlapping signal is absent in MJN110 pretreatment samples. Scale bar, 10 μm.
(C) MJN110-yne (5 mg/kg, 4 h, i.p.) mapping validation in MAGL−/− mice. Absence of MAGL abolishes MJN110-yne binding at presynaptic site. Scale bar, 10 μm.
(D) High resolution imaging of CA3 presynaptic terminals and CA1 soma. Zoomed-in of MAP2 and synapsin positive pixels are highlighted in box. Scale bar, 10 μm.
(E) Quantification of ratios between soma and presynaptic terminal fluorescence intensities. Ratios were calculated based on the mean 1 mg/kg local presynaptic terminal intensities. N = 3 mice for each group; two fields of view generated from each mouse (Two-tailed unpaired Mann-Whitney test).
(F) MJN110-yne (20 mg/kg, 4 h, i.p.) labeling after pretreatment with PF7845 (1 mg/kg, 4 h, i.p.) to block FAAH. Figures showing CA3 synapse and CA1 soma with zoom-ins for synapsin and MAP2 positive pixels.
(G) Quantification of ratios between CA3 presynaptic terminal and CA1 soma intensities. Ratios were calculated based on the mean intensity of no pretreatment samples in each region. N = 3 mice for each group, three fields of view generated from each mouse (Two-tailed unpaired Mann-Whitney test).
Data points represent mean ± SD. ns: not significant; **P<0.01; ****P<0.0001.
Figure S2. Brain wide CATCH specificity validation, related to Figure 2.
(A) Full coronal views with zoomed-in views of PF7845-yne (1 mg/kg, 4 h, i.p.) binding. For pretreatment test, the non-alkyne PF7845 (1 mg/kg, 4 h, i.p.) was injected prior to PF7845-yne (1 mg/kg, 4 h, i.p.) to block target engagement. Zoomed-in images represent S1, cingulate cortex (Cg), BLA, V1. Scale bar, 100 μm.
(B) Full coronal views with zoomed-in views of PF7845-yne (1 mg/kg, 4 h, i.p.) binding in both wildtype and FAAH−/− mice. Zoomed-in images represent S1, Cg, BLA and V1. No alkyne drug labeling observed in FAAH−/− mice. Scale bar, 100 μm.
(C) Quantification of fluorescence intensity across different brains regions in FAAH−/− test. Intensity is normalized to the vehicle samples in each region. No significant difference between vehicle and FAAH−/− mice. N = 3 mice for each condition, two field of views generated from each mouse (Two-way ANOVA, Tukey multiple comparisons test).
(D) 3D rendering of PF7845-yne mapping in S1 of 500-micron CLARITY sections. Scale bar, 50 μm.
(E) Quantification of drug labeling intensity and ratio of signal to background as a function of depth in tissue. Intensity normalized to average of surface intensity. Three tissue blocks included in the analysis, error bar indicates SD.
Data points represent mean ± SD. ns: not significant; ****P<0.0001.
Figure S3. Brain-wide drug binding mapping, related to Figure 3.
(A) Chemical structures of BIA10-2474, pargyline and their alkyne analogs.
(B) Sagittal view of MAO-A expression with PF7845-yne (1 mg/kg, 4 h, i.p.), and pargyline-yne (20 mg/kg, 4 h, i.p.) drug mapping. Pargyline-yne binding in the pons and hypothalamus were highlighted with zoomed-in views. Pargyline-yne labeling in pons is correlated with high MAO-A expression, whereas its binding in the hypothalamus may primarily reflect MAO-B inhibition. Scale bar, 1 mm.
(C-D) Quantification of pixel wise FAAH immunostaining intensity with pargyline-yne (C), and PF7845-yne (D) labeling intensity. Simple linear regression with R squared values quantified.
(E) BIA10-2474-yne (5 mg/kg, 4 h, i.p.) binding in both wild type mice and FAAH−/− mice. Note in CA1 and S1, the absence of target enzyme FAAH abolished both PF7845-yne (5 mg/kg, 4 h, i.p.) and BIA10-2474-yne binding. Scale bar, 500 μm. 5m/kg dosing was used for both drugs to maximize the contrast of target visualization.
(F) Full coronal sections at Bregma −4.4 with zoomed-in views at periaqueductal gray (PAG) and reticulotegmental nucleus of the pons (RtTg). BIA10-2474-yne (5 mg/kg, 4 h, i.p.) binds to large cellular structures in wildtype, but not FAAH−/− mice PAG, suggesting primarily on target binding in PAG. Cellular structures can be found in RtTg in FAAH−/− mice treated with BIA10-2474-yne, indicating off target binding. Image brightness/contrast is optimized for each brain region for better visualization. Scale bar, 100 μm.
Figure S1. Development of CATCH to image small molecule drug binding, related to Figure 1.
(A) Chemical structures of PF7845 and PF7845-yne.
(B) Direct click reaction in conventional histology paraformaldehyde (PFA) fixed samples (PF7845-yne, 1 mg/kg, 4 h, i.p.) under identical click reaction conditions in CC-ABPP. Images represent S1. Scale bar, 20 μm.
(C) Chemical structures of click reaction ligands used in the study. The first generation click reaction ligand TBTA has relatively poor solubility and requires use of high Cu concentration for efficient labeling. Second generation ligand THPTA and newer generation ligands BTTP, BTTAA all featured improved solubility, and allowed substantial lower Cu usage while maintaining high labeling efficiency.
(D) Fluorescence intensity of click reaction with ascending Cu2+ concentration. Intensity normalized to vehicle 50 μM. Four tissue blocks for each condition, two fields of views from each tissue block (Two-way ANOVA, Šidák’s multiple comparisons test).
(E) Click reaction with individual component removed. Only when all the components are present can the reaction proceed. Images represent S1. Scale bar, 20 μm.
(F) Fluorescence intensity in the absence of different click reaction components. Intensity normalized to the average intensity of vehicle full buffer sample. Two tissue blocks for each condition, two fields of views from each tissue block (Two-way ANOVA, Šidák’s multiple comparisons test).
(G) Zoomed-out view of PF7845-yne binding in hippocampus and cortex (1 mg/kg, 4 h) via intraperitoneal (i.p.), oral and subcutaneous (s.c.) delivery. Scale bar, 400 μm.
(H-I) Quantification of fluorescence intensity in S1 (H) and hippocampus CA1 (I). Intensity normalized to i.p. samples. N = 3 mice for each condition, two fields of views from each mouse (One-way ANOVA, Tukey multiple comparisons test).
(J) PF7845-yne in liver, lung and small intestine with FAAH immunostaining. Scale bar, 50 μm.
Data points represent mean ± SD. ns: not significant; **P<0.01; ****P<0.0001.
KEY RESOURCES TABLE
| REAGENT or RESOURCE | SOURCE | IDENTIFIER |
|---|---|---|
| Antibodies | ||
| anti-FAAH | abcam | Cat#ab54615; RRID: AB_2101890 |
| anti-NeuN | Thermo Scientific | Cat#PA5-78639; RRID: AB_2736207 |
| anti-GAD67 | Sigma Aldrich | Cat#MAB5406; RRID: AB_2278725 |
| DyLight 488 lectin | Vector Laboratories | Cat#DL-1174; RRID: AB_2336404 |
| anti-Ctip2 | abcam | Cat#ab18465; RRID: AB_2064130 |
| anti-MAP2 | Cell Signaling Technology | Cat#8707T; RRID: AB_2722660 |
| anti-Synapsin | Cell Signaling Technology | Cat#5297T; RRID: AB_2616578 |
| anti-TH | abcam | Cat#ab76442; RRID: AB_1524535 |
| anti-PV | abcam | Cat#11427; RRID: AB_298032 |
| anti-MAO-A | Proteintech | Cat#10539-1-AP; RRID: AB_2137251 |
| Alexa Fluor 488 F(ab’)2 Fragment Donkey anti-Mouse IgG | Jackson Immuno Research | Cat#715-546-150; RRID:AB_2340849 |
| Alexa Fluor 488 F(ab’)2 Fragment Donkey anti-Rabbit IgG | Jackson Immuno Research | Cat#711-546-152; RRID:AB_2340619 |
| Alexa Fluor 488 F(ab’)2 Fragment Donkey anti-Rat IgG | Jackson Immuno Research | Cat#712-546-153; RRID:AB_2340686 |
| Alexa Fluor 488 F(ab’)2 Fragment Donkey anti-Chicken IgG | Jackson Immuno Research | Cat#703-546-155; RRID:AB_2340376 |
| Chemicals, peptides, and recombinant proteins | ||
| AF647-picoly azide | Click Chemistry Tools | Cat#1300-5 |
| 5-TAMRA azide | Click Chemistry Tools | Cat#1245-1 |
| TBTA | TCI chemicals | Cat#T2993; CAS#510758-28-8 |
| THPTA | Sigma Aldrich | Cat#762342; CAS#760952-88-3 |
| BTTAA | Click Chemistry Tools | Cat#1236-100; CAS#1334179-85-9 |
| BTTP | Click Chemistry Tools | Cat#1414-100; CAS#1334179-85-9 |
| DMSO | Sigma-Aldrich | Cat#D8418; CAS#67-68-5 |
| t-BuOH | Sigma-Aldrich | Cat#360538; CAS#75-60-5 |
| Copper sulfate | Sigma Aldrich | Cat#C1297; CAS#7758-98-7 |
| Sodium ascorbate | Sigma Aldrich | Cat#A4034; CAS#134-03-2 |
| TCEP | VWR | Cat#103051-744; CAS#51805-45-9 |
| PF7845 | Cayman Chemical Company | Cat#19306; CAS#1020315-31-4 |
| PF7845-yne | Niphakis et al., 2012 | N/A |
| BIA10-2474 | Cayman Chemical Company | Cat#23157; CAS#1233855-46-3 |
| BIA10-2474-yne | Huang et al., 2019 | N/A |
| Pargyline | Sigma Aldrich | Cat#M74253; CAS#555-57-7 |
| Pargyline-yne | Krysiak et al., 2012 | N/A |
| MJN110 | Cayman Chemical Company | Cat#17583; CAS#1438416-21-7 |
| MJN110-yne | Chang et al., 2013 | N/A |
| Yeast tRNA | Thermo Fisher Scientific | Cat#15-401-029 |
| Deionized formamide | Millipore Sigma | Cat#S4117 |
| HCR probe hybridization buffer | Molecular Instruments | N/A |
| HCR probe washing buffer | Molecular Instruments | N/A |
| HCR amplification buffer | Molecular Instruments | N/A |
| DAPI | Sigma-Aldrich | Cat#D9542; CAS#28718-90-3 |
| RapiClear, RI 1.45 | Sunjin Lab | Cat#RCCS005 |
| 30% Acrylamide/Bis Solution, 37.5:1 | Bio-Rad | Cat#1610159 |
| Ammonium Persulfate (APS) | Bio-Rad | Cat#1610700 |
| Temed | Bio-Rad | Cat#1610800 |
| 4x Laemmli Sample Buffer | Bio-Rad | Cat#1610747 |
| 40% acrylamide solution | Bio-Rad | Cat#1610140 |
| 2% Bis Solution | Bio-Rad | Cat#1610142 |
| EMS 32% Paraformaldehyde Aqueous Solution | Electron Microscopy Sciences | Cat#15714-S |
| VA-044 | Fisher Scientific | Cat#NC0632395; CAS#27776-21-2 |
| EMS Perfusion Fixative Reagent (4% PFA) | Fisher Scientific | Cat#5033441 |
| SHIELD-ON solution | LifeCanvas Technologies | N/A |
| SHIELD BUFFER solution | LifeCanvas Technologies | N/A |
| SHIELD epoxy solution | LifeCanvas Technologies | N/A |
| N-butyldiethanolamine | Sigma Aldrich | Cat#471240; CAS#102-79-4 |
| Critical commercial assays | ||
| Pierce™ BCA® Protein Assay Kits | Thermo Scientific | Cat#23227 |
| Experimental models: Organisms/strains | ||
| Mouse: C57BL6J | Jackson Laboratory | #000664 |
| Mouse: FAAH−/− | Benjamin Cravatt lab (Cravatt et al., 2001) | N/A |
| Mouse: MAGL−/− | Benjamin Cravatt lab (Schlosburg et al., 2010) | N/A |
| Mouse: Vgat-ires-cre | Jackson Laboratory | #016962 |
| Mouse: Ai14 | Jackson Laboratory | #007908 |
| Oligonucleotides | ||
| FAAH HCR probe | Molecular Instrument | N/A |
| SST B2 HCR probe | IDT (Sylwestrak et al., 2016) | N/A |
| Alexa Fluor 488 HCR B2 hairpin | Molecular Instrument | N/A |
| Alexa Fluor 488 HCR B1 hairpin | Molecular Instrument | N/A |
| Software and algorithms | ||
| Fiji-ImageJ | Fiji | https://imagej.net/software/fiji/ |
| PrismX9 | Graphpad | https://www.graphpad.com/ |
| BioRender | BioRender | https://app.biorender.com/ |
| Imaris9.2.1 | OXFORD INSTRUMENTS | https://imaris.oxinst.com/ |
| Masshunter Quantitative Analysis software | Agilent Technology | https://www.agilent.com/en/product/software-informatics/mass-spectrometry-software |
Tissue clearing greatly improves click chemistry labeling in mammalian tissues
CATCH enables brain-wide, subcellular in situ imaging of drug-target engagement
CATCH allows cellular drug target identification and validation.
CATCH quantitively determines on- and off-target in vivo drug binding.
Acknowledgements
We thank all members of the Ye lab and the Dorris Neuroscience Center for their support and feedback. We thank Peng Wu, Senlian Hong, and Yujie Shi for advice on click reactions. We are grateful to Hanbing Shen, Wesam Kanim, Kathy Spencer, Kim Masuda for their technical support; Micah Niphakis, Jason Clapper, Yujia Wang, Xiaoyu Zhang, Zixi Zhu, and Zhichen Wu for their input. We also thank Ardem Patapoutian, Paul Cohen, Anton Maximov and Jonathan Long for suggestions on the manuscript.
ZYP, YW and DY are supported by the Dorris Scholar Award. LY is supported by National Institutes of Health Director’s New Innovator Award (DP2DK128800), NIDDK (DK114165, DK124731), the Dana Foundation, the Whitehall Foundation, and the Baxter Foundation. BFC acknowledges financial support by the NIH (DA033760) and MAS acknowledges the Swiss National Science Foundation for a postdoctoral fellowship (P2EZP3_175137).
Footnotes
Declaration of interests: The design, steps, and applications of CATCH are covered in pending patent application material from The Scripps Research Institute. B.F.C. is a member of the Cell advisory board.
Publisher's Disclaimer: This is a PDF file of an unedited manuscript that has been accepted for publication. As a service to our customers we are providing this early version of the manuscript. The manuscript will undergo copyediting, typesetting, and review of the resulting proof before it is published in its final form. Please note that during the production process errors may be discovered which could affect the content, and all legal disclaimers that apply to the journal pertain.
REFERENCES
- Besanceney-Webler C, Jiang H, Zheng T, Feng L, Soriano del Amo D, Wang W, Klivansky LM, Marlow FL, Liu Y, and Wu P (2011). Increasing the efficacy of bioorthogonal click reactions for bioconjugation: a comparative study. Angew Chem Int Ed Engl 50, 8051–8056. [DOI] [PMC free article] [PubMed] [Google Scholar]
- Brullo C, Villa C, Tasso B, Russo E, and Spallarossa A (2021). Btk Inhibitors: A Medicinal Chemistry and Drug Delivery Perspective. Int J Mol Sci 22. [DOI] [PMC free article] [PubMed] [Google Scholar]
- Byrd JC, Furman RR, Coutre SE, Flinn IW, Burger JA, Blum KA, Grant B, Sharman JP, Coleman M, Wierda WG, et al. (2013). Targeting BTK with ibrutinib in relapsed chronic lymphocytic leukemia. N Engl J Med 369, 32–42. [DOI] [PMC free article] [PubMed] [Google Scholar]
- Cañeque T, Müller S, and Rodriguez R (2018). Visualizing biologically active small molecules in cells using click chemistry. Nat Rev Chem 2, 202–215. [Google Scholar]
- Canon J, Rex K, Saiki AY, Mohr C, Cooke K, Bagal D, Gaida K, Holt T, Knutson CG, Koppada N, et al. (2019). The clinical KRAS(G12C) inhibitor AMG 510 drives anti-tumour immunity. Nature 575, 217–223. [DOI] [PubMed] [Google Scholar]
- Cao JK, Kaplan J, and Stella N (2019). ABHD6: Its Place in Endocannabinoid Signaling and Beyond. Trends Pharmacol Sci 40, 267–277. [DOI] [PMC free article] [PubMed] [Google Scholar]
- Chang JW, Cognetta AB 3rd, Niphakis MJ, and Cravatt BF (2013). Proteome-wide reactivity profiling identifies diverse carbamate chemotypes tuned for serine hydrolase inhibition. ACS Chem Biol 8, 1590–1599. [DOI] [PMC free article] [PubMed] [Google Scholar]
- Choi HMT, Schwarzkopf M, Fornace ME, Acharya A, Artavanis G, Stegmaier J, Cunha A, and Pierce NA (2018). Third-generation in situ hybridization chain reaction: multiplexed, quantitative, sensitive, versatile, robust. Development 145. [DOI] [PMC free article] [PubMed] [Google Scholar]
- Choi SW, Guan W, and Chung K (2021). Basic principles of hydrogel-based tissue transformation technologies and their applications. Cell 184, 4115–4136. [DOI] [PMC free article] [PubMed] [Google Scholar]
- Chung K, Wallace J, Kim SY, Kalyanasundaram S, Andalman AS, Davidson TJ, Mirzabekov JJ, Zalocusky KA, Mattis J, Denisin AK, et al. (2013). Structural and molecular interrogation of intact biological systems. Nature 497, 332–337. [DOI] [PMC free article] [PubMed] [Google Scholar]
- Cravatt BF, Demarest K, Patricelli MP, Bracey MH, Giang DK, Martin BR, and Lichtman AH (2001). Supersensitivity to anandamide and enhanced endogenous cannabinoid signaling in mice lacking fatty acid amide hydrolase. Proc Natl Acad Sci U S A 98, 9371–9376. [DOI] [PMC free article] [PubMed] [Google Scholar]
- DeNardo LA, Berns DS, DeLoach K, and Luo L (2015). Connectivity of mouse somatosensory and prefrontal cortex examined with trans-synaptic tracing. Nat Neurosci 18, 1687–1697. [DOI] [PMC free article] [PubMed] [Google Scholar]
- Di Marzo V (2018). New approaches and challenges to targeting the endocannabinoid system. Nat Rev Drug Discov 17, 623–639. [DOI] [PubMed] [Google Scholar]
- Egertová M, Cravatt BF, and Elphick MR (2003). Comparative analysis of fatty acid amide hydrolase and cb1 cannabinoid receptor expression in the mouse brain: evidence of a widespread role for fatty acid amide hydrolase in regulation of endocannabinoid signaling. Neuroscience 119, 481–496. [DOI] [PubMed] [Google Scholar]
- Erturk A, Becker K, Jahrling N, Mauch CP, Hojer CD, Egen JG, Hellal F, Bradke F, Sheng M, and Dodt HU (2012). Three-dimensional imaging of solvent-cleared organs using 3DISCO. Nat Protoc 7, 1983–1995. [DOI] [PubMed] [Google Scholar]
- Ghosh AK, Samanta I, Mondal A, and Liu WR (2019). Covalent Inhibition in Drug Discovery. ChemMedChem 14, 889–906. [DOI] [PMC free article] [PubMed] [Google Scholar]
- Gulyas AI, Cravatt BF, Bracey MH, Dinh TP, Piomelli D, Boscia F, and Freund TF (2004). Segregation of two endocannabinoid-hydrolyzing enzymes into pre- and postsynaptic compartments in the rat hippocampus, cerebellum and amygdala. European Journal of Neuroscience 20, 441–458. [DOI] [PubMed] [Google Scholar]
- Ha J, Park H, Park J, and Park SB (2021). Recent advances in identifying protein targets in drug discovery. Cell Chem Biol 28, 394–423. [DOI] [PubMed] [Google Scholar]
- Hong DS, Fakih MG, Strickler JH, Desai J, Durm GA, Shapiro GI, Falchook GS, Price TJ, Sacher A, Denlinger CS, et al. (2020). KRAS(G12C) Inhibition with Sotorasib in Advanced Solid Tumors. N Engl J Med 383, 1207–1217. [DOI] [PMC free article] [PubMed] [Google Scholar]
- Huang Z, Ogasawara D, Seneviratne UI, Cognetta AB 3rd, Am Ende CW, Nason DM, Lapham K, Litchfield J, Johnson DS, and Cravatt BF (2019). Global Portrait of Protein Targets of Metabolites of the Neurotoxic Compound BIA 10-2474. ACS Chem Biol 14, 192–197. [DOI] [PMC free article] [PubMed] [Google Scholar]
- Johnson DS, Stiff C, Lazerwith SE, Kesten SR, Fay LK, Morris M, Beidler D, Liimatta MB, Smith SE, Dudley DT, et al. (2011). Discovery of PF-04457845: A Highly Potent, Orally Bioavailable, and Selective Urea FAAH Inhibitor. ACS Med Chem Lett 2, 91–96. [DOI] [PMC free article] [PubMed] [Google Scholar]
- Kerbrat A, Ferre JC, Fillatre P, Ronziere T, Vannier S, Carsin-Nicol B, Lavoue S, Verin M, Gauvrit JY, Le Tulzo Y, et al. (2016). Acute Neurologic Disorder from an Inhibitor of Fatty Acid Amide Hydrolase. N Engl J Med 375, 1717–1725. [DOI] [PubMed] [Google Scholar]
- Kiss LE, Beliaev A, Ferreira HS, Rosa CP, Bonifacio MJ, Loureiro AI, Pires NM, Palma PN, and Soares-da-Silva P (2018). Discovery of a Potent, Long-Acting, and CNS-Active Inhibitor (BIA 10-2474) of Fatty Acid Amide Hydrolase. ChemMedChem 13, 2177–2188. [DOI] [PMC free article] [PubMed] [Google Scholar]
- Krysiak JM, Kreuzer J, Macheroux P, Hermetter A, Sieber SA, and Breinbauer R (2012). Activity-based probes for studying the activity of flavin-dependent oxidases and for the protein target profiling of monoamine oxidase inhibitors. Angew Chem Int Ed Engl 51, 7035–7040. [DOI] [PMC free article] [PubMed] [Google Scholar]
- Li L, Zhang CW, Ge J, Qian L, Chai BH, Zhu Q, Lee JS, Lim KL, and Yao SQ (2015). A Small-Molecule Probe for Selective Profiling and Imaging of Monoamine Oxidase B Activities in Models of Parkinson's Disease. Angew Chem Int Ed Engl 54, 10821–10825. [DOI] [PubMed] [Google Scholar]
- Li L, and Zhang Z (2016). Development and Applications of the Copper-Catalyzed Azide-Alkyne Cycloaddition (CuAAC) as a Bioorthogonal Reaction. Molecules 21, p1393. [DOI] [PMC free article] [PubMed] [Google Scholar]
- Lu X, Smaill JB, Patterson AV, and Ding K (2022). Discovery of Cysteine-targeting Covalent Protein Kinase Inhibitors. J Med Chem 65, 58–83. [DOI] [PubMed] [Google Scholar]
- Miller VA, Hirsh V, Cadranel J, Chen Y-M, Park K, Kim S-W, Zhou C, Su W-C, Wang M, and Sun Y (2012). Afatinib versus placebo for patients with advanced, metastatic non-small-cell lung cancer after failure of erlotinib, gefitinib, or both, and one or two lines of chemotherapy (LUX-Lung 1): a phase 2b/3 randomised trial. The lancet oncology 13, 528–538. [DOI] [PubMed] [Google Scholar]
- Niphakis MJ, Cognetta AB 3rd, Chang JW, Buczynski MW, Parsons LH, Byrne F, Burston JJ, Chapman V, and Cravatt BF (2013). Evaluation of NHS carbamates as a potent and selective class of endocannabinoid hydrolase inhibitors. ACS Chem Neurosci 4, 1322–1332. [DOI] [PMC free article] [PubMed] [Google Scholar]
- Niphakis MJ, and Cravatt BF (2014). Enzyme inhibitor discovery by activity-based protein profiling. Annu Rev Biochem 83, 341–377. [DOI] [PubMed] [Google Scholar]
- Niphakis MJ, Johnson DS, Ballard TE, Stiff C, and Cravatt BF (2012). O-hydroxyacetamide carbamates as a highly potent and selective class of endocannabinoid hydrolase inhibitors. ACS Chem Neurosci 3, 418–426. [DOI] [PMC free article] [PubMed] [Google Scholar]
- Pan C, Cai R, Quacquarelli FP, Ghasemigharagoz A, Lourbopoulos A, Matryba P, Plesnila N, Dichgans M, Hellal F, and Erturk A (2016). Shrinkage-mediated imaging of entire organs and organisms using uDISCO. Nat Methods 13, 859–867. [DOI] [PubMed] [Google Scholar]
- Pancholi K (2012). A review of imaging methods for measuring drug release at nanometre scale: a case for drug delivery systems. Expert Opin Drug Deliv 9, 203–218. [DOI] [PubMed] [Google Scholar]
- Park YG, Sohn CH, Chen R, McCue M, Yun DH, Drummond GT, Ku T, Evans NB, Oak HC, Trieu W, et al. (2018). Protection of tissue physicochemical properties using polyfunctional crosslinkers. Nat Biotechnol 37, 73–83. [DOI] [PMC free article] [PubMed] [Google Scholar]
- Parker CG, and Pratt MR (2020). Click Chemistry in Proteomic Investigations. Cell 180, 605–632. [DOI] [PMC free article] [PubMed] [Google Scholar]
- Perosa V, Priester A, Ziegler G, Cardenas-Blanco A, Dobisch L, Spallazzi M, Assmann A, Maass A, Speck O, Oltmer J, et al. (2020). Hippocampal vascular reserve associated with cognitive performance and hippocampal volume. Brain 143, 622–634. [DOI] [PMC free article] [PubMed] [Google Scholar]
- Pichler CM, Krysiak J, and Breinbauer R (2016). Target identification of covalently binding drugs by activity-based protein profiling (ABPP). Bioorg Med Chem 24, 3291–3303. [DOI] [PubMed] [Google Scholar]
- Porte K, Riberaud M, Chatre R, Audisio D, Papot S, and Taran F (2021). Bioorthogonal Reactions in Animals. Chembiochem 21, 100–113. [DOI] [PubMed] [Google Scholar]
- Qi Y, Yu T, Xu J, Wan P, Ma Y, Zhu J, Li Y, Gong H, Luo Q, and Zhu D (2019). FDISCO: Advanced solvent-based clearing method for imaging whole organs. Science Advances 5, eaau8355. [DOI] [PMC free article] [PubMed] [Google Scholar]
- Renier N, Wu Z, Simon DJ, Yang J, Ariel P, and Tessier-Lavigne M (2014). iDISCO: a simple, rapid method to immunolabel large tissue samples for volume imaging. Cell 159, 896–910. [DOI] [PubMed] [Google Scholar]
- Rostovtsev VV, Green LG, Fokin VV, and Sharpless KB (2002). A stepwise huisgen cycloaddition process: copper (I) - catalyzed regioselective “ligation” of azides and terminal alkynes. Angew Chem Int Ed Engl 114, 2708–2711. [DOI] [PubMed] [Google Scholar]
- Schlosburg JE, Blankman JL, Long JZ, Nomura DK, Pan B, Kinsey SG, Nguyen PT, Ramesh D, Booker L, Burston JJ, et al. (2010). Chronic monoacylglycerol lipase blockade causes functional antagonism of the endocannabinoid system. Nat Neurosci 13, 1113–1119. [DOI] [PMC free article] [PubMed] [Google Scholar]
- Schmidt K, Bari B, Ralle M, Washington-Hughes C, Muchenditsi A, Maxey E, and Lutsenko S (2019). Localization of the locus coeruleus in the mouse brain. JoVE (Journal of Visualized Experiments), e58652. [DOI] [PMC free article] [PubMed] [Google Scholar]
- Scott DE, Bayly AR, Abell C, and Skidmore J (2016). Small molecules, big targets: drug discovery faces the protein-protein interaction challenge. Nat Rev Drug Discov 15, 533–550. [DOI] [PubMed] [Google Scholar]
- Singh J, Petter RC, Baillie TA, and Whitty A (2011). The resurgence of covalent drugs. Nat Rev Drug Discov 10, 307–317. [DOI] [PubMed] [Google Scholar]
- Speers AE, Adam GC, and Cravatt BF (2003). Activity-Based Protein Profiling in Vivo Using a Copper(I)-Catalyzed Azide-Alkyne [3 + 2] Cycloaddition. J Am Chem Soc 125, 4686–4687. [DOI] [PubMed] [Google Scholar]
- Sylwestrak EL, Rajasethupathy P, Wright MA, Jaffe A, and Deisseroth K (2016). Multiplexed Intact-Tissue Transcriptional Analysis at Cellular Resolution. Cell 164, 792–804. [DOI] [PMC free article] [PubMed] [Google Scholar]
- Tainaka K, Murakami TC, Susaki EA, Shimizu C, Saito R, Takahashi K, Hayashi-Takagi A, Sekiya H, Arima Y, Nojima S, et al. (2018). Chemical Landscape for Tissue Clearing Based on Hydrophilic Reagents. Cell Rep 24, 2196–2210 e2199. [DOI] [PubMed] [Google Scholar]
- Ueda HR, Erturk A, Chung K, Gradinaru V, Chedotal A, Tomancak P, and Keller PJ (2020). Tissue clearing and its applications in neuroscience. Nat Rev Neurosci 21, 61–79. [DOI] [PMC free article] [PubMed] [Google Scholar]
- Van Esbroeck AC, Janssen AP, Cognetta AB, Ogasawara D, Shpak G, Van Der Kroeg M, Kantae V, Baggelaar MP, De Vrij FM, and Deng H (2017). Activity-based protein profiling reveals off-target proteins of the FAAH inhibitor BIA 10-2474. Science 356, 1084–1087. [DOI] [PMC free article] [PubMed] [Google Scholar]
- Vita ED (2020). 10 years into the resurgence of covalent drugs. Future Medicinal Chemistry 13. [DOI] [PMC free article] [PubMed] [Google Scholar]
- Wang W, Hong S, Tran A, Jiang H, Triano R, Liu Y, Chen X, and Wu P (2011). Sulfated ligands for the copper(I)-catalyzed azide-alkyne cycloaddition. Chem Asian J 6, 2796–2802. [DOI] [PMC free article] [PubMed] [Google Scholar]
- Wang X, Allen WE, Wright MA, Sylwestrak EL, Samusik N, Vesuna S, Evans K, Liu C, Ramakrishnan C, Liu J, et al. (2018). Three-dimensional intact-tissue sequencing of single-cell transcriptional states. Science 361. [DOI] [PMC free article] [PubMed] [Google Scholar]
- Yang B, Wu H, Schnier PD, Liu Y, Liu J, Wang N, DeGrado WF, and Wang L (2018). Proximity-enhanced SuFEx chemical cross-linker for specific and multitargeting cross-linking mass spectrometry. Proc Natl Acad Sci U S A 115, 11162–11167. [DOI] [PMC free article] [PubMed] [Google Scholar]
- Zheng Q, Woehl JL, Kitamura S, Santos-Martins D, Smedley CJ, Li G, Forli S, Moses JE, Wolan DW, and Sharpless KB (2019). SuFEx-enabled, agnostic discovery of covalent inhibitors of human neutrophil elastase. Proc Natl Acad Sci U S A 116, 18808–18814. [DOI] [PMC free article] [PubMed] [Google Scholar]
Associated Data
This section collects any data citations, data availability statements, or supplementary materials included in this article.
Supplementary Materials
Figure S6. PF7845 dose and time-dependent binding profile characterizations, related to Figure 6.
(A-B) Forebrain to blood ratio (A) and forebrain to brainstem ratio (B) at peak parental drug time point in forebrain (4 h for PF7845/PF7845-yne, 1 h for MJN110/MJN110-yne). No significant difference found between parental drug and the alkyne drug. N = 3 mice for each condition (Two-tailed unpaired t test).
(C) Quantitative PK analysis for PF7845 and PF7845-yne in blood, forebrain and brainstem. PF7845-yne shows lower in vivo concentration in blood and tissue. N = 3 mice for each condition, error bar indicates SD.
(D) Quantitative PK analysis for MJN110 and MJN110-yne in blood, forebrain and brainstem. MJN110-yne shows higher in vivo concentration in blood and tissue. N = 3 mice for each condition, error bar indicates SD.
(E-F) In gel CC-ABPP characterization of PF7845-yne binding in brain (E) and liver (F) membrane proteomes at ascending doses (4 h, i.p.).
(G) Zoomed-out views of PF7845 blocking at indicated dose followed by PF7845-yne injection (1 mg/kg, 1 h, i.p.) in hippocampus and cortex. Scale bar, 500 μm.
(H-J) Quantification of fluorescence intensity upon dose-dependent PF7845 blocking in S1 (H), CA1 (I) and DG (J). Signal normalized to the mean intensity of samples without blocking. N = 3 mice for each condition, two field of views from each mouse (One-way ANOVA, Tukey multiple comparisons test).
(K) Quantification of fluorescence intensity in figure 6B upon dose dependent PF7845 blocking in DG. Signal normalized to the mean intensity of samples blocked by 0.01 mg/kg PF7845. N = 3 mice for each condition, two field of views from each mouse (One-way ANOVA, Tukey multiple comparisons test).
(L) Zoomed-in views from samples blocked by 0.01 and 0.02 mg/kg PF7845. Samples were co-stained with lectin to visualize blood vessels. Images represent DG. 0.02 mg/kg blocked images were enhanced for better visualization. Dashed line indicates low drug binding regions. Scale bar, 40 μm.
(M) Quantification of fluorescence intensity in hippocampus DG at different distance to the nearest blood vessel. Intensity normalized to pixels within 15-20 μm to blood vessel. N = 3 mice for each condition. Error bar indicates SD (One-way ANOVA in each dose).
(N) Quantification of fluorescence intensity in figure 6H of drug binding in DG. Signal normalized to the mean intensity of vehicle control. N = 5 mice for each condition (One-way ANOVA, Tukey multiple comparisons test).
(O) PF7845-yne co-staining with lectin to visualize blood vessels. Images represent DG. Dashed line indicates high drug binding regions. Scale bar, 40 μm.
(P) Quantification of fluorescence intensity in hippocampus DG at different distance to the nearest blood vessel. Intensity normalized to pixels within 5 μm to blood vessel. N = 3 mice for each condition. Error bar indicates SD (One-way ANOVA in each dose).
(Q) Zoomed-out views of PF7845 blocking for indicated time followed by PF7845-yne injection (1 mg/kg, 1 h, i.p.) in hippocampus and cortex. Scale bar, 500 μm. (R-T) Quantification of fluorescence intensity of upon time-dependent PF7845 blocking in S1 (P), CA1 (Q) and DG (R). Signal normalized to the mean intensity of samples with 1 h blocking. N = 3 mice for each condition, two field of views from each mouse (One-way ANOVA, Tukey multiple comparisons test).
Data points represent mean ± SD. ns: not significant; **P<0.01; ****P<0.0001.
Figure S4. Brain wide drug binding cell type identification, related to Figure 4.
(A-B) PF7845-yne (5 mg/kg, 4 h, i.p.), BIA10-2474-yne (5 mg/kg, 4 h, i.p.) and pargyline-yne (20 mg/kg, 4 h, i.p.) binding co-stained with NeuN for neuron (A) and lectin for blood vessel (B) in various brain regions. Images represent M1, Pir, IG, hippocampal CA1, VPM, hypothalamus and V1. Scale bar, 10 μm.
(C) PF7845-yne binding co-stained with GFAP for astrocyte, parvalbumin (PV) and somatostatin (SST) for inhibitory interneurons and Ctip2 for excitatory projection neurons. Images represent S1. Scale bar, 10 μm.
(D) Quantification of marker positive cell overlap with PF7845-yne positive cell. No overlap found for GFAP, PV and SST. 87.0 ± 2.1% (mean ± sd) projection neurons have PF7845-yne binding. N = 3 mice for each condition.
(E) PF7845-yne binding in VGAT-Ai14 mice. VGAT-Ai14 mice express TdTomato in VGAT positive inhibitory neurons. Images represent S1. Scale bar, 10 μm.
(F) Quantification of VGAT positive inhibitory neurons overlap with PF7845-yne positive cell. No inhibitory neurons found to have PF7845-yne binding. N = 3 mice for each condition.
(G) Pargyline-yne binding co-stained with parvalbumin (PV) and somatostatin (SST) for inhibitory interneurons. Images represent hypothalamus. Scale bar, 10 μm.
(H) Quantification of marker positive cell overlap with pargyline-yne positive cell. No overlap found for PV and SST. N = 3 mice for each condition.
(I) pargyline-yne binding in VGAT-Ai14 mice. Images represent S1. Scale bar, 10 μm.
(J) Quantification of VGAT positive inhibitory neurons overlap with pargyline-yne positive neurons. 82.8 ± 4.5% (mean ± sd) pargyline-yne positive neurons are inhibitory. N = 3 mice for each condition.
(K-L) In situ expression profile of TH (K) and MAO-A (L) from Allen Brain Atlas. High TH expression can be found in ventral tegmental area (VTA) and substantial nigra (SNr), representing dopaminergic neuron in the region. Sparse TH and MAO-A expression can be found in LC, representing NA neurons in the pons.
(M) Zoomed-out sagittal view for figure 4E showing high TH expression in dopaminergic neurons in VTA and SNr, together with registered pargyline-yne positive cells in LC representing NA neurons. Scale bar, 500 μm.
Figure S5. MJN110-yne mapping validation in different subcellular compartments, related to Figure 5.
(A) Chemical structures of MJN110 and MJN110-yne.
(B) Pretreatment by parental non-alkyne MJN110 (5 mg/kg, 4 h, i.p.) prior to MJN110-yne injection (5 mg/kg, 4 h, i.p.). MAGL engagement is marked by presynaptic marker synapsin. Synapsin overlapping signal is absent in MJN110 pretreatment samples. Scale bar, 10 μm.
(C) MJN110-yne (5 mg/kg, 4 h, i.p.) mapping validation in MAGL−/− mice. Absence of MAGL abolishes MJN110-yne binding at presynaptic site. Scale bar, 10 μm.
(D) High resolution imaging of CA3 presynaptic terminals and CA1 soma. Zoomed-in of MAP2 and synapsin positive pixels are highlighted in box. Scale bar, 10 μm.
(E) Quantification of ratios between soma and presynaptic terminal fluorescence intensities. Ratios were calculated based on the mean 1 mg/kg local presynaptic terminal intensities. N = 3 mice for each group; two fields of view generated from each mouse (Two-tailed unpaired Mann-Whitney test).
(F) MJN110-yne (20 mg/kg, 4 h, i.p.) labeling after pretreatment with PF7845 (1 mg/kg, 4 h, i.p.) to block FAAH. Figures showing CA3 synapse and CA1 soma with zoom-ins for synapsin and MAP2 positive pixels.
(G) Quantification of ratios between CA3 presynaptic terminal and CA1 soma intensities. Ratios were calculated based on the mean intensity of no pretreatment samples in each region. N = 3 mice for each group, three fields of view generated from each mouse (Two-tailed unpaired Mann-Whitney test).
Data points represent mean ± SD. ns: not significant; **P<0.01; ****P<0.0001.
Figure S2. Brain wide CATCH specificity validation, related to Figure 2.
(A) Full coronal views with zoomed-in views of PF7845-yne (1 mg/kg, 4 h, i.p.) binding. For pretreatment test, the non-alkyne PF7845 (1 mg/kg, 4 h, i.p.) was injected prior to PF7845-yne (1 mg/kg, 4 h, i.p.) to block target engagement. Zoomed-in images represent S1, cingulate cortex (Cg), BLA, V1. Scale bar, 100 μm.
(B) Full coronal views with zoomed-in views of PF7845-yne (1 mg/kg, 4 h, i.p.) binding in both wildtype and FAAH−/− mice. Zoomed-in images represent S1, Cg, BLA and V1. No alkyne drug labeling observed in FAAH−/− mice. Scale bar, 100 μm.
(C) Quantification of fluorescence intensity across different brains regions in FAAH−/− test. Intensity is normalized to the vehicle samples in each region. No significant difference between vehicle and FAAH−/− mice. N = 3 mice for each condition, two field of views generated from each mouse (Two-way ANOVA, Tukey multiple comparisons test).
(D) 3D rendering of PF7845-yne mapping in S1 of 500-micron CLARITY sections. Scale bar, 50 μm.
(E) Quantification of drug labeling intensity and ratio of signal to background as a function of depth in tissue. Intensity normalized to average of surface intensity. Three tissue blocks included in the analysis, error bar indicates SD.
Data points represent mean ± SD. ns: not significant; ****P<0.0001.
Figure S3. Brain-wide drug binding mapping, related to Figure 3.
(A) Chemical structures of BIA10-2474, pargyline and their alkyne analogs.
(B) Sagittal view of MAO-A expression with PF7845-yne (1 mg/kg, 4 h, i.p.), and pargyline-yne (20 mg/kg, 4 h, i.p.) drug mapping. Pargyline-yne binding in the pons and hypothalamus were highlighted with zoomed-in views. Pargyline-yne labeling in pons is correlated with high MAO-A expression, whereas its binding in the hypothalamus may primarily reflect MAO-B inhibition. Scale bar, 1 mm.
(C-D) Quantification of pixel wise FAAH immunostaining intensity with pargyline-yne (C), and PF7845-yne (D) labeling intensity. Simple linear regression with R squared values quantified.
(E) BIA10-2474-yne (5 mg/kg, 4 h, i.p.) binding in both wild type mice and FAAH−/− mice. Note in CA1 and S1, the absence of target enzyme FAAH abolished both PF7845-yne (5 mg/kg, 4 h, i.p.) and BIA10-2474-yne binding. Scale bar, 500 μm. 5m/kg dosing was used for both drugs to maximize the contrast of target visualization.
(F) Full coronal sections at Bregma −4.4 with zoomed-in views at periaqueductal gray (PAG) and reticulotegmental nucleus of the pons (RtTg). BIA10-2474-yne (5 mg/kg, 4 h, i.p.) binds to large cellular structures in wildtype, but not FAAH−/− mice PAG, suggesting primarily on target binding in PAG. Cellular structures can be found in RtTg in FAAH−/− mice treated with BIA10-2474-yne, indicating off target binding. Image brightness/contrast is optimized for each brain region for better visualization. Scale bar, 100 μm.
Figure S1. Development of CATCH to image small molecule drug binding, related to Figure 1.
(A) Chemical structures of PF7845 and PF7845-yne.
(B) Direct click reaction in conventional histology paraformaldehyde (PFA) fixed samples (PF7845-yne, 1 mg/kg, 4 h, i.p.) under identical click reaction conditions in CC-ABPP. Images represent S1. Scale bar, 20 μm.
(C) Chemical structures of click reaction ligands used in the study. The first generation click reaction ligand TBTA has relatively poor solubility and requires use of high Cu concentration for efficient labeling. Second generation ligand THPTA and newer generation ligands BTTP, BTTAA all featured improved solubility, and allowed substantial lower Cu usage while maintaining high labeling efficiency.
(D) Fluorescence intensity of click reaction with ascending Cu2+ concentration. Intensity normalized to vehicle 50 μM. Four tissue blocks for each condition, two fields of views from each tissue block (Two-way ANOVA, Šidák’s multiple comparisons test).
(E) Click reaction with individual component removed. Only when all the components are present can the reaction proceed. Images represent S1. Scale bar, 20 μm.
(F) Fluorescence intensity in the absence of different click reaction components. Intensity normalized to the average intensity of vehicle full buffer sample. Two tissue blocks for each condition, two fields of views from each tissue block (Two-way ANOVA, Šidák’s multiple comparisons test).
(G) Zoomed-out view of PF7845-yne binding in hippocampus and cortex (1 mg/kg, 4 h) via intraperitoneal (i.p.), oral and subcutaneous (s.c.) delivery. Scale bar, 400 μm.
(H-I) Quantification of fluorescence intensity in S1 (H) and hippocampus CA1 (I). Intensity normalized to i.p. samples. N = 3 mice for each condition, two fields of views from each mouse (One-way ANOVA, Tukey multiple comparisons test).
(J) PF7845-yne in liver, lung and small intestine with FAAH immunostaining. Scale bar, 50 μm.
Data points represent mean ± SD. ns: not significant; **P<0.01; ****P<0.0001.
Data Availability Statement
Microscope data reported in this paper will be shared by the lead contact upon request.
This paper does not report original code.
Any additional information required to reanalyze the data reported in this paper is available from the lead contact upon request.