

Abstract
Objective
Accumulating evidence from invasive cortical stimulation mapping and noninvasive neuroimaging studies indicates that brain function may be preserved within brain tumors. However, a noninvasive approach to accurately and comprehensively delineate individual‐specific functional networks in the whole brain, especially in brain tissues within and surrounding tumors, is still lacking. The purpose of the study is to develop a clinically useful technique that can map functional regions within tumoral brains.
Methods
We developed an individual‐specific functional network parcellation approach using resting state functional magnetic resonance imaging (rsfMRI) that effectively captured functional networks within and nearby tumors in 20 patients. We examined the accuracy of the functional maps using invasive cortical stimulation and task response.
Results
We found that approximately 33.2% of the tumoral mass appeared to be functionally active and demonstrated robust functional connectivity with non‐tumoral brain regions. Functional networks nearby tumors were validated by invasive cortical stimulation mapping. Intratumoral sensorimotor networks mapped by our technique could be distinguished by their distinct cortico‐cerebellar connectivity patterns and were consistent with hand movement evoked fMRI task activations. Furthermore, in some patients, cognitive networks that were detected in the tumor mass showed long‐distance and distributed functional connectivity.
Interpretation
Our noninvasive approach to mapping individual‐specific functional networks using rsfMRI represents a promising new tool for identifying regions with preserved functional connectivity within and surrounding brain tumors, and could be used as a complement to presurgical planning for patients undergoing tumor resection surgery. ANN NEUROL 2022;91:353–366
Brain tumors can invade or enclose healthy brain tissues. Recent evidence from invasive stimulation mapping and noninvasive functional neuroimaging studies suggests that functionally intact regions may be preserved within the invading tumors. 1 , 2 The intermixed cellularity of brain tumors with non‐neuronal tumor cells, neurons and neuronal supporting cell populations raises the possibility that function may be retained intratumorally. 3 Accurate identification and comprehensive delineation of intratumoral functional regions in individual patients’ brains may facilitate presurgical planning by balancing the need for maximal tumor resection while simultaneously preserving brain function. However, current functional mapping techniques are limited in either their mapping extent and/or their level of accuracy.
Direct cortical stimulation (DCS), the current “gold standard” for intraoperative functional mapping, can accurately map critical functional areas but has been somewhat limited to for use in the sensorimotor and language regions. 4 , 5 Cortical areas critical to cognition are often neglected simply due to the difficulty in assessing cognitive processes in the operating room, despite the fact that these areas subserve essential functions that are strongly tied to clinical outcomes. 6 Task‐evoked functional magnetic resonance imaging (fMRI) is routinely used during presurgical planning to localize critical functional areas near and within tumors. 7 However, it often suffers from low reliability 8 and requires active patient participation, which can be challenging for children or patients with severe cognitive impairments.
Resting‐state fMRI (rsfMRI) represents a promising tool for mapping functional networks in patients with brain tumors because data can be acquired without patients performing any specific tasks. At the population‐level, parcellating large‐scale cortical functional networks using rsfMRI can reveal the general principle of functional brain organization. 9 , 10 However, due to substantial intersubject differences, 11 , 12 the cortical networks mapped at the population‐level lack the precision needed to be useful in the individual. Emerging rsfMRI‐based analytical approaches, such as embodied by our novel individual‐specific functional network parcellation method, can reveal the presence of unique but subtle subnetworks and have been shown to outperform task‐based fMRI activations in capturing DCS positive sites in sensorimotor areas. 13 , 14 , 15 To date, these individual‐specific functional mapping techniques have largely focused on healthy brains and relied on reconstructed cortical surfaces. In the tumoral brain, healthy tissue and functionally preserved areas might be displaced or damaged with progression of the invading tumor. 16 , 17 Due to the effects of tumoral mass changes over time on the arrangement of surrounding brain tissues, cortical surface reconstruction becomes arduous, and results may be inaccurate. 18 Thus, development of a more precise and accurate rsfMRI‐based individual functional mapping method for tumor patients is urgently needed.
Here, we developed a whole‐brain, volumetric functional network parcellation approach for tumoral brains using rsfMRI and applied this method to 20 patients with de novo tumors before surgery. The accuracy of our mapping approach can be partially validated by invasive DCS and task response. Our approach is novel in that individual‐specific functional networks across the whole cerebral cortex can be identified, including areas within and nearby tumors. This technology has potential clinical utility for improving presurgical planning and achieving better clinical outcomes.
Methods
Participants
Our sample consisted of 20 patients with brain tumors located in the frontal, temporal, and parietal lobes (18 patients with gliomas, 1 patient with extraventricular neurocytoma, and 1 patient with hemangiopericytoma; 13 men and 7 women; mean age is 35.4 ± 12.8 years). Demographic and clinical characteristics of the patient sample are shown in the Table 1. All patients met the following inclusion criteria: (1) right‐handedness, (2) patients with newly diagnosed tumors, and (3) a clinical need for an MRI scan. Exclusion criteria were: (1) prior brain tumor surgery, (2) any contraindication for MRI scanning, and (3) history of psychiatric or neurological disorders. According to the 2021 World Health Organization (WHO) classification, 19 histology of these lesions included low‐grade (WHO grade I/II, n = 14) and high‐grade (WHO grade III/IV, n = 4) cases. This study was approved by the institutional review board of Tiantan Hospital, Capital Medical University, and written informed consent was obtained from each participant.
TABLE 1.
Patient Demographic and Clinical Data
| Patient | Gender | Age, yr | WHO grade | Tumor location | Tumor histology | IDH | 1p/19q |
|---|---|---|---|---|---|---|---|
| PA01 | M | 45 | 3 | Frontal, L | Astrocytoma | Mutant | Non‐codel |
| PA02 | F | 34 | 2 | Frontal, L | Astrocytoma | Mutant | Non‐codel |
| PA03 | M | 37 | 2 | Frontal, L | Astrocytoma | Mutant | Non‐codel |
| PA04 | M | 24 | 2 | Parietal, L | Extraventricular neurocytoma | / | / |
| PA05 | F | 41 | 2 | Parietal, L | Astrocytoma | Mutant | Non‐codel |
| PA06 | M | 18 | 2 | Temporal, L | Astrocytoma | Mutant | Non‐codel |
| PA07 | M | 21 | 3 | Temporal, L | Astrocytoma | Mutant | Non‐codel |
| PA08 | F | 69 | 2 | Frontal, L | Oligodendroglioma | Mutant | Codel |
| PA09 | M | 39 | 2 | Frontal, R | Astrocytoma | Mutant | Non‐codel |
| PA10 | M | 12 | 2 | Parietal, R | Astrocytoma | Mutant | Non‐codel |
| PA11 | F | 35 | 2 | Frontal, R | Hemangiopericytoma | / | / |
| PA12 | F | 48 | 3 | Frontal, R | Astrocytoma | Mutant | Non‐codel |
| PA13 | M | 27 | 2 | Frontal, R | Astrocytoma | Mutant | Non‐codel |
| PA14 | M | 40 | 2 | Parietal, R | Oligodendroglioma | Mutant | Codel |
| PA15 | M | 48 | 2 | Temporal, R | Oligodendroglioma | Mutant | Codel |
| PA16 | F | 40 | 2 | Frontal, R | Oligodendroglioma | Mutant | Codel |
| PA17 | F | 23 | 2 | Frontal, R | Astrocytoma | Mutant | Non‐codel |
| PA18 | M | 36 | 2 | Frontal, R | Astrocytoma | Mutant | Non‐codel |
| PA19 | M | 40 | 2 | Frontal, R | Astrocytoma | Mutant | Non‐codel |
| PA20 | M | 30 | 3 | Parietal, R | Astrocytoma | Mutant | Non‐codel |
codel = codeletion of chromosome arms 1p and 19q; F = female; IDH = isocitrate dehydrogenase; L = left hemisphere; M = male; R = right hemisphere; WHO = World Health Organization.
Data Collection
Structural and fMRI were collected using a 3 Tesla Siemens TimTrio scanner equipped with a 32‐channel head coil. Structural images were obtained using an MP‐RAGE 3D T1‐weighted sequence (TR = 2,530 ms; TE = 3.37 ms; flip angle = 7°; 1.0 mm isotropic voxels; FOV = 256 × 256) and a T2‐weighted sequence (TR = 5,800 ms; TE = 117 ms; flip angle = 90 degrees; 0.5 × 0.5 × 6.0 mm3 voxels; FOV = 240 × 240). The fMRI data were acquired using an echo planar imaging (EPI) pulse sequence (TR = 2000 ms; TE = 30 ms; flip angle = 90 degrees; 3.44 × 3.44 × 3.750 mm3 voxels, matrix size = 64 × 64, 33 slices fully covering whole brain). Each patient underwent an 8‐minute resting‐state scan wherein the patient was instructed to stay awake and keep their eyes open. In addition to the resting‐state scan, two hand motor task fMRI runs were acquired for each patient; one run was acquired for the left hand and one run was acquired for the right hand. Each 2‐minute run consisted of two 30‐second motor task blocks interleaved with three 20‐second rest intervals. Patients performed hand movement tasks according to instructions displayed on the computer screen.
Data Preprocessing
All structural MRI data were processed using FreeSurfer version 5.3.0 (http://surfer.nmr.mgh.harvard.edu). Functional data were preprocessed using the pipeline described in previous studies, 20 , 21 which includes: (1) slice timing correction (SPM12 software, Wellcome Department of Cognitive Neurology), (2) rigid‐body correction for head motion using FSL package, 22 (3) normalization for global mean signal intensity across runs, (4) band‐pass temporal filtering (0.01–0.08 Hz), and (5) regression of 6 motion parameters, whole‐brain signal, and ventricular and white‐matter signals. Task activations were estimated using a conventional general linear model (GLM) with FSL's FEAT (https://fsl.fmrib.ox.ac.uk/fsl/fslwiki/FEAT).
Direct Cortical Stimulation Mapping during Awake Craniotomy
The DCS was performed to identify the hand sensorimotor areas in 15 patients. 23 Trains of 60‐Hz biphasic pulses were delivered via electrodes using an Ojemann Cortical Stimulator (Integra Life, Plainsboro, NJ, USA) during awake craniotomy (square wave with a pulse width of 1 second). Stimulation commenced with an intensity of 1 mA and was gradually increased with a step of 0.5 mA. Delivery of DCS terminated when involuntary hand movements were induced according to the 2/3 principle 24 or the stimulation intensity reached 6 mA. The DCS‐positive sites were noted using fiducial markers with a diameter of 5 mm and then registered to the subject's T1‐weighted MRI.
Tumor Segmentation
Brain tumors were manually segmented by consensus reading (2 board‐certified neuroradiologists) of T2‐weighted images using MRIcroN version 1.0 (https://www.nitrc.org/projects/mricron). As described in our previous study, 25 areas containing abnormal hyperintense signals on the T2‐weighted images were identified as tumors. A senior neuroradiologist then re‐evaluated the lesion and demarcated the tumor boundaries.
Population‐Level Volumetric Functional Atlas
A volumetric functional atlas consisting of 17 networks was estimated using data of 1,000 healthy subjects described in previous studies. 9 , 26 In the original atlas, hand and foot sensorimotor areas were not distinguished. Here we separated these 2 functional regions. The volumetric atlas consisting of 18 networks served as an initial iteration for our individual parcellation procedure.
Individual‐Level Network Parcellation in the Lesioned Brain
Hemispheric lesions resulting from brain tumors may disrupt surface reconstruction. To address this issue, we proposed an iterative individual parcellation approach (see Fig 1) based on our previous method 15 :
FIGURE 1.

The schematic diagram of an individualized functional network parcellation approach for patients with tumors. The network parcellation strategy includes the following 5 steps: (1) a group‐level network atlas consisting of 18 functional networks in the contralesional hemisphere is registered onto the patient’s anatomic brain image using a nonlinear registration. The patient’s BOLD signals were averaged across voxels within each functional network and used as the “reference signal” for the subsequent step. (2) An iterative algorithm was used to reassign each voxel in the contralesional hemisphere to 1 of the 18 functional networks according to the maximal correlation values to the reference signals generated from the previous step. (3) In the lesional hemisphere, the BOLD signal of each voxel is correlated to the 18 reference signals of the contralesional hemisphere and the “tumor network” signal. These voxels are assigned to the 19 networks (18 functional networks and the tumor network) according to the maximum of the correlation value. (4) The same iterative process as in step (2) is used to parcellate the lesional hemisphere into 19 networks. (5) To combine the results from both hemispheres, each voxel is reassigned to the 19 networks according to the maximum correlation between the time course of the voxel and the reference signals averaged from the 2 hemispheres.
1. Initialization: For each patient, the volumetric population‐level functional atlas was projected onto the patient's contralesional hemisphere using a nonlinear registration and used for the initial parcellation. The patient's fMRI signals were averaged across voxels within each functional network and used as the “reference signal” for the subsequent reassignment step.
2. Mapping individualized functional networks in the contralesional hemisphere: Each voxel was reassigned to 1 of the 18 functional networks according to the maximal correlation values to the 18 reference signals generated from the previous step. A confidence value was set as the ratio between the largest and the second largest correlation values. Functional individualization using an iterative process, described in our previous report, 15 was then performed in order to reassign all voxels in the gray matter area to 1 of the 18 functional networks. Then, a temporary individualized parcellation for the contralesional hemisphere was obtained until the procedure reached a preselected number of iterations.
3. Functional mapping of the lesional hemisphere: We constructed new reference signals, including reference signals of the 18 canonical networks in the contralesional hemisphere from step 2, and a reference signal of the tumor network derived from the average signal of a seed region of interest (ROI) placed in the tumor area. The BOLD signal of each voxel in the lesional hemisphere was correlated to these 19 new reference signals. According to the maximum of Pearson's correlation coefficients, each voxel was assigned to 1 of the 19 networks. For example, if a voxel had a stronger correlation with the reference signal of the tumor network compared to other networks, it would be reassigned to the tumor network. The tumor network is not a functional network but rather brain regions spatially restricted by the tumor that showed temporally correlated BOLD signals that differed from the 18 canonical networks. The time courses of the voxels within each network were averaged and used as the new reference signal for the next step.
4. Functional individualization of the lesional hemisphere: The same optimization procedure as detailed in step 2 was conducted in the lesional hemisphere for parcellation of the 19 networks, which ended when the iteration reached a predetermined number. We then obtained the temporary functional parcellation for the lesional hemisphere.
5. Combining 2 hemispheres: The reference signals for the whole brain were generated by averaging the reference signals in step 2 for the contralesional hemisphere and the reference signals in step 4 for the lesional hemisphere. Next, the BOLD signal for each voxel from the whole brain was correlated with the new reference signals. The maximal correlation value was used to determine the final network assignment of each voxel.
Statistical Analysis
We compared WHO low‐grade (N = 14) and high‐grade (N = 4) tumors in terms of the ratio between functional tissues and the tumor volume. Two‐sided Wilcoxon rank‐sum test was used for the comparison (https://www.mathworks.com/help/stats/ranksum.html). We also examined differences in gender and age between these 2 groups using chi‐square and 2‐sided Wilcoxon rank‐sum tests, respectively. In addition, Pearson's correlations between the ratios of intratumoral functional regions and tumor volumes were calculated (https://www.mathworks.com/help/stats/corr.html). A voxel‐based Dice coefficient was used to evaluate the similarity between seed‐based functional connectivity maps. Permutation tests (1,000 permutations) were performed to examine whether functional connectivity maps derived from a pair of adjacent seeds in 2 functional networks were more distinct from each other than maps derived from 2 randomly selected seeds in the tumor network. Note that the Euclidean distance between the randomly selected tumor seeds was kept identical to the distance between the seeds in functional networks. Two‐sided Wilcoxon signed‐rank tests were conducted to examine the difference in cortico‐cortical and cortico‐cerebellar sensorimotor functional connectivity values between groups. In addition, a 2‐sided Wilcoxon rank‐sum test was used to examine the existence of functional connectivity between the seeds in intratumoral network and sensorimotor regions in contralateral cerebral cortex or cerebellum.
Results
Mapping Individual‐Specific Functional Networks in Tumor Patients
We parcellated the cerebral cortices of 20 patients with brain tumors into 18 large‐scale functional networks and an additional “tumor network,” for a total of 19 networks (Fig 2A). Overall, tumor networks fell within the anatomic boundaries demarcating the tumors in the T1‐weighted images, often showing a high degree of overlap (see Fig 2A, see PA03, PA10, and PA12 for examples). However, in some patients, tumor networks only encompassed a circumscribed area within the tumoral margins in the T1‐weighted image, wherein functionally preserved networks were also detected (see PA05 in Fig 2A).
FIGURE 2.

Individual parcellation delineates individual‐specific functional networks and the tumor network. (A) Eighteen large‐scale functional networks and one additional tumor network were mapped in each of the 20 tumoral brains using the individual‐specific functional parcellation method. The individual parcellation of four representative patients, PA03, PA10, PA05, and PA12, are displayed. For each patient, the T2‐weighted images (upper panels), the T1‐weighted images (middle panels), and the individual‐specific networks (bottom panels) overlaid onto the T1‐weighted images are shown. The red arrows depict the location of the tumor in the T2‐ and T1‐weighted images. The tumor network is indicated by a gray color and the other 18 functional networks are color‐coded with the same colors and naming conventions as reported in our previous study. 20 (B) Histogram shows the distribution of the percentage of intratumoral functional regions in patients with tumors. Half of the patients with tumors have a high proportion of functional regions within tumors. (C) The ratio of intratumoral functional regions in tumor mass is unrelated to tumor volume (r = −0.10, p = 0.66).
To evaluate the mismatch between the functional and anatomic boundaries, we calculated the Ratio of the Intratumoral Functional Regions to tumor volume (RIFR) across the 20 patients. The RIFR was 33.2% ± 26.9% (mean ± SD). In a small subset of patients (N = 5), more than 50% of the tumoral mass was detected as intratumoral functional regions (Fig 2B). In 10 patients, the ratio was greater than 25% of the tumoral mass. No significant correlation was found between RIFR to tumor volume (Pearson's correlation, r = −0.10, p = 0.66; Fig 2C). Moreover, patients with low‐grade gliomas showed a significantly greater RIFR (RIFR = 40.3% ± 27.9%; N = 14) than those patients with high‐grade gliomas (RIFR = 8.5% ± 6.0%; N = 4; two‐sided Wilcoxon rank‐sum test, p = 0.025), whereas no significant difference in gender (chi‐square test, p = 0.69, χ2 = 0.16) or age (2‐sided Wilcoxon rank‐sum test, p = 0.74) was found in these 2 groups.
To examine the accuracy of the tumor network and functional networks mapped in each patient, we placed 2 pairs of seeds adjacent to the boundary of the tumor network (Figs 3A, 3C). For each pair of seeds, one seed was placed within a functional network that was located outside the tumor network, and the other seed was placed in close proximity but within the tumor network. A series of seed‐based functional connectivity analyses were performed and the resulting connectivity maps for 2 representative patients, PA12 (seeds A/B and C/D) and PA15 (seeds E/F and G/H), are shown in Figures 3B and 3D. For these 2 patients, one seed from each pair was placed in the ventral attention network (vATN) and the default mode network (DMN), whereas the other seed was placed in the tumor network. Despite adjacent locations of the paired seeds, their connectivity patterns were significantly different (Pair A/B: Dice coefficient = 18.01%, permutation test, p < 0.001 and z‐score = −5.09; Pair C/D: Dice coefficient = 21.21%, p = 0.010 and z‐score = −2.38; Pair E/F: Dice coefficient = 16.04%, p < 0.001 and z‐score = −2.94; Pair G/H: Dice coefficient = 14.79%, p = 0.025 and z‐score = −2.00; see Methods). For seeds placed in functional regions, distributed patterns of connectivity were observed that spanned widespread regions of the brain and included long‐distance connections in the corresponding networks. In contrast, seeds placed in the tumor network only showed local patterns of connectivity that were restricted predominantly to the tumor (see Figs 3B, 3D). These distinct connectivity patterns illustrate that our approach can successfully differentiate regions that have residual function and interact with remote brain areas and regions that lack functional activity within tumors.
FIGURE 3.

Adjacent seeds within and nearby tumor networks show distinct functional connectivity patterns. In 2 representative patients, PA12 and PA15, tumors and functional networks surrounding the tumors are highlighted. The anatomic boundaries of the tumors are demarcated by the blue lines. (A) Two pairs of seeds (pair A/B and C/D) are placed adjacent to the boundary of the tumor network in PA12. For each pair, one seed is placed in a functional network (seeds B and D) and another seed is placed nearby but within the tumor network (seeds A and C). (B) Seeds B and D demonstrate distributed connectivity corresponding to vATN and DMN, whereas seeds A and C show mostly local connectivity constrained within the tumor. (C) In the other patient with a tumor (PA15), 2 pairs of seeds (pair E/F and G/H) are placed within (seeds E and G) and nearby (seeds F and H) the tumor networks. (D) Similar to PA12, each pair of seeds shows distinct connectivity patterns. DMN = default mode network; FC = functional connectivity; vATN = ventral attention network.
Individual Sensorimotor Network Can Be Validated by Invasive Cortical Simulation
To further validate the individualized functional networks derived from our parcellation method, we compared the sensorimotor networks mapped by our approach with the hand sensorimotor regions localized by DCS. Preoperative functional localization using DCS, the current “gold standard” in clinical practice, was performed in 15 out of 20 patients. The hand motor networks mapped by our rsfMRI approach corresponded to the hand sensorimotor region localized by DCS in 100% of patients (15/15 patients; Fig 4). The high concordance between hand sensorimotor maps derived using the functional parcellation approach and those captured using DCS suggests the sensitivity of our method for identifying functional networks in individual subjects.
FIGURE 4.

Sensorimotor networks mapped by our approach is partially validated by invasive cortical stimulation. For each patient, the hand sensorimotor network was mapped by our individualized parcellation approach, with the confidence map (the ratio between the largest and the second largest correlation values to the reference signals of the 19 networks) indicated by warm colors. Blue dots indicate positive sites of DCS for the hand sensorimotor regions. In all 15 patients with DCS results, DCS positive sites fell within the hand motor networks mapped by our parcellation approach. DCS = direct cortical stimulation.
Patients With and Without Intratumoral Functional Regions Show Distinct Cortico‐Cerebellar Functional Connectivity Patterns
To further assess the degree to which functional networks neighboring the invading tumors had preserved connectivity, we examined the connectivity between functional regions and the cerebellum. We placed seeds adjacent to the boundary between the functional network and the tumor in one patient (see PA14 in Fig 5A), which had a tumor located in the parietal lobe. Seed A was placed in the hand sensorimotor network identified by our individual parcellation method, whereas seed B was placed adjacent to seed A but located in the patient's tumor network. The functional connectivity map for seed A showed strong connectivity with the contralateral cerebellar sensorimotor regions. Conversely, seed B, which was located in the tumor network, showed weak cortico‐cortical and cortico‐cerebellar connectivity with values significantly lower than for seed A in PA14 (2‐sided Wilcoxon signed‐rank test, p < 0.0001; Fig 5B). The above finding can be replicated in another patient (PA17, the 2‐sided Wilcoxon signed‐rank test, p < 0.0001). The observed disparity in cerebro‐cerebellar connectivity patterns for adjacent seeds placed within and outside the tumor network suggest that critical brain networks surrounding tumors may be functionally preserved in these patients.
FIGURE 5.

Cortical sensorimotor networks within or nearby the tumor show functional connectivity with the contralateral cerebellar sensorimotor regions. (A) In subject PA14, the hand sensorimotor network surrounds the tumor (blue lines). A pair of seeds was placed outside (seed A; top, left panel) and within the tumor (seed B; top, right panel). Seed A, located within the sensorimotor network shows strong functional connectivity with the contralateral cortical and cerebellar sensorimotor regions. In contrast, an adjacent seed, seed B shows local functional connectivity restricted within the tumoral margins and no significant cortico‐cerebellar connectivity. (B) The cortico‐cortical and cortico‐cerebellar functional connectivity of seed A is significantly higher than those of seed B for subject PA14 (Wilcoxon signed‐rank test, p < 0.0001). (C) The sensorimotor network falls within the anatomic boundary of the tumor in subject PA05 (top panel). A seed (seed C) placed in the intratumoral sensorimotor network shows significant functional connectivity with the cerebellar sensorimotor regions, suggesting that function might be retained in the sensorimotor regions within the tumor. (D) For PA05, seed C shows significant connectivity to contralateral cerebral and cerebellar sensorimotor regions (Wilcoxon rank‐sum test, p < 0.0001). FC = functional connectivity.
In some patients, sensorimotor networks fell within the anatomic boundaries of the tumor mass. To evaluate whether sensorimotor function remained intact in regions invaded by these gliomas, a seed was placed in the intratumoral hand sensorimotor network (see seed C in Fig 5C). We found that significant functional connectivity was still present in the hand sensorimotor regions of the contralateral cerebral cortex and cerebellum (2‐sided Wilcoxon rank‐sum test, p < 0.0001; Fig 5D). The presence of cortico‐cortical and cortico‐cerebellar functional connectivity indicates that motor function may be preserved in the sensorimotor regions invaded by tumors.
Intratumoral Sensorimotor Networks Were Consistent with Task Activations
To determine the extent to which sensorimotor networks identified nearby and within tumors were functionally significant, we compared the sensorimotor networks with the hand movement induced fMRI task activations. For PA14, the hand sensorimotor network nearby the tumor was activated when the patient performed a hand movement task (Fig 6A), whereas the tissue invaded by the tumor showed no task‐induced activations. Conversely, for PA05, with an identified intratumoral sensorimotor region (ISR), task activation was observed both inside and outside the tumor, and corresponded spatially with the sensorimotor network (Fig 6B). We statistically compared the task responses in ISR and tumor networks in totally 3 patients whose tumors included ISR. We found that task responses in ISR (β = 2.28 ± 1.50) were significantly higher than those in the tumor networks (β = 0.69 ± 0.90; p < 0.0001 for all 3 patients, Wilcoxon rank‐sum tests; Fig 6C), suggesting that the detected ISR invaded by tumors were recruited during the motor task.
FIGURE 6.
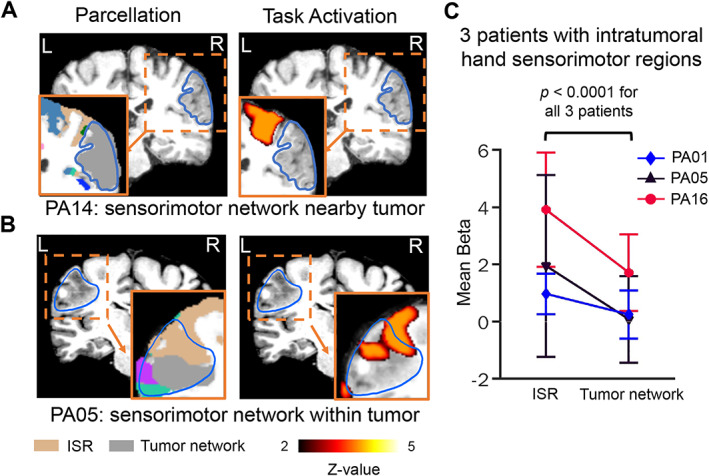
Cortical sensorimotor networks nearby or within the tumor corresponded to regions showing hand motor task activations. (A) The hand sensorimotor network adjacent to a tumor in PA14. A repetitive hand motor task evoked BOLD signal activation that corresponded topographically with the sensorimotor network derived from our resting‐state functional connectivity parcellation. (B) The hand sensorimotor network located nearby and within the tumoral boundary in PA05. The hand motor task induced fMRI activation that spatially overlapped with the sensorimotor network but did not extend into the tumor network indicated by grey color. (C) For 3 patients with intratumoral sensorimotor regions (ISR), we compared motor task responses measured using extracted β‐values derived from the general linear model within the ISRs and tumor networks. Each line represents a patient. Error bars represent the standard deviations of β‐values across all voxels within the ISRs or tumor networks. Task responses in the ISR were significantly stronger than those in the detected tumor network for each patient (p < 0.0001 for all 3 patients, Wilcoxon rank‐sum tests). fMRI = functional magnetic resonance imaging.
Intratumoral Higher‐Order Association Functional Networks Show Characteristic Distributed Functional Connectivity Patterns
We observed that higher‐order association networks demonstrated canonical functional connectivity profiles despite being invaded by tumors. For example, in 2 patients whose frontal cortices were partially invaded by tumors (PA17 and PA11), the tumor regions were parcellated into one tumor network and several association functional networks, such as the frontal–parietal network (FPN), DMN, and dATN (Fig 7). We placed 3 seeds in each of these functional regions (seeds A/B/C for PA17, and seeds D/E/F for PA11) and generated functional connectivity maps for each patient. Widespread and distributed functional connectivity patterns across the cerebral cortex were observed for these seeds. These connectivity maps show consistent network topologies with the corresponding individual‐specific functional networks mapped by the whole brain parcellation method (Spearman's r = 0.46, 0.47, 0.59 and all p values < 0.0001 for seeds A/B/C; Spearman's r = 0.49, 0.64, 0.65 and all p values < 0.0001 for seeds D/E/F), suggesting that intratumoral association functional regions may have preserved network properties.
FIGURE 7.

Functional regions invaded by tumors show characteristic distributed functional connectivity patterns of association functional networks. Individual‐specific parcellations identified several association networks (left column), such as the FPN (orange and purple colors indicate subnetworks FPN B and FPN C), DMN B (yellow), and dATN B (green) near or within the tumors (demarcated by blue lines). Seeds were placed in these functional regions. Functional connectivity maps of these seed regions show characteristic distributed patterns across the cerebral cortex (middle column) and converge to the corresponding individual‐specific functional networks identified by our parcellation approach (right column), suggesting that higher‐order cognitive functions may remain intact within regions invaded by tumors. ATN = attention network; DMN = default mode network; FC = functional connectivity; FPN = frontal–parietal network.
Discussion
In this study, an individualized brain network parcellation method was developed to map functional networks in tumor patients. In 20 patients, about 33.2% of the tumoral mass was classified as functional regions. In addition, we found that low‐grade gliomas may have more regions with preserved functional connectivity than high‐grade gliomas. Individualized sensorimotor networks nearby and within tumors could be validated using invasive cortical simulation and task response, respectively. Cortico‐cerebellar sensorimotor connectivity in these patients provides further evidence that characteristic functional connectivity may be preserved in regions invaded by tumor cells. Finally, the presence of long‐distance higher‐order functional connectivity suggests that cognitive functions may also be preserved intratumorally. Taken together, our results indicate that our individualized functional network parcellation approach can successfully delineate functional regions within and nearby tumors and has potential clinical applications for patients undergoing resection surgery.
Implications for Tumor Resections and Prognoses
Resecting tumors with functional intact regions inside can potentially cause new neurological functional deficits to arise, which will adversely affect the patient's quality of life. 1 , 6 Our data indicated that the functional and anatomic boundaries of tumors may be mismatched. Therefore, revealing the functional network topography surrounding and within tumors will enable one to predict the risk of postsurgical deficit and provide more objective information to assess the risk to benefit ratio of the planned surgery. This does not negate the need for intraoperative stimulation mapping for surgical planning, rather our parcellation approach could serve as a preoperative reference used in tandem with DCS to more precisely identify the presence or absence of functional regions within tumors, which may have been missed otherwise.
Importantly, our technology has clinical implications for the development of novel “prehabilitation” strategies. For patients requiring extensive resectioning, despite the presence of functionally intact zones intratumorally, our parcellation approach when coupled with targeted and personalized neuromodulation therapies prior to surgery, such as continuous direct cortical stimulation (cDCS) or transcranial magnetic stimulation (TMS), may take advantage of the brain's ability to functionally re‐organize and undergo neuroplastic changes. Previous reports show that presurgical suppression of the eloquent areas by cDCS or TMS promotes reorganization of functional regions within gliomas. 1 , 27 This prehabilitation procedure may displace eloquent areas from the glioma tissue to nearby regions or toward the contralateral hemisphere. 28 The capability of our parcellation to accurately identify individual‐specific eloquent areas shows promising potential for guiding the personalized intratumoral targeting and evaluating the prehabilitation procedure. A successful eloquent functional displacement could minimize postoperative functional impairment and improve prognosis.
Revealing Tumor Tissue by Functional Scope
Evidence from a previous study suggests that BOLD signals from inside the tumor are significantly different from those located in surrounding healthy tissues. 29 Here, we utilized this characteristic of the BOLD signals to map nonfunctional tumor networks. It is noteworthy that the tumor networks are often more circumscribed than the anatomic boundaries demarcated by abnormal intensity identified using conventional MRI techniques. In other words, the tumor network demarcates a boundary, outside rather than within, which functional consideration should be taken more care. The functional boundary of the tumor could be a potentially critical concept in neurosurgical practice in the near future.
The mechanism of temporal synchronization of BOLD fluctuations within tumor networks remains unclear. It has been shown that the BOLD signal is largely dependent on the oxygen extraction ratio, the levels of oxygenated to deoxygenated hemoglobin. 30 The histological and pathophysiological characteristics of the tumor may change the above feature, thus producing abnormal BOLD signals. 31 Although the mechanism is not fully understood, 2 main factors are thought to contribute to the tumor‐related BOLD signal components. First, the intratumoral blood flow and oxygenation are much higher than other brain tissues, and change according to the relatively consistent metabolic rate across the tumor volume, as brain tumors undergo angiogenesis to support the increase in metabolism as tumor cells divide. 32 In tumoral brains, it has been reported that invading tumor cells lead to loss of physiological astrocyte function, inducing vasoconstriction or vasodilation in response to neuronal activity. 33 , 34 Normal brain activity has a limited effect on tumor oxygenation and blood flow if the remaining intratumoral functional areas are not considered. 33 , 35 Therefore, signals within tumors are highly temporally synchronized and do not necessarily follow the fluctuations that are found in functional areas outside the tumor. Second, near‐tumoral blood flow and oxygenation are affected by the large tumor mass. A hypoxic microenvironment may be induced by malignant cancer cell proliferation and blood vessel deformation during tumor angiogenesis. 36 Despite the blood perfusion promoted by vascular autoregulation, the peripheral infiltration of these tissues still shows decreases in blood volume and partial pressure of oxygen. 36 , 37 The changes due to oxygenation may enhance the difference in BOLD signals compared with the neovascularized area found within tumors.
Revealing Individual‐Specific Intratumoral Functional Networks
A body of empirical evidence suggests that specific functional regions may remain within the tumoral margin. For example, Rivera et al1 performed intraoperative cortical stimulation mapping to confirm the presence of language and movement‐related functional regions within the tumor for a patient with glioma. The resection of these areas led to right hemiplegia and aphasia severely affecting the patient's quality of life. In another study, Daniel et al2 utilized fMRI to quantify preserved functional connectivity within glioblastomas. In the current study, we found intratumoral functional networks were present in the majority of patients. Low‐grade gliomas showed a significantly greater number of intratumoral functional regions than high‐grade gliomas, despite the limited sample size of high‐grade gliomas. These results suggest that the ratio of intratumoral functional regions to tumor mass may have potential clinical utility as a biomarker for distinguishing more advanced or aggressive brain tumor typologies. The differential preservation of intratumoral functional networks within low‐grade relative to high‐grade gliomas may be attributed to 2 key factors. First, tumoral tissues are characterized as infiltrative and histologically heterogeneous. 3 , 38 For low‐grade gliomas, higher density of viable tumor cells is found in the central parts of the tumor tissue and decreases towards the periphery. 39 Active tumors are disseminated neoplasms with a fringe of invasive cells around a core lesion. 40 It is possible that neoplasms have spread from the initial lesion, and in the low‐degree infiltrated regions, invasive cells are mixed with neuropil that retains intrinsic functional connectivity. Second, recent studies suggest high‐grade gliomas may engage neural circuits by electrochemical communication through neuron‐glioma synapses. 41 , 42 These bidirectional interactions are fundamental to glioma progression. It is therefore possible that these neuron‐glioma interconnections act as conduits for functional connectivity with downstream neurons creating an electrically coupled network and subsequently, functionally linking other distant regions that are also connected, albeit indirectly.
Limitations and Future Directions
There are several limitations worth mentioning. First, our sample size was limited (N = 20). There were 4 patients with high‐grade tumors involved in the comparison of RIFR. The findings are therefore subject to future replications in larger samples. Second, in regard to the functional connectivity observed intratumorally, the resulting long‐distance connectivity profile provided probable rather than definitive evidence that these regions may have preserved functional properties, despite task‐evoked responses. These findings should be validated by DCS or clinical neurosurgery outcomes in a more rigorous manner. Third, a spatial smoothing step involved in the fMRI preprocessing pipeline blurs BOLD signals both outside and inside tumors. This may cause the boundary of the tumor network to be inaccurate. To address this potential confound, we smoothed BOLD signals outside and inside tumor masks separately and compared the functional connectivity (FC) results shown in Figure 7. The similar connectivity maps (average Dice = 86.33% ± 5.43%) demonstrated that our spatial smoothing strategy was not an important factor affecting the functional connectivity patterns within tumors. Fourth, the tumor network was derived from an ROI seed placed in the center of the tumor tissue. To evaluate the possibility of initial seed positions, we randomly placed 10 tumor seeds within the boundary of tumors for each patient. The high reliability of the parcellation results (average Dice = 97.22% ± 1.41% across all patients) illustrates that our parcellation is nearly independent of the initial tumor seed selection.
Author Contributions
H.L., Y.L., L.L., T.J., and H.Z. contributed to the conception and design of the study. W.C., Y.W., J.R., and X.F. contributed to the acquisition and analysis of data. W.C., Y.W., J.R., C.S.H., S.F., D.W., Y.L., and H.L. contributed to drafting the text and preparing the figures.
Potential Conflicts of Interest
The authors declared no conflict of interest.
Acknowledgments
This work was supported by National Natural Science Foundation of China (U1809209 and 61671042 to Y.L. and 81790650 and 81790652 to H.L.); Beijing Natural Science Foundation (L182015 to Y.L.); Shenzhen International Cooperative Research Project (GJHZ20180930110402104 to L.L.); National Institutes of Health (R01NS091604, P50MH106435, P50DA046373, P20GM109040, R01DC017991 and R21MH121831, all to H.L.); Zhejiang Laboratory's International Talent Fund for Young Professionals (to W.C.).
Contributor Information
Yang Li, Email: liyang@buaa.edu.cn.
Luming Li, Email: lilm@tsinghua.edu.cn.
Tao Jiang, Email: taojiang1964@163.com.
Hesheng Liu, Email: hesheng@nmr.mgh.harvard.edu.
References
- 1. Rivera‐Rivera PA, Rios‐Lago M, Sanchez‐Casarrubios S, et al. Cortical plasticity catalyzed by prehabilitation enables extensive resection of brain tumors in eloquent areas. J Neurosurg 2017;126:1323–1333. [DOI] [PubMed] [Google Scholar]
- 2. Daniel AG, Park KY, Roland JL, et al. Functional connectivity within glioblastoma impacts overall survival. Neuro Oncol 2020;23:412–421. [DOI] [PMC free article] [PubMed] [Google Scholar]
- 3. Eidel O, Burth S, Neumann J‐O, et al. Tumor infiltration in enhancing and non‐enhancing parts of glioblastoma: a correlation with histopathology. PLoS One 2017;12:e0169292. [DOI] [PMC free article] [PubMed] [Google Scholar]
- 4. Lu J, Zhao Z, Zhang J, et al. Functional maps of direct electrical stimulation‐induced speech arrest and anomia: a multicentre retrospective study. Brain 2021;144:awab125–awab2553. [DOI] [PMC free article] [PubMed] [Google Scholar]
- 5. Zelitzki R, Korn A, Arial E, et al. Comparison of motor outcome in patients undergoing awake vs general anesthesia surgery for brain tumors located within or adjacent to the motor pathways. Neurosurgery 2019;85:E470–E476. [DOI] [PubMed] [Google Scholar]
- 6. Sanai N, Mirzadeh Z, Berger MS. Functional outcome after language mapping for glioma resection. N Eng J Med 2008;358:18–27. [DOI] [PubMed] [Google Scholar]
- 7. Kinno R, Ohta S, Muragaki Y, et al. Differential reorganization of three syntax‐related networks induced by a left frontal glioma. Brain 2014;137:1193–1212. [DOI] [PubMed] [Google Scholar]
- 8. Elliott ML, Knodt AR, Ireland D, et al. What is the test‐retest reliability of common task‐functional MRI measures? New empirical evidence and a meta‐analysis. Psychol Sci 2020;31:792–806. [DOI] [PMC free article] [PubMed] [Google Scholar]
- 9. Yeo BT, Krienen FM, Sepulcre J, et al. The organization of the human cerebral cortex estimated by intrinsic functional connectivity. J Neurophysiol 2011;106:1125–1165. [DOI] [PMC free article] [PubMed] [Google Scholar]
- 10. Buckner RL, Krienen FM, Castellanos A, et al. The organization of the human cerebellum estimated by intrinsic functional connectivity. J Neurophysiol 2011;106:2322–2345. [DOI] [PMC free article] [PubMed] [Google Scholar]
- 11. Mueller S, Wang D, Fox MD, et al. Individual variability in functional connectivity architecture of the human brain. Neuron 2013;77:586–595. [DOI] [PMC free article] [PubMed] [Google Scholar]
- 12. Wang D, Liu H. Functional connectivity architecture of the human brain: not all the same. Neuroscientist 2014;20:432–438. [DOI] [PMC free article] [PubMed] [Google Scholar]
- 13. Braga RM, Buckner RL. Parallel interdigitated distributed networks within the individual estimated by intrinsic functional connectivity. Neuron 2017;95:457–471. e5, 471.e5. [DOI] [PMC free article] [PubMed] [Google Scholar]
- 14. Gordon EM, Laumann TO, Marek S, et al. Default‐mode network streams for coupling to language and control systems. Proc Natl Acad Sci 2020;117:17308–17319. [DOI] [PMC free article] [PubMed] [Google Scholar]
- 15. Wang D, Buckner RL, Fox MD, et al. Parcellating cortical functional networks in individuals. Nat Neurosci 2015;18:1853–1860. [DOI] [PMC free article] [PubMed] [Google Scholar]
- 16. Otten ML, Mikell CB, Youngerman BE, et al. Motor deficits correlate with resting state motor network connectivity in patients with brain tumours. Brain 2012;135:1017–1026. [DOI] [PMC free article] [PubMed] [Google Scholar]
- 17. Stoecklein VM, Stoecklein S, Galiè F, et al. Resting‐state fMRI detects alterations in whole brain connectivity related to tumor biology in glioma patients. Neuro Oncol 2020;22:1388–1398. [DOI] [PMC free article] [PubMed] [Google Scholar]
- 18. Menze BH, Jakab A, Bauer S, et al. The multimodal brain tumor image segmentation benchmark (BRATS). IEEE Trans Med Imaging 2014;34:1993–2024. [DOI] [PMC free article] [PubMed] [Google Scholar]
- 19. Louis DN, Perry A, Wesseling P, et al. The 2021 WHO classification of tumors of the central nervous system: a summary. Neuro Oncol 2021;23:1231–1251. [DOI] [PMC free article] [PubMed] [Google Scholar]
- 20. Stoecklein S, Hilgendorff A, Li M, et al. Variable functional connectivity architecture of the preterm human brain: impact of developmental cortical expansion and maturation. Proc Natl Acad Sci 2020;117:1201–1206. [DOI] [PMC free article] [PubMed] [Google Scholar]
- 21. Ren J, Xu T, Wang D, et al. Individual variability in functional organization of the human and monkey auditory cortex. Cereb Cortex 2021;31:2450–2465. [DOI] [PMC free article] [PubMed] [Google Scholar]
- 22. Jenkinson M, Bannister P, Brady M, Smith S. Improved optimization for the robust and accurate linear registration and motion correction of brain images. Neuroimage 2002;17:825–841. [DOI] [PubMed] [Google Scholar]
- 23. Duffau H, Capelle L, Denvil D, et al. Usefulness of intraoperative electrical subcortical mapping during surgery for low‐grade gliomas located within eloquent brain regions: functional results in a consecutive series of 103 patients. J Neurosurg 2003;98:764–778. [DOI] [PubMed] [Google Scholar]
- 24. Zhang D, Johnston JM, Fox MD, et al. Preoperative sensorimotor mapping in brain tumor patients using spontaneous fluctuations in neuronal activity imaged with functional magnetic resonance imaging. Neurosurgery 2009;65:226–236. [DOI] [PMC free article] [PubMed] [Google Scholar]
- 25. Li Y, Liu X, Xu K, et al. MRI features can predict EGFR expression in lower grade gliomas: a voxel‐based radiomic analysis. Eur Radiol 2018;28:356–362. [DOI] [PubMed] [Google Scholar]
- 26. Holmes AJ, Hollinshead MO, O'keefe TM, et al. Brain genomics Superstruct project initial data release with structural, functional, and behavioral measures. Sci Data 2015;2:1–16. [DOI] [PMC free article] [PubMed] [Google Scholar]
- 27. Barcia JA, Sanz A, González‐Hidalgo M, et al. rTMS stimulation to induce plastic changes at the language motor area in a patient with a left recidivant brain tumor affecting Broca's area. Neurocase 2012;18:132–138. [DOI] [PubMed] [Google Scholar]
- 28. Duffau H. The huge plastic potential of adult brain and the role of connectomics: new insights provided by serial mappings in glioma surgery. Cortex 2014;58:325–337. [DOI] [PubMed] [Google Scholar]
- 29. Feldman S, Chu D, Schulder M, et al. The blood oxygen level–dependent functional MR imaging signal can be used to identify brain tumors and distinguish them from Normal tissue. Am J Neuroradiol 2009;30:389–395. [DOI] [PMC free article] [PubMed] [Google Scholar]
- 30. Ogawa S, Menon R, Tank D, et al. Functional brain mapping by blood oxygenation level‐dependent contrast magnetic resonance imaging. A comparison of signal characteristics with a biophysical model. Biophys J 1993;64:803–812. [DOI] [PMC free article] [PubMed] [Google Scholar]
- 31. Huang H, Lu J, Wu J, et al. Tumor tissue detection using blood‐oxygen‐level‐dependent functional MRI based on independent component analysis. Sci Rep 2018;8:1–16. [DOI] [PMC free article] [PubMed] [Google Scholar]
- 32. Dewhirst MW, Cao Y, Moeller B. Cycling hypoxia and free radicals regulate angiogenesis and radiotherapy response. Nat Rev Cancer 2008;8:425–437. [DOI] [PMC free article] [PubMed] [Google Scholar]
- 33. Watkins S, Robel S, Kimbrough IF, et al. Disruption of astrocyte–vascular coupling and the blood–brain barrier by invading glioma cells. Nat Commun 2014;5:1–15. [DOI] [PMC free article] [PubMed] [Google Scholar]
- 34. Attwell D, Buchan AM, Charpak S, et al. Glial and neuronal control of brain blood flow. Nature 2010;468:232–243. [DOI] [PMC free article] [PubMed] [Google Scholar]
- 35. Cuddapah VA, Robel S, Watkins S, Sontheimer H. A neurocentric perspective on glioma invasion. Nat Rev Neurosci 2014;15:455–465. [DOI] [PMC free article] [PubMed] [Google Scholar]
- 36. Brown JM, Wilson WR. Exploiting tumour hypoxia in cancer treatment. Nat Rev Cancer 2004;4:437–447. [DOI] [PubMed] [Google Scholar]
- 37. Lüdemann L, Förschler A, Grieger W, Zimmer C. BOLD signal in the motor cortex shows a correlation with the blood volume of brain tumors. J Magnet Reson Imaging 2006;23:435–443. [DOI] [PubMed] [Google Scholar]
- 38. Pirro V, Alfaro CM, Jarmusch AK, et al. Intraoperative assessment of tumor margins during glioma resection by desorption electrospray ionization‐mass spectrometry. Proc Natl Acad Sci 2017;114:6700–6705. [DOI] [PMC free article] [PubMed] [Google Scholar]
- 39. Kinoshita M, Hashimoto N, Goto T, et al. Fractional anisotropy and tumor cell density of the tumor core show positive correlation in diffusion tensor magnetic resonance imaging of malignant brain tumors. Neuroimage 2008;43:29–35. [DOI] [PubMed] [Google Scholar]
- 40. Friedl P, Alexander S. Cancer invasion and the microenvironment: plasticity and reciprocity. Cell 2011;147:992–1009. [DOI] [PubMed] [Google Scholar]
- 41. Venkatesh HS, Morishita W, Geraghty AC, et al. Electrical and synaptic integration of glioma into neural circuits. Nature 2019;573:539–545. [DOI] [PMC free article] [PubMed] [Google Scholar]
- 42. Venkataramani V, Tanev DI, Strahle C, et al. Glutamatergic synaptic input to glioma cells drives brain tumour progression. Nature 2019;573:532–538. [DOI] [PubMed] [Google Scholar]