Abstract
Background
The relationship between obesity and bone mineral density (BMD) varies in different studies. Our aim in this study was to explore the association between obesity (body mass index ≥ 30) and BMD among adults 40–59 years of age.
Methods
This study was conducted on a sample of 2218 participants (986 men and 1232 women) aged 40 to 59 years from the National Health and Nutrition Examination Survey 2011–2018. The independent variable was body mass index (BMI). The outcome variable was lumbar BMD. The associations of BMI with lumbar BMD were examined using multivariable linear regression models.
Results
BMI was positively associated with lumbar BMD after adjusting for other covariates [β 0.006; 95% confidence interval (CI) 0.003–0.008]. An inverted U-shaped association between BMI and lumbar BMD was further identified, with the point of infection at approximately 50 kg/m2. In the subgroup analyses, the relationship between BMI and lumbar BMD in women and blacks was an inverted U-shape.
Conclusion
Based on the results, it may be beneficial to appropriately increase BMI to promote BMD. However, considering the inverted U-shaped association, excessive BMI may be harmful to bone health in women and blacks.
Keywords: Bone mineral density, Obesity, Body mass index, NHANES
Introduction
Osteoporosis is a systemic skeletal metabolic disorder characterized by low bone mass density (BMD) and microarchitectural deterioration of bone tissue, with an increased risk of fragility fractures [1]. Osteoporosis and fragility fractures increase the burden not only on individual subjects but also on health care systems [2].
Obesity has become a serious public health problem worldwide, and obesity is associated with several medical conditions [3]. Body mass index (BMI) is used as a metric for assessing obesity, which exhibits good resolution among individuals of different ages, sexes and races [4]. High BMI is closely associated with BMD in both men and women. However, studies on the relationship between high BMI and BMD have found conflicting results. Some studies have demonstrated that high BMI is protective for osteoporosis [5], while an increasing amount of data seems to contradict this finding [6]. Our aim in the study was to evaluate the association between obesity and BMD among adults 40–59 years of age using a population-based database.
Methods
Study population
The National Health and Nutrition Examination Survey (NHANES) is a survey designed to provide large information about the nutrition and health conditions of the general population in America [7]. The data from 2011 to 2018 were combined in this paper. Of the 5731 individuals aged 40 to 59 years with available BMI and lumbar BMD data, 2218 were included in the final analysis after the exclusion of 332 subjects with cancer and 3181 non-obese subjects (BMI < 30). The survey protocols were approved by the ethics review board of the National Center for Health Statistics, and participants in the NHANES provided written consent.
Variables
The key variables of the study were BMI (independent variable) and lumbar BMD (dependent variable). BMI was calculated as weight in kilograms divided by height in meters squared. Lumbar BMD was measured by dual-energy X-ray absorptiometry. Additional categorical variables were were included in the analysis: sex, race/ethnicity, level of education, vigorous recreational activities, and smoking behavior. Continuous covariates were also analyzed: age, poverty to income ratio, waist circumference, blood urea nitrogen, lumbar BMD, total protein, serum glucose, cholesterol, phosphorus, and total calcium. Detailed information on BMI, lumbar BMD, and covariates is publicly available from NHANES.
Statistical analysis
All estimates were calculated accounting for NHANES sample weights. Weighted multivariate linear regression models and smooth curve fittings were used to evaluate the associations between BMI and lumbar BMD. Three models were implemented: Model 1, no adjustment for covariates; Model 2, adjusted for age and race/ethnicity; and Model 3, adjusted for all covariates. These models adhered to the Strengthening the Reporting of Observational Studies in Epidemiology (STROBE) statement [8]. All analyses were performed with EmpowerStats (http://www.empowerstats.com) and R package (http://www.Rproject.org).
Result
A total of 2218 participants, 40–59 years of age, were included in the analysis, with the weighted characteristics of the participants subclassified based on BMI quartiles (Q1: 30.0–31.8 kg/m2; Q2: 31.9–34.2 kg/m2; Q3: 34.3–38.4 kg/m2; and Q4: 38.5–65.8 kg/m2), as shown in Table 1. There were significant differences in baseline characteristics among the BMI quartiles, except for some of the covariates: age, sex, the income to poverty ratio, smoking behavior, total protein, and phosphorus.
Table 1.
Weighted characteristics of study population based on BMI quartiles
| BMI (kg/m2) | Q1 (30.0–31.8) | Q2 (31.9–34.2) | Q3 (34.3–38.4) | Q4 (38.5–65.8) | P value |
|---|---|---|---|---|---|
| Age (years) | 49.31 ± 5.60 | 49.79 ± 5.95 | 49.53 ± 5.75 | 49.37 ± 5.58 | 0.4894 |
| Sex (%) | 0.7802 | ||||
| Men | 61.59 | 45.05 | 46.18 | 44.59 | |
| Women | 57.31 | 54.84 | 53.82 | 55.41 | |
| Race/ethnicity (%) | < 0.0001 | ||||
| Non-Hispanic white | 64.49 | 64.43 | 57.08 | 63.22 | |
| Non-Hispanic black | 11.64 | 11.87 | 19.43 | 19.89 | |
| Mexican American | 10.38 | 10.15 | 12.50 | 8.77 | |
| Other race/ethnicity | 13.49 | 13.55 | 10.99 | 8.11 | |
| Waist circumference (cm) | 104.68 ± 6.54 | 109.54 ± 7.15 | 115.13 ± 7.90 | 130.67 ± 12.06 | < 0.0001 |
| Level of education (%) | 0.0044 | ||||
| Less than high school | 15.96 | 15.07 | 15.35 | 12.06 | |
| High school | 19.60 | 27.61 | 26.23 | 21.64 | |
| More than high school | 64.43 | 57.33 | 58.42 | 66.30 | |
| Income to poverty ratio | 3.18 ± 1.62 | 3.17 ± 1.61 | 3.00 ± 1.62 | 3.06 ± 1.60 | 0.2449 |
| Vigorous recreational activities (%) | < 0.0001 | ||||
| Yes | 21.60 | 22.00 | 13.61 | 10.89 | |
| No | 78.40 | 78.00 | 86.39 | 89.11 | |
| Smoked at least 100 cigarettes in life (%) | 0.7802 | ||||
| Yes | 42.69 | 45.05 | 46.18 | 44.59 | |
| No | 57.31 | 54.95 | 53.82 | 55.41 | |
| Blood urea nitrogen (mmol/L) | 5.01 ± 1.64 | 4.84 ± 1.61 | 4.63 ± 1.48 | 4.87 ± 2.11 | 0.0049 |
| Total protein (g/L) | 70.76 ± 3.95 | 70.88 ± 4.05 | 70.59 ± 4.57 | 70.51 ± 4.35 | 0.4786 |
| Cholesterol (mmol/L) | 5.36 ± 1.10 | 5.26 ± 1.04 | 5.16 ± 1.19 | 4.92 ± 0.97 | < 0.0001 |
| Phosphorus (mmol/L) | 1.17 ± 0.17 | 1.18 ± 0.18 | 1.18 ± 0.18 | 1.18 ± 0.18 | 0.7604 |
| Total calcium (mmol/L) | 2.34 ± 0.08 | 2.33 ± 0.08 | 2.32 ± 0.09 | 2.31 ± 0.09 | < 0.0001 |
| Serum glucose (mmol/L) | 5.93 ± 2.39 | 5.84 ± 2.36 | 6.33 ± 3.03 | 6.52 ± 2.71 | < 0.0001 |
| Lumbar BMD (g/cm2) | 1.02 ± 0.16 | 1.02 ± 0.15 | 1.03 ± 0.16 | 1.08 ± 0.17 | < 0.0001 |
Mean ± SD for continuous variables: the P value was calculated by the weighted linear regression model. % for categorical variables: the P value was calculated by the weighted chi-square test
The association between BMI and lumbar BMD was positive in all three regression models (Table 2): Model 1 (β 0.005; 95% confidence interval (CI) 0.004–0.006); Model 2 (β 0.004; 95% CI 0.003–0.006); and Model 3 (β 0.006; 95% CI 0.003–0.008). In subgroup analyses, with subgroups defined by sex, race/ethnicity and age, a positive correlation of BMI with lumbar BMD was found for both men (β 0.013; 95% CI 0.008–0.018; P < 0.001), women (β 0.003; 95% CI 0.000–0.006; P 0.044), whites (β 0.006; 95% CI 0.001–0.010; P 0.013), blacks (β 0.008; 95% CI 0.003–0.013; P 0.002), Mexican Americans (β 0.006; 95% CI 0.000–0.012; P 0.037) as well as in 40–49 years (β 0.008; 95% CI 0.004–0.011; P < 0.001) and 50–59 years (β 0.004; 95% CI 0.001–0.008; P 0.021), as reported in Table 2.
Table 2.
Association between BMI (kg/m2) and lumbar bone mineral density (g/cm2)
| Model 1 | Model 2 | Model 3 | |
|---|---|---|---|
| β (95% CI) P value | β (95% CI) P value | β (95% CI) P value | |
| BMI (kg/m2) | 0.005 (0.004, 0.006) < 0.001 | 0.004 (0.003, 0.006) < 0.001 | 0.006 (0.003, 0.008) < 0.001 |
| BMI categories | |||
| Q1 (30.0–31.8 kg/m2) | Reference | Reference | Reference |
| Q2 (31.9–34.2 kg/m2) | − 0.007 (− 0.026, 0.011) 0.437 | − 0.009 (− 0.027, 0.010) 0.362 | − 0.003 (− 0.023, 0.017) 0.774 |
| Q3 (34.3–38.4 kg/m2) | 0.003 (− 0.017, 0.022) 0.793 | − 0.002 (− 0.021, 0.017) 0.829 | − 0.007 (− 0.029, 0.016) 0.568 |
| Q4 (38.5–65.8 kg/m2) | 0.054 (0.035, 0.073) < 0.001 | 0.049 (0.030, 0.068) < 0.001 | 0.034 (0.002, 0.066) 0.038 |
| Subgroup analysis stratified by sex | |||
| Men | 0.008 (0.005, 0.010) < 0.001 | 0.007 (0.005, 0.009) < 0.001 | 0.013 (0.008, 0.018) < 0.001 |
| Women | 0.003 (0.002, 0.004) < 0.001 | 0.003 (0.002, 0.004) < 0.001 | 0.003 (0.000, 0.006) 0.044 |
| Subgroup analysis stratified by race/ethnicity | |||
| Non-hispanic white | 0.005 (0.003, 0.007) < 0.001 | 0.005 (0.003, 0.007) < 0.001 | 0.006 (0.001, 0.010) 0.013 |
| Non-hispanic black | 0.003 (0.001, 0.005) 0.004 | 0.004 (0.001, 0.006) 0.003 | 0.008 (0.003, 0.013) 0.002 |
| Mexican American | 0.005 (0.002, 0.008) < 0.001 | 0.005 (0.002, 0.008) < 0.001 | 0.006 (0.000, 0.012) 0.037 |
| Other race/ethnicity | 0.002 (− 0.001, 0.004) 0.171 | 0.003 (− 0.000, 0.005) 0.056 | 0.001 (− 0.004, 0.007) 0.598 |
| Subgroup analysis stratified by age | |||
| 40–49 years | 0.005 (0.004, 0.007) < 0.001 | 0.004 (0.002, 0.006) < 0.001 | 0.008 (0.004, 0.011) < 0.001 |
| 50–59 years | 0.004 (0.002, 0.006) < 0.001 | 0.005 (0.003, 0.006) < 0.001 | 0.004 (0.001, 0.008) 0.021 |
Model 1: no covariates were adjusted. Model 2: age, sex, and race/ethnicity were adjusted. Model 3: age, sex, and race/ethnicity, level of education, poverty to income ratio, vigorous recreational activities, smoking behavior, waist circumference, blood urea nitrogen, total protein, serum glucose, cholesterol, phosphorus, and total calcium were adjusted
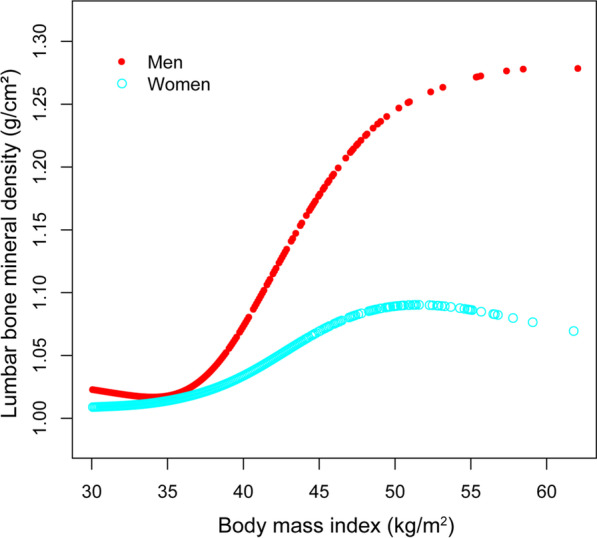
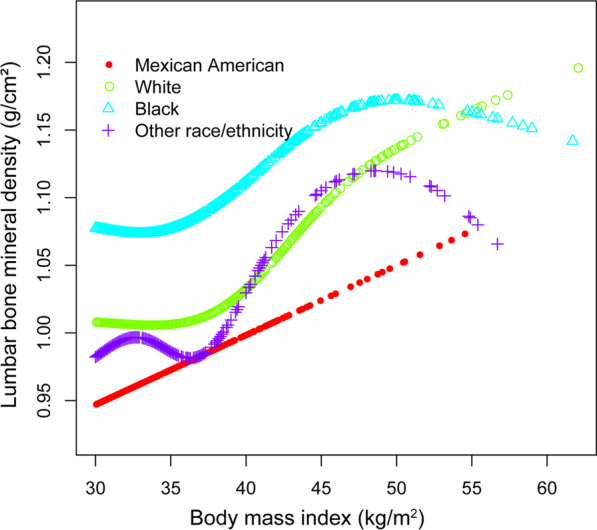
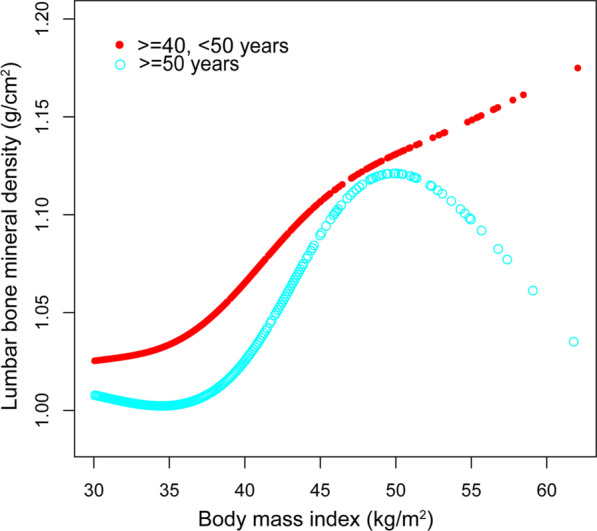
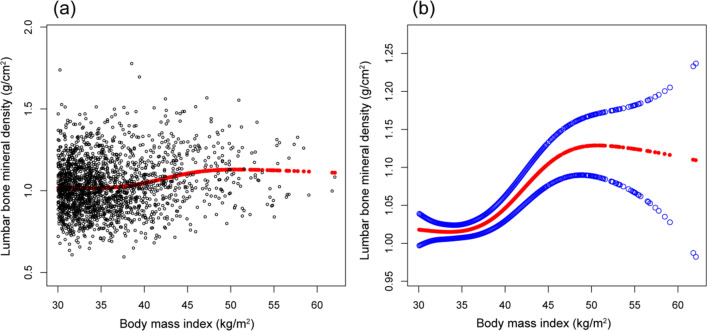
Smooth curve fittings and generalized additive models used to characterize the nonlinear relationship between BMI and lumbar BMD are shown in Figs. 1, 2, 3 and 4. The graphical representation of the association between BMI and lumbar BMD was an inverted U-shaped and the point of infection was approximately 50 kg/m2. For a BMI < 50 kg/m2, an increase in BMI was associated with an increase in lumbar BMD; in contrast, for individuals with a BMI > 50 kg/m2, an increase in BMI was associated with a decrease in lumbar BMD. In subgroup analyses stratified by sex, race/ethnicity and age, the graphical relationship between BMI and lumbar BMD for women, blacks and elder (50–59 years) was an inverted U-shape.
Fig. 1.
The associations between BMI and lumbar BMD. a Each black point represents a sample. b Solid red line represents the smooth curve fit between variables. Blue bands represent the 95% of confidence interval from the fit. Adjusted for age, sex, and race/ethnicity, level of education, poverty to income ratio, vigorous recreational activities, smoking behavior, waist circumference, blood urea nitrogen, total protein, serum glucose, cholesterol, phosphorus, and total calcium
Fig. 2.

The association between BMI and lumbar BMD stratifified by sex. Age, and race/ethnicity, level of education, poverty to income ratio, vigorous recreational activities, smoking behavior, waist circumference, blood urea nitrogen, total protein, serum glucose, cholesterol, phosphorus, and total calcium were adjusted
Fig. 3.

The association between BMI and lumbar BMD stratified by race/ethnicity. Age, sex, level of education, poverty to income ratio, vigorous recreational activities, smoking behavior, waist circumference, blood urea nitrogen, total protein, serum glucose, cholesterol, phosphorus, and total calcium were adjusted
Fig. 4.

The association between BMI and lumbar BMD stratified by age. Sex, race/ethnicity, level of education, poverty to income ratio, vigorous recreational activities, smoking behavior, waist circumference, blood urea nitrogen, total protein, serum glucose, cholesterol, phosphorus, and total calcium were adjusted
Discussion
This cross-sectional study involving 2218 obese adults aged 40–59 showed a significantly positive association between high BMI and lumbar BMD. Of note, we identified an inverted U-shaped association between high BMI and BMD.
Currently, clinical studies regarding the correlation between obesity and BMD are limited and controversial. A study from the US reported a significant positive association between obesity and BMD existed in elderly groups of both sexes [9]. In a study of 502 northern Chinese men, the total body and regional BMD in obese subjects were significantly higher than those of subjects with normal weight (P < 0.001) [10]. Similar results were reported by Silva et al. in postmenopausal women and reported a lower prevalence of osteoporosis at the lumbar spine and femoral neck in obese patients (P < 0.001) [11]. However, there is emerging literature that reports the opposite result. A study from India indicated that individuals with BMI ≥ 35 kg/m2 have a lower BMD than those with BMI ≥ 25–35 kg/m2. (0.723 gm/cm2 versus 0.762 gm/cm2; P 0.002) [12]. Another study from China based on 8365 adolescents aged 12–15 years concluded that obese subjects had a higher risk of having low BMD compared to subjects of normal weight for both sexes [13]. A retrospective study from Spain showed that obese females had an increased risk of proximal fractures compared with normal or underweight women (RR: 1.28; 95% CI 1.04–1.58; P 0.018) [14].
In our study, we identified an inverted U-shaped association between BMD and high BMI, with a point of infection at approximately 50 kg/m2. Excessive BMI may be harmful to bone health. In subgroup analyses, we found that the reason for this result was due to the findings for women, blacks and elder (50–59 years). There are sex differences in the relationship between BMI and lumbar BMD. The Busselton Healthy Aging Study showed that BMI is associated with reduced BMI in women but not in men [15]. One mechanism might explain why the lower BMD found in women and elder (50–59 years) BMI > 50 kg/m2 is the reduced estradiol. Menopause cause a quick increase in bone turnover, brings higher bone resorption and leads to bone loss [16, 17]. Racial differences in BMD have been described in adolescents and adults with normal weight and obesity in various studies [18–21], and differences in genetic risk factors, lifestyle and other factors may explain the race-specific differences. Further studies are required to clarify the association between BMI and BMD among individuals of the women and black individuals.
We used nationally representative data and performed subgroup analyses. Therefore, our results may be different from those previously reported. Moreover, it is important to acknowledge the limitations of the study. First, the study was a cross-sectional study, which limits the accuracy of the inference regarding the relationship between high BMI and lumbar BMD among middle-aged adults thus, further RCTs are necessary to strengthen evidence of the exact relationship between obesity and BMD. Second, there may be other confounding factors for which we did not adjust for such as the medical histories of the patients, such as diagnoses, drugs and procedures, which could affect the result [22, 23]. The application of additional available methodologies might help to identify potential confounders that we did not find in this study [24–26]. Third, participants with cancer or malignancy were not included in the study therefore, the conclusion of the research is not applicable to patients with those conditions.
Conclusions
The findings revealed an inverted U-shaped association between BMI and lumbar BMD among obese middle-aged adults, suggesting that it may be beneficial to appropriately increase BMI levels to promote bone health. However, for women and blacks, excessively high BMI may may contribute to loss of BMD.
Acknowledgements
I appreciate the effort and time given by participants of the NHANES project.
Abbreviations
- BMI
Body mass index
- BMD
Bone mineral density
- NHANES
National Health and Nutrition Examination Survey
Author contributions
YL contributed to data collection, analysis, and writing of the manuscript. The author read and approved the final manuscript.
Funding
This study received no funding.
Declarations
Ethics approval and consent to participate
The ethics review board of the National Center for Health Statistics approved all NHANES protocols and written informed consent was obtained from all participants.
Consent for publication
Not applicable.
Competing interests
The author declares that he has no competing interests.
Footnotes
Publisher's Note
Springer Nature remains neutral with regard to jurisdictional claims in published maps and institutional affiliations.
References
- 1.Compston JE, McClung MR, Leslie WD. Osteoporosis. Lancet. 2019;393(10169):364–376. doi: 10.1016/S0140-6736(18)32112-3. [DOI] [PubMed] [Google Scholar]
- 2.Hernlund E, Svedbom A, Ivergård M, Compston J, Cooper C, Stenmark J, McCloskey EV, Jönsson B, Kanis JA. Osteoporosis in the European Union: medical management, epidemiology and economic burden. A report prepared in collaboration with the International Osteoporosis Foundation (IOF) and the European Federation of Pharmaceutical Industry Associations (EFPIA) Arch Osteoporos. 2013;8(1):136. doi: 10.1007/s11657-013-0136-1. [DOI] [PMC free article] [PubMed] [Google Scholar]
- 3.Kopelman PG. Obesity as a medical problem. Nature. 2000;404(6778):635–643. doi: 10.1038/35007508. [DOI] [PubMed] [Google Scholar]
- 4.Obesity: preventing and managing the global epidemic. Report of a WHO consultation. World Health Organ Tech Rep Ser. 2000;894:i-xii,1–253. [PubMed]
- 5.Lloyd JT, Alley DE, Hawkes WG, Hochberg MC, Waldstein SR, Orwig DL. Body mass index is positively associated with bone mineral density in US older adults. Arch Osteoporos. 2014;9:175. doi: 10.1007/s11657-014-0175-2. [DOI] [PubMed] [Google Scholar]
- 6.Greco EA, Fornari R, Rossi F, Santiemma V, Prossomariti G, Annoscia C, Aversa A, Brama M, Marini M, Donini LM, Spera G, Lenzi A, Lubrano C, Migliaccio S. Is obesity protective for osteoporosis? Evaluation of bone mineral density in individuals with high body mass index. Int J Clin Pract. 2010;64(6):817–820. doi: 10.1111/j.1742-1241.2009.02301.x. [DOI] [PubMed] [Google Scholar]
- 7.Zipf G, Chiappa M, Porter KS, Ostchega Y, Lewis BG, Dostal J. National health and nutrition examination survey: plan and operations, 1999–2010. Vital Health Stat. 2013;1:1–37. [PubMed] [Google Scholar]
- 8.von Elm E, Altman DG, Egger M, Pocock SJ, Gøtzsche PC, Vandenbroucke JP, STROBE Initiative. The Strengthening the Reporting of Observational Studies in Epidemiology (STROBE) statement: guidelines for reporting observational studies. Lancet. 2007;370(9596):1453–7. [DOI] [PubMed]
- 9.Cherukuri L, Kinninger A, Birudaraju D, Lakshmanan S, Li D, Flores F, Mao SS, Budoff MJ. Effect of body mass index on bone mineral density is age-specific. Nutr Metab Cardiovasc Dis. 2021;31(6):1767–1773. doi: 10.1016/j.numecd.2021.02.027. [DOI] [PubMed] [Google Scholar]
- 10.Kang DH, Guo LF, Guo T, Wang Y, Liu T, Feng XY, Che XQ. Association of body composition with bone mineral density in northern Chinese men by different criteria for obesity. J Endocrinol Invest. 2015;38(3):323–331. doi: 10.1007/s40618-014-0167-5. [DOI] [PubMed] [Google Scholar]
- 11.Silva HG, Mendonça LM, Conceição FL, Zahar SE, Farias ML. Influence of obesity on bone density in postmenopausal women. Arq Bras Endocrinol Metabol. 2007;51(6):943–949. doi: 10.1590/S0004-27302007000600008. [DOI] [PubMed] [Google Scholar]
- 12.Jose A, Cherian KE, Nandyal MB, Jiwanmall SA, Kattula D, Paul TV, Kapoor N. Trabecular bone score and bone mineral density in postmenopausal women with morbid obesity-a clinical paradox. Med Sci (Basel) 2021;9(4):69. doi: 10.3390/medsci9040069. [DOI] [PMC free article] [PubMed] [Google Scholar]
- 13.Wang L, Xu Z, Li N, et al. The association between overweight and obesity on bone mineral density in 12 to 15 years old adolescents in China. Medicine (Baltimore) 2021;100(32):e26872. doi: 10.1097/MD.0000000000026872. [DOI] [PMC free article] [PubMed] [Google Scholar]
- 14.Prieto-Alhambra D, Premaor MO, Fina Avilés F, Hermosilla E, Martinez-Laguna D, Carbonell-Abella C, Nogués X, Compston JE, Díez-Pérez A. The association between fracture and obesity is site-dependent: a population-based study in postmenopausal women. J Bone Miner Res. 2012;27(2):294–300. doi: 10.1002/jbmr.1466. [DOI] [PubMed] [Google Scholar]
- 15.Zhu K, Hunter M, James A, Lim EM, Cooke BR, Walsh JP. Discordance between fat mass index and body mass index is associated with reduced bone mineral density in women but not in men: the Busselton Healthy Ageing Study. Osteoporos Int. 2017;28(1):259–268. doi: 10.1007/s00198-016-3710-8. [DOI] [PubMed] [Google Scholar]
- 16.Reid IR, Ames RW, Evans MC, Sharpe SJ, Gamble GD. Determinants of the rate of bone loss in normal postmenopausal women. J Clin Endocrinol Metab. 1994;79(4):950–954. doi: 10.1210/jcem.79.4.7962303. [DOI] [PubMed] [Google Scholar]
- 17.Migliorini F, Maffulli N, Spiezia F, Tingart M, Maria PG, Riccardo G. Biomarkers as therapy monitoring for postmenopausal osteoporosis: a systematic review. J Orthop Surg Res. 2021;16(1):318. doi: 10.1186/s13018-021-02474-7. [DOI] [PMC free article] [PubMed] [Google Scholar]
- 18.Popp KL, Hughes JM, Martinez-Betancourt A, Scott M, Turkington V, Caksa S, Guerriere KI, Ackerman KE, Xu C, Unnikrishnan G, Reifman J, Bouxsein ML. Bone mass, microarchitecture and strength are influenced by race/ethnicity in young adult men and women. Bone. 2017;103:200–208. doi: 10.1016/j.bone.2017.07.014. [DOI] [PubMed] [Google Scholar]
- 19.Bredella MA, Singhal V, Hazhir Karzar N, Animashaun A, Bose A, Stanford FC, Carmine B, Misra M. Racial differences in lumbar marrow adipose tissue and volumetric bone mineral density in adolescents and young adults with obesity. Bone Rep. 2020;13:100726. doi: 10.1016/j.bonr.2020.100726. [DOI] [PMC free article] [PubMed] [Google Scholar]
- 20.Campoverde Reyes KJ, Stanford FC, Singhal V, Animashaun AO, Bose A, Gleeson EL, Bredella MA, Misra M. Bone density, microarchitecture and strength estimates in white versus African American youth with obesity. Bone. 2020;138:115514. doi: 10.1016/j.bone.2020.115514. [DOI] [PMC free article] [PubMed] [Google Scholar]
- 21.Putman MS, Yu EW, Lee H, Neer RM, Schindler E, Taylor AP, Cheston E, Bouxsein ML, Finkelstein JS. Differences in skeletal microarchitecture and strength in African-American and white women. J Bone Miner Res. 2013;28(10):2177–2185. doi: 10.1002/jbmr.1953. [DOI] [PMC free article] [PubMed] [Google Scholar]
- 22.Migliorini F, Maffulli N, Colarossi G, Eschweiler J, Tingart M, Betsch M. Effect of drugs on bone mineral density in postmenopausal osteoporosis: a Bayesian network meta-analysis. J Orthop Surg Res. 2021;16(1):533. doi: 10.1186/s13018-021-02678-x. [DOI] [PMC free article] [PubMed] [Google Scholar]
- 23.Migliorini F, Colarossi G, Baroncini A, Eschweiler J, Tingart M, Maffulli N. Pharmacological management of postmenopausal osteoporosis: a level i evidence based-expert opinion. Expert Rev Clin Pharmacol. 2021;14(1):105–119. doi: 10.1080/17512433.2021.1851192. [DOI] [PubMed] [Google Scholar]
- 24.Datta A, Matlock MK, Le Dang N, Moulin T, Woeltje KF, Yanik EL, Joshua SS. 'Black Box' to 'Conversational' machine learning: ondansetron reduces risk of hospital-acquired venous thromboembolism. IEEE J Biomed Health Inform. 2021;25(6):2204–2214. doi: 10.1109/JBHI.2020.3033405. [DOI] [PubMed] [Google Scholar]
- 25.Janzing D, Schölkopf B. Detecting confounding in multivariate linear models via spectral analysis. J Causal Inference. 2018;6(1):20170013. doi: 10.1515/jci-2017-0013. [DOI] [Google Scholar]
- 26.Datta A, Flynn NR, Barnette DA, Woeltje KF, Miller GP, Swamidass SJ. Machine learning liver-injuring drug interactions with non-steroidal anti-inflammatory drugs (NSAIDs) from a retrospective electronic health record (EHR) cohort. PLoS Comput Biol. 2021;17(7):e1009053. doi: 10.1371/journal.pcbi.1009053. [DOI] [PMC free article] [PubMed] [Google Scholar]


