Abstract
Acute trauma stimulates local repair mechanisms but can also impact structures distant from the injury, for instance through the activity of circulating factors. To study responses of remote tissues during tissue regeneration, we profiled transcriptomes of zebrafish brains after experimental cardiac damage. We found that the transcription factor gene cebpd was upregulated remotely in brain ependymal cells as well as kidney tubular cells, in addition to its local induction in epicardial cells. cebpd mutations altered both local and distant cardiac injury responses, altering proliferation of epicardial cells as well as exchange between distant fluid compartments. Genome-wide profiling and transgenesis identified a hormone-responsive enhancer near cebpd that exists in a permissive state, enabling rapid gene expression in heart, brain, and kidney after cardiac injury. Deletion of this sequence selectively abolished cebpd induction in remote tissues and disrupted fluid regulation after injury, without affecting its local cardiac expression response. Our findings suggest a model to broaden gene function during regeneration in which enhancer regulatory elements define short- and long-range expression responses to injury.
Introduction
Regeneration is widely investigated as a local response to tissue damage or loss1. Injuries trigger inflammatory responses and recruit immune cells to the wound to process damaged and dying tissues2. Chemical changes introduced by cells at the borders of the injury site establish a pro-regenerative environment with signals and scaffolds for tissue regrowth, which typically involves cell proliferation and/or differentiation3. New cells integrate into pre-existing tissues as organ structure and function recovers. Enabling these cell behaviors are gene expression programs that are initiated by injury, maintained and modified throughout repair events, and resolved as regeneration culminates4, 5.
Organisms are connected circuits of organ systems, and injuries to one organ can, in some cases, alter whole body physiology and the functions of distant organs. For example, heart failure causes the elevation of renal venous pressure, fostering the development of tubular hypertrophy, renal fibrogenesis, and renal venous congestion, further contributing to renal failure6. Conversely, electrolyte disruption, water retention, and neurohormonal dysregulation caused by acute and chronic kidney injuries can cause cardiac dysfunction in patients7, 8. Recent studies have identified mechanisms of crosstalk by which tissues distant from an injury can impact regeneration and functional recovery. For instance, in response to leg muscle injury, satellite cells and fibro-adipogenic progenitors in the contralateral leg switch from quiescence to an alert stage, improving the capacity to respond to a second injury9, 10. Studies involving a range of species, tissues, and injury contexts have begun to illuminate circulating factors that modulate regeneration or regeneration-associated physiology11-14. Thus, while the most obvious signature of regeneration is the growth and remodeling of local tissues, injury also influences a multidimensional communication network involving circulatory systems and distant tissues.
Here, we explored long-range tissue interactions during regeneration by assessing the brain transcriptomes of zebrafish subjected to severe cardiac injury. Our findings suggest a concept in whole-animal management of tissue regeneration in which injury-responsive enhancer elements expand the range and functions of key regulatory genes.
Results
Local and remote cebpd induction during heart regeneration
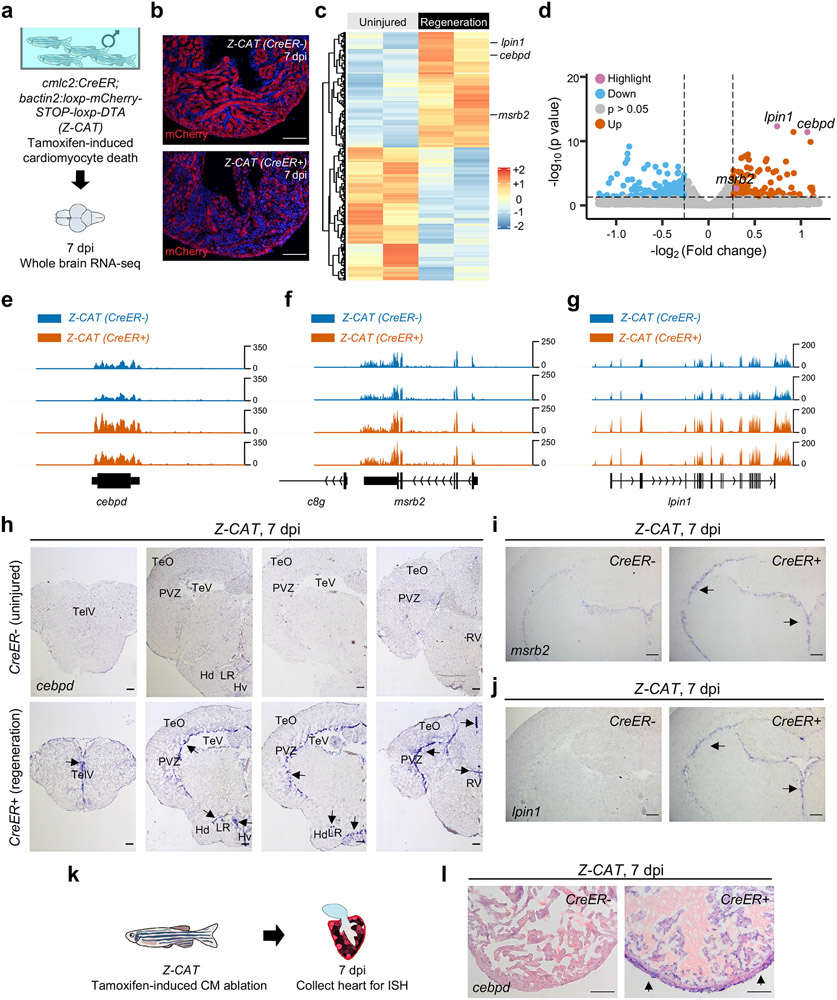
Zebrafish can regenerate cardiac tissue throughout life, based on injury-stimulated cardiomyocyte (CM) proliferation5, 15. To assess long-range responses to cardiac regeneration in zebrafish, we employed a genetic ablation system to destroy ~60% of CMs upon tamoxifen exposure (Fig.1a,b)16. We then collected whole brain tissue at 7 days post tamoxifen incubation (dpi), at which point cardiac tissues had activated regenerative programs, and sequenced transcriptomes (Fig.1a,b). Brain, as a control center, was selected as the primary organ for investigation. We identified 338 genes with changes in expression levels (p < 0.05; fold change > 1.2), including 157 and 181 with increased and decreased RNA levels, respectively (Fig.1c,d; Supplementary Table 1). Gene ontology analysis of differentially expressed genes indicated enrichment predominantly in metabolic pathways (Extended Data Fig.1a), similarly observed by others in mouse skeletal muscle, liver and adipose tissues shortly after experimental myocardial infarction17. The number of differentially expressed genes might be relatively small as the brain is uninjured in each sample, potential heterogeneity in distant tissue responses, and because sampling does not capture expression changes in rare cell populations.
Fig. 1: cebpd is induced in local and remote tissues during heart regeneration.
a, Schematic of profiling whole brain transcriptomes after cardiomyocyte (CM) ablation. b, Heart sections from uninjured control fish (top; CreER−) and those with both injury transgenes (bottom; CreER+) at 7 days post tamoxifen incubation (dpi). c, Heat map of genes with changes in the brain during heart regeneration. p < 0.05, Fold change (FC) > 1.2. d, Volcano plot showing differential gene expression in the brain during heart regeneration. Pink dots: highlighted genes. Blue dots: genes with decreased RNA levels (p < 0.05, FC < −1.2). Grey dots: genes with no significant changes. Orange dots: genes with increased RNA levels (p < 0.05, FC > 1.2). e, RNA-seq browser track of cebpd showing increased brain cebpd transcript levels during heart regeneration. Brains from 10 individuals were pooled as one sample for RNA-seq. TPM = 8.65 and 6.94 for CreER− and 18.54 and 14.49 for CreER+. f,g, RNA-seq browser tracks of msrb2 and lpin1, showing increased brain transcript levels during heart regeneration. Data represent the average of two biological replicates in each experimental group. Tissues from 10 animals were pooled as one biological replicate. h, ISH of cebpd on cross sections of the brain indicating induction in the ependymal cell layer during heart regeneration. TelV: telencephalic ventricle. TeO: tectum opticum. TeV: tectal ventricle. PVZ: periventricular gray zone. LR: lateral recess of diencephalic ventricle. Hd: dorsal zone of periventricular hypothalamus. Hv: ventral zone of the periventricular hypothalamus. RV: rhombencephalic ventricle. n= 57 CreER− and 48 CreER+ animals. Optic tectum is subsequently used as an indication of cebpd induction in brain. Arrows indicate violet ISH signals. i,j, ISH of msrb2 and lpin1 on cross sections of the brain indicating induction in ependymal tissue during heart regeneration. n = 13 animals for each group. k, Schematic of inducing CM ablation and assessment of cardiac cebpd expression. l, ISH on heart sections indicating the induction of cebpd in epicardium and associated peripheral cells during heart regeneration. n = 20 CreER− and 43 CreER+ animals. Scale bars for a, b, h-j, l: 100 μm.
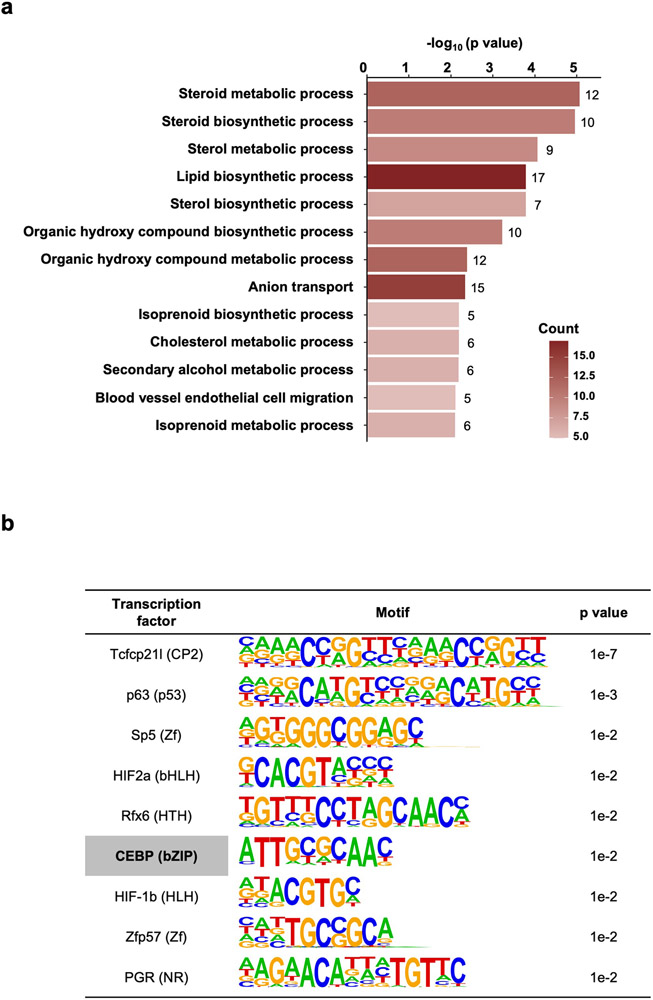
Among differentially expressed transcription factor genes, CCAAT enhancer binding protein delta (cebpd) showed the highest increase in RNA levels (Fig.1e). Cebpd is a basic-leucine zipper transcription factor encoded by an intronless gene. The rodent homolog C/EBPδ is expressed in various central nervous system cells and has been implicated in biological events like memory formation18, neurite outgrowth19, inflammation20, and energy metabolism21. HOMER analysis revealed enrichment of C/EBP binding motifs at the promoter regions of genes showing higher brain RNA levels during heart regeneration, suggesting transcriptional activation by Cebpd (Extended Data Fig.1b). By in situ hybridization (ISH), cebpd showed weak, if any, detectable expression in brains of uninjured zebrafish, but was notably induced in ependymal tissue lining ventricles of the telencephalon, optic tectum, hypothalamus and rhombencephalon during heart regeneration. We noted little or no expression in brain parenchymal compartments (Fig.1h). Several additional genes displayed similar expression features (Fig.1f,g,i,j), revealing a dynamic brain program instigated during heart regeneration, with ependymal layer cells as a prominent reactive population.
C/EBP transcription factors have been implicated in murine cardiac injury responses22. Zebrafish cardiac ventricles typically displayed low cebpd expression throughout muscle in the absence of injury, with variability among animals. We also observed occasional expression in epicardial cells that envelop the chamber. Upon induced CM ablation, cebpd expression was clearly and consistently detected in the epicardium and associated cells on the cardiac periphery at 7 dpi, revealing a local cebpd expression response (Fig.1k,l). Together, these findings implicate cebpd in both local and distant responses to cardiac regeneration.
cebpd expression is a selective response to injury
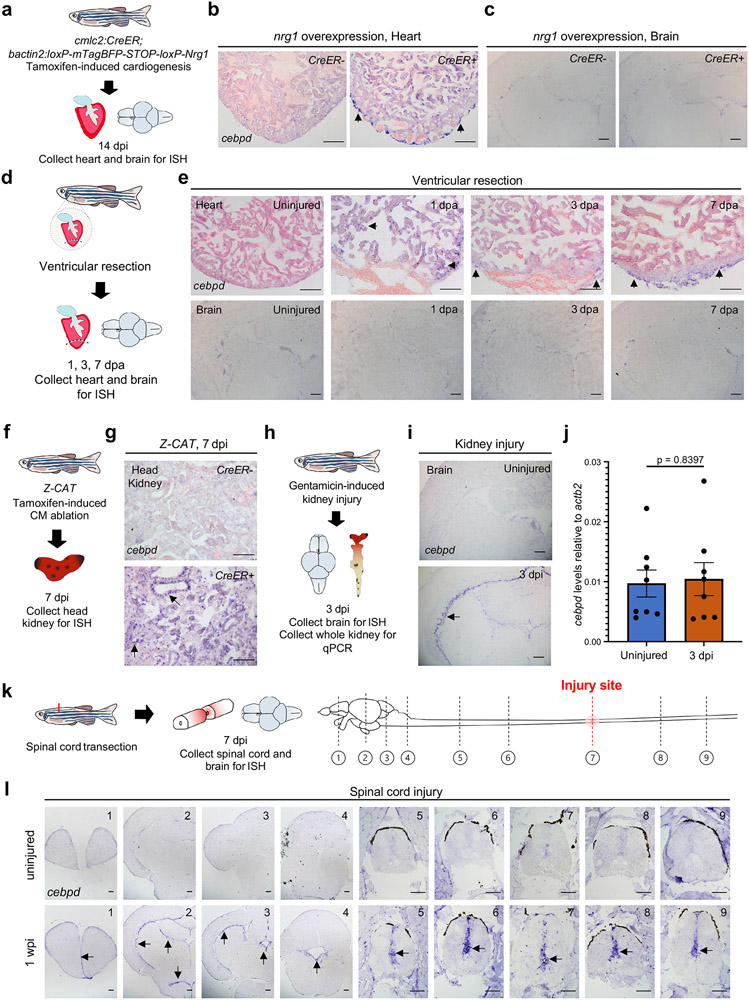
Local and distal induction of cebpd expression could conceivably be responsive to one or more components of heart regeneration. To decouple cardiogenesis from the injury response, we examined the effects on brain cebpd levels in a model of experimentally augmented CM proliferation. We induced myocardial expression of the pro-regenerative ligand Neuregulin 1 (Nrg1) for two weeks, which causes rapid muscle hyperplasia and hypervascularization of the cardiac ventricular wall23 (Fig.2a). While this protocol increased epicardial cebpd expression (Fig.2b), it yielded no detectable differences in brain cebpd ISH staining (Fig.2c), indicating that increases in brain cebpd expression are predominantly a response to cardiac injury rather than CM proliferation.
Fig. 2: cebpd expression features with different stimuli and in various tissues.
a, Schematic of induced cardiogenesis and tissue collection for cebpd ISH. b, ISH on heart sections indicating cebpd induction in epicardium during cardiogenesis. Arrows indicate violet ISH signals. n = 5 animals for both groups. c, ISH on brain sections indicating little or no cebpd induction in brain during induced cardiogenesis. n = 10 animals for both groups. d, Schematic of cardiac injury and tissue collection for cebpd ISH. e, (Top) ISH on resected hearts demonstrating cebpd induction in CMs at 1 dpa and in epicardium at 3 and 7 dpa. (Bottom) ISH on brain sections indicating little or no cebpd induction in brain after ventricular resection. For heart ISH, n = 5 animals for uninjured control, 1, 3 and 7 dpa. For brain ISH, n = 10 animals for uninjured, n = 15 animals for 1, 3 and 7 dpa. f, Schematic of CM ablation and head kidney collection for cebpd ISH. g, ISH of cebpd on kidney sections after CM ablation. cebpd is induced in kidney tubules after CM ablation. n = 8 CreER− and 9 CreER+ animals. h, Schematic of acute kidney injury and collection of brain for cebpd ISH and whole kidney for qPCR. i, ISH on brain sections indicating cebpd induction in optic tectum ependyma after kidney injury. n = 10 animals for uninjured and for 3 dpi. j, Quantitative PCR indicating no cebpd induction in kidney after kidney injury. n = 8 animals for both uninjured and 3 dpi. Mean ± S.E.M., Unpaired two tailed t-test was used to calculate p-values. k, Schematic of spinal cord transection and tissue collection for cebpd ISH. Diagrams illustrate the relative position of brain and spinal cord cross sections (in panel (l)) to the injury site. l, ISH on tissue cross sections, indicating cebpd induction in ependymal cells in the injured spinal cord and the brain. n = 15 animals for uninjured and n = 10 animals for 1 wpi. Dashed lines outline the central canal. Scale bars in b, c, e, g, i, l: 100 μm.
To determine whether distinct cardiac injuries other than genetic ablation induce cebpd in remote tissues, we partially resected ventricular apices and assessed cebpd expression by ISH (Fig.2d). Apical resection, like induced CM ablation, activates local regenerative programs; however, it differs in that it does not disrupt both chambers or elicit signs of heart failure like edema and reduced endurance16. Following resection, cebpd was induced in CMs at 1 day post resection/amputation (dpa), diminished in CMs but detectable in the epicardial layer by 3 dpa, and consistently expressed in wound epicardial cells at 7 dpa (Fig.2e). By contrast, we did not detect induction of cebpd in brain after cardiac resection injuries at any timepoint (Fig.2e), suggesting that brain cebpd activation is a selective response to cardiac damage that is severe enough to elicit heart failure.
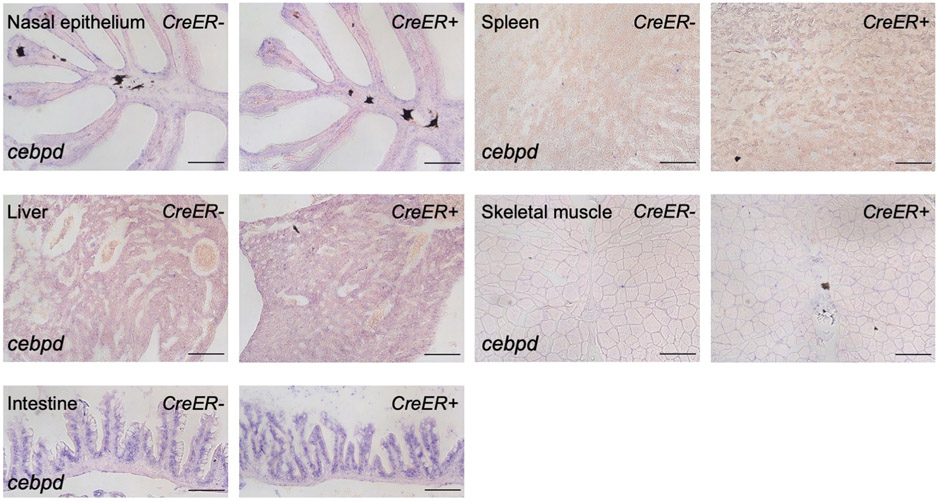
Next, we analyzed additional organs for cebpd expression after CM ablation. We noticed weak cebpd expression by ISH in renal marrow, glomeruli, and tubules of uninjured animals, and that expression in tubules increased prominently after cardiac injury (Fig.2f,g). We did not observe a comparable extent of cebpd induction in several other organs/tissues we examined (Extended Data Fig.2). Brain ependymal and renal tubular cells are in contact with cerebrospinal fluid (CSF) or tubular compartments, and a defining symptom of heart failure is venous congestion and edema24, 25, suggesting a possible relationship of cebpd induction with fluid regulation. To disrupt fluid homeostasis, we first induced acute kidney injury by intraperitoneal injection of gentamicin26 (Fig.2h). cebpd was induced in the brain ventricular lining by 3 days post injection without detectable renal induction (Fig.2i,j). Next, we performed full spinal cord transections, mechanically disrupting CSF dynamics (Fig.2k). At 1 week post spinal cord injury (wpi), cebpd was prominently induced in ependymal cells surrounding the central canal. Notably, cebpd expression was not localized exclusively to the site of transection, but induced uniformly along the anteroposterior axis of the spinal cord and rostrally into the brain ependyma (Fig.2l). These findings, in addition to results we describe later, suggested a mechanism in which remote injury-induced brain cebpd expression is influenced at least in part by alterations in fluid control compartments.
cebpd mutations alter local and distant injury responses
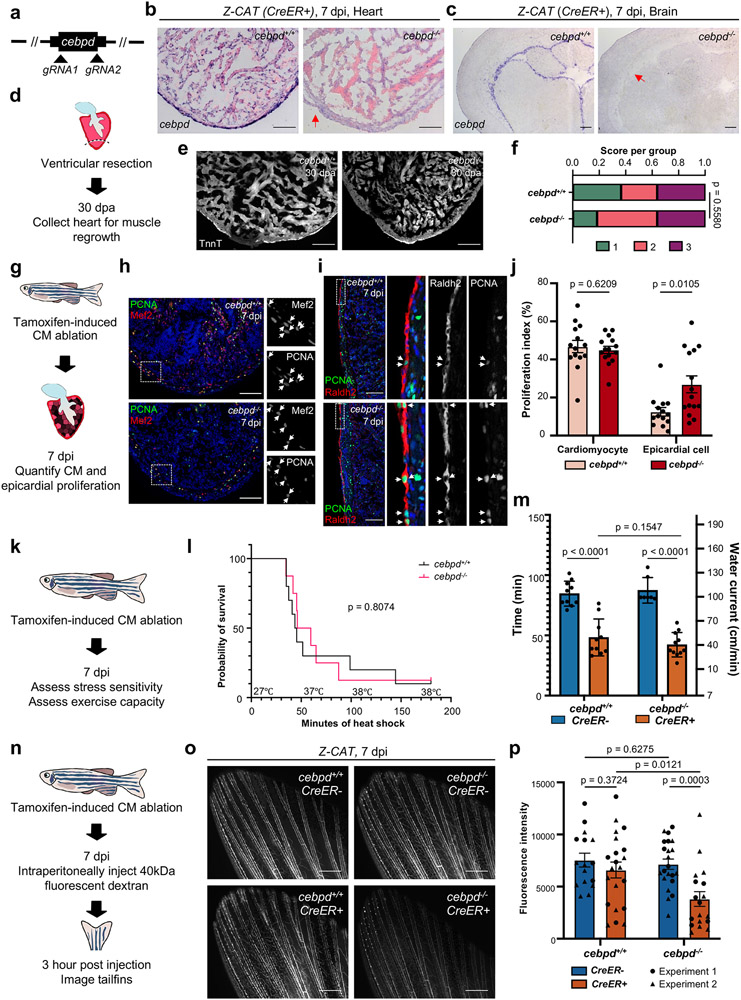
To determine if cebpd has required functions during heart regeneration, we deleted the majority of the cebpd coding sequence using CRISPR-Cas9 methods, removing all detectable cebpd expression (Fig.3a-c). cebpd homozygous mutants survived normally to adulthood and were fertile.
Fig. 3: Local and remote Cebpd requirements during heart regeneration.
a, Schematic of cebpd deletion. b,c, cebpd transcript is undetectable in cebpd−/− hearts and brains by ISH after genetic CM ablation. Red arrow indicates loss of ISH signals in cebpd−/− tissues. Loss of cebpd expression was confirmed for all experiments performed with cebpd−/− animals. d, Schematic of cardiac regeneration study. e, Sections of cardiac ventricles in wild-type and cebpd−/− animals, stained with Troponin-T antibody. n reported in (f). f, Semiquantitative assessment of cardiac injuries. 1: Robust regeneration. 2: Partial regeneration 3: Blocked regeneration. Single trial with n = 11 animals for each group. Fisher’s exact test. g, Schematic of cardiac cell proliferation study. h, Sections of 7-day post CM ablation ventricles stained for CM nuclei (Mef2; Red) and cell cycling (PCNA; Green). White arrows indicate proliferating CMs. n reported in (j). i, Sections of 7-day post CM ablation ventricles stained for epicardium (Raldh2; Red) and cell cycling (PCNA; Green). Arrows indicate cycling epicardial cells. Single channel images of single confocal slice in greyscale. n reported in (j). j, Quantification of data from (h, i). Single trial with n = 14 cebpd+/+ and 15 cebpd−/− animals. Mean ± S.E.M., Two-tailed Mann Whitney test. k, Schematic of inducing CM ablation and assessment of heart failure. l, Survival curves of heat-stressed zebrafish during heart regeneration. Single trial with n = 10 cebpd+/+ and n = 8 cebpd−/− animals. Log-rank (Mantel-Cox) test. m, Assays for swim capacity during heart regeneration. Single trial with n = 11 CreER− and 10 CreER+ cebpd+/+ animals, and n = 7 CreER− and 11 CreER+ in cebpd−/− animals. Mean ± S.D., unpaired two-tailed Student’s t-test. n, Schematic of experiments assessing fluorescent dye transfer into vasculature. o, Fluorescence images indicating inefficient dye transfer in injured cebpd−/− animals. p, Quantification of experiments in (o). Two independent trials with n = 16 CreER− and 21 CreER+ cebpd+/+ animals, and n = 22 CreER− and 18 CreER+ cebpd−/− animals. Mean ± S.E.M., unpaired two-tailed t-test. Scale bars in b, c, e, h, i: 100 μm. Scale bars in o: 500 μm.
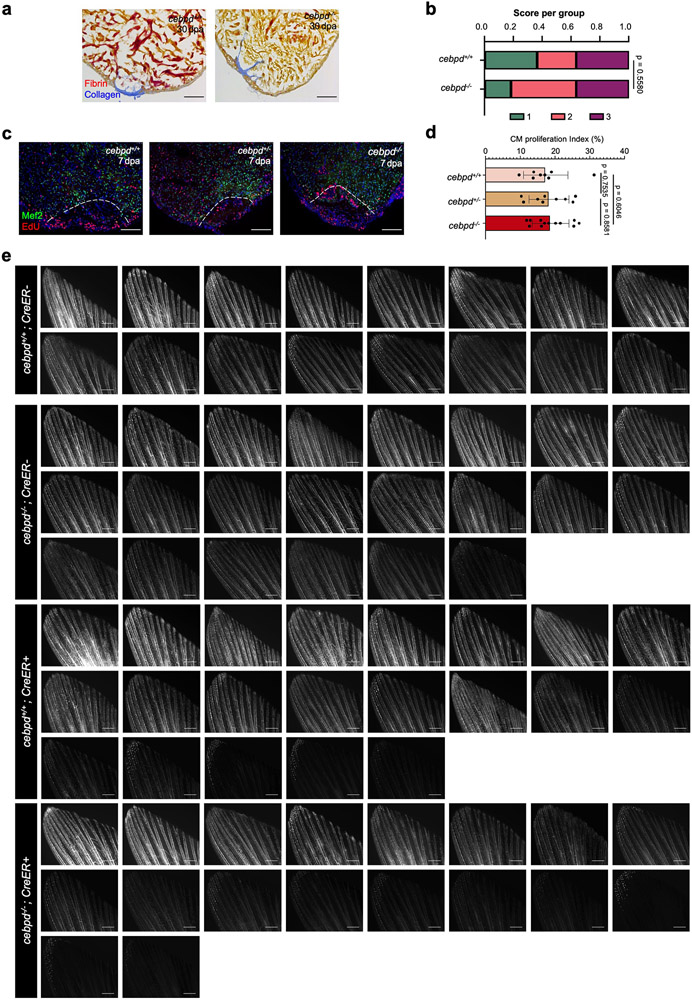
To assess effects of cebpd mutations on heart regeneration, we first performed ventricular resection and examined cardiac anatomy 30 days later. We found no gross differences in muscularization or scarring in cebpd mutants (Fig.3d-f, Extended Data Fig.3a,b). The proliferative capacity of CMs was normal, either after ventricular resection (Extended Data Fig.3c,d) or induced genetic CM ablation (Fig.3g,h,j). We also quantified proliferation indices in epicardium, the local site of cebpd induction. The ability of the epicardium to proliferate and express developmental genes, a phenomenon known as ‘epicardial activation’, has been described in several studies22, 27. C/EBP transcription factors were reported to mediate the expression of epicardial gene retinaldehyde dehydrogenase 2 (Raldh2) in murine epicardium after ischemia/reperfusion injury22. We did not observe differences in epicardial Raldh2 staining in regenerating hearts after CM ablation (Fig.3i). However, cebpd mutant animals displayed a ~111% increase in the epicardial proliferation index after cardiac injury (Fig.3g,i,j). Thus, Cebpd is required, either directly or indirectly, for tempering epicardial proliferation in response to cardiac injury.
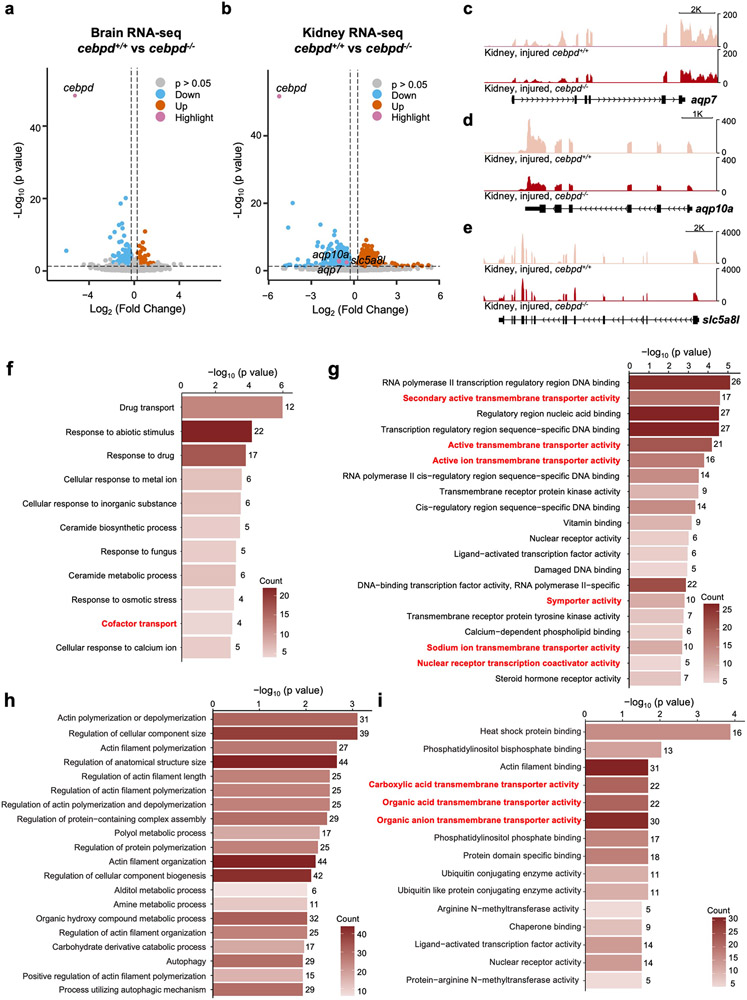
To investigate effects of cebpd mutations on distant responses, we first assessed exercise capacity and stress sensitivity of cebpd mutants in the context of CM ablation-induced heart failure, finding no differences (Fig.3k-m). We next adapted published techniques to test fluid regulation in cebpd mutants, labeling the interstitial fluid by fluorescent dye injection (Fig.3n)26, 28. cebpd mutant fish displayed a similar capacity as wild-type clutchmates to transfer fluid solutes to vasculature in the absence of injury (Fig.3o,p, Extended Data Fig.3e). Notably, whereas severe cardiac injury did not change the dynamics of dye transfer in wild-type zebrafish, cebpd mutants displayed a ~46% reduction in transfer versus when uninjured (Fig.3o,p, Extended Data Fig.3e). Transcriptome sequencing of cebpd−/− tissues revealed decreased RNA levels of the aquaporins aqp7 and aqp10a in cebpd−/− kidneys during heart regeneration, consistent with altered renal water regulation (Extended Data Fig.4c,d). GO analysis of differentially expressed genes indicated enrichment of transmembrane transporter activities in brain and kidney, including the zebrafish ortholog of the described Cebpd-regulated renal lactate transporter SLC5A8 (slc5a8l)29 (Extended Data Fig.4e-i; Supplementary Table 2,3). Altogether, our experiments indicate that Cebpd is involved in a local response to cardiac injury, epicardial proliferation, as well as a remote response, intercompartmental fluid exchange.
Regulatory sequences for remote gene expression responses
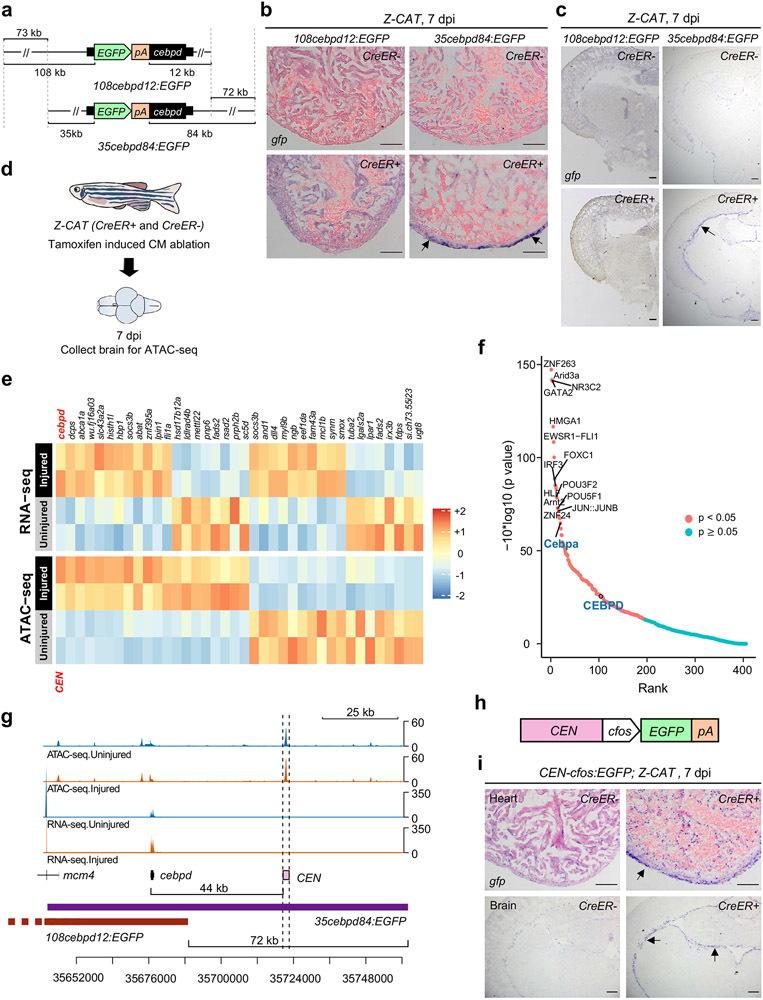
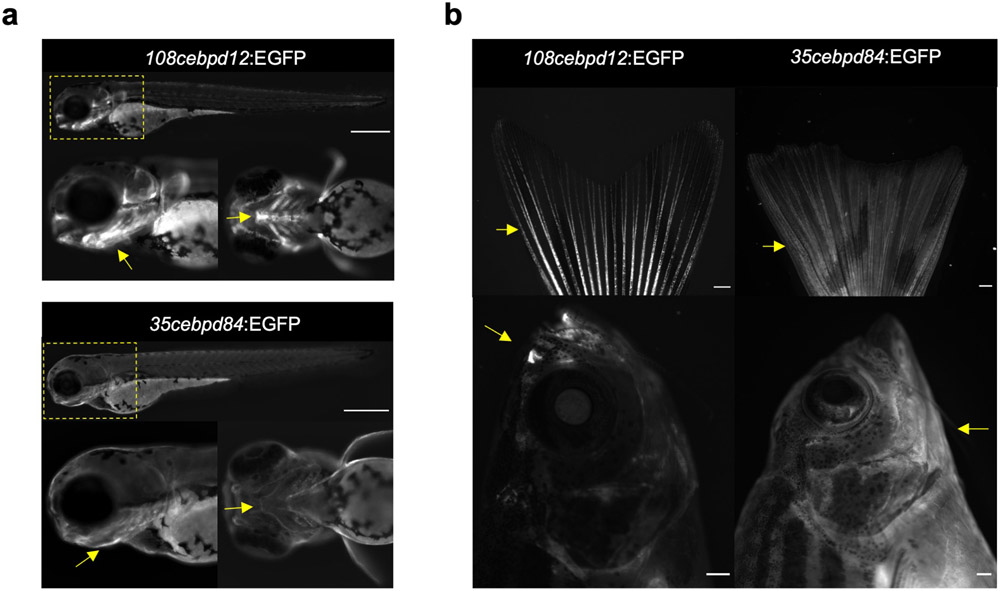
To understand how cebpd levels are controlled during heart regeneration, we searched for key cis-regulatory elements. First, we established transgenic reporter fish using large BAC sequences surrounding cebpd coding sequences, replacing the cebpd start codon with an EGFP-polyA cassette. One BAC line (108cebpd12:EGFP) contained 108 kb upstream and 12 kb downstream sequences with respect to the cebpd start codon (Fig.4a), whereas a second line (35cebpd84:EGFP) included 35 kb upstream and 84 kb downstream sequences (Fig.4a). The two lines displayed differences in EGFP signals that persisted from larval to adult stages, most distinctly visualized in caudal fin and head structures (Extended Data Fig.5a,b). Upon induced CM ablation, 35cebpd84:EGFP fish sharply increased reporter gene expression locally in cardiac tissue and distally in the ventricular lining of the brain (Fig.4b,c), mimicking endogenous cebpd patterns. By contrast, we did not detect EGFP reporter gene expression in hearts or brains of injured 108cebpd12:EGFP fish (Fig.4b,c). We infer from these findings that a ~72 kb region downstream of the cebpd start codon contains sequences key for directing cebpd expression during cardiac regeneration.
Fig. 4: Profiling and transgenesis identify an enhancer downstream of cebpd that responds to injury.
a, Schematic of two cebpd:EGFP BAC transgenic constructs (108cebpd12:EGFP and 35cebpd84:EGFP) comprising different genomic regions surrounding cebpd. b, ISH on heart sections demonstrating gfp induction locally in 35cebpd84:EGFP hearts at 7 days after induced CM ablation (dpi). No gfp ISH signals were detected in uninjured or injured 108cebpd12:EGFP hearts. n = 10 CreER− and 11 CreER+ animals for 108cebpd12:EGFP, and n = 13 CreER− and 11 CreER+ animals for 35cebpd84:EGFP. Transgene expression was assayed by ISH (arrows indicate violet signals), as basal EGFP fluorescence in some tissues can reduce sensitivity. c, ISH showing induced gfp expression in 35cebpd84:EGFP brains after CM ablation. gfp ISH signals are not evident in 108cebpd12:EGFP brains after heart injury. n = 10 CreER− and 9 CreER+ animals for 108cebpd12:EGFP, and n = 9 animals for CreER− and CreER+ groups in 35cebpd84:EGFP. d, Schematic of CM ablation and brain collection for ATAC-seq. e, Heat maps of RNA-seq and ATAC-seq data representing putative enhancer elements linked to genes with significant transcriptional changes in the brain after a cardiac injury. The heatmap is rescaled by row using the pheatmap R package. f, BiFET analysis indicating enriched transcription factor motifs within brain open chromatin regions after cardiac injury. Red: p < 0.05. Blue: p ≥ 0.05. Peaks are analyzed based on hypergeometric distribution and p value was adjusted by Benjamin-Hochberg procedure. g, Browser track indicating chromatin accessibility (top: average of three samples) and transcript levels (average of two samples) at the cebpd locus, indicating the candidate cebpd-linked enhancer CEN with dashed lines. CEN is located 44 kb downstream of cebpd and increases accessibility after CM ablation. Fold change = 0.33, p = 0.008. h, Components of the CEN-cfos:EGFP transgene. i, ISH of gfp on heart and brain sections indicating the induction of gfp in injured CEN-cfos:EGFP hearts and brains after cardiac injury. n = 5 animals for CreER− and CreER+ groups. Scale bars in b, c, i: 100 μm.
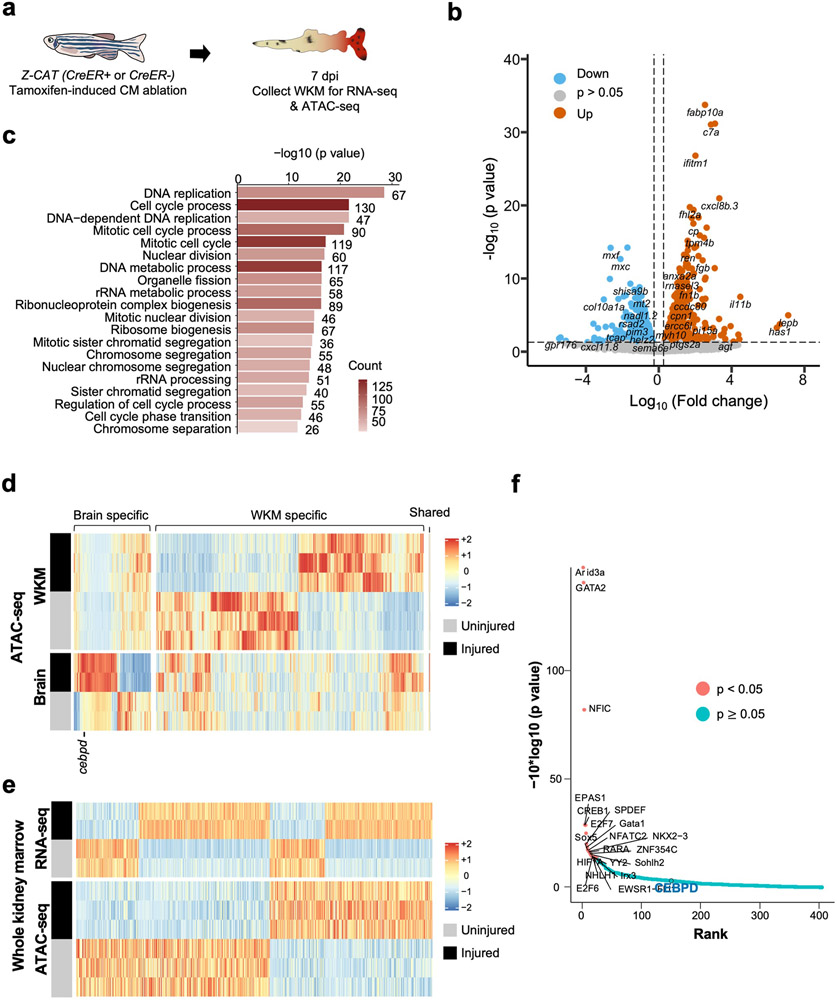
We hypothesized that one or more DNA regulatory elements responsible for distant injury-activated expression of cebpd in brain exists within the identified 72 kb sequences. To locate these, we used Assay for Transposase-Accessible Chromatin using sequencing (ATAC-seq) to assess samples of whole brain open chromatin sequences from uninjured fish or those subjected to CM ablation30 (Fig.4d). From this assay, we identified 1386 regions with increased chromatin accessibility and 1071 with reduced accessibility (p < 0.05) (Supplementary Table 4). Transcriptomes and chromatin accessibility of whole kidney marrow (WKM) revealed a largely distinct set of induced genes and accessible regions, indicating tissue specificity (Extended Data Fig.6a-f, Supplementary Table 5-8). Bias-free transcription factor Footprint Enrichment Test (BiFET) sequencing analysis revealed overrepresentation of predicted binding sites for C/EBP family members (Cebpa and Cebpd; p < 0.05) in sequences within brain chromatin that increase accessibility during heart regeneration (Fig.4f; Supplementary Table 9), suggesting that Cebpd has preferential access in this context. Other top enriched motifs were for factors involved in brain development and function (POU5F1, FOXC1, POU3F2, ZNF24), hematopoiesis (Arid3a, GATA2, HLF), tissue damage and healing (EWSR-FLI1, JUN:JUNB), hormone responses (NR3C2), hypoxia responses (Arnt2), and inflammation and immune responses (HMGA1, IRF3) (Fig.4f; Supplementary Table 9).
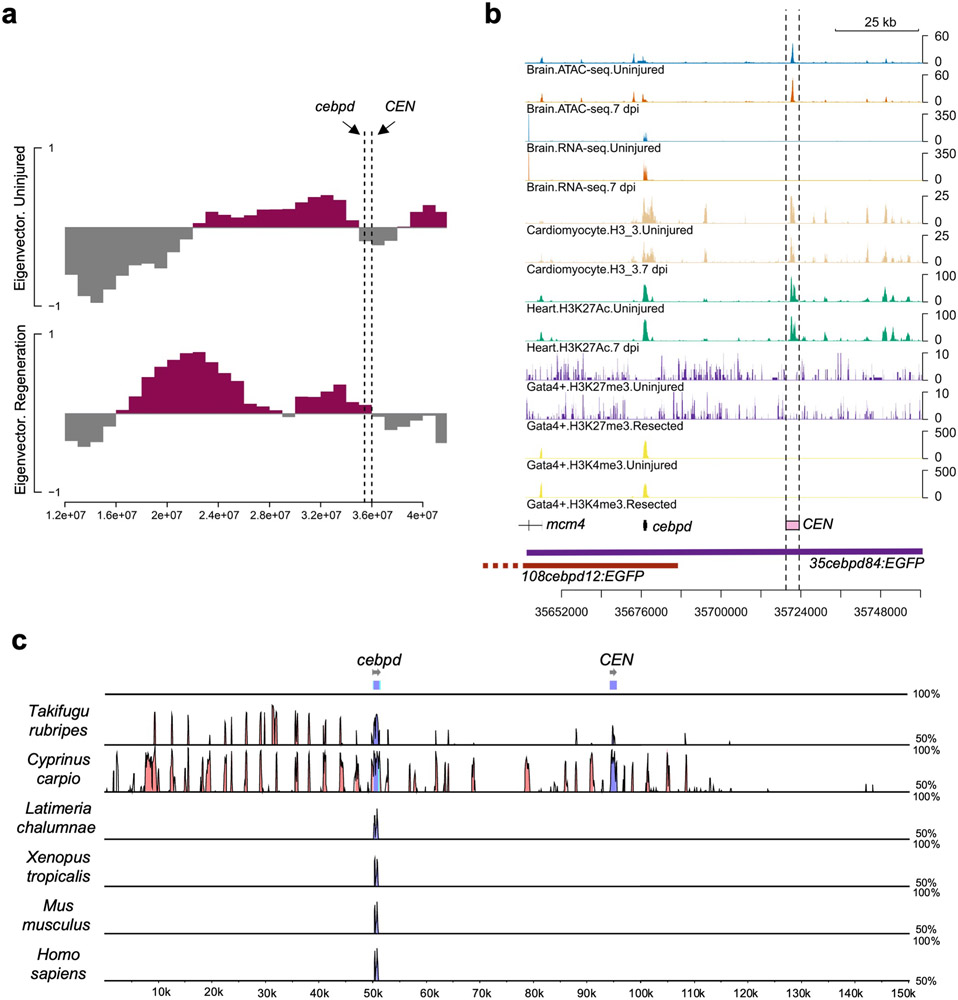
We bioinformatically assigned regions identified by ATAC-seq to their closest transcriptional start site (TSS), finding 50 regions associated with differentially expressed genes in the brain during heart regeneration (Fig.4e; Supplementary Table 10). Of regions with significantly increased accessibility, a portion are linked to genes with increased RNA levels, indicative of potential enhancers. Within the 72 kb cebpd downstream region covered only by 35cebpd84, we identified a 1.2 kb sequence located ~44 kb downstream of cebpd showing particularly high accessibility in the absence of injury (referred to hereafter as cebpd-linked enhancer (CEN)) (Fig.4g). CEN increased accessibility further after CM ablation. A/B Compartmentalization analysis indicated a conversion of cebpd and CEN regions from B compartment to A compartment after heart injuries Extended Data Fig.7a), suggesting changes in chromatin architecture at CEN from a relatively closed (transcriptional inactive) to relatively open (active) environment. Analysis of regions upstream and downstream of cebpd genes in multiple species revealed high conservation of CEN in genomes of the teleosts fugu and carp but not in coelacanth, Xenopus, murine, and human genomes (Extended Data Fig.7c). In summary, profiling revealed many candidate enhancers to influence gene expression in brain during heart regeneration, with one of these sequences, CEN, contained within the large, regeneration-responsive region downstream of cebpd coding sequences.
Tissue regeneration enhancer elements (TREEs) are a class of regulatory elements with the capacity to trigger expression of a gene specifically or preferentially during a regeneration context31, 32. TREEs have been inferred through epigenetic profiles or experimentally validated by transgenesis in many species and regeneration settings33. To test whether CEN has properties of a TREE, we fused CEN to the minimal promoter cfos and reporter gene EGFP and established stable transgenic lines (Fig.4h). We then genetically induced CM ablation and collected heart and brain tissues. We found that cardiac injury activated reporter gene expression, both locally in epicardium of injured hearts and remotely in the ependymal lining of brains (Fig.4i). These results indicate that CEN contains DNA sequences that are sufficient to activate gene expression in local and distant tissues during heart regeneration.
Corticosteroid receptors regulate distant cebpd expression
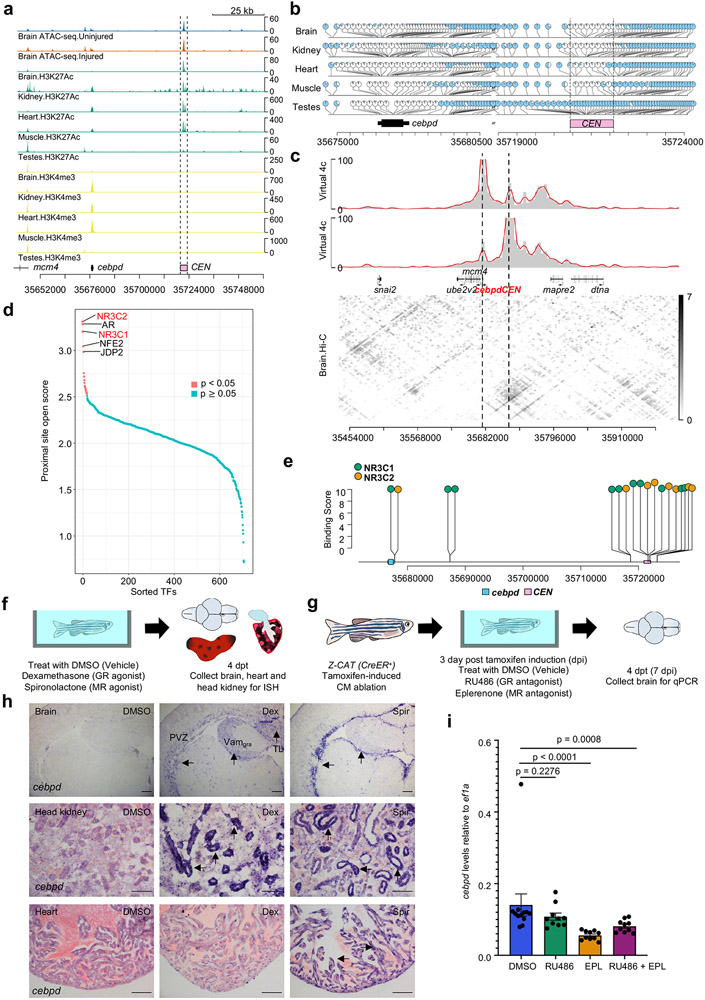
To investigate mechanisms by which CEN controls cebpd expression, we analyzed recently published genome-wide datasets for histone modifications, DNA methylation, and DNA-DNA interactions in many zebrafish tissues34. In adult brain, kidney, heart, and skeletal muscle, CEN is associated with marks indicative of active enhancers, including H3K27Ac enrichment (Fig.5a), H3K4me3 deficiency (Fig.5a), and low CpG methylation (Fig.5b). By contrast, CEN is highly methylated and associated with weak H3K27Ac signals in testes samples (Fig.5a,b). Hi-C analysis of genome-wide, three-dimensional chromatin organization indicated strong interactions between CEN and the cebpd promoter region in uninjured brain tissue. Three additional chromatin regions adjacent to cebpd and CEN also showed apparent contact with the cebpd promoter and CEN (Fig.5c). These data suggest that CEN physically associates with cebpd and exists within brain chromatin in an environment permissive for transcription factor binding.
Fig. 5: Corticosteroid signals regulate distant cebpd expression during heart regeneration.
a, Browser tracks of brain ATAC-seq before and after CM ablation, and H3K27Ac and H3K4me3 occupancy of adult brain, kidney, heart muscle and testes. CEN (dashed lines) is open and associated with high levels of H3K27Ac and low levels of H3K4me3 in tissues other than testes. Three biologically independent samples are included for ATAC-seq, and two for ChIP-seq. b, Whole-genome bisulfite sequencing of samples from adult tissues indicating low methylation levels in CEN and cebpd gene regions, with highly methylation in testes. One biological sample for each group. c, Hi-C contact matrix and virtual 4C using the cebpd promoter (top) and CEN (bottom) as bait regions, indicating interactions between CEN and the cebpd gene region in brain. Hi-C data from two biological samples were pooled for each group. d, Footprint analysis reveals enriched binding for NR3C2, AR, and NR3C1 during cardiac regeneration. e, Lollipop plot illustrating predicted NR3C1 and NR3C2 binding sites near cebpd and CEN. f, Schematic of experiments assessing cebpd expression by ISH after agonist treatment. g, Schematic of experiments assessing cebpd expression by qPCR after cardiac injury and antagonist treatment. h, ISH of cebpd on brain (top), head kidney (middle) and heart (bottom) sections after agonist treatment. cebpd is consistently induced in brain and kidney, and only in occasional cases in heart by spironolactone. For brain and head kidney ISH, n = 19 for vehicle, 21 for dexamethasone, 25 for spironolactone. For heart ISH, n = 15 animals for each treatment. Eight of 15 spironolactone-treated animals displayed induction of cebpd expression in heart. Black arrows indicate violet ISH signals. Dex: dexamethasone, Spir: spironolactone. PVZ: periventricular grey zone, Vamgra: the granular layer of the medial division of valvula cerebelli, TL: torus longitudinalis. Black arrows indicate violet ISH signals. Scale bars: 100 μm. i, Quantitative PCR indicating lower cebpd RNA levels in brain after eplerenone, or RU486 plus eplerenone, treatments during heart regeneration. n = 12 animals for DMSO treatment and n = 10 animals for other groups. EPL: eplerenone. Mean ± S.E.M., two-tailed Mann Whitney test.
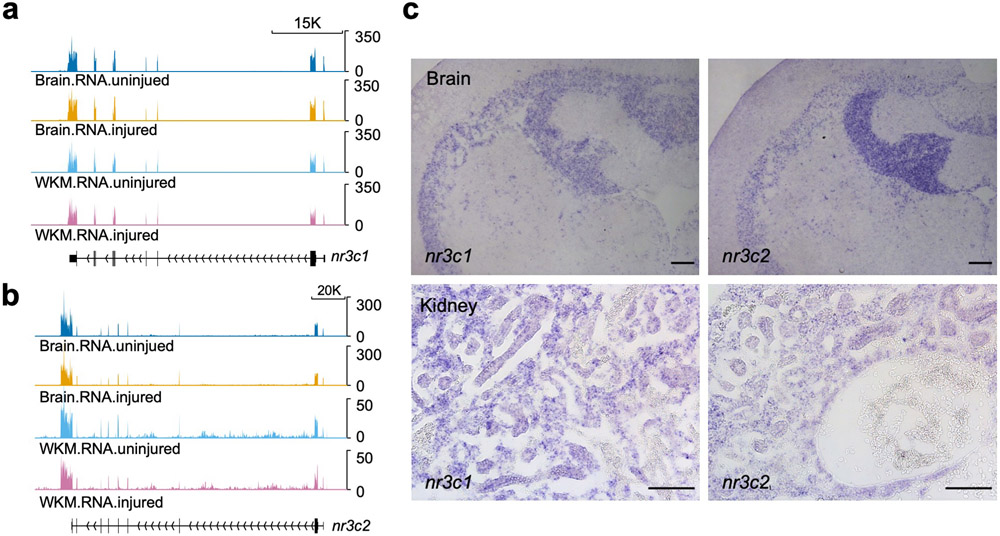
Footprint analysis of ATAC-seq data implicated enriched binding of several hormone receptor transcription factors in the brain during heart regeneration, including glucocorticoid receptor (Nr3c1) and mineralocorticoid receptor (Nr3c2) (Fig.5d; Supplementary Table 11)35. Several predicted binding sites for Nr3C1 (z score = 6.575 and p value = 0.0026 by permutation test) and Nr3C2 (z score = 5.829 and p value = 0.0049) are present within CEN (Fig.5e). The expression of genes encoding these receptors were detectable in brain transcriptomes by RNA sequencing, and in ependymal cells and renal tubules by ISH (Extended Data Fig.8a-c). Glucocorticoids can induce cebpd both in vivo and in vitro in various cell types36, including the context of stress-induced peripheral nerve regeneration37. We speculated that glucocorticoid receptors (GRs) and mineralocorticoid receptors (MRs) in zebrafish brain ependymal cells are activated and bind to CEN to initiate cebpd transcription and Cebpd-dependent programs during heart regeneration.
To determine if corticosteroid receptors regulate cebpd expression, we first treated uninjured adult zebrafish by bath incubation with dexamethasone, the zebrafish GR agonist, or spironolactone, the zebrafish MR agonist38, 39 (Fig.5f). Spironolactone treatment induced strong cebpd expression in ependymal cells lining the brain ventricular zone, mimicking brain cebpd expression pattern during heart regeneration. Dexamethasone treatment induced cebpd in multiple brain areas, including both the ependymal layer and the neuronal layer of the periventricular grey zone, the granular layer of the medial division of valvula cerebelli, and the torus longitudinalis (Fig.5h). We also incubated animals with agonist and collected head kidneys for ISH, finding similar robust cebpd induction in renal tubules upon treatment (Fig.5h). Spironolactone occasionally induced cebpd expression in CMs, but not epicardial cells (Fig.5h). We further examined whether treatment with GR (RU486) or MR (eplerenone) antagonists after cardiac injury affected the brain cebpd expression response, finding that eplerenone or eplerenone plus RU486 incubation partially reduced cebpd expression (Fig.5g,i). Our results implicate corticosteroid receptor signaling, and likely additional factors, in the regulation of remote cebpd expression during heart regeneration.
CEN is required for remote cebpd expression and function
To formally test whether CEN is required to direct cebpd expression during heart regeneration, we removed CEN from the zebrafish genome using CRISPR-Cas9 methods (Fig.6a). CEN−/− animals survived normally, and cebpd expression was low or undetectable by ISH in the heart, brain or kidney from uninjured CEN−/− fish, as in wild-type siblings.
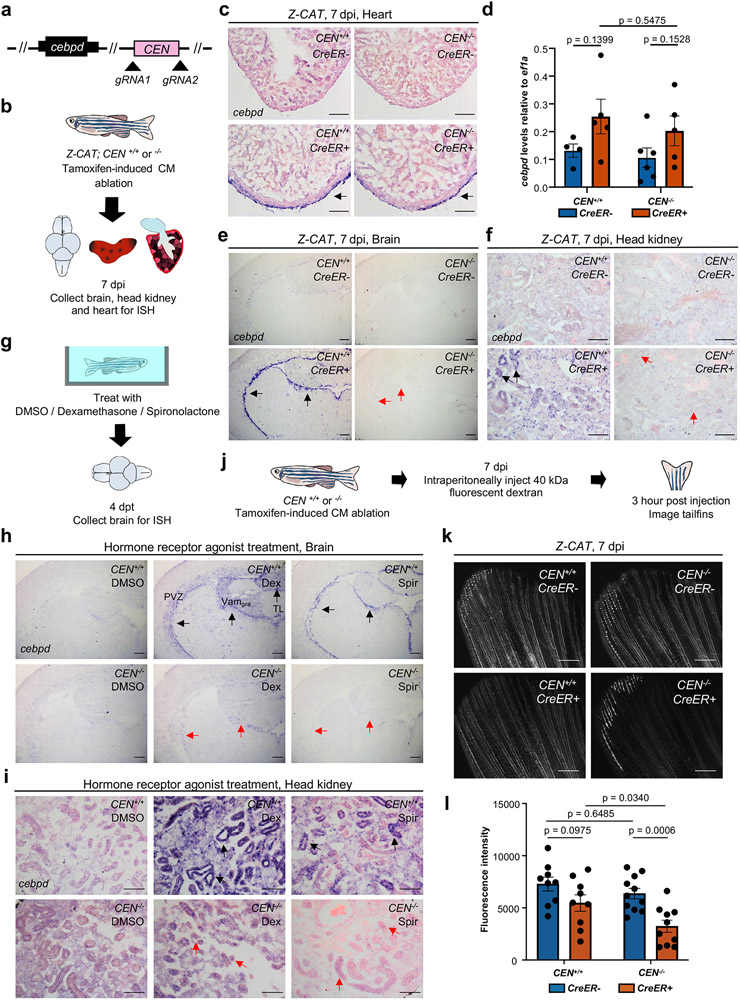
Fig. 6: CEN is required for distant cebpd activation and fluid regulation after cardiac injury.
a, Schematic of CEN deletion. b, Schematic of CM ablation in wild-type or CEN−/− fish and tissue collection for cebpd ISH. c, ISH indicating normal cebpd induction in injured CEN−/− hearts. n = 6 animals for all groups. Arrows indicate ISH signals (violet). d, qPCR for cardiac cebpd RNA levels. n = 4 CreER− and 5 CreER+ biologically independent samples for CEN+/+ animals, and n = 6 CreER− and 5 CreER+ biologically independent samples for CEN−/− animals. Five hearts were pooled for each biological sample. Mean ± S.E.M., unpaired two tailed t-test. e, ISH indicating no cebpd induction in CEN−/− brains after cardiac injury. n = 22 CreER− and 20 CreER+ animals for CEN+/+, and n = 18 CreER− and 16 CreER+ animals for CEN−/−. Black arrows indicate ISH signals. Red arrows indicate loss of ISH signals. f, ISH indicating no cebpd indcution in CEN−/− kidneys by cardiac injury. Arrows as in (e). n = 8 CreER− and 9 CreER+ animals for CEN+/+, and n = 6 CreER− and 4 CreER+ animals for CEN−/−. g, Schematic of agonist treatment and tissue collection for cebpd ISH. h, ISH indicating that CEN is required for cebpd induction in brain by GR or MR agonists. n = 34 (vehicle), 36 (dexamethasone), 40 (spironolactone) animals for CEN+/+. n = 13, 8, and 17 animals for CEN−/−. Arrows as in (e). Abbreviations as in Fig.5. i, ISH indicating that CEN is required for cebpd induction in kidney by GR or MR agonists. Animal numbers as in (h). j, Schematic of experiments assessing fluorescent dye transfer into vasculature. k, Fluorescence images indicating inefficient dye transfer in injured CEN−/− animals. l, Quantification of experiments in (k). Single trial with n = 9 animals for both CEN+/+ groups, and n = 11 animals for CreER− and 10 animals for CreER+ in CEN−/− groups. Mean ± SEM, unpaired two-tailed t-test. Scale bars in c, e, f, h, i: 100 μm. Scale bars in k: 500 μm.
First, we assessed cebpd expression in CEN mutant tissues at 7 days after CM ablation. CEN mutations caused no detectable changes in cebpd expression in regenerating hearts by ISH, with epicardial expression similar to wild-type clutchmates (Fig.6c). This finding was consistent with qPCR analysis, which revealed normal elevation of cebpd transcript levels upon injury (Fig.6d). Notably, we detected little or no cebpd expression in CEN−/− brain ependymal cells or renal tubular cells, consistent with selective absence of this injury response (Fig.6e,f). Furthermore, deletion of CEN substantially reduced corticosteroid-induced cebpd expression in the brain and kidney (Fig.6g-i). This finding indicates that CEN contains sequences essential for steroid hormone-induced cebpd expression in tissues that also display remote expression responses upon heart injury, and further implicates GRs and MRs in remote regulation of cebpd after cardiac injury. Published datasets describing cardiac chromatin during heart regeneration indicates many sequences surrounding cebpd enriched with active histone marks or deficient in repressive marks4, 31,40, suggesting additional regulatory features that provide redundancy in epicardial cells. By contrast, CEN was the only prominent region with high accessibility reads above background in the 72 kb downstream of cebpd in brain chromatin of animals receiving cardiac injuries (Extended Data Fig.7b).
Next, we tested whether mutations in the CEN-regulated remote circuit caused similar alterations as cebpd coding sequence mutations in fluid regulation. We found a ~49% reduction in transfer of fluorescent dye from intraperitoneal to vasculature compartments in CEN mutant fish after cardiac injuries, compared with their uninjured mutant siblings (Fig.6j-l, Extended Data Fig.9), indicating that CEN-mediated cebpd induction is required to restore fluid dynamics perturbed by severe cardiac injury.
Discussion
Here, we provide a case example of a gene, cebpd, that is involved in tissue repair proximate to an injury event, as well as in physiological sequalae that can impact remote tissues. We show by profiling and molecular genetics in zebrafish that the framework of enhancer regulatory elements surrounding a gene makes possible this division of labor (Extended Data Fig.10). We postulate that the available binding proteins and local chromatin environment distinguish expression responses in various tissues near and far from an injury event, through selection from the menu of TREEs. The TREE we describe, CEN, can detect hormone signals and instruct gene expression away from the injury in brain and kidney cells. We refer to CEN and other such regulatory sequences as ‘remote-TREEs’ (r-TREEs), as they represent a subclass with sentinel abilities to detect distant injuries. Candidate r-TREEs reported here were inferred from bulk tissue chromatin profiling, which likely masks the identification of r-TREEs. Assessment of purified cell populations, or use of single cell-based profiling technology, could resolve the heterogeneity of responses in complex tissues and increase the success of identifying r-TREEs in poorly represented cell populations41. Moreover, although dynamism of chromatin accessibility has identified enhancers responding to local injuries in multiple studies4, 42-44, DNA sequences in an already open state like CEN can conceivably function as r-TREEs, thus increasing the importance of in vivo enhancer validation assays.
Broadly, our study highlights gene regulation and physiological responses at the level of whole-animal biology during tissue regeneration. We show evidence that distant cebpd induction during heart regeneration is regulated by signaling through GR and/or MR. Functions of corticosterone and related hormones have been examined in multiple species and regeneration contexts; these factors are stable in circulation and can impinge on a variety of physiological targets that can impact regeneration including pain, behavior, fluid regulation, temperature regulation, and recruitment of inflammatory and immune cells11, 13, 14, 45-59. These and other distant responses must integrate with morphogenetic responses of cells at the injury site in the cinematography of regeneration. Understanding control of the enhancer landscape in cells throughout a regenerating organism can reveal systems-level gene regulation that deepens our knowledge of how and why regeneration occurs.
Methods
Zebrafish
Procedures involving the use of animals under ethical guidelines were approved by the Institutional Animal Care and Use Committee at Duke University (protocol #A005-21-01). Wild-type and transgenic fish used in this study are of the outbred Ekkwill strain. Embryos are raised in 28°C egg water until 5 dpf and then transferred to the aquarium system. Adult fish of both sexes 4-12 months old were used in this study unless specified in the text. All animal models used in this manuscript are summarized in Supplementary Table 12a.
For CM ablation, Z-CAT fish (Tg(cmlc2:CreER; bactin2:loxp-mCherry-STOP-loxp-DTA)) were treated with 0.5-0.7 μM tamoxifen (T5648, Sigma-Aldrich) for 17 h16. Tamoxifen treated CreER− fish were used as uninjured controls in all genetic ablation experiments. Hearts, brains and kidneys were collected for histological assays at 7-day post tamoxifen incubation (7 dpi).
For cardiac ventricle resection, adult fish were anesthetized and placed ventral side up on sponge. A small incision was made with straight iridectomy scissors to open the pericardial sac and 20% of cardiac ventricle was removed using curved iridectomy scissors5. Hearts and brain are collected at 1, 3 or 7 day post amputation (dpa) for histological analysis.
To induce CM proliferation without injury, zebrafish with transgenes Tg(cmlc2:CreER; bactin2:loxp-bfp-STOP-loxp-nrg1) were treated with 5 μm tamoxifen for 24 h 23. CreER− fish were employed as controls. Brains were harvested at 14 days post tamoxifen incubation (dpi) for histology assays.
For spinal cord transection injury, adult zebrafish were anesthetized and a small incision was made dorsally at the midpoint between the brainstem and dorsal fin. Complete spinal cord transection was accomplished using straight iridectomy scissors 60. Spinal cord and brain were collected at multiple timepoints for histological assays as indicated in the text.
To induce acute kidney injury, adult zebrafish were anesthetized and placed ventral side up on sponge. A single dose of 40 μg gentamicin (15750060, Invitrogen) was intraperitoneally injected into zebrafish. At 3 days post gentamicin injection, brains and kidney were collected for histology assays and quantitative PCR.
Generation of cebpd mutant zebrafish
The cebpd knockout allele was generated with a pair of guide RNAs using CRISPR/Cas9 technology. The gRNAs were designed using the CHOPCHOP website61, and the target sequences were 5’- GCCCAGCTCATGTTGCATGGTGG-3’ and 5’CGAAGCCTCGTTTGGGTCGGCGG-3’, with PAM sequences underlined. gRNAs were generated through in vitro transcription using T7 RNA polymerase and co-injected with Cas9 protein (CP01-200, PNA Bio) into one-cell stage embryos. Animals with cebpd knockout alleles are screened by PCR with primers cebpdseq1: 5’-ACACTTTCCTTGGGACAGCC-3’ and cebpdseq2: 5’-CCATCATCGTCGTCTAACGTGTAAC-3’. The wild-type allele is identified by PCR with primers cebpdseq1: 5’-ACACTTTCCTTGGGACAGCC-3’ and cebpdseq3: 5’-CTCCATGGCCCAGCTCATG-3’. Deletions were confirmed by Sanger sequencing (Eton Bioscience Inc.). The allele designation for this line is pd354.
Generation of TgBAC(108cebpd12:EGFP) and TgBAC(35cebpd84:EGFP) zebrafish
The BAC clone CH211-177E23 includes 108 kb upstream and 12 kb downstream sequences of the cebpd start codon (Supplementary Table 12d). The BAC clone CH211-180G16 include 35 kb upstream and 84 kb downstream sequences of the cebpd start codon (Supplementary Table 12d). The 108cebpd12:EGFP and 35cebpd84:EGFP constructs were generated by replacing the cebpd translational start codon with a EGFP-polyA cassette using Red/ET recombineering technology (Gene Bridges). 50-nt 5’ and 3’ homology arms was employed for recombination. The BAC constructed were purified with Nucleobond BAC 100 kit (Clontech) and co-injected with PI-SceI into one-cell stage zebrafish embryos. Three stable transgenic lines were identified for TgBAC(108cebpd12:EGFP) and one stable transgenic line was identified for TgBAC(35cebpd84:EGFP). The expression features of the three stable TgBAC(108cebpd12:EGFP) lines were indistinguishable in embryos and adults. The allele designations for lines used in this study are pd352 (108cebpd12:EGFP) and pd353 (35cebpd84:EGFP).
Generation of CEN mutant zebrafish
CEN was deleted employing a pair of gRNA using CRISPR/Cas9 technology, as described above. The target sequences were 5’-AGTATTGGAGGTGCTTAGAGCGG-3’ and 5’- TCTTCGAAGGCATGGATTGTCGG-3’, with PAM sequences underlined. To generate knockout animals, gRNAs were co-injected with Cas9 protein (CP01-200, PNA Bio) into one-cell stage embryos. Animal with CEN alleles are screened by PCR with primers CENseq1: 5’- CAGGGGAATAATAATTCAGGAGGTC-3’ and CENseq2: 5’- CTTATTTTAAAGCTGCCTTGACTCTG −3’. The wild-type allele is identified by PCR with primers CENseqF: 5’- GTTCATGTCACGATCACCAGCG-3’ CENseq2: 5’- CTTATTTTAAAGCTGCCTTGACTCTG −3’. Deletions were confirmed by Sanger sequencing (Eton Bioscience Inc.). The allele designation for this line is pd355.
Generation of Tg(CEN-cfos:EGFP) fish
The CEN sequence was amplified from zebrafish genomic DNA using primers 5’- CAGGGGAATAATAATTCAGGAGGTCT-3’ and 5’- CCTAAAAGACACCGGTAGAAAGG-3’. CEN was subcloned upstream of cfos:EGFP-polyA via Gateway Cloning, using Gateway LR Clonase II (11791020, Thermo Scientific)62. Two I-SceI sites flanking the CENcfos:EGFP-polyA cassette were used to generate transgenic animals. Nine stable transgenic lines were identified by PCR using primers CENseqF 5’- GTTCATGTCACGATCACCAGCG-3’ and GFPseqRV 5’-TGGTGCAGATGAACTTCAGG-3’. The allele designations for the two lines used in this study here are pd356 and pd357.
Drug treatments
For glucocorticoid and mineralocorticoid receptor agonist and antagonist treatment, dexamethasone (D1756, Sigma-Aldrich), spironolactone (S3378, Sigma-Aldrich), RU486 (Mifepristone, M8046, Sigma-Aldrich) and eplerenone (E0905, TCI chemicals) were dissolved in DMSO to make stock solutions. Uninjured adult fish were incubated in 350 μM dexamethasone or 25 μM spironolactone or DMSO as vehicle control. Fresh drug water was changed every 24 h for 4 days. At 4 days post treatment, heart, brain and kidney were collected for histology analysis. Z-CAT fish treated with tamoxifen were incubated in 5 μM RU486 or 50 μM eplerenone or DMSO as vehicle control from 3 days post tamoxifen treatment to 6 days post tamoxifen treatment. Water was changed every 24 h. At 7 days post tamoxifen treatment (4 days post drug treatment), the brain was collected for quantitative PCR.
RNA-seq and analysis
Z-CAT fish were treated with tamoxifen to induce CM ablation. To minimize variability and possible effects of tamoxifen treatment, we included only male zebrafish in our study and employed tamoxifen-treated (CreER−) siblings as uninjured controls. At 7 days post tamoxifen incubation (dpi), whole brain, whole kidney marrow or whole kidney were collected for RNA sample preparation. Tissues from 10 fish were pooled together and sequenced as one biological sample, and 2-3 biological replicates were sequenced in each experiment. Total RNA was extracted using TRI reagent (T9424, Sigma-Aldrich) and treated with DNase1 to degrade genomic DNA. Samples were purified with Quick-RNA Miniprep kit (R1054, Zymo Research) and submitted to the Duke Center for Genomic and Computational Biology or Beijing Genomics institute (BGI) for library preparation and sequencing using Illumina HiSeq4000 or NovaSeq6000 or DNBSEQ platforms.
RNA-seq reads were trimmed by Trim Galore (v 0.4.1, with -q 15) and mapped with TopHat (v 2.1.1, with parameters –b2-very-sensitive –no-coverage-search and supplying the UCSC danRer10 refSeq annotation) to zebrafish genome (GRCz10). The mapped reads were filtered by MAPQ (no smaller than 20) and counted using HTseq-counts (v 0.6.0). Bioconductor package DESeq2 (v 1.28.1 or v 1.30.1) was employed to analyze differential expressions (DE), and a two-sided Wald significance test was performed. Gene Ontology enrichment tests were performed to analyze enriched biological processes by clusterProfiler (v 3.16.1 or 3.18.1). The coverage depth tracks were plotted by trackViewer (v 1.25.3), heatmaps were drawn via pheatmap (v 1.0.12) and complexHeatmap (v 2.4.3) and volcano plots were created by EnhancedVolcano (v 1.6.0 or 1.8.0). The coverage depths were normalized by deeptools (v 3.1.3) using RPKM for RNA-seq and RPGC for ATAC-seq. The enriched motifs in promoter regions of differential expressed gene were analyzed by Homer (v 4.10.4). All software and algorithms used in this manuscript are summarized in Supplementary Table 12g, with citations to their published descriptions when available.
The RNA-seq for whole kidney samples from cebpd mutants and their wild type siblings were analyzed by STAR-Salmon-DESeq2 pipeline. RNA-seq reads were trimmed by Trim Galore (v 0.6.7) and mapped with STAR (v 2.6.1d) to zebrafish genome (GRCz10). The mapped reads were quantified by salmon with transcripts in UCSC danRer10 annotation downloaded from illumina iGenome. The transcript counts were summarized to gene level by tximport (v 1.18.0). Bioconductor package DESeq2 (v 1.30.1) was employed to analyze differential expressions.
ATAC-seq and analysis
Brains and whole kidney marrows were collected from male Z-CAT fish at 7 days post tamoxifen treatment. Samples from 10 individual animals were pooled together for tissue dissociation. Brains were freshly homogenized with a Dounce homogenizer, and whole kidney marrow was isolated by aspiration as previously described63. 100,000 cells/nuclei were used for library preparation. ATAC-seq libraries were prepared as previously described30 and sequenced at Duke Center for Genomic and Computational Biology with the HiSeq4000 platform.
ATAC-Seq reads were trimmed by Trim Galore (v 0.4.1, with -q 15) and mapped to zebrafish genome (GRCz10) using bowtie2 (v 2.2.5, with parameters --very-sensitive). The mapped reads were filtered by MAPQ (no smaller than 30) by samtools (v 1.5) and duplicated reads were removed by picard (v 1.91). The peaks were called by MACS2 (v 2.1.0, with --nomodel --shift -100 --extsize 200 -q 0.05 -g 1.5e9) and filtered by Irreproducible Discovery Rate (IDR)64. Bioconductor package DiffBind (v 2.14.0) was employed for differential open region analysis, and a two-sided Wald significance test was performed with DESeq2. Differential peaks were annotated to its closest transcriptional start site by ChIPpeakAnno (v 3.22.3). Over-represented transcription factors in injured fish were analyzed using Bias-free Footprint Enrichment Test (BiFET) based on Hypergeometric Distribution for MACS2-called peaks, and p value was adjusted by Benjamin-Hochberg procedure. The motifs were a collection of jaspar2018, jolma2013 and cisbp_1.02 from package motifDB (v 1.28.0) and merged by distance smaller than 1e-9 calculated by MotIV::motifDistances function (v 1.42.0). The merged motifs were exported by motifStack (v 1.30.0). The over-represented transcription factor occupancy for predicted binding sites in genome-wide were scanned by ATACseqQC::footprintsScanner function (v 1.16.0) with two sided Fisher’s exact test. For enriched motif test, the CEN sequence (danRer10: chr24:35720932-35722101) was shuffled 10,000 times by setting the k-let size to 2 65. The jolma2013 motifs collection were extracted from motifDB (v 1.28.0) and the binding sites were predicted by motifmatchr package (v 1.12.0). Z-score and P-value were calculated based on the permutation. ATAC-Seq peaks were paired to RNA-Seq differential expression data by annotated nearest gene symbols. cebpd, or its orthologous sequences with extension of upstream 100 kb and downstream 100 kb of Zebrafish (danRer10), Coelacanth (latCha1), Xenopus tropicalis (xenTro9), mouse (mm10), and human (hg38) were downloaded from the UCSC genome browser gateway. The compartment analysis was performed using a modified compartmap package (v 1.9.2) to fit the zebrafish genome (as it only supports human and mouse). Lolliplot for Nr3C1 and Nr3C2 motifs were plotted by trackViewer (v 1.31.1).
A conservation test was performed using the DNA sequence alignment tool mVISTA66. All software and algorithms used are summarized in Supplementary Table 12g.
Virtual 4C plot
The Virtual 4C plot was performed as previously described 67. Briefly, the bait CEN regions (chr24: 35720932-35722101) or cebpd promoter region (chr24: 35676065-35677064) and the flanking 400kb region were selected. The rows overlapping the bait and flanking regions were extracted from the 5-kb bin Hi-C matrix as the contacts number. The number of observed contacts was then plotted with a smoothing window to obtain virtual 4C profiles. Data were plotted by trackViewer (v 1.31.1).
Quantitative PCR
For qPCR with hearts, 5 hearts were pooled as one biological sample for analysis. For qPCR with brain, whole kidney, or head kidney samples, individual brain or kidney or head kidney was treated as one independent sample. RNA was extracted using TRI reagent (T9424, Sigma-Aldrich). Genomic DNA was removed using TURBO DNA-free™ Kit (AM1907, Invitrogen). Purified RNA was reverse transcribed with Transcriptor First Strand cDNA Synthesis Kit (04897030001, Roche). Quantitative PCR as performed on a Roche LightCycler 480 II system with Software release 1.5.0 SP4 and Roche Light Cycler 480 (04707494001, Roche) and Roche UPL probes or Roche LightCycler® 480 SYBR Green I Master (04707516001). Experiments were carried out with biological replicates and technical triplicates. Primers and UPL probes are listed in Supplementary Table 12f.
Histology
In situ hybridization was performed on cryosections of paraformaldehyde-fixed adult heart, brain, spinal cord, and kidney, with the aid of an InSituPro robot (Intavis). Hearts and kidneys were sectioned at 10 μm, brains at 12 μm, and spinal cords at 16 μm. All ISH probes were digoxigenin-labeled RNA probes cloned from adult zebrafish tissue cDNA All primers used for cloning ISH probes are listed in Supplementary Table 12e. Probes were subcloned into pJET1.2/blunt vector (K1231, Thermo scientific) and generated using T7 RNA polymerase (M0251, New England BioLab). Signals were visualized by immunoassay using an anti-DIG-AP (alkaline phosphatase) antibody (11093274910, Sigma-Aldrich) and subsequent catalytic color reaction with NBT (nitroblue tetrazolium) (11383213001, Sigma-Aldrich)/BCIP (5-bromo-4-chloro-3-indolyl-phosphate) (11383221001, Sigma-Aldrich). Sections were imaged using a Leica DM6000 compound microscope with 5X, 10X, or 20X objectives and Leica Application Suite X (v.3.4.2).
Mef2/EdU staining was performed as previously described 68. Briefly, EdU (A10044, Thermo Fisher Scientific) was reconstituted in PBS, and 10 μl of a 10 mM EdU solution was injected into adult fish once daily from 4 dpa to 6 dpa. At 7 dpa, hearts were collected and incubated in sucrose for 5 minutes. Hearts were snap frozen in tissue freezing medium using an ethanol/dry ice bath without fixation. Mef2/PCNA and Raldh2/PCNA staining was performed on fixed heart sections. Briefly, hearts were collected at 7 dpi and fixed in 4% PFA overnight at 4 °C. All frozen hearts were cryosectioned at 10 μm. Sections are postfixed with 3.7% formaldehyde for Mef2/EdU staining or boiled in citrate buffer for Mef2/PCNA staining. EdU was detected through a click reaction with Azide-594 (A10270, Thermo Fisher Scientific), Mef2 was stained with primary anti-MEF2A + MEF2C antibody (ab197070, Abcam, 1:100), Raldh2 was stained with a customized primary antibody from Abmart (1:100), and PCNA was stained with a primary anti-PCNA antibody (P8825, Sigma-Aldrich, 1:800). Secondary antibody Alexa Fluor 488 anti rabbit (A11034, Thermo Scientific, 1:250), Alexa Fluor 488 anti mouse (A11029, Thermo Scientific, 1:250), Alexa Fluor 594 anti rabbit (A11037, Thermo Scientific, 1:250) was used for staining. Stained sections were imaged using a Leica DM6000 compound microscope with Leica Application Suite X (v.3.4.2) and 20X objective lens or Zeiss LSM 700 confocal microscope with Zen 2010 B SPl and 20X objective lens. CM proliferation indices at 7 days post ventricular amputation were calculated as the percentage of Mef2+/EdU+ CMs near the injury (103 μm in the y-dimension above the resection plane). CM proliferation indices for hearts at 7 days post genetic ablation were calculated as the percentage of Mef2+/PCNA+ CMs at the ventricular apex. Epicardial proliferation indices were calculated as the percentage of Raldh2+/PCNA+ epicardial cells in the whole ventricle. For each heart, at least three sections were counted and averaged to determine the CM and epicardial proliferation index.
Troponin-staining and Acid fuchsin orange g (AFOG) staining were performed as previously described5. Briefly, hearts were collected at 30 dpa and fixed in 4% paraformaldehyde (PFA) at 4 °C overnight before frozen and sectioning at 10 μm. Sections were first stained with primary anti-Troponin-T antibody (MS-295-PABX, Thermo Scientific,1:100) followed by secondary antibody Alexa Fluor 488 (A-11029, ThermoFisher Scientific, 1:250), and imaged using a Leica DM6000 compound microscope with Leica Application Suite X (v.3.4.2) and 20X objective lens. Then, the same slides were used for AFOG staining as described5. All antibodies and chemicals used for histological analysis are summarized in Supplementary Table 12b,c.
Swim assays
A stepped velocity test was employed to assess zebrafish swim capacity as previously described with minor modifications 69. Briefly, zebrafish (no more than 17 per group) were forced to swim against an increasing water current in a 5 L swim tunnel before surgery to determine their baseline swim capacity. Zebrafish that had been administered spinal cord transection surgeries were subjected to the same swim assay once every two weeks. Fish after CM ablation were tested for their exertion capacity in this increment swim assay at 7 dpi. Fish were allowed to adapt to the enclosed tunnel with low, constant water current during the first 20 minutes of the swim. Then, the water current was increased every 2 minutes, until a speed at which all fish exhausted. Exhausted animals were removed from the tunnel without disrupting the swimming of the other fish. The water current and swim time of each individual fish was recorded.
Heat stress experiments
The heat sensitivity test was performed as previously described 16. Briefly, Z-CAT fish at 7 day post tamoxifen treatment were exposed to water whose temperature automated increased from 27°C to 38°C in an hour 70. Then the temperature was kept at 38°C for another 2 hours. Dead fish were removed from the heat shock tank without disrupting remaining fish. The water temperature and survival time of each fish was recorded.
Fluorescent dextran uptake assay
The dextran uptake assay was adapted from previously described fluorescent dextran assays in zebrafish 28. 40 kDa fluorescein conjugated dextran (D1845, Fisher Scientific) was dissolved in H2O as 50 mg/ml stock solution. To perform the dextran uptake assay, fluorescein-dextran stock solution was diluted with H2O to make 4 mg/ml solution, and 5 μl of working solution was injected intraperitoneally into adult fish. At 3 hours post injection, zebrafish tailfins were imaged under Zeiss AxioZoom V16 microscope with ZEN pro 2012. at magnification of 40X. For each fish, the widest blood vessels from 5 fin rays were measured and averaged to determine the fluorescence intensity using Fiji (v.2.3.0).
Statistics and reproducibility
Clutchmates were randomized into different treatment groups for each experiment. No animal was excluded from the analysis unless the animal died during the procedure. All measurements were acquired from distinct samples and no sample was measured repeatedly. The numbers of animals used for each experiment are indicated in figure legends. ISH experiments were repeated with the total numbers of animals indicated in figure legends. Other behavioral experiments or tissue assays were performed with 7 - 20 animals in each group and replicates indicated in figures or figure legends. Statistical values are displayed as Mean ± Standard Deviation or Mean ± Standard Error of the Mean, as indicated in the figure legend. Normality tests were performed for all applicable experiments. Statistical differences were calculated using unpaired two-tailed Student's t-tests when a normality test was passed, or a two-sided Mann-Whitney test otherwise. Fisher’s exact test was employed for assessing muscle regrowth and cardiac scarring. A log-rank (Mantel-Cox) test was employed for comparing survival curves. P values are included in figures or figure legends. All statistical analyses were performed with GraphPad Prism9. RNA-seq and ATAC-seq data involve 2-3 biologically independent samples for each group. Tissues from 10 fish were pooled together as one biological replicate. All ChIP-seq and Hi-C data from GSE13405534 involve 2 biologically independent samples from each group. WGSB data from GSE13405534 involve one biological sample for each group. Cardiac ChIP-seq data from GSE818624, GSE7589431 and GSE9692840 involve 2-3 biological replicates for each group.
Extended Data
Extended Data Fig. 1. Bioinformatic analysis of brain RNA-seq during cardiac regeneration.
a, Gene Ontology analysis demonstrating biological pathways with gene enrichment. p < 0.05. Counts indicate the number of genes with significantly changed expression in each biological pathway. b, HOMER analysis demonstrating enriched transcription factor binding motifs at the promoter regions (upstream 2 kb to downstream 500 bp) of genes with increased brain RNA levels during heart regeneration.
Extended Data Fig. 2. Expression of cebpd is not induced in several tissues in adult zebrafish during heart regeneration.
ISH on sections of nasal epithelium, spleen, liver, skeletal muscle, and intestine, indicating that cebpd expression is not noticeably induced in these tissues during heart regeneration. Tissues were harvested 7 days after tamoxifen administration, which induced CM ablation in CreER+ animals. n = 10 animals for all groups. Scale bars: 100 μm.
Extended Data Fig. 3. Cardiac muscle regeneration and fluid regulation in cebpd mutant animals.
a, Representative sections of cardiac ventricles 30 days after resection (dpa) in wild-type and cebpd−/− animals, stained with AFOG. Scale bar: 100 μm. n reported in (b). b, Semiquantitative assessment of cardiac injuries based on muscle and scar morphology, indicating no significant difference between cebpd−/− animals and their wild-type siblings. 1: Robust regeneration. 2: Partial regeneration 3: Blocked regeneration. A single trial was performed, with n = 11 animals for each group. Data were analyzed using a Fisher’s exact test. c, Sections of 7 days post resection (dpa) ventricles staining with markers for CM nuclei (Mef2; green) and cell cycle entry (EdU; red). Dashed lines outline the approximate resection injury site. Scale bars: 100 μm. d, Quantification of the CM cycling index at 7 dpa indicating no significant differences in cebpd knockout animals compared to their wild-type siblings. A single trial was performed with n = 8 cebpd+/+animals, 9 cebpd+/− animals, and 12 cebpd−/− animals. Mean ± s.d.. Data were analyzed using an unpaired two-tailed Student’s t-test. e, Fluorescence images of tailfin vasculature indicating that significantly less fluorescent dextran was able to reach the circulatory system of cebpd−/− fish after cardiac injuries. Data are quantified in Fig. 3. n = 16 CreER− and 21 CreER+ animals for cebpd+/+, and n = 22 CreER− and 18 CreER+ animals for cebpd−/−. Scale bars: 500 μm.
Extended Data Fig. 4. Transcriptome profiling of cebpd mutant brain and kidney during heart regeneration.
a,b, Volcano plot showing differential gene expression in the cebpd−/− brain (a) and kidney (b) during heart regeneration. 521 genes (158 genes increased and 363 genes decreased) and 1662 genes (787 increased and 875 decreased) were differentially regulated in the brain and kidney of cebpd−/− animals, respectively. Full lists of differentially expressed genes are shown in Supplementary Tables 2 and 3. Pink dots: highlighted genes. Blue dots: genes with decreased RNA levels (p < 0.05, FC < −1.2). Grey dots: genes with no significant changes. Orange dots: genes with increased RNA levels (p < 0.05, FC > 1.2). c, RNA-seq browser track of aqp7 showing decreased transcript levels of aqp7 (Log2FC = −1.062, p = 0.0012) in cebpd−/− kidney during heart regeneration. d, RNA-seq browser track of aqp10a showing decreased transcript levels of aqp10a (Log2FC = −1.045, p = 0.0020) in cebpd−/− kidney during heart regeneration. e, RNA-seq browser track of slc5a8l showing decreased transcript levels of slc5a8l (Log2FC = −0.515, p = 0.0034) in cebpd−/− kidney during heart regeneration. f,g, Gene Ontology analysis of differentially expressed genes in cebpd−/− brain during heart regeneration demonstrating top biological pathways (f) and molecular functions (g) with gene enrichment. Counts indicate the number of genes with significantly changed expression in Gene Ontology term. h,i, Gene Ontology analysis of differentially expressed genes in cebpd−/− kidney during heart regeneration demonstrating top biological pathways (h) and molecular functions (i) with gene enrichment. Counts indicate the number of genes with significantly changed expression in Gene Ontology term.
Extended Data Fig. 5. Two BAC sequences direct distinct gene expression patterns in zebrafish.
a, Two BAC transgenic lines show distinct larval EGFP fluorescence patterns. Boxed area is magnified on bottom left, and a magnified dorsal view is shown on bottom right. 108cebpd12:EGFP is prominent in skeleton and strong in jaw, indicated by yellow arrows. 35cebpd84:EGFP is weak in skin with low expression in jaw, indicated by yellow arrows. Scale bars: 500 μm. This expression is consistent in all animals used in this study. b, Two BAC transgenic lines show distinct adult EGFP fluorescence patterns. 108cebpd12:EGFP is strong in caudal fin rays and nasal cavity, indicated by yellow arrows. 35cebpd84:EGFP is weak in skin, indicated by yellow arrows. Scale bars: 500 μm. This expression is consistent in all animals used in this study.
Extended Data Fig. 6. Transcriptome and epigenetic analysis of whole kidney marrow.
a, Schematic of CM ablation and whole kidney marrow (WKM) collection for RNA-seq and ATAC-seq. b, Volcano plot showing differential gene expression in WKM after cardiac injury. Blue dots: genes with decreased RNA levels (p < 0.05, FC < −1.2). Grey dots: genes without significant changes. Orange dots: genes with increased RNA levels (p < 0.05, FC > 1.2). c, Gene ontology analysis of top biological pathways with gene enrichment. p < 0.05. Counts indicate the number of genes with significantly changed expression in each biological pathway. d, Heatmap of chromatin regions with changes in accessibility in the brain and kidney after CM ablation. p < 0.05. e, Heatmaps of RNA-seq and ATAC-seq data representing putative enhancer elements linked to genes with significant transcriptional changes in WKM after a cardiac injury. f, BiFET analysis indicating enriched transcription factor binding to open regions in WKM chromatin regions cardiac injury. Red: p < 0.05. Blue: p ≥ 0.05.
Extended Data Fig. 7. Epigenetic feature of CEN and its sequence conservation across species.
a, A/B compartment analysis indicates a chromatin B to A compartment switch at cebpd and CEN loci. Dashed lines indicate cebpd and CEN region. b, Browser tracks indicating assays from this study and others. Brain ATAC-seq and Brain RNA-seq, uninjured and 7 days after CM ablation (7 dpi; this study); CM H3.3 occupancy, uninjured and 7 dpi (GSE81862); H3K27Ac occupancy, uninjured and 7 dpi (GSE75894); H3K27me3 and H3K4me3 occupancy in ventricular Gata4+ CMs, uninjured and 5 days post resection (GSE96928). Dashed lines indicate CEN. c, mVista plot of genomic regions around cebpd indicating high conservation of zebrafish CEN with cyprinid fish and low conservation with amphibians and mammals. Calculation window = 100 bp, conservation identity = 70%.
Extended Data Fig. 8. Expression of corticosteroid receptors in the brain and kidney.
a,b, RNA-seq browser track of nr3c1 (a) and nr3c2 (b) indicating that expression of nr3c1 in both brain and WKM are not significantly changed during heart regeneration, indicated as “injured” in tracks. c, ISH on sections of brain and kidney from uninjured animals demonstrating nr3c1 and nr3c2 expression in multiple regions including ependymal cells and renal tubules. n = 5 animals for each group. Scale bar: 100 μm.
Extended Data Fig. 9. CEN is required for fluid homeostasis during heart regeneration.
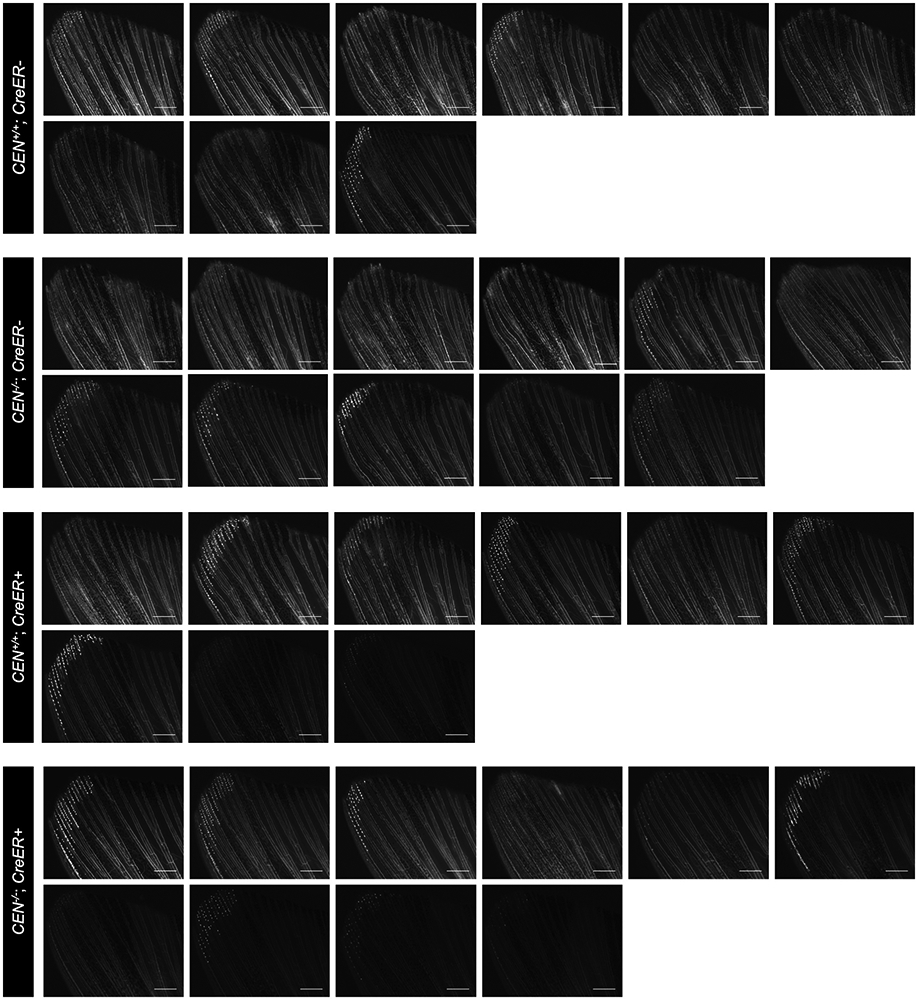
Fluorescence images of tailfin vasculature indicating that less fluorescent dextran transferred to the circulatory system of CEN−/− fish after cardiac injuries. A single trial with n = 9 animals for both groups of CEN+/+, and n = 11 CreER− and n = 10 CreER+ animals for CEN−/− animals, was performed. Data are quantified in Fig. 6. Scale bars: 500 μm.
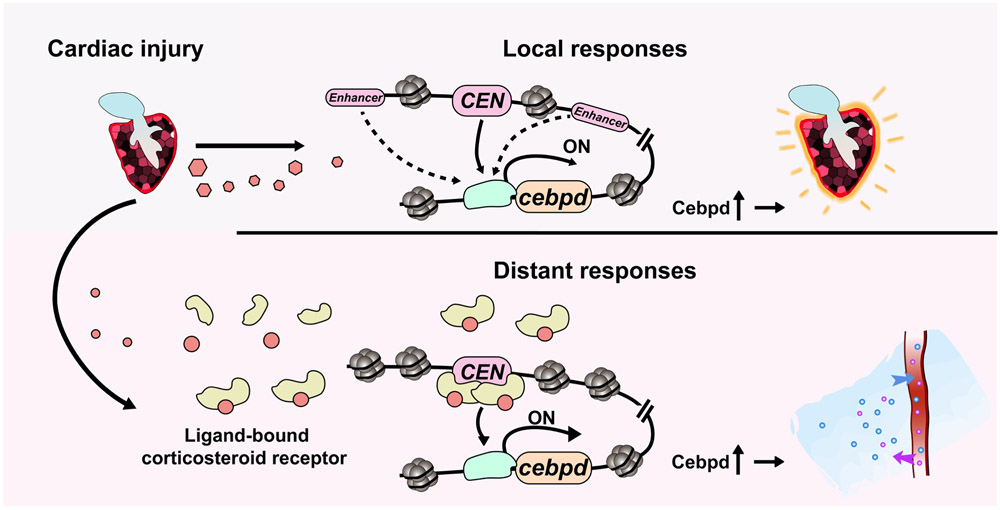
Extended Data Fig. 10. Model describing CEN element functions in local and remote tissues.
(Top) Cardiac injury induces cebpd expression locally, regulating epicardial activation during heart regeneration. CEN is sufficient but not required for directing local cebpd induction, likely due to existence of redundant enhancers. (Bottom) Cardiac injury leads to transcriptionally activated corticosteroid receptors in remote tissues. CEN exists in an open, permissive structure, topologically close to its promoter and poised for corticosteroid receptor binding. Ligand-bound corticosteroid receptors trigger CEN-directed cebpd expression in distant tissues, contributing to fluid homeostasis in animals undergoing injury-induced regeneration.
Supplementary Material
Supplementary Table 1: Differentially expressed transcripts from brain RNA-seq after cardiomyocyte ablation (FC > 1.2, p < 0.05). Two-sided Wald significance test performed with DESeq2.
Supplementary Table 2: Differentially expressed transcripts from RNA-seq of wild-type and cebpd−/− brains after cardiomyocyte ablation (FC > 1.2, p < 0.05). Two-sided Wald significance test performed with DESeq2.
Supplementary Table 3: Differentially expressed transcripts from RNA-seq of wild-type and cebpd−/− kidneys after cardiomyocyte ablation (FC > 1.2, p < 0.05). Two-sided Wald significance test performed with DESeq2.
Supplementary Table 4: Differentially accessible chromatin regions from brain ATAC-seq after cardiomyocyte ablation (p < 0.05). Two-sided Wald significance test performed with DESeq2
Supplementary Table 5: Differentially expressed transcripts from whole kidney marrow RNA-seq after cardiomyocyte ablation. (FC > 1.2, p < 0.05). Two-sided Wald significance test performed with DESeq2.
Supplementary Table 6: Differentially accessible chromatin regions from whole kidney marrow ATAC-seq after cardiomyocyte ablation (p < 0.05).
Supplementary Table 7: BiFET analysis of transcription factor binding sites in open regions of whole kidney marrow chromatin samples. MACS2-called peaks were analyzed based on Hypergeometric Distribution and p value was adjusted by Benjamin-Hochberg procedure.
Supplementary Table 8: Differential ATAC-seq chromatin regions paired with differentially expressed genes in the whole kidney marrow after cardiomyocyte ablation.
Supplementary Table 9: BiFET analysis of transcription factor binding sites in open regions of brain chromatin samples. MACS2-called peaks were analyzed based on Hypergeometric Distribution and p value was adjusted by Benjamin-Hochberg procedure.
Supplementary Table 10: Differential ATAC-seq chromatin regions paired with differentially expressed genes in the brain after cardiomyocyte ablation.
Supplementary Table 11: Footprint analysis of enriched transcription factor occupancy in brain during heart regeneration. Two-sided Fisher’s exact test.
Supplementary Table 12: Summary of reagents and strains. a, List of experimental models. b, List of antibodies. c, List of chemicals. d, List of recombinant DNA. e, List of primers for generating ISH probes. f, List of primers for qPCR. g, List of software and algorithms.
Acknowledgments
We thank Duke Zebrafish Core for animal care; Duke Center for Genomic and Computational Biology for advice; A. Dickson and K. Oonk for assistance with ISH; J. Kang, Y. Diao, J. A. Goldman, M. Pronobis, V. Cigliola, R. Yan, K. Ando, L. Slota-Burtt and R. Karra for comments on the manuscript; and Y. Diao, J. Rawls, B. Black, and N. Bursac for discussions. The authors acknowledge research support from NIH (R01 HL155607 to J.C.; R35 GM 124820 to F.Y.; R35 HL150713 and R01 HL136182 to K.D.P.), and from AHA and Fondation Leducq to K.D.P.
Footnotes
Competing interests
The authors declare no competing interests.
Data availability
RNA-seq and ATAC-seq data are deposited in NCBI GEO database under accession number GSE158079 and GSE193630. The brain, kidney, heart, muscle and kidney H3K27ac, H3K4me3, WGBS and the deep sequencing of brain Hi-C data are downloaded from GEO: GSE13405534. Other heart-related ChIP-seq data were downloaded from GSE818624, GSE7589431 and GSE9692840. Unique reagents generated in this study, and all data supporting the findings of this study, are available from the corresponding author upon reasonable request.
References
- 1.King RS & Newmark PA The cell biology of regeneration. Journal of Cell Biology 196, 553–562 (2012). [DOI] [PMC free article] [PubMed] [Google Scholar]
- 2.Lai S-L, Marín-Juez R & Stainier DYR Immune responses in cardiac repair and regeneration: a comparative point of view. Cellular and Molecular Life Sciences 76, 1365–1380 (2019). [DOI] [PMC free article] [PubMed] [Google Scholar]
- 3.González-Rosa JM, Burns CE & Burns CG Zebrafish heart regeneration: 15 years of discoveries. Regeneration 4, 105–123 (2017). [DOI] [PMC free article] [PubMed] [Google Scholar]
- 4.Goldman JA et al. Resolving Heart Regeneration by Replacement Histone Profiling. Dev Cell 40, 392–404.e395 (2017). [DOI] [PMC free article] [PubMed] [Google Scholar]
- 5.Poss KD, Wilson LG & Keating MT Heart regeneration in zebrafish. Science 298, 2188–2190 (2002). [DOI] [PubMed] [Google Scholar]
- 6.Schefold JC, Filippatos G, Hasenfuss G, Anker SD & Von Haehling S Heart failure and kidney dysfunction: epidemiology, mechanisms and management. Nature Reviews Nephrology 12, 610–623 (2016). [DOI] [PubMed] [Google Scholar]
- 7.Legrand M & Rossignol P Cardiovascular Consequences of Acute Kidney Injury. New England Journal of Medicine 382, 2238–2247 (2020). [DOI] [PubMed] [Google Scholar]
- 8.Van Biesen W & Vanholder R Cardiovascular Complications of Acute Kidney Injury, 221–227 (Springer Berlin Heidelberg, 2010). [Google Scholar]
- 9.Rodgers JT et al. mTORC1 controls the adaptive transition of quiescent stem cells from G0 to GAlert. Nature 510, 393–396 (2014). [DOI] [PMC free article] [PubMed] [Google Scholar]
- 10.Rodgers JT, Schroeder MD, Ma C & Rando TA HGFA Is an Injury-Regulated Systemic Factor that Induces the Transition of Stem Cells into G Alert. Cell Rep 19, 479–486 (2017). [DOI] [PMC free article] [PubMed] [Google Scholar]
- 11.Halme A, Cheng M & Hariharan IK Retinoids Regulate a Developmental Checkpoint for Tissue Regeneration in Drosophila. Curr Biol 20, 458–463 (2010). [DOI] [PMC free article] [PubMed] [Google Scholar]
- 12.Hirose K et al. Evidence for hormonal control of heart regenerative capacity during endothermy acquisition. Science, eaar2038 (2019). [DOI] [PMC free article] [PubMed] [Google Scholar]
- 13.Nachtrab G, Czerwinski M & Kenneth Sexually Dimorphic Fin Regeneration in Zebrafish Controlled by Androgen/GSK3 Signaling. Curr Biol 21, 1912–1917 (2011). [DOI] [PMC free article] [PubMed] [Google Scholar]
- 14.Kang J, Nachtrab G & Kenneth Local Dkk1 Crosstalk from Breeding Ornaments Impedes Regeneration of Injured Male Zebrafish Fins. Dev Cell 27, 19–31 (2013). [DOI] [PMC free article] [PubMed] [Google Scholar]
- 15.Kikuchi K et al. Primary contribution to zebrafish heart regeneration by gata4+ cardiomyocytes. Nature 464, 601–605 (2010). [DOI] [PMC free article] [PubMed] [Google Scholar]
- 16.Wang J et al. The regenerative capacity of zebrafish reverses cardiac failure caused by genetic cardiomyocyte depletion. Development 138, 3421–3430 (2011). [DOI] [PMC free article] [PubMed] [Google Scholar]
- 17.Arif M et al. Integrative transcriptomic analysis of tissue-specific metabolic crosstalk after myocardial infarction. eLife 10 (2021). [DOI] [PMC free article] [PubMed] [Google Scholar]
- 18.Arguello AA et al. CCAAT Enhancer Binding Protein Plays an Essential Role in Memory Consolidation and Reconsolidation. J Neurosci 33, 3646–3658 (2013). [DOI] [PMC free article] [PubMed] [Google Scholar]
- 19.De Heredia LL & Magoulas C Lack of the transcription factor C/EBPδ impairs the intrinsic capacity of peripheral neurons for regeneration. Exp Neurol 239, 148–157 (2013). [DOI] [PubMed] [Google Scholar]
- 20.Valente T et al. CCAAT/enhancer binding protein δ regulates glial proinflammatory gene expression. Neurobiol Aging 34, 2110–2124 (2013). [DOI] [PubMed] [Google Scholar]
- 21.Kelicen P & Tindberg N Lipopolysaccharide Induces CYP2E1 in Astrocytes through MAP Kinase Kinase-3 and C/EBPβ and -δ. J Biol Chem 279, 15734–15742 (2004). [DOI] [PubMed] [Google Scholar]
- 22.Huang GN et al. C/EBP Transcription Factors Mediate Epicardial Activation During Heart Development and Injury. Science 338, 1599–1603 (2012). [DOI] [PMC free article] [PubMed] [Google Scholar]
- 23.Gemberling M, Karra R, Dickson AL & Poss KD Nrg1 is an injury-induced cardiomyocyte mitogen for the endogenous heart regeneration program in zebrafish. eLife 4 (2015). [DOI] [PMC free article] [PubMed] [Google Scholar]
- 24.Miller WL Fluid Volume Overload and Congestion in Heart Failure. Circulation: Heart Failure 9, e002922 (2016). [DOI] [PubMed] [Google Scholar]
- 25.Dupont M, Mullens W & Tang WHW Impact of Systemic Venous Congestion in Heart Failure. Current Heart Failure Reports 8, 233–241 (2011). [DOI] [PubMed] [Google Scholar]
- 26.Hentschel DM et al. Acute renal failure in zebrafish: a novel system to study a complex disease. Am J Physiol Renal Physiol 288, F923–929 (2005). [DOI] [PubMed] [Google Scholar]
- 27.Lepilina A et al. A dynamic epicardial injury response supports progenitor cell activity during zebrafish heart regeneration. Cell 127, 607–619 (2006). [DOI] [PubMed] [Google Scholar]
- 28.McCampbell KK, Springer KN & Wingert RA Analysis of Nephron Composition and Function in the Adult Zebrafish Kidney. Journal of Visualized Experiments (2014). [DOI] [PMC free article] [PubMed] [Google Scholar]
- 29.Thangaraju M et al. c/ebpdelta Null mouse as a model for the double knock-out of slc5a8 and slc5a12 in kidney. J Biol Chem 281, 26769–26773 (2006). [DOI] [PubMed] [Google Scholar]
- 30.Buenrostro JD, Giresi PG, Zaba LC, Chang HY & Greenleaf WJ Transposition of native chromatin for fast and sensitive epigenomic profiling of open chromatin, DNA-binding proteins and nucleosome position. Nat Methods 10, 1213–1218 (2013). [DOI] [PMC free article] [PubMed] [Google Scholar]
- 31.Kang J et al. Modulation of tissue repair by regeneration enhancer elements. Nature 532, 201–206 (2016). [DOI] [PMC free article] [PubMed] [Google Scholar]
- 32.Harris RE, Setiawan L, Saul J & Hariharan IK Localized epigenetic silencing of a damage-activated WNT enhancer limits regeneration in mature Drosophila imaginal discs. eLife 5 (2016). [DOI] [PMC free article] [PubMed] [Google Scholar]
- 33.Goldman JA & Poss KD Gene regulatory programmes of tissue regeneration. Nat Rev Genet 21, 511–525 (2020). [DOI] [PMC free article] [PubMed] [Google Scholar]
- 34.Yang H et al. A map of cis-regulatory elements and 3D genome structures in zebrafish. Nature 588, 337–343 (2020). [DOI] [PMC free article] [PubMed] [Google Scholar]
- 35.Sung M-H, Baek S & Hager GL Genome-wide footprinting: ready for prime time? Nature Methods 13, 222–228 (2016). [DOI] [PMC free article] [PubMed] [Google Scholar]
- 36.Ko CY, Chang WC & Wang JM Biological roles of CCAAT/Enhancer-binding protein delta during inflammation. J Biomed Sci 22, 6 (2015). [DOI] [PMC free article] [PubMed] [Google Scholar]
- 37.Lerch JK et al. Stress Increases Peripheral Axon Growth and Regeneration through Glucocorticoid Receptor-Dependent Transcriptional Programs. eneuro 4, ENEURO.0246–0217. (2017). [DOI] [PMC free article] [PubMed] [Google Scholar]
- 38.Fuller PJ et al. Molecular evolution of the switch for progesterone and spironolactone from mineralocorticoid receptor agonist to antagonist. Proceedings of the National Academy of Sciences 116, 18578–18583 (2019). [DOI] [PMC free article] [PubMed] [Google Scholar]
- 39.Katsu Y, Oka K & Baker ME Evolution of human, chicken, alligator, frog, and zebrafish mineralocorticoid receptors: Allosteric influence on steroid specificity. Science Signaling 11, eaao1520 (2018). [DOI] [PubMed] [Google Scholar]
- 40.Ben-Yair R et al. H3K27me3-mediated silencing of structural genes is required for zebrafish heart regeneration. Development 146 (2019). [DOI] [PMC free article] [PubMed] [Google Scholar]
- 41.Wang Y & Nicholas Advances and Applications of Single-Cell Sequencing Technologies. Molecular Cell 58, 598–609 (2015). [DOI] [PMC free article] [PubMed] [Google Scholar]
- 42.Thompson JD et al. Identification and requirements of enhancers that direct gene expression during zebrafish fin regeneration. Development 147 (2020). [DOI] [PMC free article] [PubMed] [Google Scholar]
- 43.Lee HJ et al. Regenerating zebrafish fin epigenome is characterized by stable lineage-specific DNA methylation and dynamic chromatin accessibility. Genome Biol 21 (2020). [DOI] [PMC free article] [PubMed] [Google Scholar]
- 44.Vizcaya-Molina E et al. Damage-responsive elements in Drosophila regeneration. Genome Res 28, 1852–1866 (2018). [DOI] [PMC free article] [PubMed] [Google Scholar]
- 45.Huang WC et al. Treatment of Glucocorticoids Inhibited Early Immune Responses and Impaired Cardiac Repair in Adult Zebrafish. PLoS One 8, e66613 (2013). [DOI] [PMC free article] [PubMed] [Google Scholar]
- 46.Cutie S, Payumo AY, Lunn D & Huang GN In vitro and in vivo roles of glucocorticoid and vitamin D receptors in the control of neonatal cardiomyocyte proliferative potential. J Mol Cell Cardiol 142, 126–134 (2020). [DOI] [PMC free article] [PubMed] [Google Scholar]
- 47.Hirose K et al. Evidence for hormonal control of heart regenerative capacity during endothermy acquisition. Science 364, 184–188 (2019). [DOI] [PMC free article] [PubMed] [Google Scholar]
- 48.Ullman M, Ullman A, Sommerland H, Skottner A & Oldfors A Effects of growth hormone on muscle regeneration and IGF-I concentration in old rats. Acta Physiol Scand 140, 521–525 (1990). [DOI] [PubMed] [Google Scholar]
- 49.Lopez J et al. Growth Hormone Improves Nerve Regeneration, Muscle Re-innervation, and Functional Outcomes After Chronic Denervation Injury. Scientific Reports 9 (2019). [DOI] [PMC free article] [PubMed] [Google Scholar]
- 50.Elabd C et al. Oxytocin is an age-specific circulating hormone that is necessary for muscle maintenance and regeneration. Nature Communications 5 (2014). [DOI] [PMC free article] [PubMed] [Google Scholar]
- 51.Girard C, Eychenne B, Schweizer-Groyer G & Cadepond F Mineralocorticoid and glucocorticoid receptors in sciatic nerve function and regeneration. The Journal of Steroid Biochemistry and Molecular Biology 122, 149–158 (2010). [DOI] [PubMed] [Google Scholar]
- 52.Nelson CM et al. Glucocorticoids Target Ependymal Glia and Inhibit Repair of the Injured Spinal Cord. Front Cell Dev Biol 7, 56 (2019). [DOI] [PMC free article] [PubMed] [Google Scholar]
- 53.Marshall LN et al. Stage-dependent cardiac regeneration in Xenopus is regulated by thyroid hormone availability. Proceedings of the National Academy of Sciences 116, 3614–3623 (2019). [DOI] [PMC free article] [PubMed] [Google Scholar]
- 54.Gibbs KM, Chittur SV & Szaro BG Metamorphosis and the regenerative capacity of spinal cord axons in Xenopus laevis. European Journal of Neuroscience 33, 9–25 (2011). [DOI] [PubMed] [Google Scholar]
- 55.Chávez-Delgado ME et al. Facial nerve regeneration through progesterone-loaded chitosan prosthesis. A preliminary report. Journal of Biomedical Materials Research Part B: Applied Biomaterials 67B, 702–711 (2003). [DOI] [PubMed] [Google Scholar]
- 56.Routley CE & Ashcroft GS Effect of estrogen and progesterone on macrophage activation during wound healing. Wound Repair and Regeneration 17, 42–50 (2009). [DOI] [PubMed] [Google Scholar]
- 57.Herrera-Rincon C et al. Brief Local Application of Progesterone via a Wearable Bioreactor Induces Long-Term Regenerative Response in Adult Xenopus Hindlimb. Cell Reports 25, 1593–1609.e1597 (2018). [DOI] [PMC free article] [PubMed] [Google Scholar]
- 58.Adán N et al. Prolactin promotes cartilage survival and attenuates inflammation in inflammatory arthritis. Journal of Clinical Investigation 123, 3902–3913 (2013). [DOI] [PMC free article] [PubMed] [Google Scholar]
- 59.Moreno-Carranza B et al. Prolactin promotes normal liver growth, survival, and regeneration in rodents: effects on hepatic IL-6, suppressor of cytokine signaling-3, and angiogenesis. Am J Physiol Regul Integr Comp Physiol 305, R720–726 (2013). [DOI] [PubMed] [Google Scholar]
- 60.Becker T, Wullimann MF, Becker CG, Bernhardt RR & Schachner M Axonal regrowth after spinal cord transection in adult zebrafish. J Comp Neurol 377, 577–595 (1997). [DOI] [PubMed] [Google Scholar]
- 61.Montague TG, Cruz JM, Gagnon JA, Church GM & Valen E CHOPCHOP: a CRISPR/Cas9 and TALEN web tool for genome editing. Nucleic Acids Res 42, W401–407 (2014). [DOI] [PMC free article] [PubMed] [Google Scholar]
- 62.Fivaz J, Bassi MC, Pinaud S & Mirkovitch J RNA polymerase II promoter-proximal pausing upregulates c-fos gene expression. Gene 255, 185–194 (2000). [DOI] [PubMed] [Google Scholar]
- 63.Traver D et al. Transplantation and in vivo imaging of multilineage engraftment in zebrafish bloodless mutants. Nat Immunol 4, 1238–1246 (2003). [DOI] [PubMed] [Google Scholar]
- 64.Landt SG et al. ChIP-seq guidelines and practices of the ENCODE and modENCODE consortia. Genome Res 22, 1813–1831 (2012). [DOI] [PMC free article] [PubMed] [Google Scholar]
- 65.Jiang M, Anderson J, Gillespie J & Mayne M uShuffle: A useful tool for shuffling biological sequences while preserving the k-let counts. BMC Bioinformatics 9, 192 (2008). [DOI] [PMC free article] [PubMed] [Google Scholar]
- 66.Mayor C et al. VISTA : visualizing global DNA sequence alignments of arbitrary length. Bioinformatics 16, 1046–1047 (2000). [DOI] [PubMed] [Google Scholar]
- 67.Wang Y et al. The 3D Genome Browser: a web-based browser for visualizing 3D genome organization and long-range chromatin interactions. Genome Biol 19, 151 (2018). [DOI] [PMC free article] [PubMed] [Google Scholar]
- 68.Sun F, Shoffner AR & Poss KD A Genetic Cardiomyocyte Ablation Model for the Study of Heart Regeneration in Zebrafish. Methods Mol Biol 2158, 71–80 (2021). [DOI] [PubMed] [Google Scholar]
- 69.Plaut I Effects of fin size on swimming performance, swimming behaviour and routine activity of zebrafish Danio rerio. J Exp Biol 203, 813–820 (2000). [DOI] [PubMed] [Google Scholar]
- 70.Lee Y, Grill S, Sanchez A, Murphy-Ryan M & Poss KD Fgf signaling instructs position-dependent growth rate during zebrafish fin regeneration. Development 132, 5173–5183 (2005). [DOI] [PubMed] [Google Scholar]
Associated Data
This section collects any data citations, data availability statements, or supplementary materials included in this article.
Supplementary Materials
Supplementary Table 1: Differentially expressed transcripts from brain RNA-seq after cardiomyocyte ablation (FC > 1.2, p < 0.05). Two-sided Wald significance test performed with DESeq2.
Supplementary Table 2: Differentially expressed transcripts from RNA-seq of wild-type and cebpd−/− brains after cardiomyocyte ablation (FC > 1.2, p < 0.05). Two-sided Wald significance test performed with DESeq2.
Supplementary Table 3: Differentially expressed transcripts from RNA-seq of wild-type and cebpd−/− kidneys after cardiomyocyte ablation (FC > 1.2, p < 0.05). Two-sided Wald significance test performed with DESeq2.
Supplementary Table 4: Differentially accessible chromatin regions from brain ATAC-seq after cardiomyocyte ablation (p < 0.05). Two-sided Wald significance test performed with DESeq2
Supplementary Table 5: Differentially expressed transcripts from whole kidney marrow RNA-seq after cardiomyocyte ablation. (FC > 1.2, p < 0.05). Two-sided Wald significance test performed with DESeq2.
Supplementary Table 6: Differentially accessible chromatin regions from whole kidney marrow ATAC-seq after cardiomyocyte ablation (p < 0.05).
Supplementary Table 7: BiFET analysis of transcription factor binding sites in open regions of whole kidney marrow chromatin samples. MACS2-called peaks were analyzed based on Hypergeometric Distribution and p value was adjusted by Benjamin-Hochberg procedure.
Supplementary Table 8: Differential ATAC-seq chromatin regions paired with differentially expressed genes in the whole kidney marrow after cardiomyocyte ablation.
Supplementary Table 9: BiFET analysis of transcription factor binding sites in open regions of brain chromatin samples. MACS2-called peaks were analyzed based on Hypergeometric Distribution and p value was adjusted by Benjamin-Hochberg procedure.
Supplementary Table 10: Differential ATAC-seq chromatin regions paired with differentially expressed genes in the brain after cardiomyocyte ablation.
Supplementary Table 11: Footprint analysis of enriched transcription factor occupancy in brain during heart regeneration. Two-sided Fisher’s exact test.
Supplementary Table 12: Summary of reagents and strains. a, List of experimental models. b, List of antibodies. c, List of chemicals. d, List of recombinant DNA. e, List of primers for generating ISH probes. f, List of primers for qPCR. g, List of software and algorithms.
Data Availability Statement
RNA-seq and ATAC-seq data are deposited in NCBI GEO database under accession number GSE158079 and GSE193630. The brain, kidney, heart, muscle and kidney H3K27ac, H3K4me3, WGBS and the deep sequencing of brain Hi-C data are downloaded from GEO: GSE13405534. Other heart-related ChIP-seq data were downloaded from GSE818624, GSE7589431 and GSE9692840. Unique reagents generated in this study, and all data supporting the findings of this study, are available from the corresponding author upon reasonable request.


