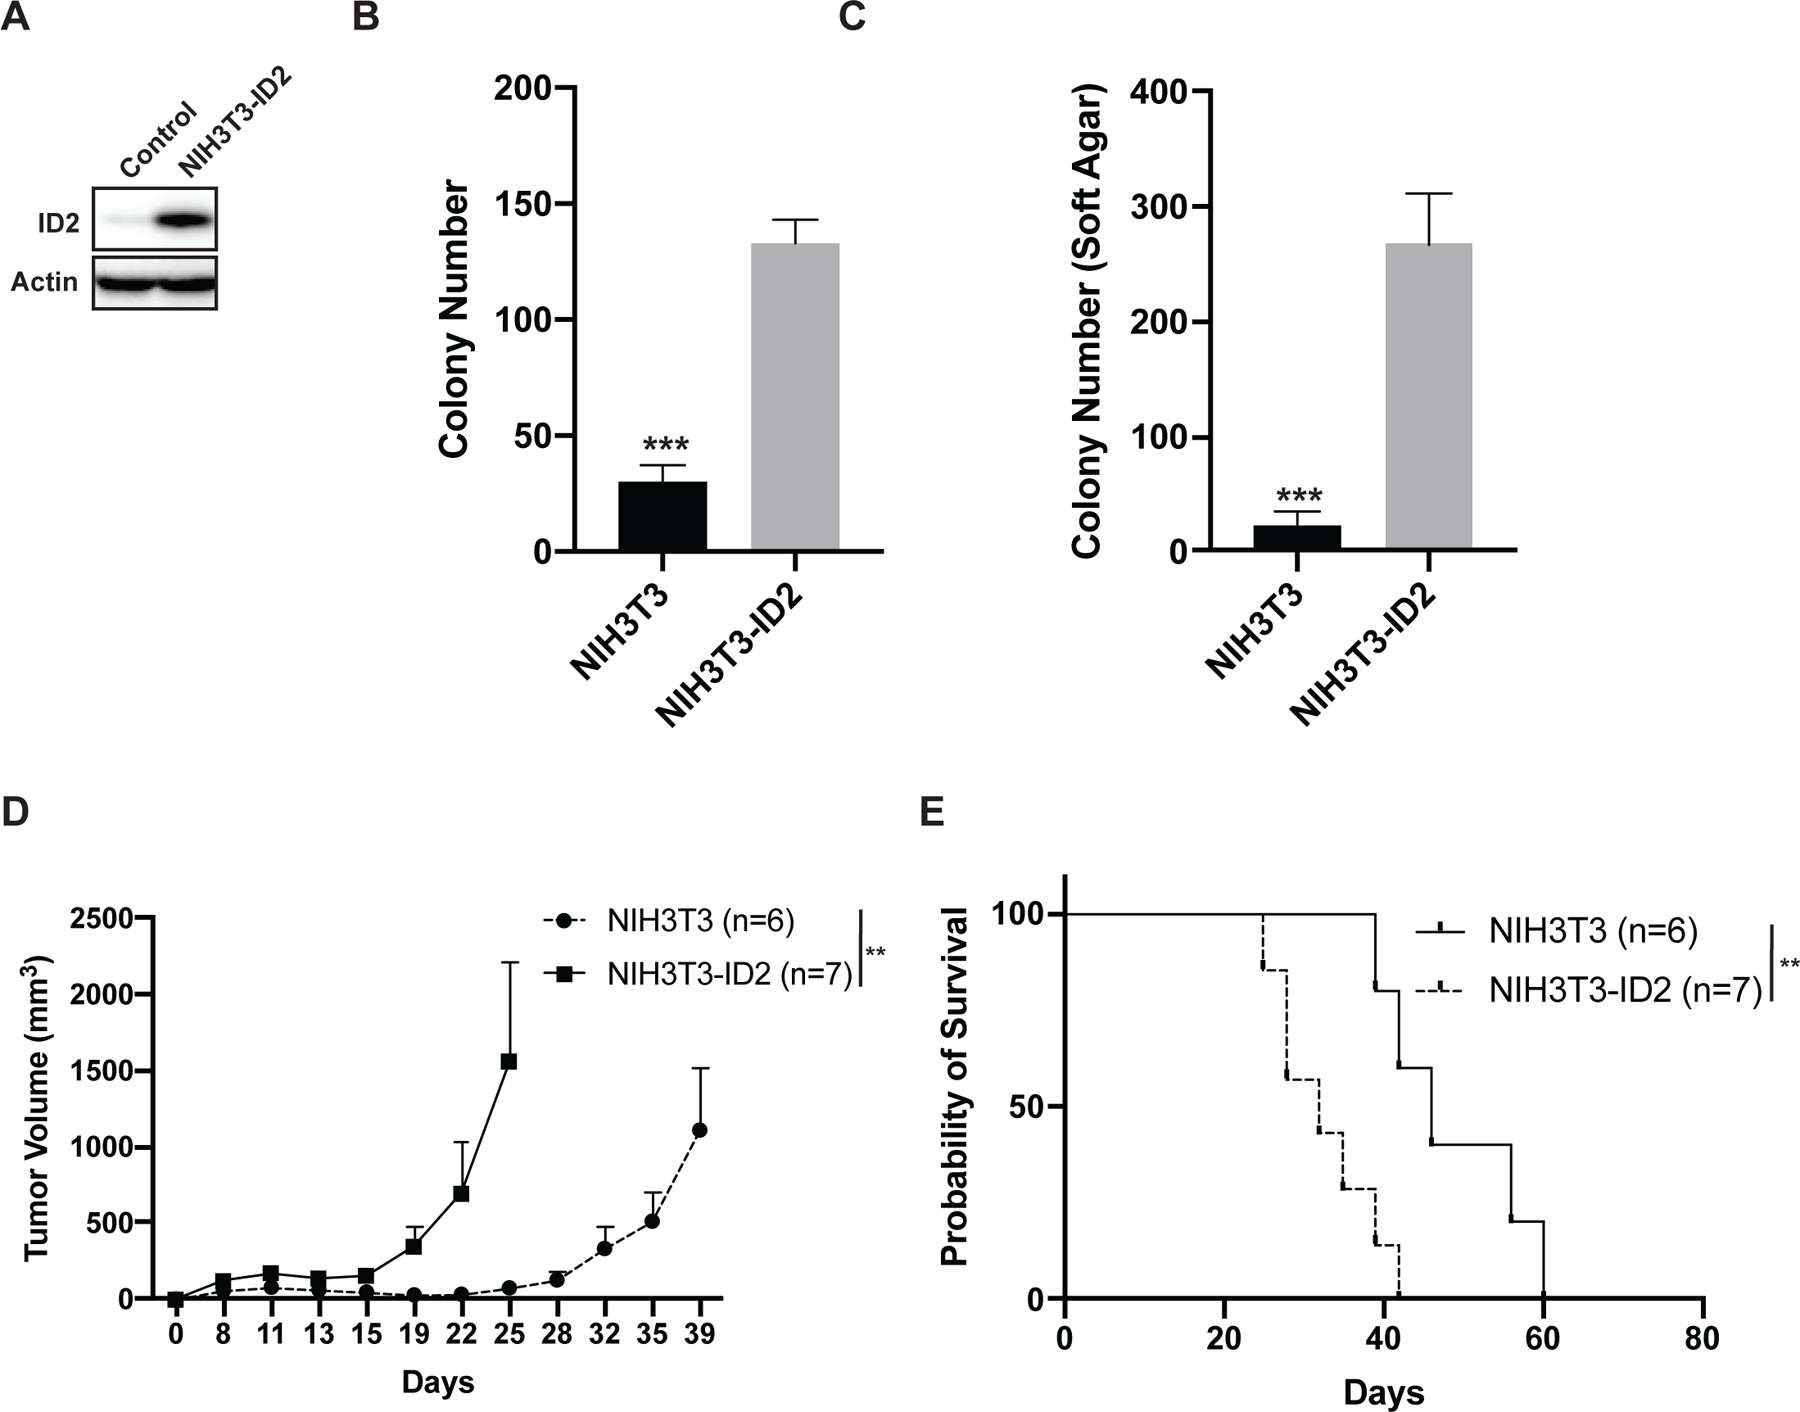
Figure 2. Overexpression of ID2 in NIH3T3 cells increases tumorigenesis in vitro and in vivo.

(A) Immunoblot showing the lentiviral-mediated overexpression of ID2 in NIH3T3 cells. (B) Colony formation assay for NIH3T3 and NIH3T3-ID2 cells. Error bars represent the mean ± SD of three technical replicates. (C) Growth in soft agar of NIH3T3 and NIH3T3-ID2 cells. Error bars represent the mean ± SD of three technical replicates. (D) In vivo growth of NIH3T3 and NIH3T3-ID2 cells in a xenograft experiment. Tumor size was quantified every 2–3 days using caliper measurements. Growth curves for each mouse cohort are shown until mice were removed from that cohort due to tumor size. (E) Kaplan-Meier survival curves for the NIH3T3 and NIH3T3-ID2 mouse cohorts. Mice were sacrificed when tumor reached >2 cm in any dimension. Log-rank (Mantel-Cox) test was used to calculate P-values comparing the survival curves. ** indicates P < 0.01, *** indicates P < 0.001.
