
Figure 3. ID2 regulates the expression of developmental genes in Ewing sarcoma cells.
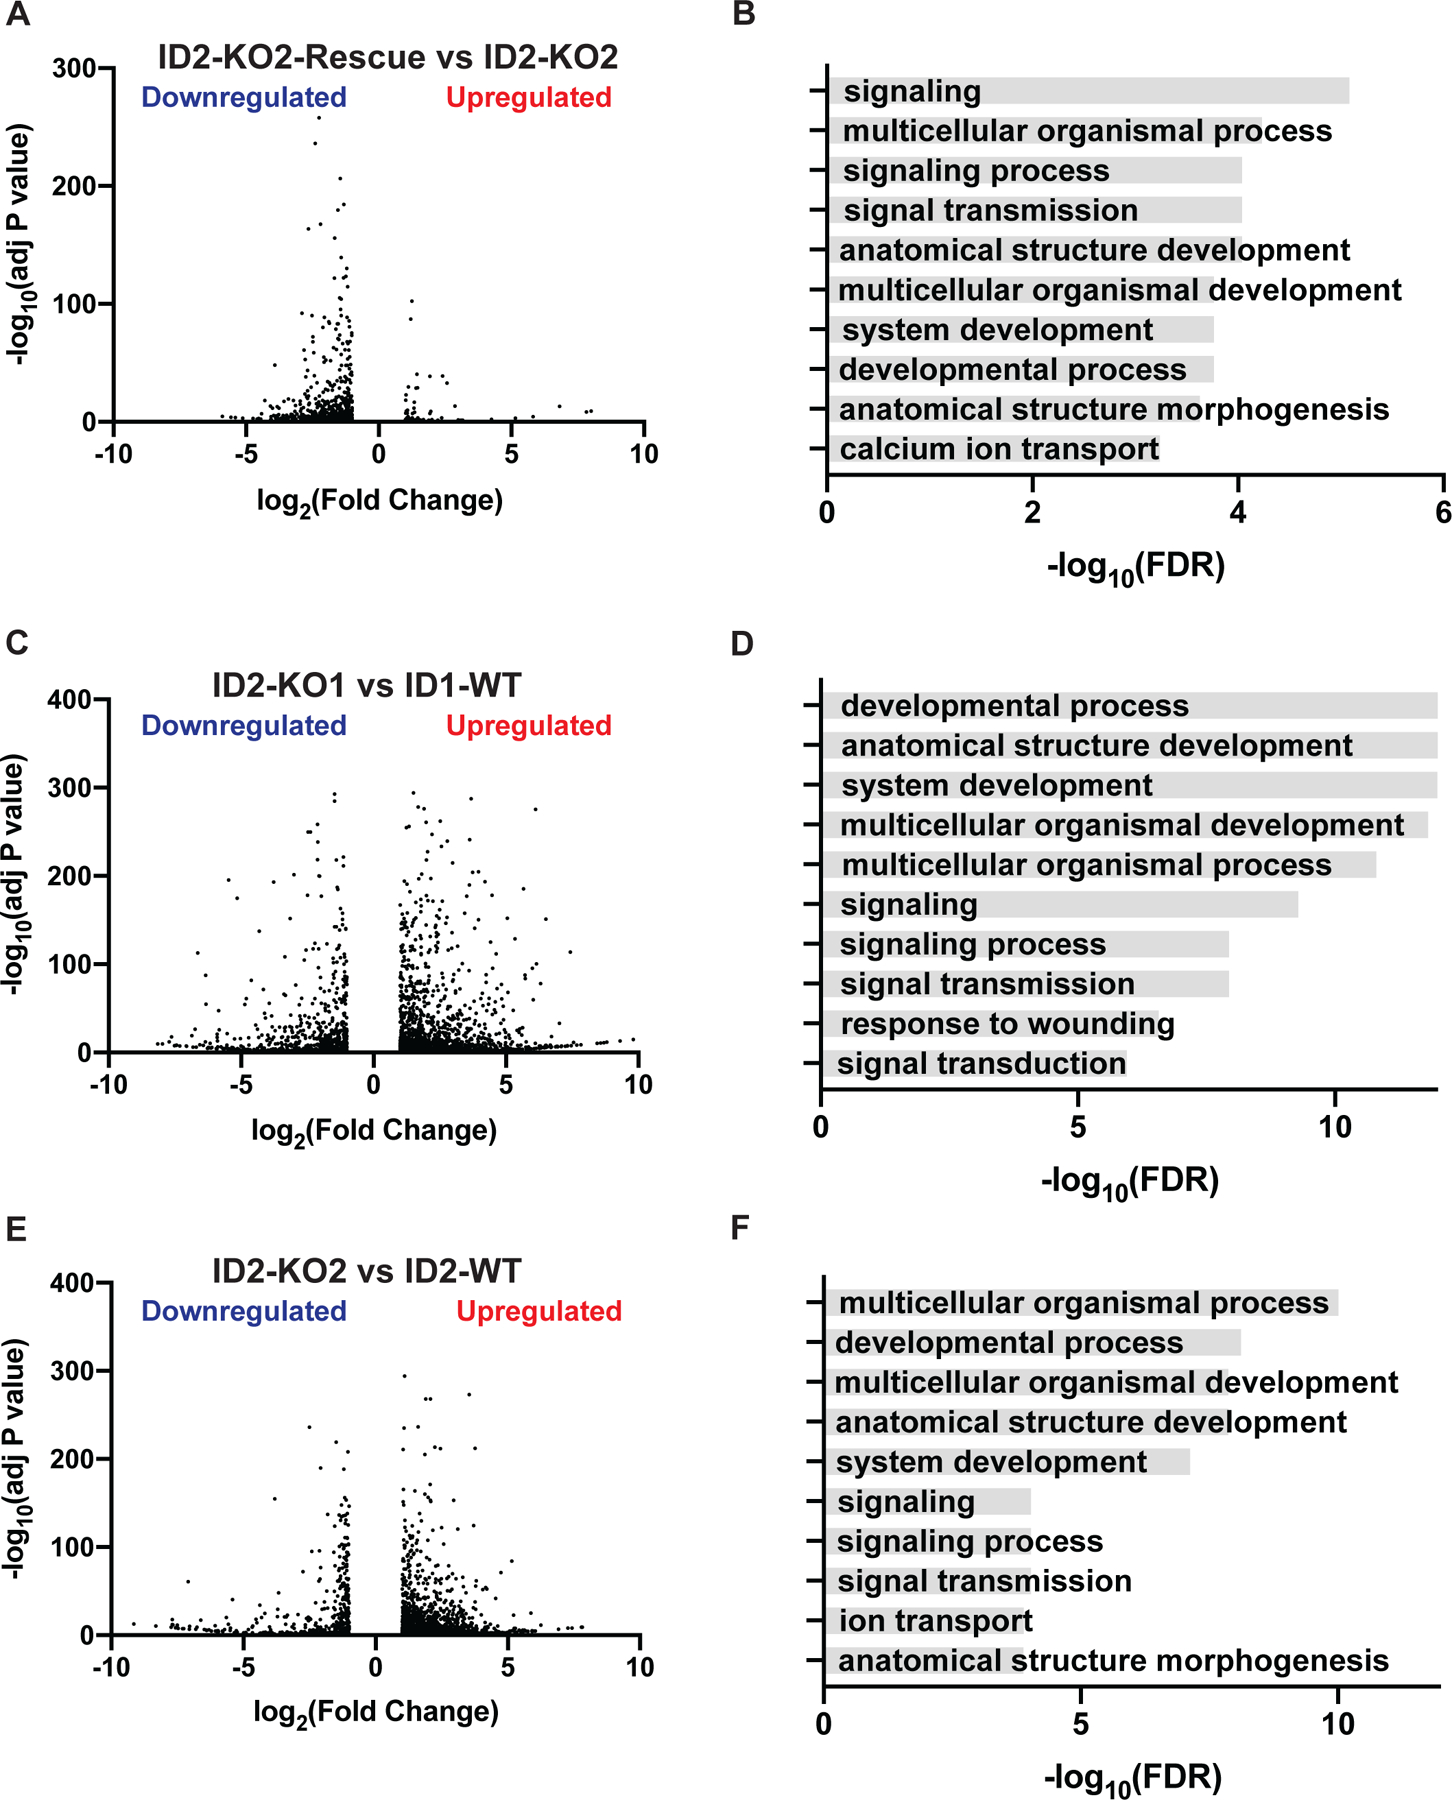
(A) Volcano plot of differentially expressed genes (Fold >2, adjusted P-value <0.05) in the TC71-ID2-KO2 and TC71-ID2-KO2-Rescue cell lines. (B) Top ten gene sets (biological processes) enriched in the upregulated genes in the TC71-ID2-KO2 compared to TC71-ID2-KO2-Rescue cells. (C) Volcano plot of differentially expressed genes (Fold >2, adjusted P-value <0.05) in the TC71-ID2-KO1 and parental TC71 cell lines. (D) Top ten gene sets (biological processes) enriched in the upregulated genes in the TC71-ID2-KO1 cells compared to the parental TC71 cells. (E) Volcano plot of differentially expressed genes (Fold >2, adjusted P-value <0.05) in the TC71-ID2-KO2 and parental TC71 cell lines. (F) Top ten gene sets (biological processes) enriched in the upregulated genes in the TC71-ID2-KO2 cells compared to the parental TC71 cells.