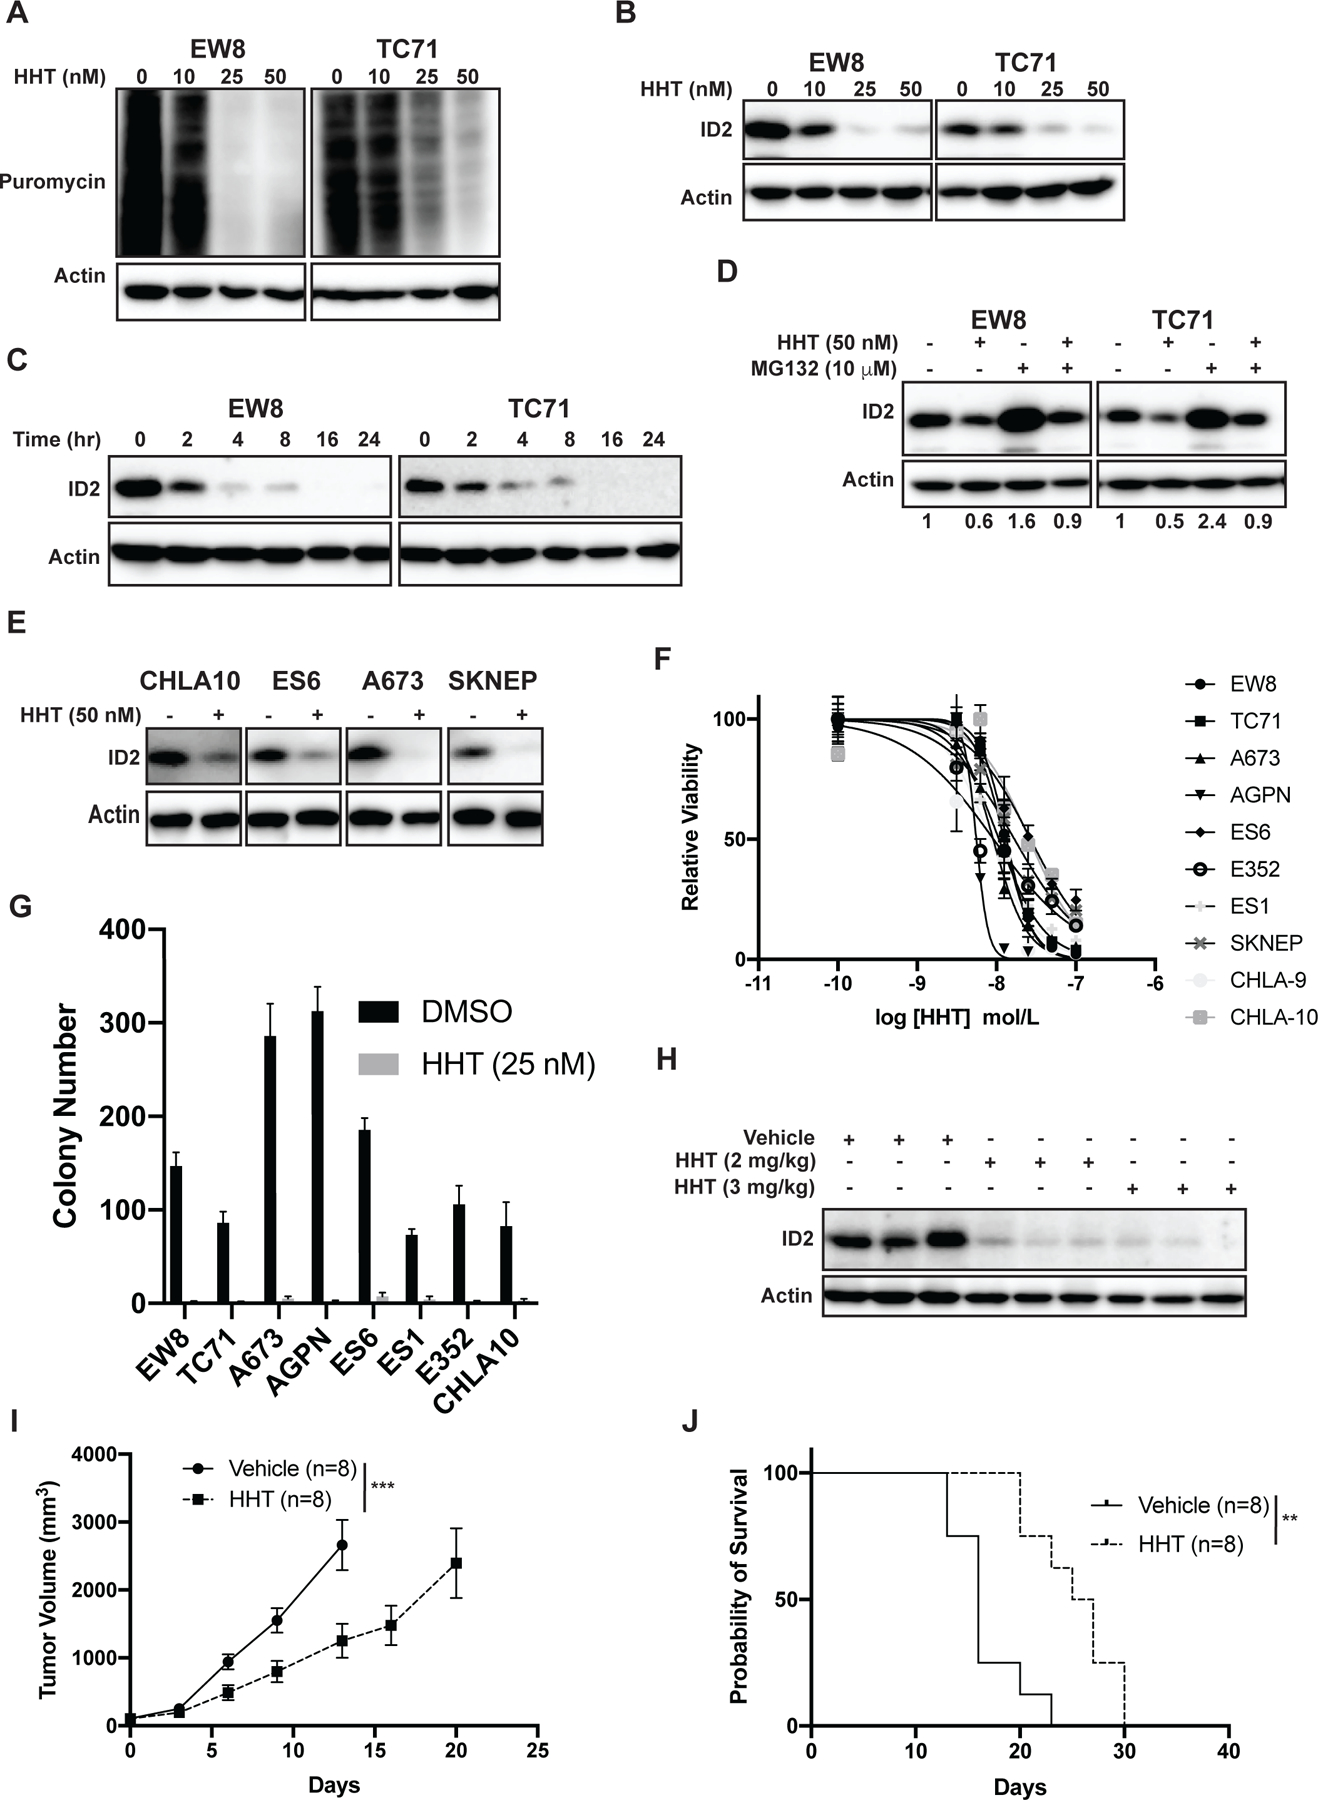
Figure 4. Homoharringtonine (HHT) inhibits protein synthesis and reduces levels of ID proteins in Ewing sarcoma cell lines.

(A) Ewing sarcoma cells were treated with different doses of HHT for 24 hours. Puromycin was then added to the cells for 30 minutes to label newly synthesized proteins. (B) Ewing sarcoma cells were treated with different doses of HHT for 24 hours and lysates were then immunoblotted for ID2. (C) Ewing sarcoma cells were treated with HHT 50 nM for different amounts of time and then protein lysates were collected immunoblotted for ID2. (D) Ewing sarcoma cells were treated with HHT 50 nM in the presence or absence of the proteasome inhibitor MG132. Lysates were then collected and immunoblotted for ID2. (E) Additional Ewing sarcoma cell lines were treated with HHT 50 nM for 24 hours and lysates were then immunoblotted for ID2. (F) Dose-response curves for Ewing sarcoma cell lines treated with different concentrations of HHT for 72 hours. Cell viability was assessed using the AlamarBlue Fluorescence Assay. The results are representative of two independent experiments. Error bars represent mean ± SD of three technical replicates. (G) Colony formation assay for Ewing sarcoma cell lines treated with HHT 25 nM or vehicle. Error bars represent the mean ± SD of three technical replicates. (H) Mice with TC71 xenograft tumors were treated with HHT (2 mg/kg or 3 mg/kg) and tumors were then collected four hours after drug administration. Immunoblots for ID2 were performed. (I) TC71 Ewing sarcoma cells were engrafted in NCr mice. After developing tumors, the mice were divided into two cohorts and treated with either vehicle or HHT (2 mg/kg/day, IP, days 1–28). Tumor size was quantified using caliper measurements. Growth curves for each mouse cohort are shown until mice were removed from that cohort due to tumor size. (J) Kaplan-Meier survival curves for the TC71 xenograft mice treated with either vehicle or HHT. Mice were sacrificed when tumor reached >2 cm in any dimension. Log-rank (Mantel-Cox) test was used to calculate P-values comparing the survival curves. ** indicates P < 0.01.
