Abstract
Centromeres are defined epigenetically by the histone H3 variant, CENP-A. The propagation cycle by which preexisting CENP-A nucleosomes serve as templates for nascent assembly predicts epigenetic memory of weakened centromeres. Using a mouse model with reduced levels of CENP-A nucleosomes, we find that an embryonic plastic phase precedes epigenetic memory through development. During this phase, nascent CENP-A nucleosome assembly depends on the maternal Cenpa genotype rather than the preexisting template. Weakened centromeres are thus limited to a single generation, and parental epigenetic differences are eliminated by equal assembly on maternal and paternal centromeres. These differences persist, however, when the underlying DNA of parental centromeres differs in repeat abundance, as assembly during the plastic phase also depends on sufficient repetitive centromere DNA. With contributions of centromere DNA and Cenpa maternal effect, we propose that centromere inheritance naturally minimizes fitness costs associated with weakened centromeres or epigenetic differences between parents.
Centromeres are essential for faithful mitotic and meiotic segregation of chromosomes as vehicles for genetic inheritance1. There is strong evidence for genetic contributions from typically highly repetitive centromere DNA in centromere function2 and competition in female meiotic drive3–6. However, mammalian chromosomes lacking typical centromere DNA reveal the essential epigenetic component7–10 provided by nucleosomes containing the histone H3 variant, CENP-A11. In somatic cells, centromere chromatin is maintained by an epigenetic propagation cycle in which preexisting CENP-A nucleosomes dictate local nascent CENP-A chromatin assembly12–16, suggesting epigenetic memory of the number of CENP-A nucleosomes. In the germline, such memory implies that any reduction in CENP-A chromatin would persist to the next generation. Differences between maternal and paternal centromeres would also persist, leading to asymmetries associated with embryonic aneuploidy and even elimination of one parental genome in plants17,18 and with biased segregation of paired homologous chromosomes in meiosis4,5. Epigenetic memory from one generation to the next through the germline has not been tested in mammals, and results in other model systems are conflicting. Lowering levels of a CENP-A transgene in fruit fly sperm led to lower levels of CENP-A in some chromosomes of offspring19, consistent with epigenetic memory. In worms, however, centromere identity is thought to be independent of CENP-A nucleosomes inherited from the prior generation20. Thus, whether or not there is memory of the state of centromeric chromatin between generations remains an open question.
Results
Weakened centromeres persist in the male germline and soma
To test for epigenetic memory of weakened centromeres with reduced CENP-A chromatin in mammals, we generated heterozygous (H) Cenpa+/− mice (Methods). CENP-A chromatin is reduced to 43.0 ± 0.019%, 48.6 ± 0.003% and 53.8 ± 0.004% (Mean ± S.E.M.) of control levels in the soma, male gametes and female gametes, respectively, from these animals (Fig. 1a–c and Extended Data Fig. 1, P0 generation). This model system allows us to test two predictions of epigenetic memory between generations. First, weakened centromeres inherited from the gametes should persist in genetically wild type animals. In a cross between two Cenpa+/− parents (H × H), Cenpa+/+ progeny should maintain reduced CENP-A chromatin (Fig. 1b, F1 generation). Second, memory should be centromere autonomous, with each centromere remembering its own levels, so that inherited differences persist through development. In a cross between a Cenpa+/+ mother and a Cenpa+/− father (WT♀ × H♂), Cenpa+/+ progeny should maintain a large epigenetic difference between the maternal and paternal centromeres.
Fig. 1: Evidence for epigenetic centromere memory through mouse reproduction.
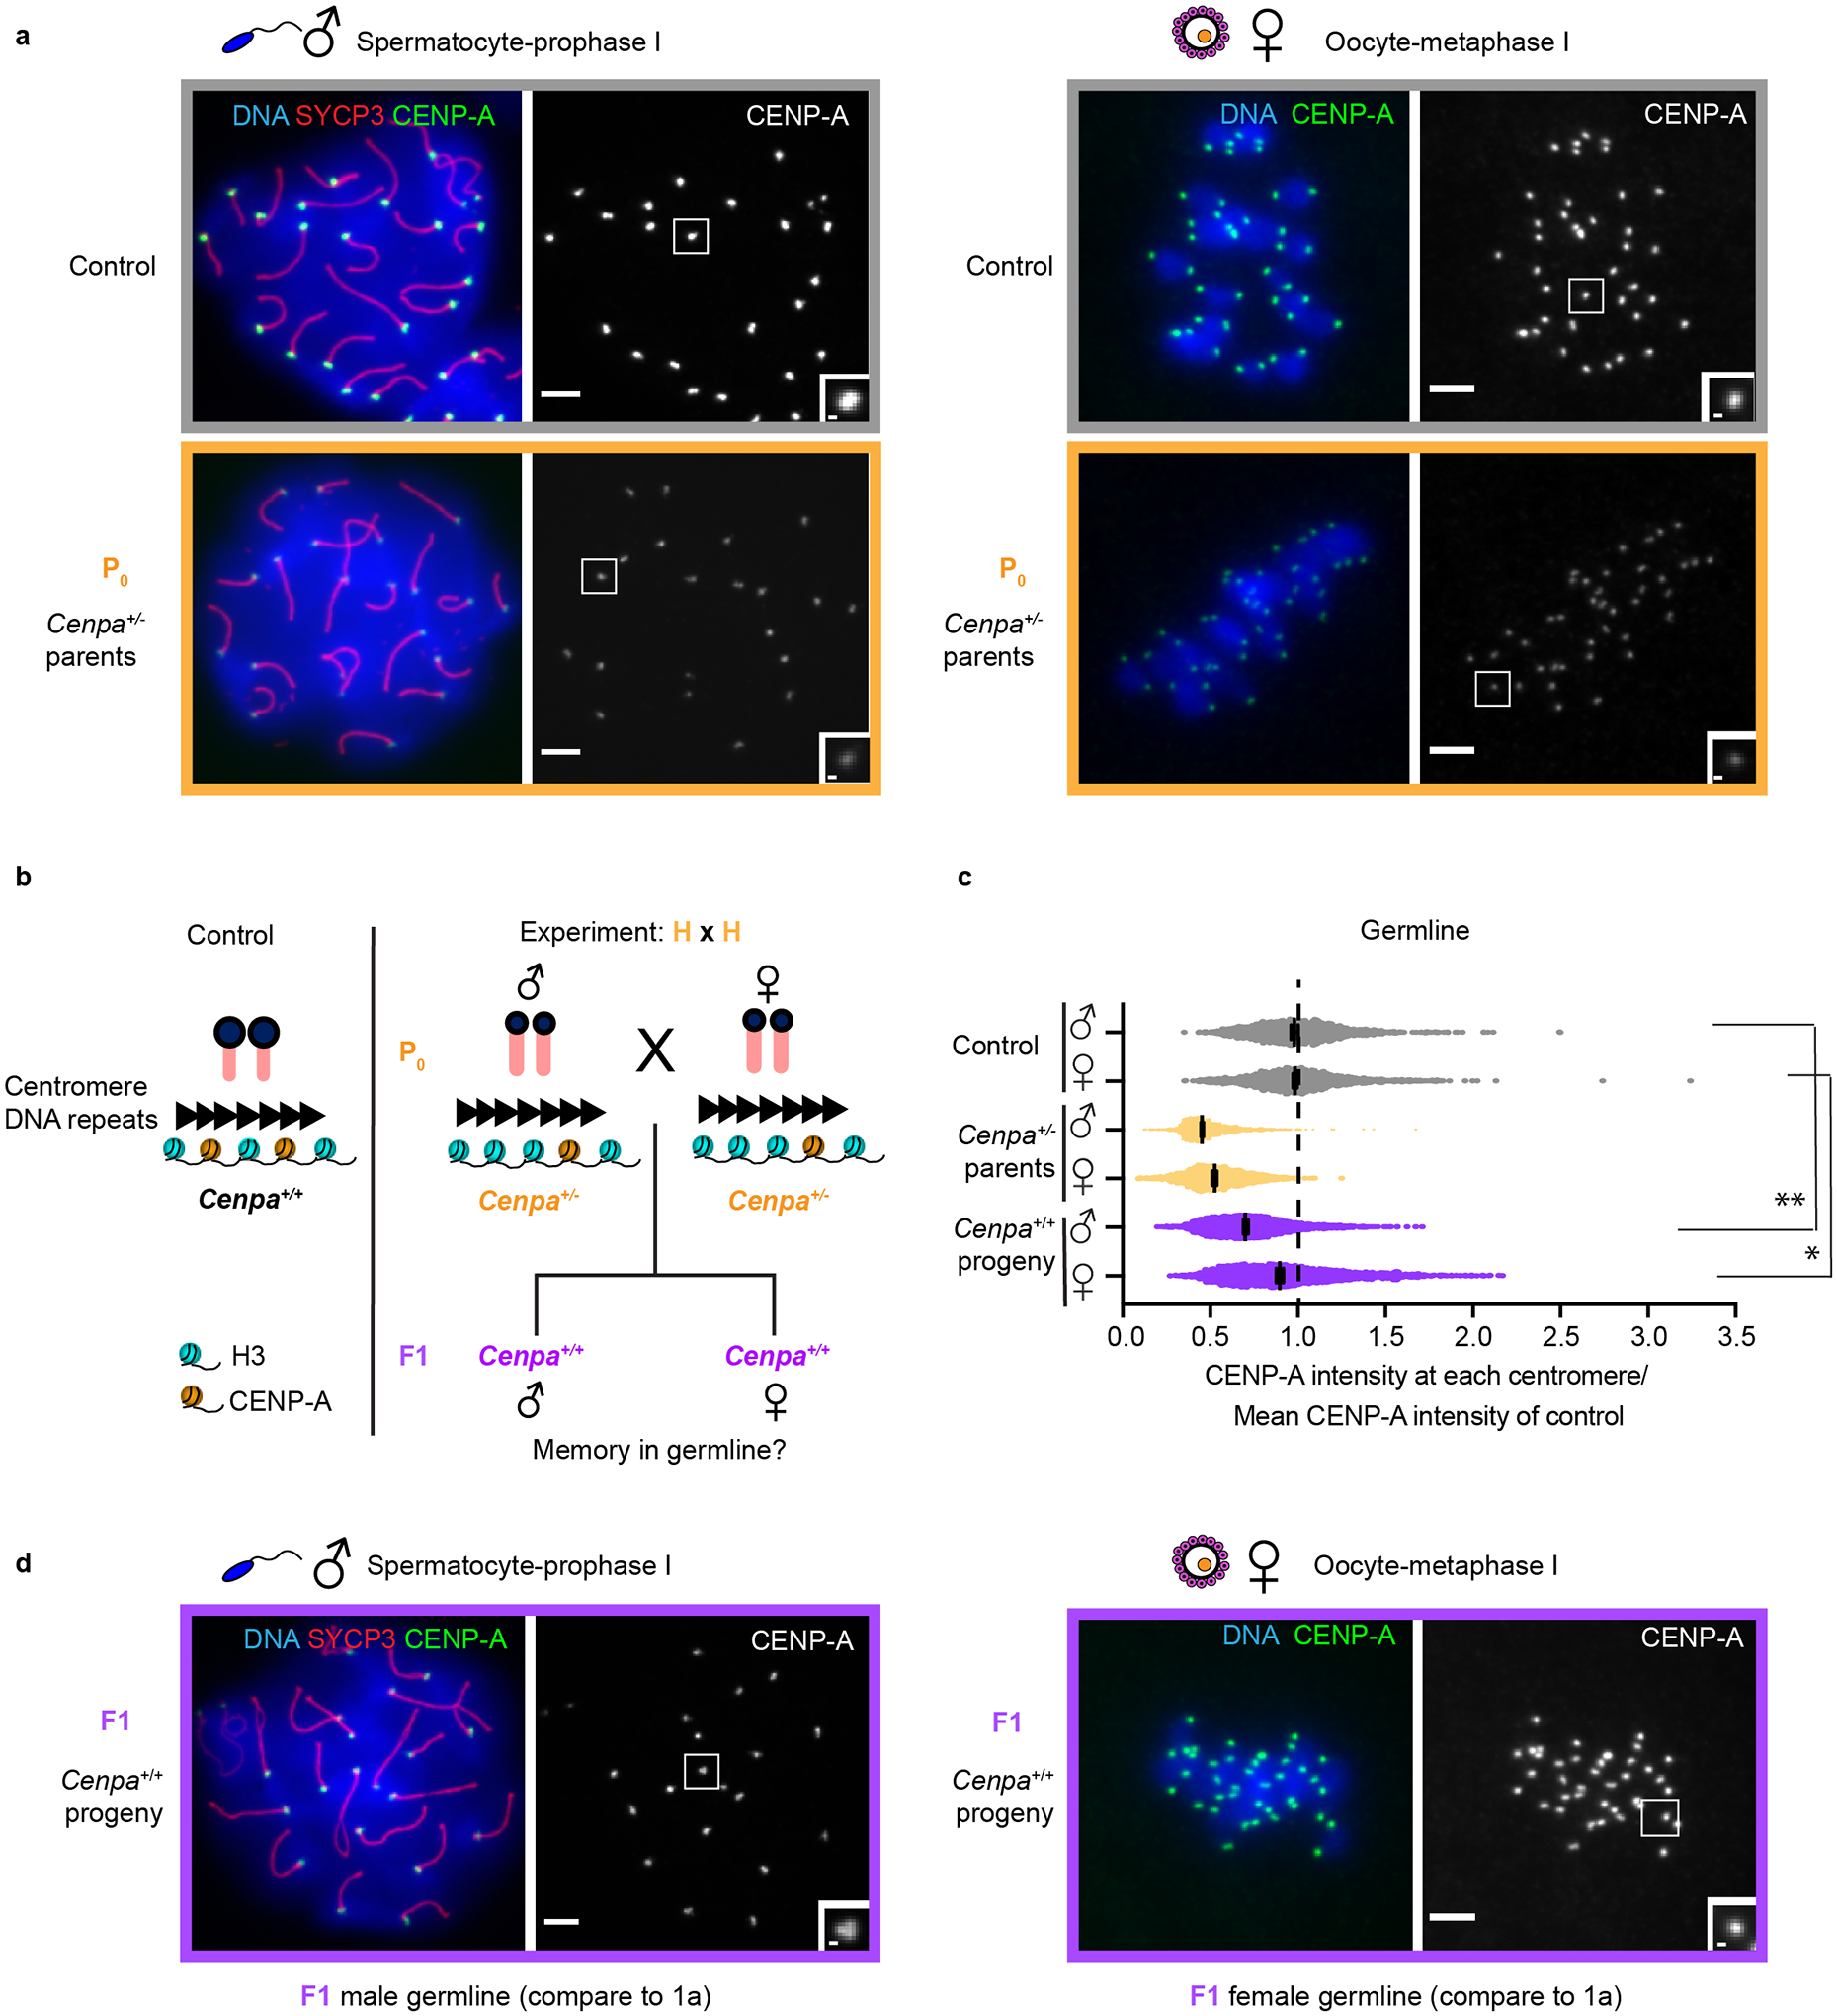
a, Spermatocytes at prophase I and oocytes at metaphase I for the P0 generation compared to control. Each of the CENP-A foci represents four centromeres in spermatocytes (a pair of homologous chromosomes, each with two sisters) or two sister centromeres in oocytes. SYCP3, a synaptonemal complex element, marks prophase I spermatocytes. b, Mating scheme to test memory in the F1 generation. c, Quantification of CENP-A foci intensities in control (grey), P0 (yellow) and F1 (purple) generations in germline (a and d). N = 1576, 1608, 1722, 1412, 1836, 1473 centromeres (top to bottom). **/* P<0.0001/P< 0.05, Mann-Whitney U test (two-tailed). Error bars: median ± 95% CI. See also Supplementary Table 1. d, Spermatocyte and oocyte at prophase I and metaphase I, respectively (F1 generation). e, Bone marrow metaphase spreads (control and F1 generation) are representative of both male and females: each pair of CENP-A foci represents sister centromeres in mitosis. Scale bars: 5 μm (main panel), 1μm (inset). Source numerical data are available in source data.
For the first prediction, we find reduced CENP-A levels (72.7 ± 0.005%) at centromeres in the male germline of Cenpa+/+ progeny of Cenpa+/− parents, relative to controls with wild type parents (Fig. 1c,d and Extended Data Fig. 2). Thus, weakened centromeres persists through development of the male germline in the next generation, consistent with epigenetic memory, although the partial recovery suggests that memory is incomplete. In contrast, the female germline nearly completely recovers centromere chromatin (94.7 ± 0.008% of controls with wild type parents), indicating loss of epigenetic memory in one generation (Fig. 1c,d and Extended Data Fig. 3a). This unexpected dichotomy is underscored by analysis of male and female littermates showing differential recovery of centromere chromatin in their germlines (Extended Data Fig. 3b). Our results raised the question of whether weakened centromeres persist in somatic tissues. Using bone marrow as a representative tissue, we find reduced CENP-A levels in both male and female soma like the male germline (69.7 ± 0.012%, Fig. 2 and Extended Data Fig. 3a). These results are consistent with epigenetic centromere memory between generations and through mouse development, but the female germline recovers normal CENP-A chromatin levels.
Fig. 2: Male and female soma show reduced CENP-A in contrast to oocytes.
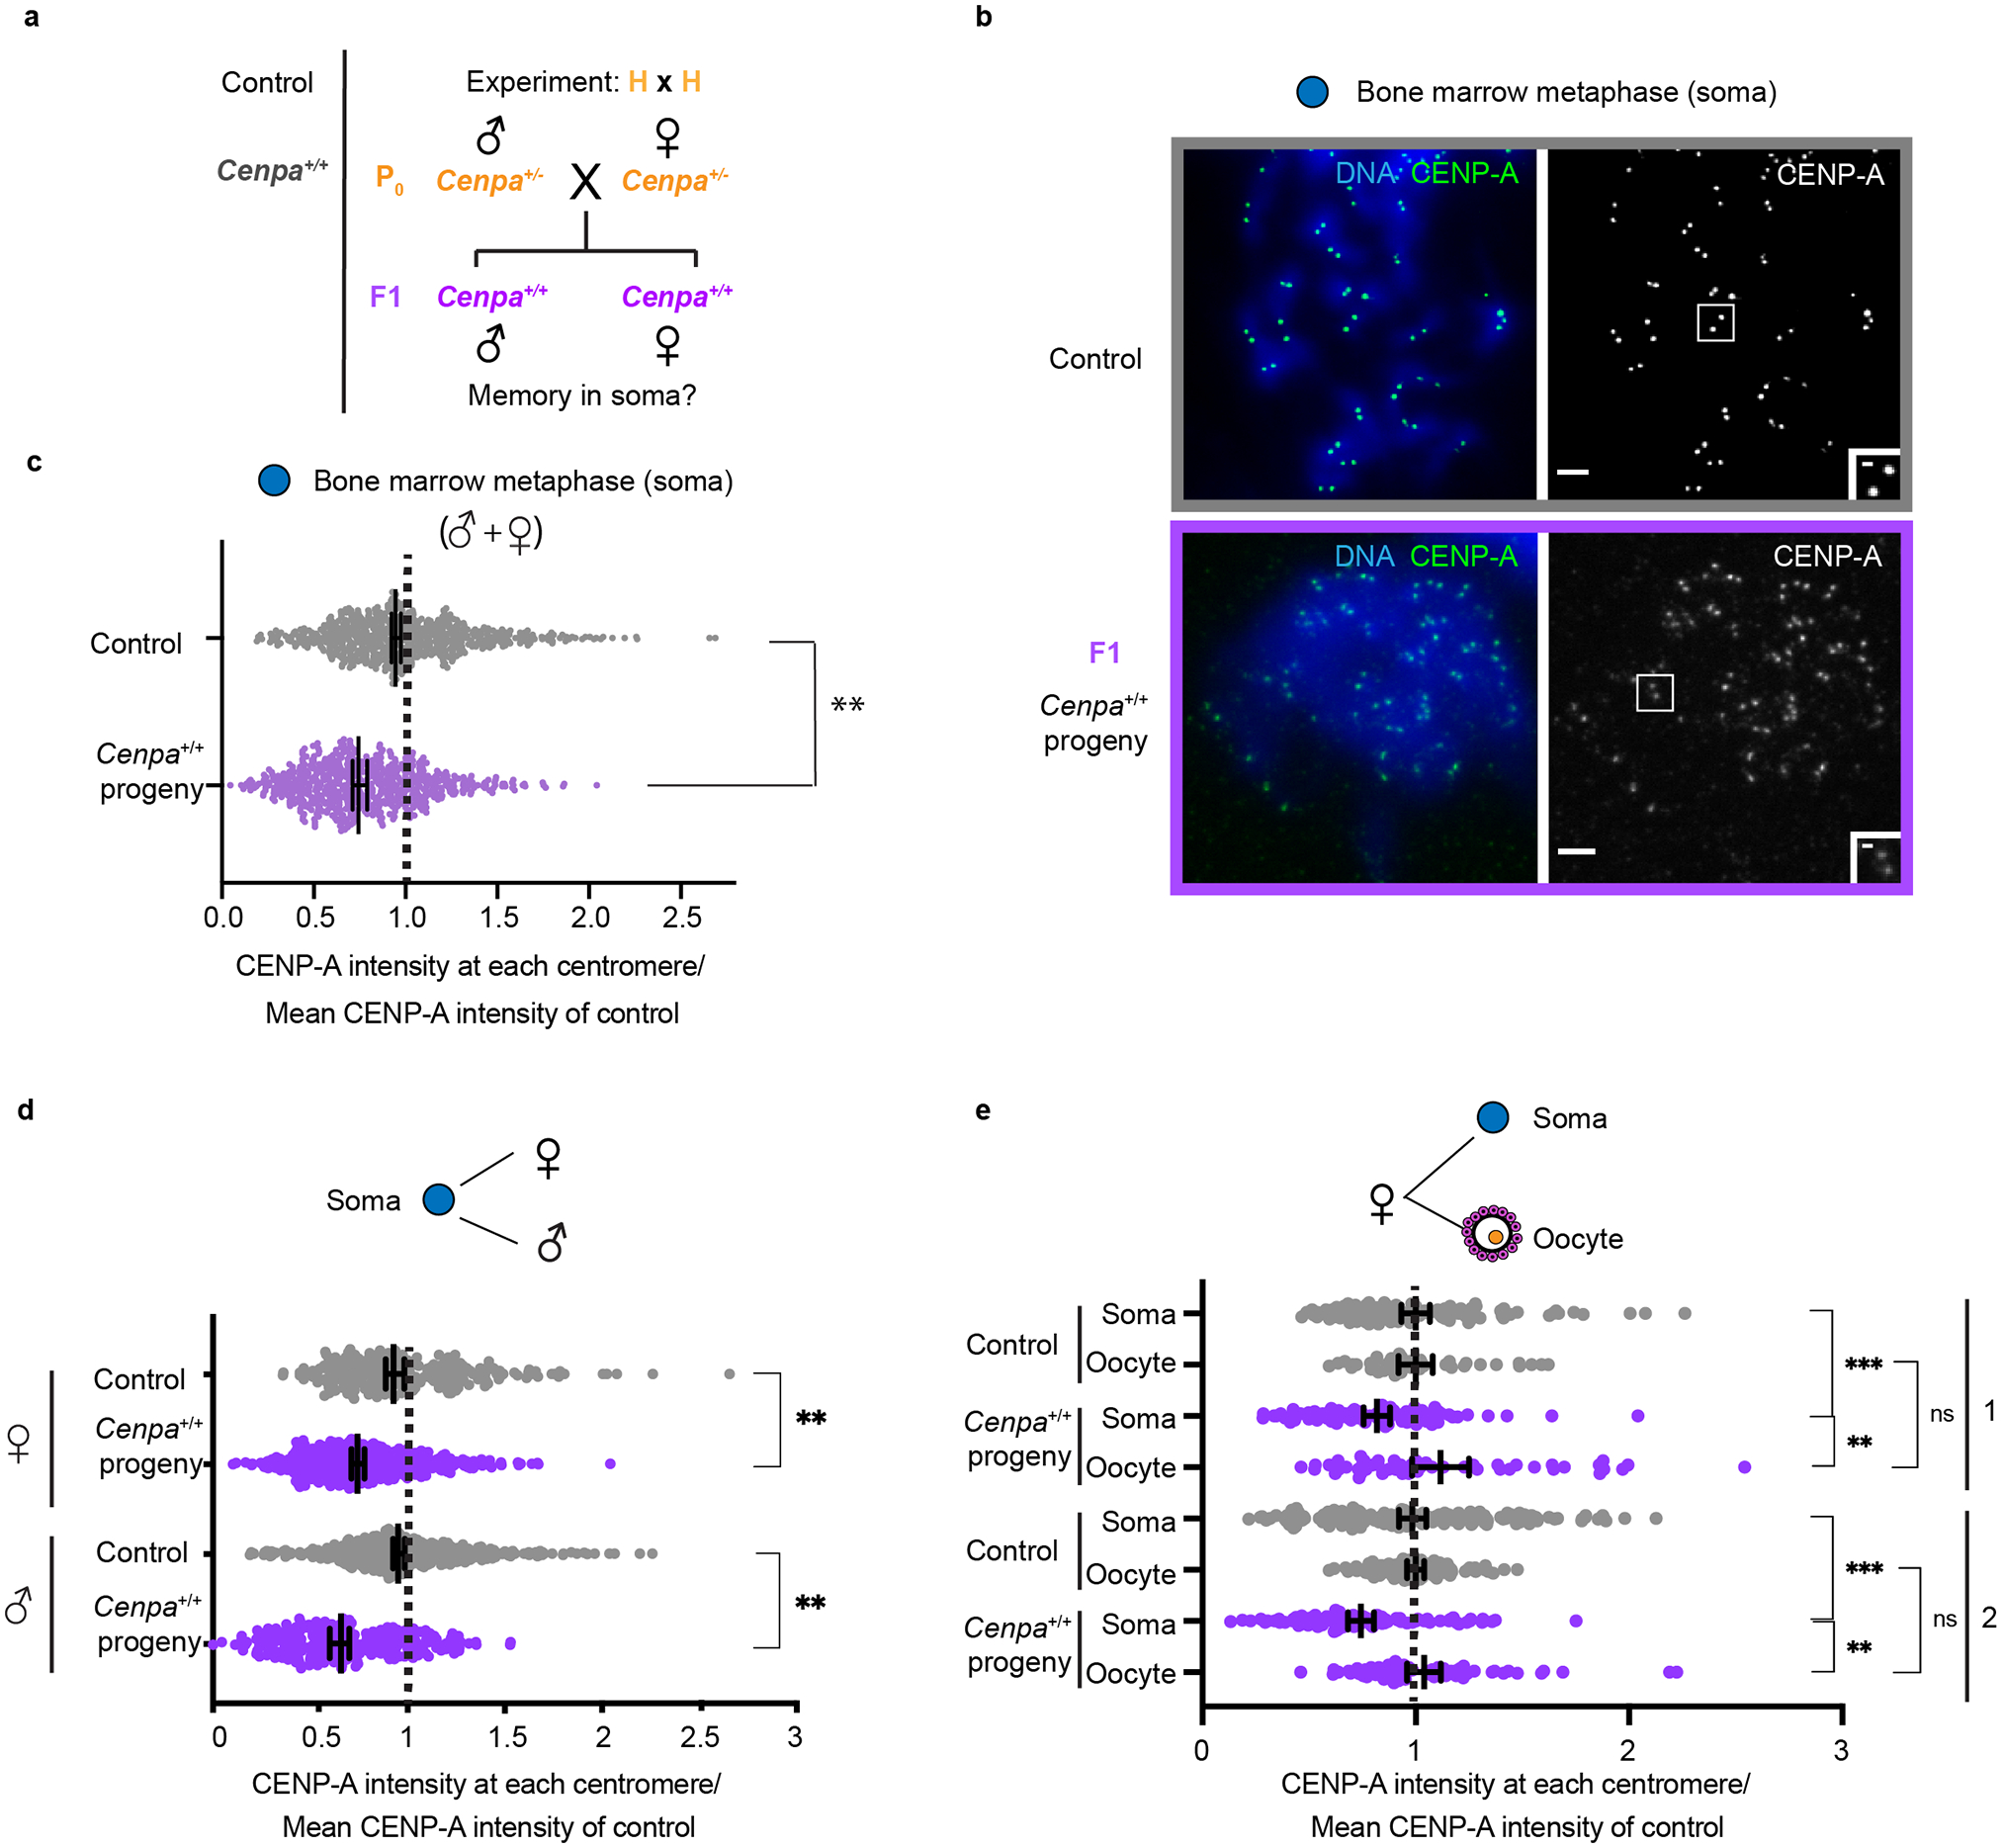
a, Mating scheme to test memory in the soma in the F1 generation. b, Bone marrow metaphase spreads (control and F1 generation) are representative of both male and females: each pair of CENP-A foci represents sister centromeres in mitosis. c, Quantification of CENP-A foci intensities in control (grey) and F1 (purple) generations in male and female soma combined. N = 642, 684 centromeres (top to bottom). **/* P<0.0001/P< 0.05, Mann-Whitney U test (two-tailed). d, Pooled male and female CENP-A intensities from Fig. 2c, replotted with male and female separated to show that both contain weakened centromeres. N = 251, 433, 390, 251 centromeres (top to bottom). e, Quantification of CENP-A chromatin showing weakened centromeres in the soma compared to oocytes from the same female. Two independent experiments (1, 2) are shown, each comparing a single F1 animal (from H × H cross) to controls. N = 112, 44, 94, 51, 169, 89, 98, 68 centromeres (top to bottom). **/*= P<0.001/P<0.01, Mann-Whitney U test (two tailed). Error bars: median ± 95% CI. Scale bars: 5 μm (main panel), 1μm (inset). Source numerical data are available in source data.
Zygotic centromere differences are not maintained in adults
Prior to testing the second prediction (Fig. 3a), we noted that zygotes from WT × WT crosses exhibit lower CENP-A levels on paternal centromeres identified by the absence of H3K9me321–23 (paternal/maternal ratio = 0.5, Fig. 3b,c). Mammalian CENP-A nucleosomes are retained robustly in sperm24–26 relative to canonical nucleosomes that are largely replaced by protamines, and indeed we find no measurable loss of CENP-A nucleosomes during the histone-to-protamine exchange in spermiogenesis (Fig. 3d,e and Extended Data Fig. 4). The difference between maternal and paternal centromeres in the zygote could reflect either some loss of CENP-A nucleosomes during the protamine-to-histone exchange in the zygote and/or excess loading in the oocyte consistent with the recovery observed in the Cenpa+/+ progeny of Cenpa+/− parents (Fig. 1). As we anticipated, the difference between maternal and paternal centromeres is enhanced (ratio = 0.4) in F1 zygotes from the WT♀ × H♂ cross compared to the WT × WT cross (Fig. 3b,c). This result does not depend on the zygotic genotype because the zygotic genome is not transcribed at this stage. To determine whether this zygotic difference is maintained in adults, as predicted by centromere autonomous epigenetic memory12,15, we analyzed meiotic bivalents containing one centromere inherited from each parent. In both the female and male germlines, we find that the ratio between the centromeres of paired homologous chromosomes is indistinguishable from controls (Fig. 3f,g), indicating that initial zygotic differences are not maintained. These results from the WT♀ × H♂ cross are inconsistent with epigenetic centromere memory, in contrast to results from the H × H cross.
Fig. 3: Epigenetic differences between parental centromeres are not maintained.
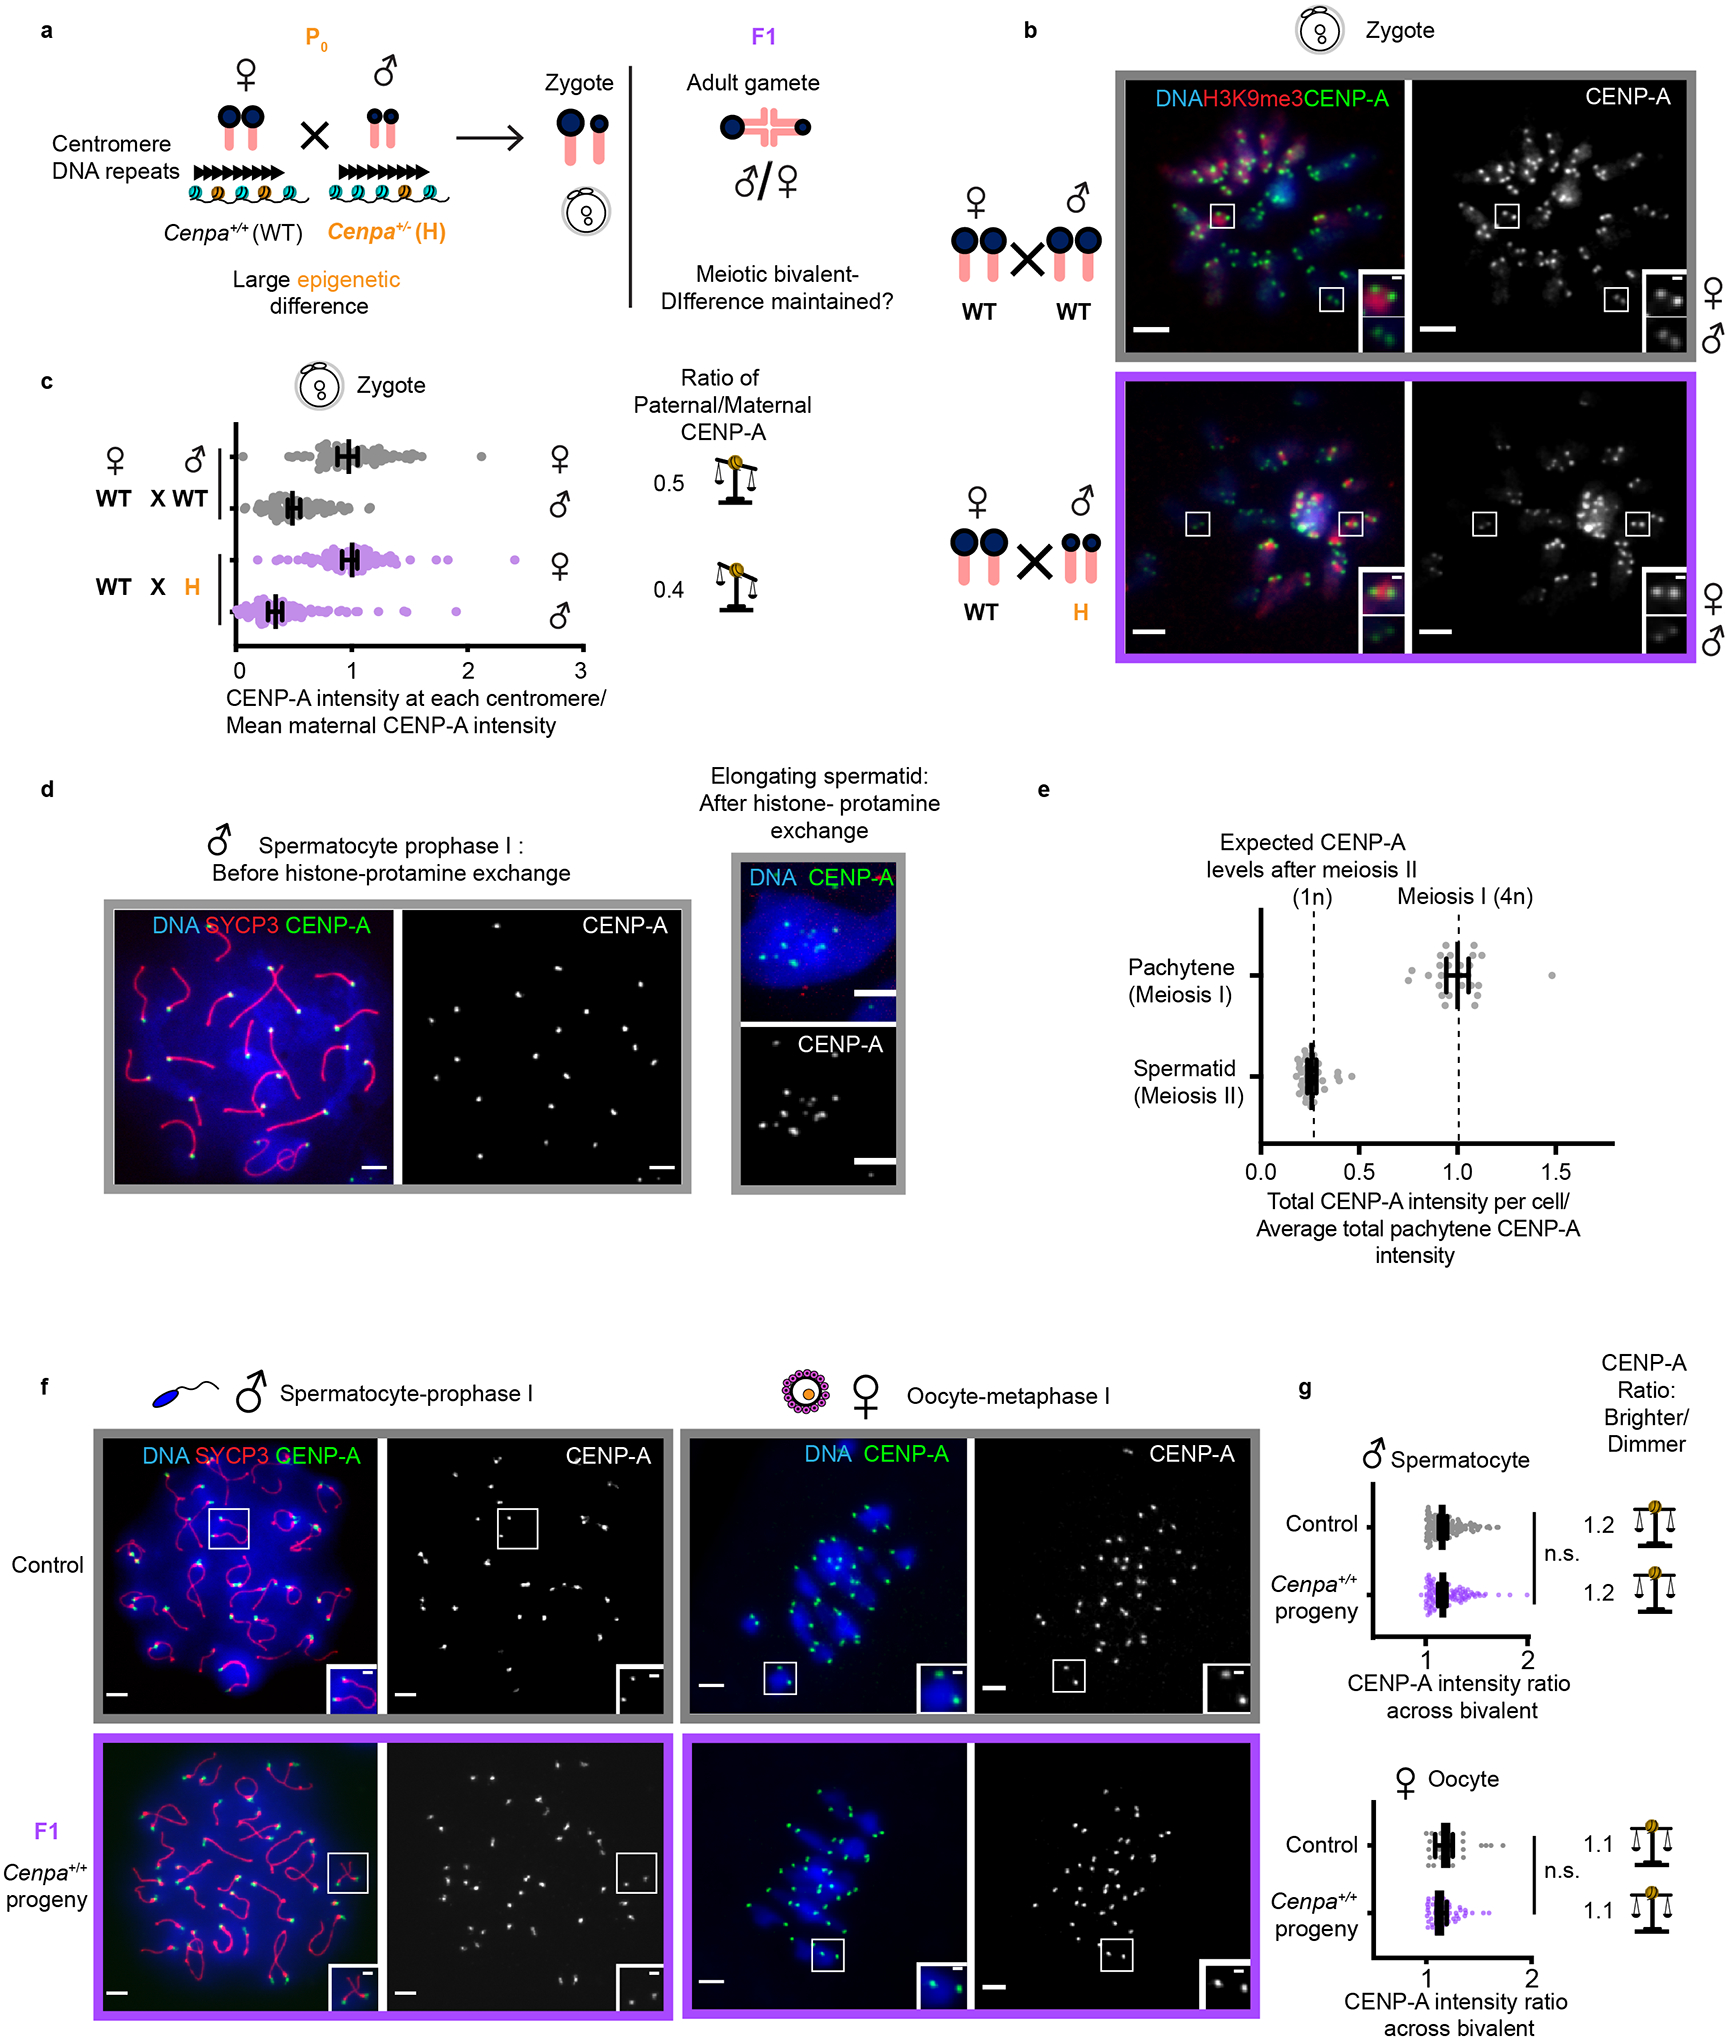
a, Mating scheme to create epigenetic differences between maternal and paternal centromeres in F1. b, Zygotes (one-cell embryos) from WT × WT (control) and WT♀ × H♂ crosses. Each pair of CENP-A foci represents sister centromeres in mitosis. Insets show 1.5x magnified maternal and paternal centromeres distinguished by H3K9me3. c, Quantification of maternal and paternal CENP-A intensities are shown in zygotes combined from two independent experiments with ratios designated for each cross; N = 89, 90, 145, 143 centromeres (top to bottom). The balance symbol indicates the extent of epigenetic differences between parental centromeres. d, Representative images of spermatocyte pachytene (prophase of meiosis I, 4n) and an elongating spermatid (after completing meiosis II and histone-protamine exchange50,51, 1n) from control (Cenpa+/+) animals. e, Quantification of total CENP-A levels per cell; N = 26 spermatocytes or 35 spermatids. The observed reduction to 25% in spermatids (1n) compared to prophase I spermatocytes (4n) is expected if there is no loss during the histone-protamine exchange. f, Diplotene spermatocyte spreads and metaphase I oocytes in F1. During diplotene, centromeres of paired homologous chromosomes (marked with SYCP3 in red) can be resolved. Each inset shows a pair of homologous chromosomes (bivalent), and each of the CENP-A foci represents two sister centromeres. g, Quantification of the ratio of CENP-A foci intensities across a meiotic bivalent (brighter/dimmer) in male and female gametes from d, N = 122, 124, 30, 56 bivalents (top to bottom). n.s.: P>0.05, Mann Whitney U test (two tailed). Error bars: median ± 95% CI. Scale bars: 5 μm (main panel), 1μm (inset). Source numerical data are available in source data.
Centromere strength depends on the maternal Cenpa genotype
The conflicting results from our H × H and WT♀ × H♂ crosses suggest that the weakened centromere state in the progeny might reflect a reduced maternal pool of Cenpa gene products, rather than the number of CENP-A nucleosomes inherited in the gametes. To investigate this possibility, we compared reciprocal crosses in which either parent is heterozygous while the other is wild type (Fig. 4a) to our original H × H cross. We find that the maternal genotype is key: if the mother is heterozygous, the weakened centromere state persists in the male germline of the F1 progeny regardless of whether the father has weakened centromeres (72.7 ± 0.005% versus 78.4 ± 0.008%, both relative to control, Fig. 4b–d). Conversely, if the mother is wild type, then weakened paternal centromeres completely recover in the male germline of the F1 progeny (104.1 ± 0.024% relative to control, Fig. 4c,d). Consistent with this result, we find that the maternal but not the paternal Cenpa+/− heterozygous genotype has functional consequences for reproductive fitness, with reduced litter size only when the mother is heterozygous (Fig. 4e).
Fig. 4: Centromere strength depends on maternally inherited CENP-A.
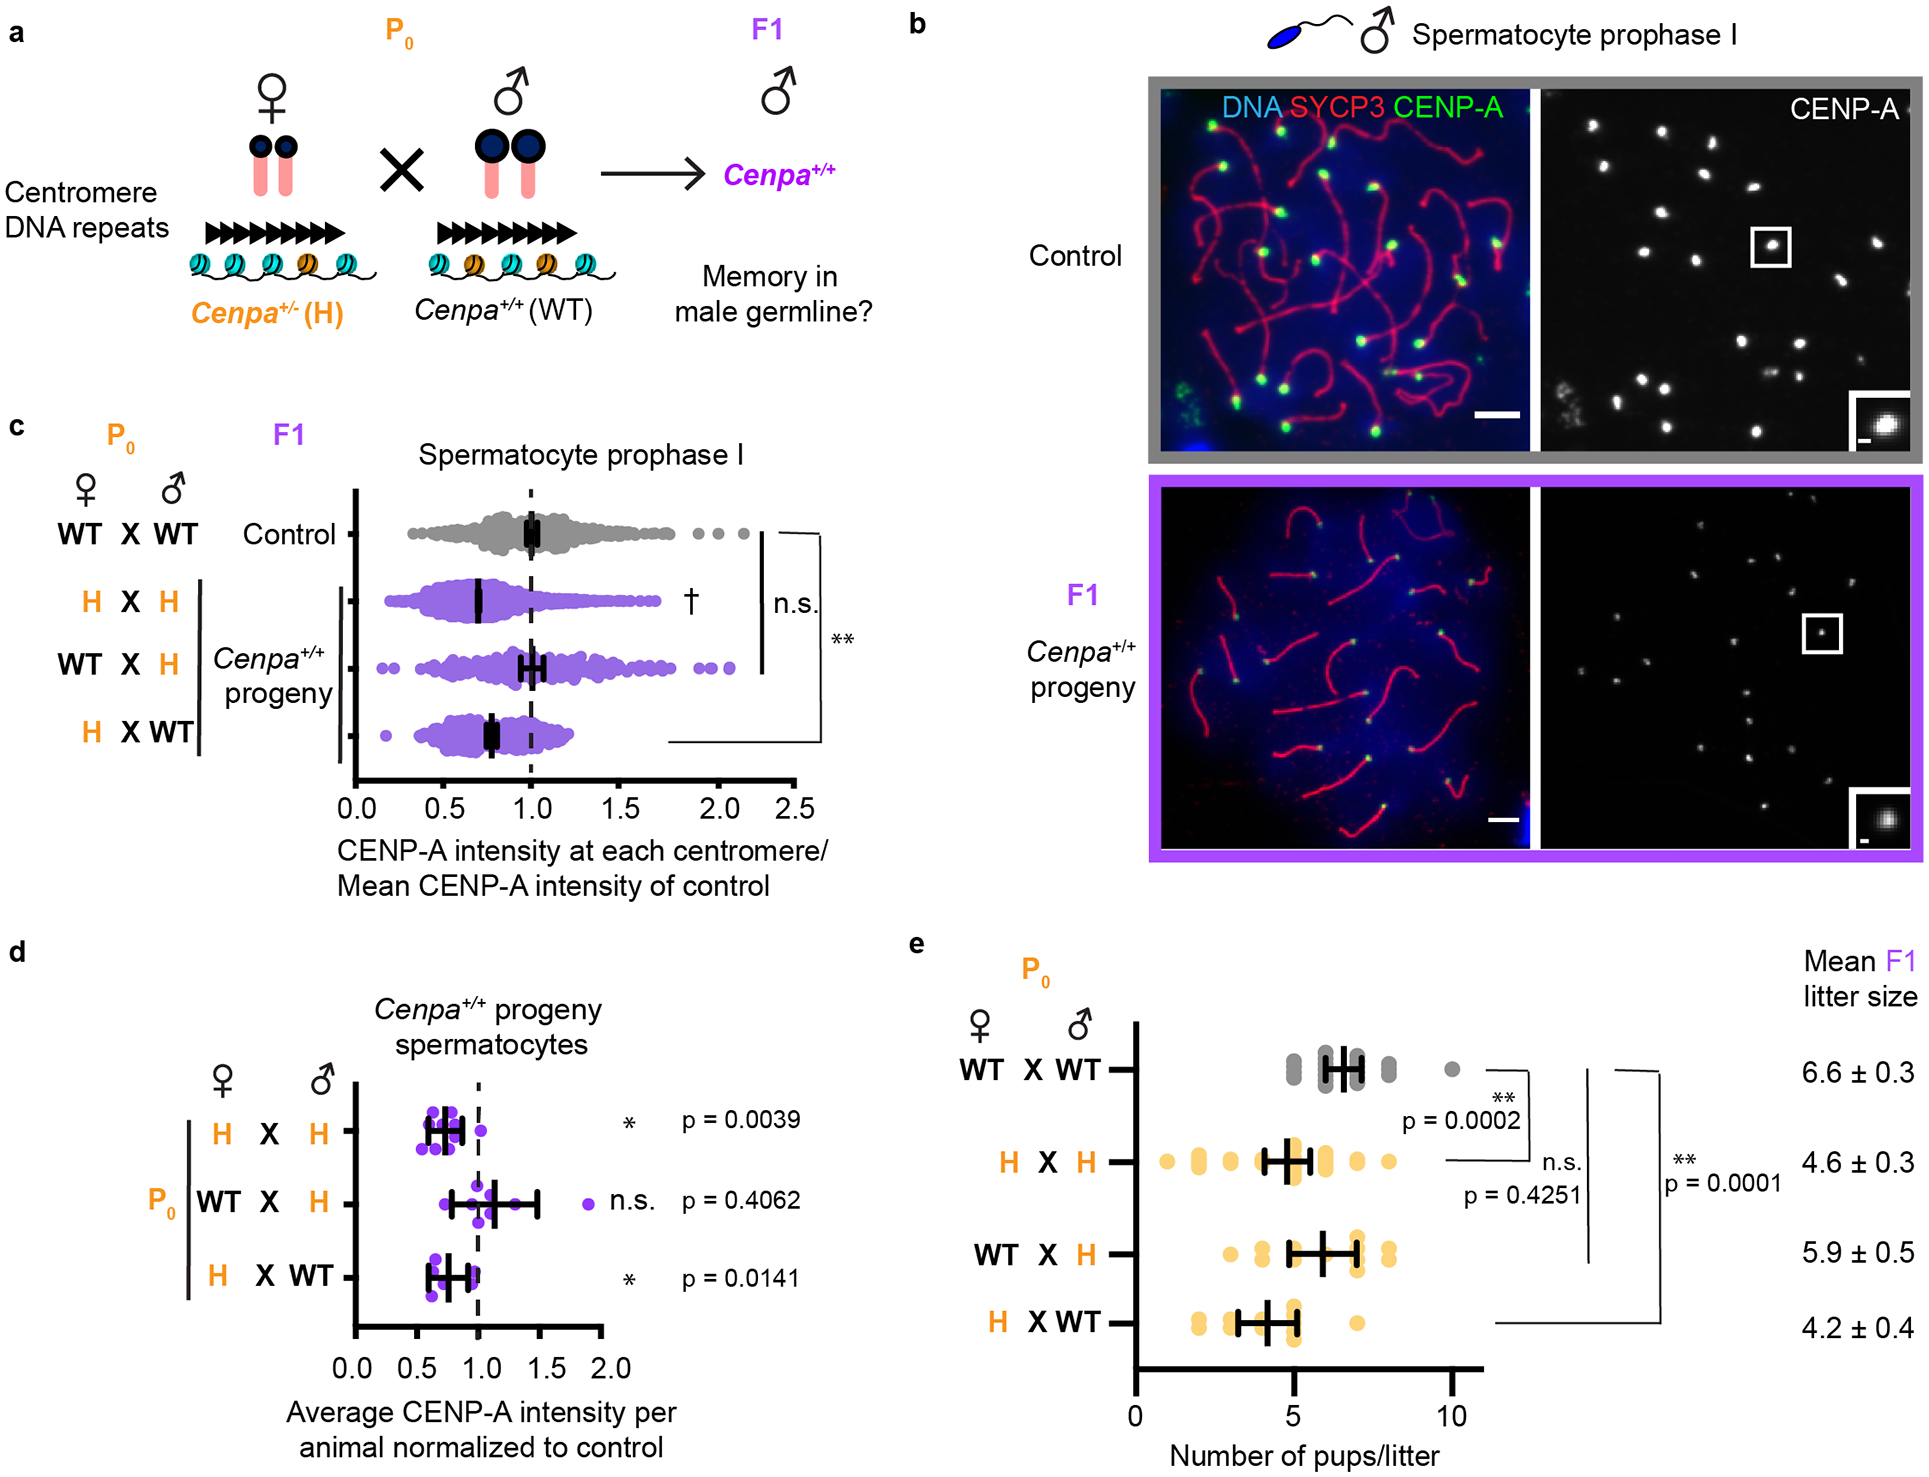
a, Mating scheme to test Cenpa maternal contribution. b, Prophase I spermatocytes from control and F1 progeny of H♀ × WT♂ cross. Each of the CENP-A foci represents four centromeres from a pair of homologous chromosomes. Scale bars: 5 μm (main panel), 1μm (inset). c, Quantifications of CENP-A foci intensities in F1 spermatocytes from the indicated crosses. Representative images shown in Fig. 1d (H × H, data replotted for comparison from Fig. 1c), Fig. 3f (WT♀ × H♂), and Fig. 4b (H♀ × WT♂). N = 536, 1836†, 267, 604 centromeres (top to bottom). d, Data from Fig. 4c replotted by averaging over all centromeres from spermatocytes in each animal, normalized to controls (dashed line). N = 10, 8, 6 animals (top to bottom). e, Litter sizes from the indicated crosses. N = 21, 26, 12, 12 litters (top to bottom). Mean ± S.E.M. for each cross is shown next to the graph. *P<0.05, n.s.: P>0.05, Wilcoxon signed sum rank test (two tailed). ** P<0.0001, n.s. P>0.05, Mann-Whitney U test (two tailed). Error bars: median ± 95% CI. Source numerical data are available in source data.
Since persistence of weakened centromeres depends on the maternal genotype, we predicted that an epigenetically weakened centromere state in a wild type genotype can only last for a single generation. To test this prediction, we crossed Cenpa+/+ F1 males and females with weak centromeres, obtained from the H × H cross, to generate F2 animals (Fig. 5a). We find, in line with our expectations, that centromere chromatin almost completely recovers to control levels in the male germline of F2 animals (93.9 ± 0.01%, Fig. 5b,c).
Fig. 5: CENP-A chromatin recovers in adult male F2 progeny from Cenpa+/+ WT F1 parents.
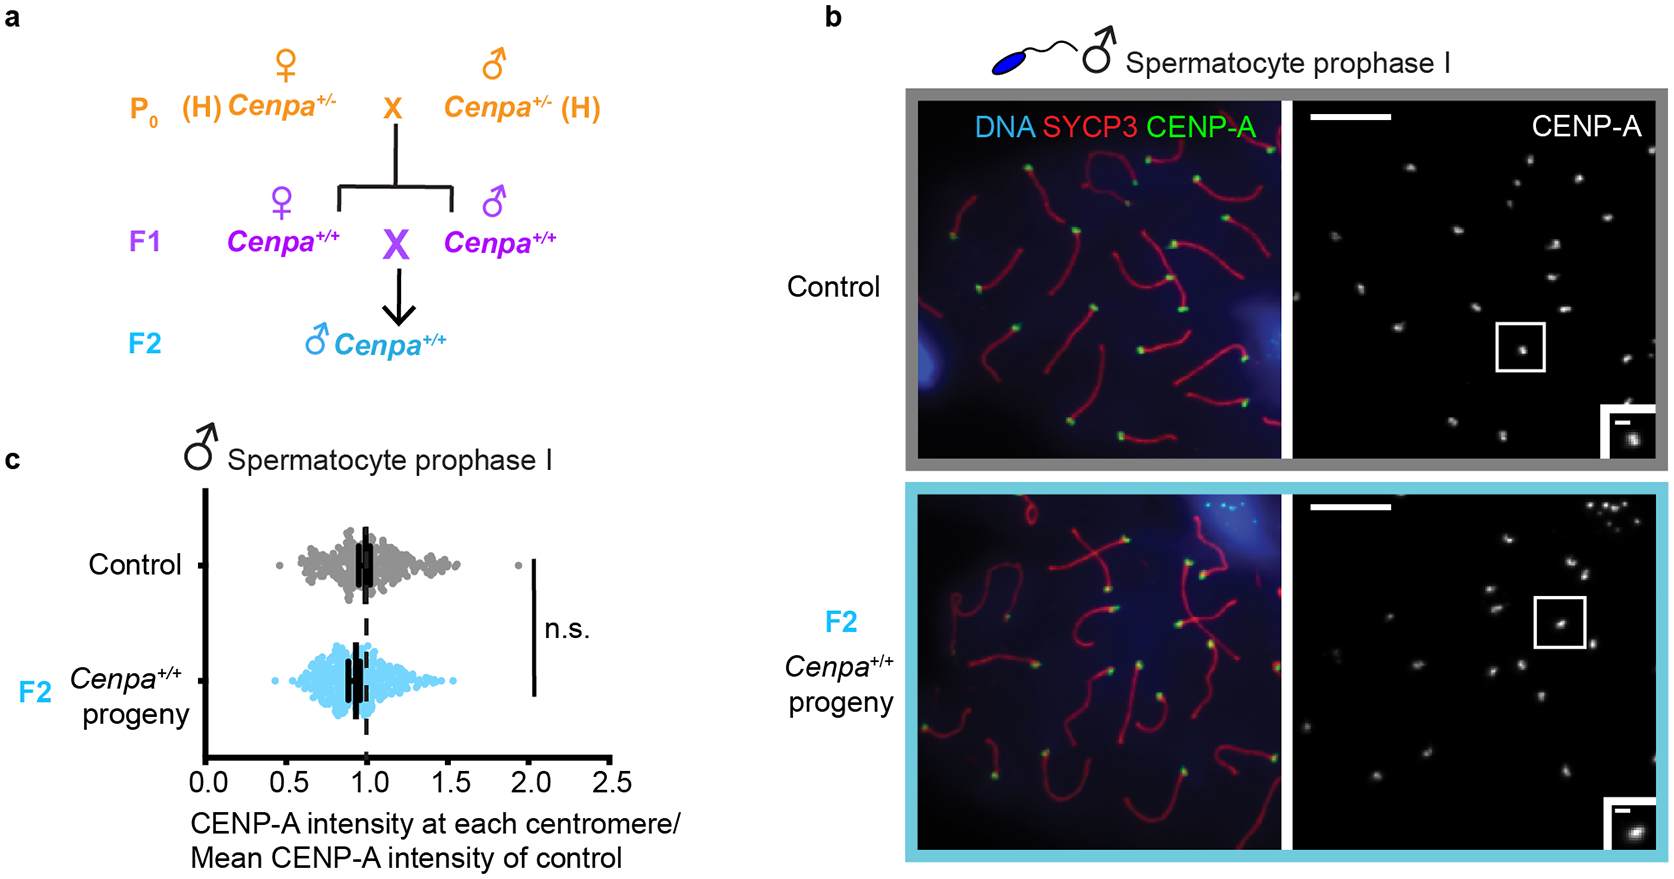
a, Mating scheme to generate F2 generation from F1 with epigenetically weakened centromeres and wild type genotype. b, Prophase I spermatocytes from control and F2 males. Each of the CENP-A foci represents four centromeres from a pair of homologous chromosomes. Scale bars: 5 μm (main panel), 1μm (inset). c, Quantification of CENP-A foci intensities. N = 276 (control), 328 (F2) centromeres. n.s. P>0.05, Mann-Whitney U test (two tailed). Error bars: median ± 95% CI. Source numerical data are available in source data.
The importance of maternal genotype suggests that centromere strength is determined during the early embryonic cell cycles, before zygotic genome activation (ZGA), when nascent centromere chromatin assembly would depend on maternally provided protein and/or a pool of mRNA rather than the zygotic genotype. Indeed, our experimental results are consistent with simple modeling of this process in the first two embryonic cell cycles, based on three assumptions (Extended Data Fig. 5). First, new assembly is reduced by 50% in early embryos with heterozygous mothers due to the reduced maternal contribution. Second, assembly is equal on maternal and paternal centromeres. Third, weakened centromeres persist by epigenetic memory after the first two cell cycles, even after activation of a wild type zygotic genome. This model captures both partial restoration of weakened centromere chromatin (Figs. 1c and 4c) and equalization of initial differences between maternal and paternal centromeres (Fig. 3). At the molecular level, mouse oocytes do not harbor a large pool of CENP-A protein27, although a small pool may exist and suffice. However, we find that the Cenpa 3’ UTR has hallmark sequences of a dormant maternal mRNA (Extended Data Fig. 6): a class of transcripts stored in a full-grown oocyte and translated in the embryo to support cellular functions prior to ZGA28. Previous microarray data29 show an increase in Cenpa transcripts containing long poly(A) tails when oocytes transition to one cell embryos, consistent with recruitment of dormant maternal mRNAs after fertilization. Thus, we define Cenpa as a maternal effect gene, as the maternal contribution determines centromere strength.
Centromeres equalize in early embryogenesis
To test our model prediction that centromeres equalize within the early embryonic cell cycles (Extended Data Fig. 5), we examined four-cell embryos from the WT × WT (control) cross and the WT♀ × H♂ cross, which maximizes the difference between maternal and paternal centromeres (Fig. 3c). By this stage, paternal chromosomes have gained H3K9me321 (Extended Data Fig. 7), and other major chromatin rearrangements have occurred, including broad decoration of chromosomes with nucleosomes harboring the histone H3.3 variant30. In the absence of a cytological marker for paternal versus maternal chromosomes at the four-cell stage, we analyzed the distributions of CENP-A intensities to determine whether or not two populations of centromeres (low and high CENP-A levels) persist. In one-cell zygotes, we find bimodal distributions of the pooled maternal and paternal centromeres (Fig. 6a and Extended Data Fig. 8) consistent with our previous analysis (Fig. 3c). Bimodality is lost by the four-cell stage, consistent with our model prediction (Extended Data Fig. 5), with the resulting unimodal distributions similar to those obtained from spermatocyte centromeres of F1 adult animals (Fig. 6a), which are expected to be unimodal. These results indicate that the first two cell cycles after fertilization represent a phase of plasticity when CENP-A nucleosomes rapidly equalize between parental centromeres to levels determined by the maternal genotype.
Fig. 6: Genetic contributions to centromere equalization in early embryogenesis.
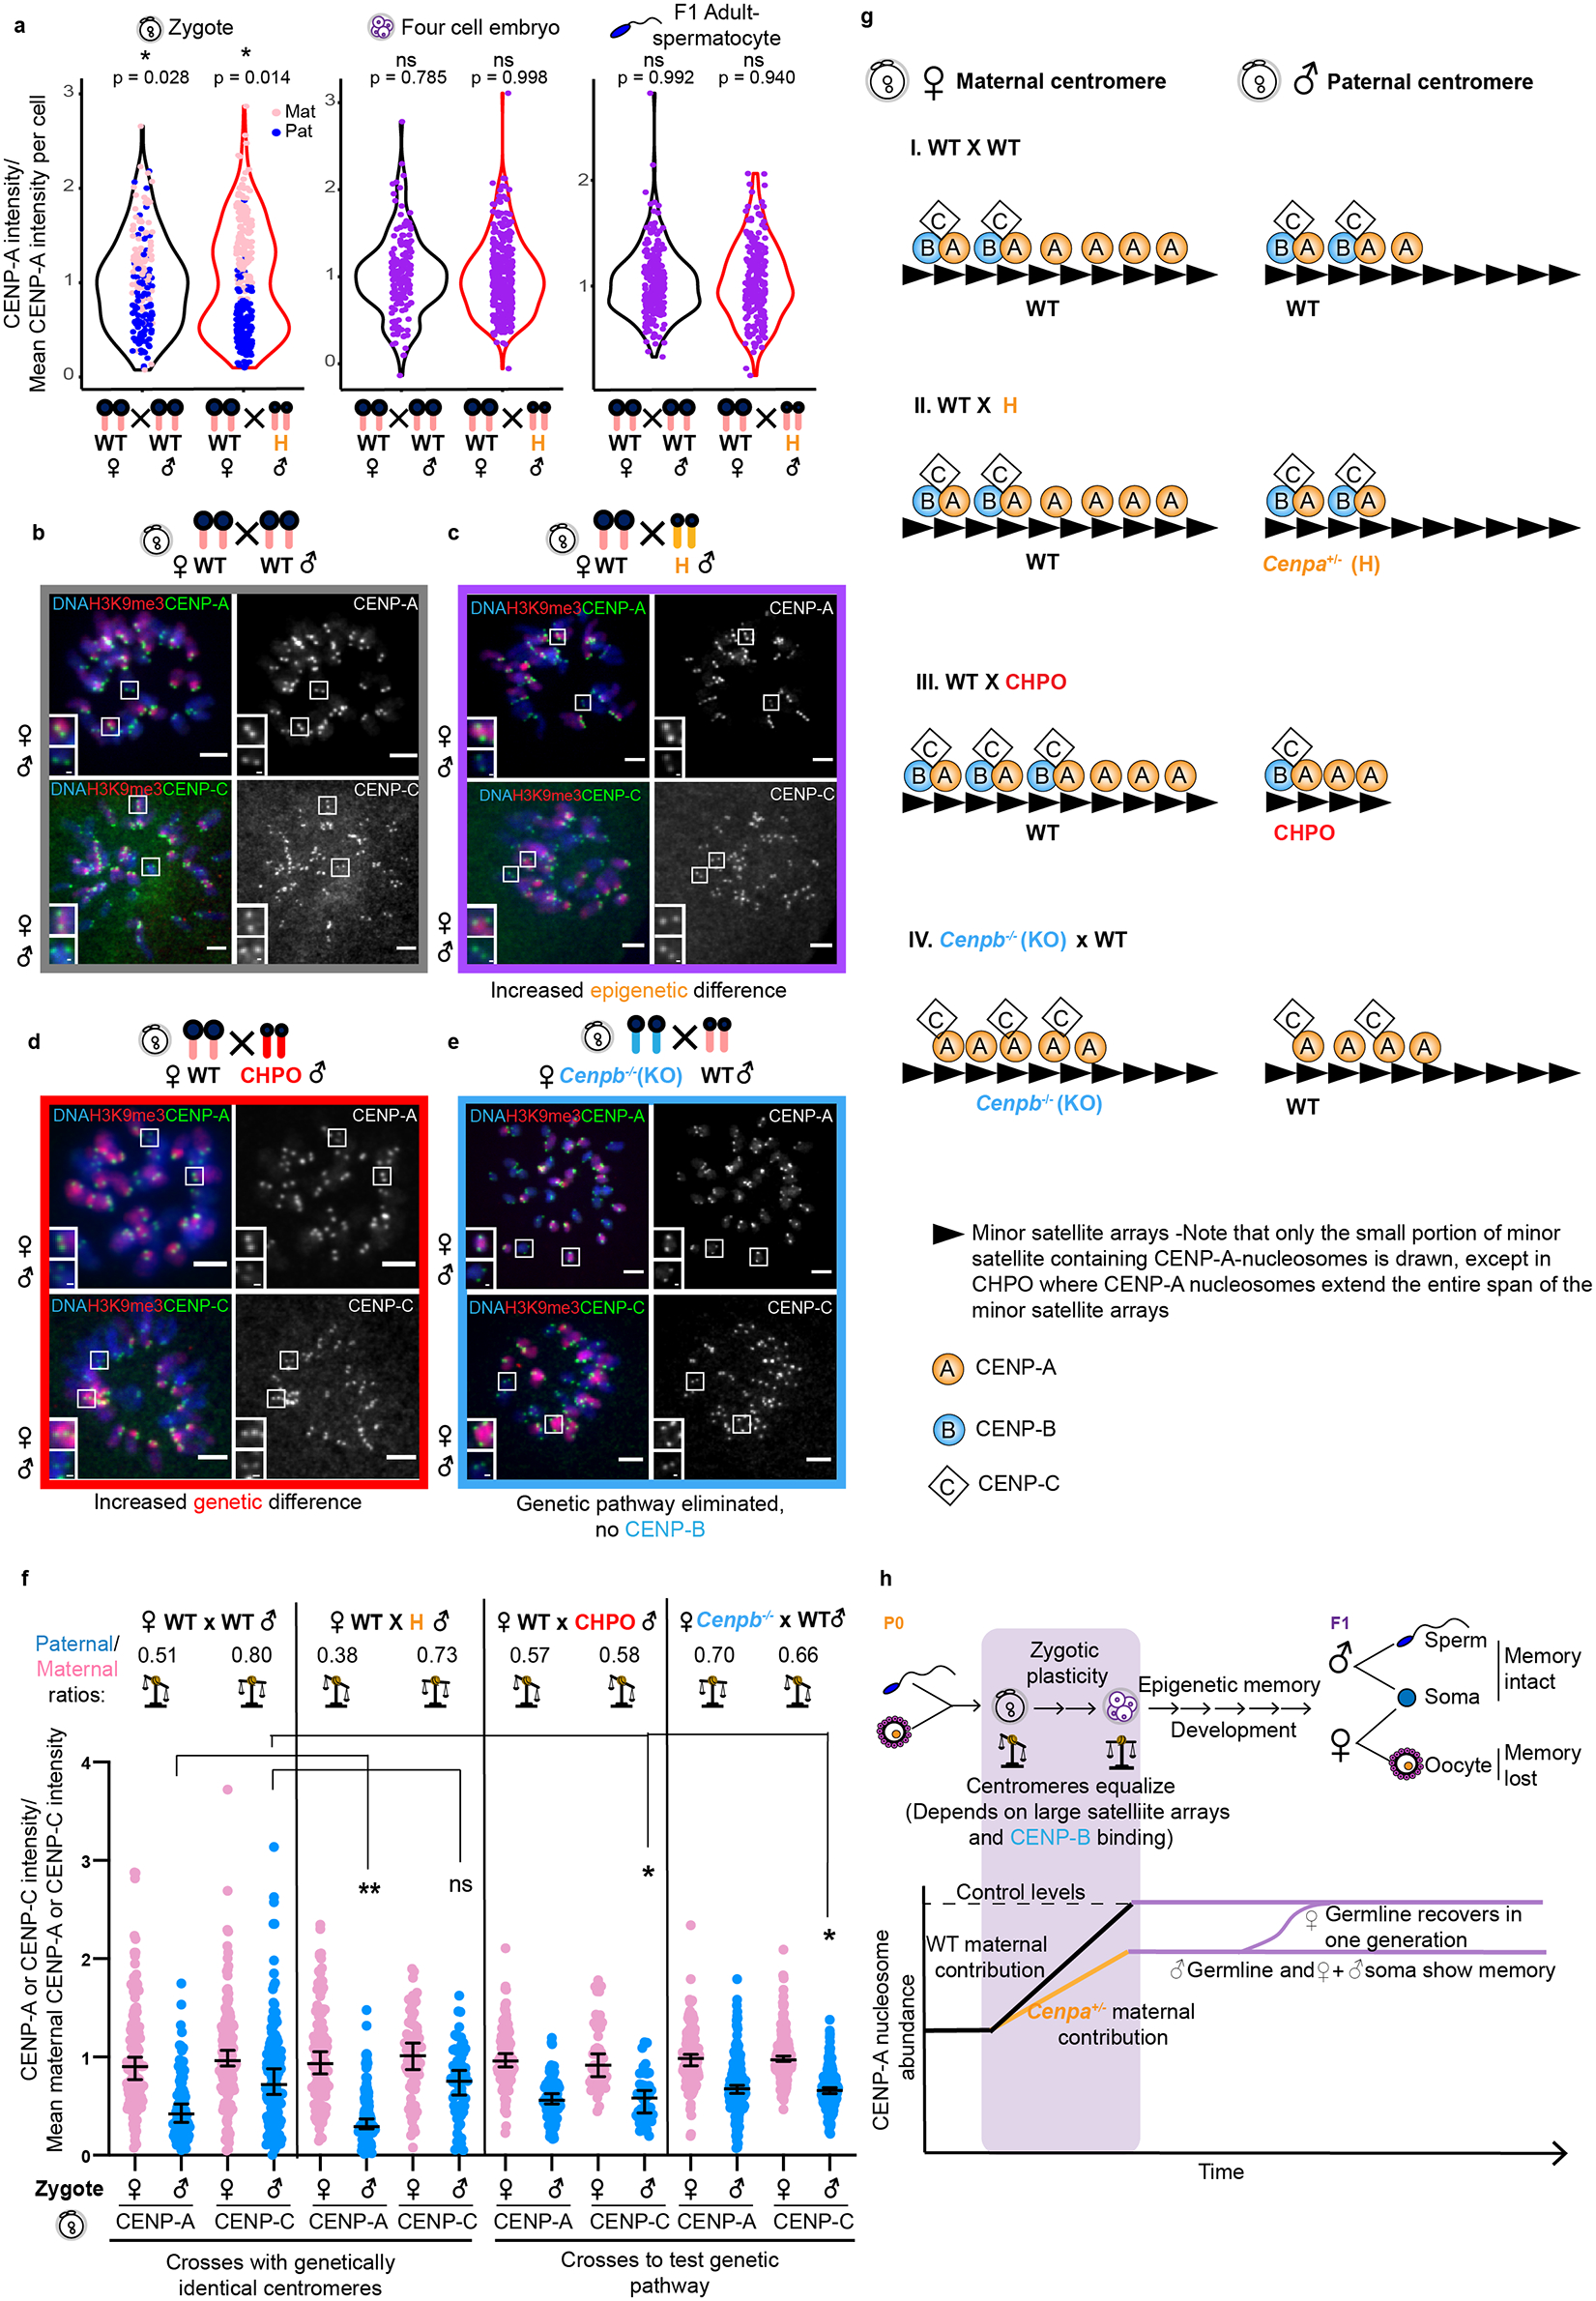
a, Combined violin and dot plots for zygotes, four cell embryos and adult spermatocytes showing the distributions of CENP-A intensities. Data for zygotes and spermatocytes are replotted from Fig. 3c and 1c, respectively. N = 192, 271, 164, 322, 240, 214 centromeres (left to right). Dot plots are colored for zygotes, where parental origin can be determined. *=‘modetest’52 for unimodality (two tailed). b-c, Images of CENP-A or CENP-C staining in zygotes with either moderate (WT × WT) or enhanced (WT♀ × H♂) epigenetic differences between maternal and paternal centromeres, distinguished by H3K9me3. Each pair of CENP-A or CENP-C foci represents sister centromeres in mitosis. d-e, Images of CENP-A or CENP-C staining in zygotes from the indicated crosses manipulating the genetic pathway. Scale bars: 5 μm (main panel), 1μm (inset). f, Quantifications of maternal (pink) and paternal (blue) CENP-A and CENP-C intensities in zygotes from the designated crosses, with average paternal/maternal CENP-A or CENP-C ratios above; N = 132, 90, 162, 157, 123, 112, 76, 66, 120, 116, 54, 45, 164, 172, 218, 217 centromeres (left to right). **/* P<0.0001/P< 0.05, Mann-Whitney U test (two tailed). Error bars: median ± 95% CI. g, Model for epigenetic and genetic contributions to CENP-C binding via CENP-A and CENP-B in zygotes. I. WT × WT cross: maternal centromeres have more CENP-A nucleosomes than paternal centromeres (Fig. 3c), but CENP-B is equally distributed between genetically identical maternal and paternal centromeres. We propose that CENP-B does not occupy all CENP-B boxes, and that CENP-C is limited relative to CENP-A and preferentially binds to CENP-A nucleosomes that are associated with CENP-B, thereby equalizing maternal and paternal centromeres. Note that only the small portion of minor satellite containing CENP-A-nucleosomes is drawn. II. WT × H cross: CENP-A nucleosomes are reduced on the paternal chromatin but still enough to recruit CENP-B/C. CENP-A asymmetry increases, but CENP-C remains symmetric. III. WT × CHPO cross: paternal CHPO centromeres have fewer minor satellite repeats and fewer CENP-B boxes. Most CENP-B therefore associates with maternal centromeres, providing more binding sites for CENP-C and increasing its asymmetry. IV. Cenpb−/− × WT: CENP-C binds to any available CENP-A nucleosomes, leading to CENP-C asymmetry matching CENP-A asymmetry. h, Summary of changes in centromeric chromatin at weakened paternal centromeres with WT zygotic genotype and either WT or reduced maternal contribution. See discussion. Note that weakened maternal centromeres would presumably lead to similar outcomes but are difficult to experimentally manipulate without also reducing the maternal contribution. Source numerical data are available in source data.
A genetic pathway equalizes centromeres in embryos
We next considered how nascent centromere chromatin assembly could be equal on maternal and paternal centromeres, as in our model (Extended Data Fig. 5), despite initial differences in centromere chromatin. Epigenetic memory depends on existing CENP-A nucleosomes directing nascent assembly by binding CENP-C, the centromere component that recruits downstream assembly factors, including the Mis18 complex and the dedicated CENP-A chaperone, HJURP12,14,31–35. However, we suspected that a genetic contribution might be more significant than the epigenetic pathway during the early embryonic cell cycles. The centromeres in all the animals used in our crosses (Figs. 1–5 and Fig. 6a) have identical genetic makeup, with an excess of minor satellite sequences present at each centromere relative to the number of CENP-A nucleosomes4. Minor satellite monomer units (120 bp) house a preferred assembly site for CENP-A nucleosomes4, as well as the binding element (CENP-B box) for the sequence-specific DNA binding protein, CENP-B36. Since CENP-B contributes to CENP-C recruitment to centromeres37,38, we predicted that CENP-C might be sensitive to minor satellite DNA rather than to epigenetic differences between paternal and maternal centromeres in the zygote. Indeed, in zygotes from the WT × WT cross, CENP-C is only slightly different between the paternal and maternal centromeres (paternal/maternal ratio = 0.80 ± 0.04 for CENP-C vs 0.51 ± 0.04 for CENP-A, Fig. 6b,f). Further, increasing the epigenetic differences in the WT♀ × H♂ cross has little effect on CENP-C (paternal/maternal ratio = 0.73 ± 0.04 for CENP-C vs 0.38 ± 0.03 for CENP-A, Fig. 6c,f). These findings suggest that the genetic pathway directs CENP-C recruitment and centromere chromatin assembly in the early embryo, leading to epigenetic equalization when centromeres are genetically identical.
We took two approaches to test this hypothesis. First, we took advantage of natural variation between mouse strains to restrict the genetic contribution by reducing the number of minor satellite repeats. The CHPO strain harbors tiny centromere arrays (sixfold to tenfold smaller than C57BL/6J) that restrict both CENP-A nucleosome assembly and CENP-B boxes4. Due to these genetic differences, we predicted larger CENP-C differences between paternal and maternal centromeres in zygotes from a WT♀ × CHPO♂ cross compared to our previous WT × WT or WT♀ × H♂ crosses. Indeed, the CENP-C ratio is significantly reduced (0.58 ± 0.03) in WT♀ × CHPO♂ zygotes relative to the previous crosses, indicating an increase in CENP-C difference between the two parents (Fig. 6d,f). Moreover, this initial difference in CENP-A nucleosomes and CENP-C between maternal and paternal centromeres in WT♀ × CHPO♂ zygotes is maintained in the adult, leading to asymmetric bivalents that show biased segregation in meiosis4. These results indicate that nascent assembly of CENP-A nucleosomes depends on the genetic pathway during the plastic phase, such that centromere chromatin equalizes only when genetically identical.
As a second approach, we eliminated the CENP-B-dependent genetic pathway by crossing Cenpb−/− knockout females38 to WT males to generate zygotes lacking a maternal pool of CENP-B protein. Our equalization model predicts that a potential epigenetic contribution to CENP-C recruitment is masked by the genetic pathway, which is symmetric when maternal and paternal centromeres are genetically identical. In the absence of the genetic pathway, CENP-C asymmetry between maternal and paternal centromeres would increase due to the initial epigenetic asymmetry (Fig. 6e,f). This epigenetic asymmetry is present in the Cenpb−/−♀ × WT♂ cross, although reduced relative to the WT × WT control cross (CENP-A ratio = 0.7 ± 0.02) because CENP-A chromatin is reduced in oocytes from Cenpb−/− females38. Despite this decrease in epigenetic asymmetry, the asymmetry in CENP-C recruitment increased in the Cenpb−/−♀ × WT♂ cross relative to the control (CENP-C ratio = 0.66 ± 0.01, Fig. 6e,f and Extended Data Fig. 9). This result demonstrates that equalization depends on CENP-B. Summarizing the results of our two experiments manipulating the genetic pathway, we created a genetic asymmetry in the WT♀ × CHPO♂ cross, which increased CENP-C asymmetry relative to the WT × WT control due to the genetic pathway. In contrast, we eliminated the genetic pathway in the Cenpb−/−♀ × WT♂ cross, which increased CENP-C asymmetry relative to the control by unmasking the epigenetic pathway.
At the molecular level, a parsimonious explanation for epigenetic and genetic contributions to the results of the four crosses we performed (Fig. 6b–e) would involve two distinct pools of CENP-A nucleosomes: one associated with CENP-B and the other without CENP-B. If CENP-A nucleosomes are present in excess of CENP-C, and CENP-C preferentially binds the subset of CENP-A nucleosomes that are also bound to CENP-B37, then CENP-C recruitment would be dictated by CENP-B (i.e., the genetic pathway) (Fig. 6g-I). Partial reduction of CENP-A nucleosomes on the paternal centromeres, as in our WT♀ × H♂ cross, would not affect CENP-C recruitment as long as the remaining CENP-A nucleosomes bind CENP-B and are sufficient to bind the available CENP-C (Fig. 6g-II). Limiting CENP-B binding to paternal centromeres, as in our WT♀ × CHPO♂ cross, increases CENP-C asymmetry because there are fewer paternal CENP-A nucleosomes associated with CENP-B (Fig. 6g-III). Finally, in the absence of CENP-B, CENP-C recruitment becomes a simple pairwise interaction with CENP-A, so CENP-C scales relative to the number of CENP-A nucleosomes (Fig. 6g-IV).
Discussion
Together our findings support a model in which centromere strength is initially determined during a phase of early embryonic plasticity. After the plastic phase, weakened centromeres persist in somatic tissue and the male germline (Fig. 6h), even in genetically wild type animals (e.g., Cenpa+/+ progeny of Cenpa+/− mothers). Thus, we provide evidence for epigenetic memory through development as predicted by the established mechanism for centromere propagation in somatic cells. In contrast, our in vivo model uncovers a different paradigm of transmission between generations, with Cenpa acting as a maternal effect gene to determine centromere strength.
We show that nascent centromere chromatin assembly in the first embryonic cell cycles depends on maternally provided CENP-A rather than the number of preexisting CENP-A nucleosomes in the gametes, resetting CENP-A chromatin at the same time that reprogramming occurs for other epigenetic information in the embryo39–44. This maternal effect process suggests a different form of epigenetic memory for transmission of a weakened centromere state to offspring through the female germline. In nature, we envision that like all genes, Cenpa expression could vary substantially between individuals through epigenetic effects such as differences in promoter methylation. Mothers with attenuated Cenpa expression would therefore transmit weakened centromeres to offspring because of the reduced maternal contribution, even with unattenuated Cenpa expression in the offspring. This maternal effect process limits memory to a single generation, however, and also eliminates epigenetic differences between maternal and paternal centromeres in the embryo. In contrast, epigenetic memory in flies is a paternal effect19, and a genetic contribution to centromere inheritance through sequence specific DNA binding proteins is unlikely given that there does not appear to be a counterpart to CENP-B in flies.
We also find that weakened centromeres recover in the female germline, possibly as a mechanism to protect against loss of centromere identity during the prolonged mammalian oocyte prophase arrest, as CENP-A nucleosomes assembled before this arrest last through the reproductive lifespan of the animal27. Recovery may also provide a buffer from potential failure in telomere bouquet protection of centromeres in female meiosis45. In contrast, CENP-A is removed early in female meiosis in holocentric worms46, so de novo assembly is required to re-establish centromere chromatin. Likewise, in worms, Cenpa mutants that disrupt interactions with the assembly machinery are maternal effect lethal as they abrogate this de novo assembly47.
Epigenetic specification of centromeres may have evolved as a strategy to suppress fitness costs associated with selfish centromere DNA sequences that subvert female meiosis48 (drive) to increase their transmission to the egg. Epigenetic centromeres require a propagation mechanism, however, that can impose its own costs. If preexisting CENP-A nucleosomes recruit the machinery for nascent assembly, then epigenetic differences between maternal and paternal centromeres in the zygote can lead to differential assembly. Indeed, epigenetic differences in plants cause embryonic aneuploidy due to loss of weaker centromeres or even complete elimination of one parental genome17,49. Our finding of a specialized early embryonic assembly process, directed by centromere DNA sequence rather than preexisting CENP-A nucleosomes, reveals a mechanism to equalize centromeres to protect against detrimental consequence of epigenetic asymmetry between the parental genomes. We propose that dual genetic and epigenetic contributions to centromere chromatin assembly represent adaptations to fitness costs arising from either selfish DNA sequences or parental epigenetic asymmetry.
Methods
Animal husbandry and generation of Cenpa+/− heterozygous and Cenpb−/− knockout mice
All animal experiments and protocols were approved by the Institutional Animal Use and Care Committee of the University of Pennsylvania and were consistent with National Institutes of Health guidelines (protocol #803994). All animals used in this study were within 6 months of age, and both male and female animals were analyzed. Experimental animals were compared to age and gender matched controls. Cenpa+/− heterozygous (H) mice were initially generated by mating CenpaFl/Fl;Gdf9Cre/+ conditional Cenpa knockout females with wild type (WT) males27 (C57BL/6J, Jackson Laboratory,000664) and subsequently regenerated through either WT♀ × H♂, H × H or H♀ × WT♂ crosses, which also generated the experimental Cenpa+/+ F1 progeny. F1 control progeny were generated by mating CenpaFl/+ females to WT C57BL/6J males. ‘CHPO’ males were obtained from Jackson Laboratory (ZALENDE/EiJ, 001392) and then bred in house. For each dataset, at least 2–5 independent experiments were performed, each having one control and 1–2 experimental animals that were age and gender matched. For embryo collections, 5–8 females were mated to 5–8 males for each independent experiment. Genotyping for Cenpa was performed using the REDExtract N-AMP kit (Sigma)27 and all animals were sampled twice to confirm their genotype. Cenpb−/− mice were generated in a CF-1/C57BL/6J/DBA-2 hybrid strain using CRISPR-Cas9 genome editing38.
Microscopy
Confocal images were collected as z-stacks with 0.5 μm intervals, using a microscope (DMI4000 B; Leica) equipped with a a 63× 1.3 NA glycerol-immersion objective lens, an xy piezo Z stage (Applied Scientific Instrumentation), a spinning disk confocal scanner (Yokogawa Corporation of America), an electron multiplier charge-coupled device camera (ImageEM C9100–13; Hamamatsu Photonics), and either an LMM5 (Spectral Applied Research) or Versalase (Vortran Laser Technology) laser merge module, controlled by MetaMorph software (Molecular Devices, v7.10.3.294). Images were acquired using the same laser settings and all images in a panel were scaled the same. Single channels are shown wherever quantifications were performed.
Oocyte collection and culture
Female mice were hormonally primed with 5 U of Pregnant Mare Serum Gonadotropin (PMSG, Peptides International) 44–48 h prior to oocyte collection. Germinal vesicle (GV)-intact oocytes were collected in bicarbonate-free minimal essential medium53 (M2, Sigma), denuded from cumulus cells, and cultured in Chatot- Ziomek-Bavister54 (CZB, FisherScientific) medium covered with mineral oil (Sigma, BioXTRA) in a humidified atmosphere of 5% CO2 in air at 37°C. During collection, meiotic resumption was inhibited by addition of 2.5 mM milrinone (Sigma). Milrinone was subsequently washed out to allow meiotic resumption and oocytes were fixed 6–7 h later at metaphase I.
Oocyte immunocytochemistry
Oocytes were fixed in freshly prepared 2% paraformaldehyde (Sigma) in PBS with 0.1% Triton X-100 (Sigma), pH 7.4, for 20 min at room temperature (RT), permeabilized in PBS with 0.2% Triton X-100 for 15 min at RT, placed in blocking solution (PBS containing 0.3% BSA and 0.01% Tween-20) overnight at 4°C, treated with λ-phosphatase (1600 U, NEB) for 1 h at 30°C for CENP-A staining, incubated 1 h with primary antibody in blocking solution, washed 3 times for 10 min each, incubated 1 h with secondary antibody, washed 3 times for 10 min each, and mounted in Vectashield with DAPI (Vector) to visualize chromosomes. The primary antibody was rabbit anti-mouse CENP-A (1:200, Cell Signaling, C51A7). The secondary antibody was donkey anti-rabbit Alexa Fluor 488 (1:500, Invitrogen).
Sucrose spreading of mouse spermatocyte chromosomes
A modification of a previous chromosome spreading protocol was used55. Mouse testes were collected from males, and individual seminiferous tubules were transferred to 3 ml of ice cold freshly made hypotonic buffer for 60 min. Small sections of tubules were placed on depression slides in 22 μl of 100 mM sucrose (pH 8.2) and minced with two scalpel blades until most of the tubules were cut and liquid was cloudy. Any large chunks of tubules were removed and another 22 μl of sucrose was added and mixed with the sample, followed by spreading 30 μl of cell suspension on slides dipped into freshly made 1% PFA (0.15% Triton X-100 in dH2O). Slides were then placed directly into a humidified chamber covered with a lid. After 2.5 h the lid was left half-open for an additional 30 min. After drying, slides were washed twice in Photoflo/PBS for 5 min followed by antibody staining or frozen at −80°C.
Spermatocyte immunocytochemistry
Mouse spermatocytes were spread on glass slides as described in the above section, incubated for 10 min at room temperature in 0.4% Photoflo (Fisher Scientific)/PBS, followed by 10 min in 0.01% Triton-X100/PBS and 10 min in antibody dilution buffer ADB/PBS (3g BSA, 10 ml of goat serum, 250 μl of 20% Triton X-100 in 1 L of PBS). For metaphase cells, slides were treated with λ-phosphatase (1600 units, NEB) for 1 hour at 30°C. Slides were incubated on parafilm runners, with rabbit anti-CENP-A antibody (1:400) and mouse anti-SYCP3 antibody (1:200, Abcam, 10G11/7) overnight at room temperature in a humidified chamber, washed for 10 min in Photoflo/PBS, Triton-X/PBS and ADB/PBS sequentially, and incubated for 1.5 h at 37°C with donkey anti-mouse Alexa Fluor 594 (1:100, Invitrogen) and donkey anti-rabbit Alexa Fluor 488 (1:2000, Invitrogen) secondary antibodies. Slides were then washed three times, 10 min each, with 0.4% Photoflo/PBS and once with 0.4% Photoflo/dH2O for 10 min and mounted with Vectashield with DAPI (Vector) on a 24 × 40 mm cover glass. From each slide primary spermatocytes at either pachytene stage (overall CENP-A levels) or diplotene stage (bivalent analysis of ratios) of prophase I were selected based on the distinct SYCP3 staining pattern (paired and threadlike in pachytene and X shaped in diplotene after synaptonemal complex disassembly) and imaged using the confocal microscope described in the microscopy section.
Bone marrow collection and immunocytochemistry
Bone marrow was collected from the tibia(s) and femur(s) by inserting a 26-gauge syringe needle into the cut end of the marrow cavity. Cells were flushed out into 1 ml of warm EDTA buffer (8 g sodium chloride, 0.2g potassium dihydrophosphate, 0.2 g potassium chloride, 1.15 g sodium dihydrophosphate, 0.2 g EDTA, dissolved in 1 L of deionized water) with 0.025% Colchicine (Sigma) and incubated for 3 h at 37°C. Cells were then diluted 50x in 0.56% potassium chloride solution on ice for 20 min to swell. Spreads were subsequently prepared on Superfrost Plus slides using a double funnel on a Cytospin 4 (Thermofisher) at 600 rpm, high acceleration for 5 min, then rinsed briefly in PBS and fixed in 4% formaldehyde solution for 20 min at RT, permeabilized in 0.5% TritonX-100/PBS and blocked for 20 min (0.3% BSA, 0.01% Tween-20). Slides were incubated with anti CENP-A antibody (1:200) for 1 h at RT, washed 3x with PBST (PBS/).01% Tween 20), incubated with donkey anti-rabbit Alexa Fluor 488 (1:500, Invitrogen) for 1 h at RT, washed 3x in PBST for 5 min each and 1x in distilled water, and then mounted in Vectashield with DAPI to visualize chromosomes.
Collection of embryos and in vitro fertilization
C57BL/6J or Cenpb−/− females were hormonally primed with 5 U of PMSG (Peptides International), and oocytes were matured in vivo with 5 U of human chorionic gonadotropin-hCG (Sigma) before mating with either C57BL/6J (WT) or Cenpa+/− males. Since the Cenpa+/− males have low mating efficiency they were fed a special low soymeal diet (5LG4 irradiated diet, Labdiet) prior to mating. Embryos were collected 14–16 h post hCG in M2 containing hyaluronidase (0.3 mg/ml) to remove cumulus cells and subsequently washed in M2 (Sigma) and cultured in EmbryoMax Advanced KSOM (AKSOM, Millipore Sigma) with humidified air and 5% CO2. 5 μm proTAME (R&D systems) was added 4 h or ~32–34 h post collection to arrest embryos at one-cell or four-cell mitosis, respectively. Chromosomes were dispersed by generating a monopolar spindle using 10 μM STLC (Sigma) for 3 h. For experiments using males with limited efficiency of overnight mating (CHPO or Cenpa+/−), we obtained embryos by in vitro fertilization (IVF), modified from a previously established protocol56. Notably, paternal/maternal CENP-A ratios for controls from IVF and in vivo fertilized embryos were comparable. Briefly, sperm from the cauda epididymis were collected from 2–4-month-old males in 500 μl EmbryoMax Human Tubal Fluid (HTF, Millipore Sigma) and allowed to swim out for 15 min. Sperm were capacitated for 2 h in 2 ml swim up tubes in HTF, prior to fertilization. Females were primed with PMSG and hCG as described above. MII eggs were collected 14–15 h post hCG into M2 and then transferred into a 50 μl fertilization drop of HTF. Sperm were added to a final concentration of 100,000 sperm per drop for 3 h. Fertilized eggs were washed through AKSOM and cultured overnight at 37°C in humidified air with 5% CO2. Embryos were arrested in mitosis as described above.
Embryo immunocytochemistry
Embryos were fixed in 2% formaldehyde solution in PBS with 0.1% Triton X-100 for 20 min at RT, permeabilized in PBS with 0.5% Triton X-100 for 15 min at RT, placed in blocking solution (PBS containing 0.3% BSA and 0.01% Tween-20) overnight at 4°C or at RT for 20 min, treated with λ-phosphatase for 1 h at 30°C for CENP-A and H3K9me3 staining, incubated 1 h with primary antibodies in blocking solution, washed 3 times for 15 min, incubated 1 h with secondary antibodies, washed 3 times for 15 min, and mounted in Vectashield with DAPI (Vector) to visualize chromosomes. The primary antibodies used were anti-CENP-A (1:200), mouse anti-human H3K9me3 (1:500, Active motif, 2AG-6F12-H4), and a custom polyclonal antibody raised against mouse CENP-C. Briefly, a New Zealand White rabbit was immunized using purified GST-tagged mouse CENP-C (aa 1–198) in PBS as an antigen and Freund’s adjuvant. The serum was then used at a concentration of 1:1,000 in embryos. Secondary antibodies used were donkey anti-rabbit Alexa Fluor 488 (1:500, Invitrogen) and donkey anti-mouse Alexa Fluor 594 (1:500, Invitrogen).
Quantification of centromere signals
To quantify centromere signal ratios, a sum intensity Z-projection was made using Fiji/ImageJ software. Circles of constant diameter were drawn around individual centromeres, and average intensity was calculated for each centromere after subtracting background, obtained from nearby regions. Raw centromere intensities were obtained from several controlled independent experiments (2–3) and multiple cells were analyzed from each animal. Normalization of centromere intensities was performed using age and gender matched controls for each independent experiment. For elongating spermatids, we quantified total CENP-A levels per cell instead of individual foci because centromeres are clustered.
Statistics and Reproducibility
All statistical tests for significance were performed in GraphPad Prism 9 or R56. P-values were calculated at a significance (α) level of 0.05 (95% confidence level) and all tests performed were two tailed. No statistical method was used to predetermine sample size. Randomization is built into our experiments as each animal was chosen from a different litter and mating pair, no data was excluded and all cells were imaged at random. Samples are designated as control or experiment according to their genotyping data. Animals were genotyped twice. Within a genotype, animals are randomly picked. Since our experiment is with a heterozygous single deletion within the genome, we do not have any covariates to consider. Investigators were not blinded for data collection (imaging) and quantifications (data analysis) as the phenotype automatically reports on the genotype consistently and is very penetrant. Likewise, statistical analysis of bimodality did not require blinding since the rotated kernel density (violin) plots being analyzed show obvious bi/uni-modality in each cross. Graphs were made with GraphPad Prism 9 or R. For all the quantified experiments, the number of replicates (animals or independent experiments) is provided in the Supplementary Table 1. Bimodality testing was performed using the R package57,58 ‘multimode’ with the function “modetest” (Fig. 6a) using the excess mass statistic with bootstrapping at a significance (α) level of 0.05 (95% confidence level). A subset from the F1 adult spermatocyte data was used as a representative control unimodal distribution for comparison (Fig. 6a). P<0.05 from the test indicates that the distributions are significantly non-unimodal. Using results from ‘modetest’, the location of the modes and the density of each mode per distribution were determined and plotted with ‘locmodes’ function (Extended Data Fig. 8).
Analysis of 3’UTR of Cenpa
The consensus sequences for CPEI and CPEII were found by manual evaluation of 3’ UTR sequences of Cenpa from the NCBI database for annotated transcripts. The multiple sequence alignment (MAFFT V7) of the 12 rodent 3’UTRs were made and annotated with UGene (Unipro V37).
Data availability
Previously published microarray data for long poly-(A) tailed Cenpa mRNA in pre-implantation development is available freely on NCBI Gene Expression Omnibus (GEO) database (Accession no: GDS813 from reference series: GSE1749). The 12 mouse genomes used for Cenpa 3’UTR analysis are available at NCBI BioProject database (https://www.ncbi.nlm.nih.gov/bioproject) under accession number PRJNA669840. Source data have been provided in Source Data. All other data supporting the findings of this study are available from the corresponding author on reasonable request.
Code availability
All codes used for statistical and distribution analysis are freely available as part of the R package “multimode” described in reference 58.
Extended Data
Extended Data Fig. 1. CENP-A chromatin is reduced in the soma of Cenpa+/− heterozygous animals in the P0 generation.
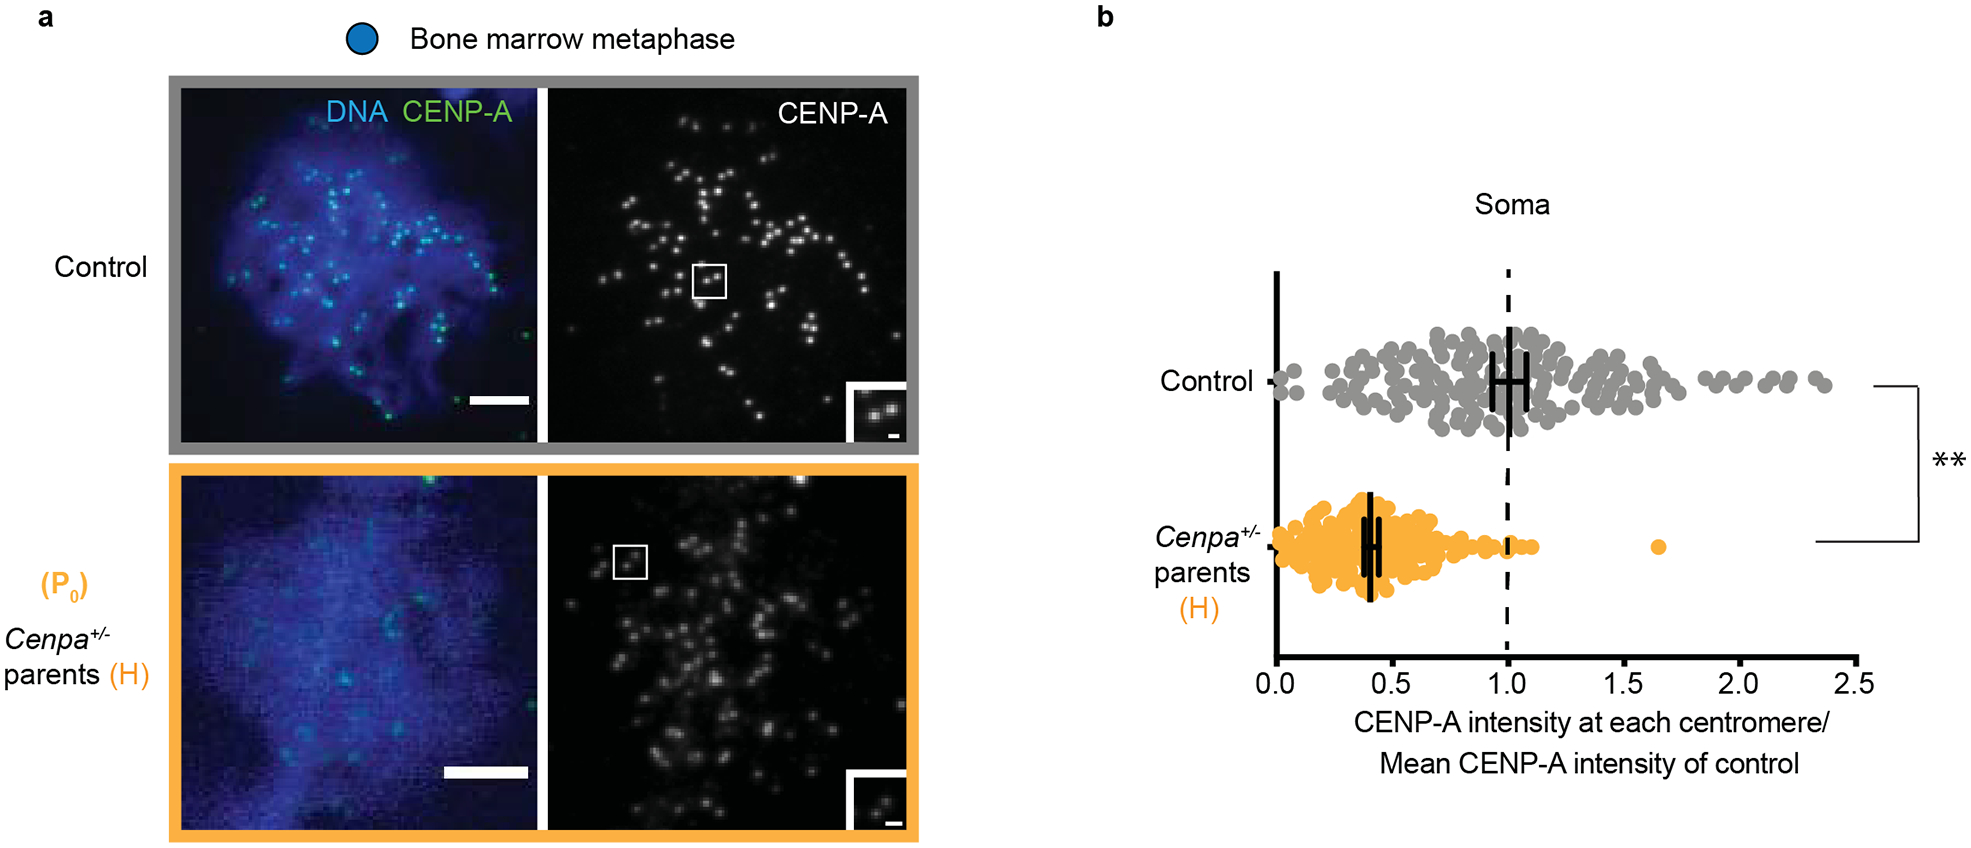
a, Bone marrow metaphase spreads: each pair of CENP-A foci represents sister centromeres in mitosis. Scale bars: 5 μm (main panel), 1μm (inset). b, Quantification of CENP-A foci intensities in control (grey) and P0 (yellow) generation in soma. N = 166, 170 centromeres (top to bottom). ** P<0.0001, Mann-Whitney U test (two tailed). Error bars: median ± 95% CI. Source numerical data are available in source data.
Extended Data Fig. 2. Weakened centromeres in the male germline are independent of meiotic stage.
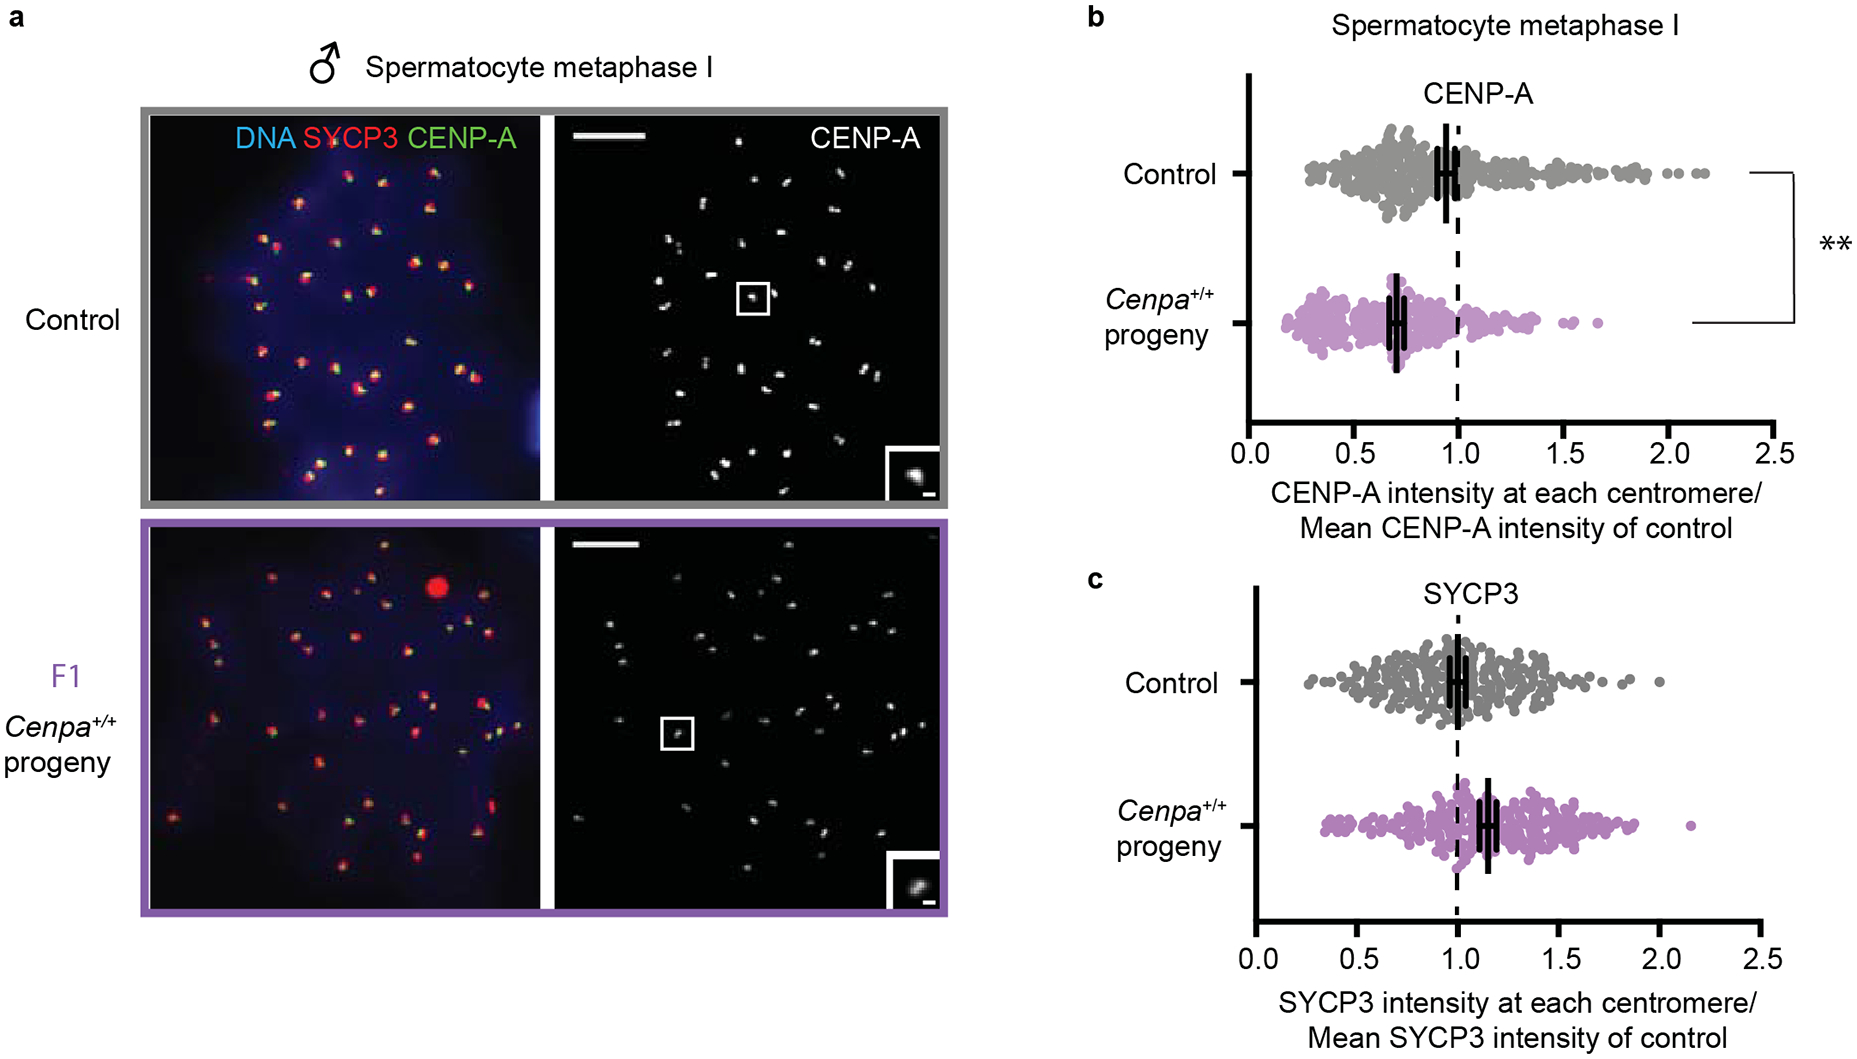
Because oocytes were analyzed at metaphase I and spermatocytes at prophase I (Fig. 1), we confirmed that F1 spermatocytes also show weakened centromeres at metaphase I. Images (a) and quantification (b) of F1 spermatocytes show CENP-A reduced to a similar level at metaphase I (70.54 ± 7.1% of control) as prophase I. Each of the CENP-A foci represents four centromeres (a pair of homologous chromosomes, each with two sisters). N = 330 (control), 284 (F1 progeny). Scale bars: 5 μm (main panel), 1μm (inset). Quantification of SYCP3 foci from the same cells (c) shows no decrease (114.90 ± 5.6% of control). N = 235 (control), 259 (F1 progeny). ** P<0.001, Mann-Whitney U Test (two tailed). Error bars: median ± 95% CI. Source numerical data are available in source data.
Extended Data Fig. 3. Littermate analysis showing that weakened centromeres persist in the male but not female germline.

a, Data from Fig. 1c replotted as CENP-A levels per animal, averaged over all centromeres in each animal and normalized to controls (dashed line). N = 10,10,10, 9, 7 animals. The F1 male but not the female germline and the male and female soma are significantly lower than the controls **P<0.001, *P<0.05 n.s.: P>0.05, Wilcoxon signed sum rank test (two tailed). b, CENP-A quantifications in spermatocytes and oocytes from littermates from one set of parents. N = 121, 431, 60, 259, 246, 105 centromeres (top to bottom). Female germline levels are significantly elevated compared to littermate male germline levels. **P<0.0001, Mann-Whitney U Test (two tailed). Error bars: median ± 95% CI. Source numerical data are available in source data.
Extended Data Fig. 4. CENP-A nucleosomes are retained through the replacement of canonical nucleosomes with protamines during spermiogenesis.
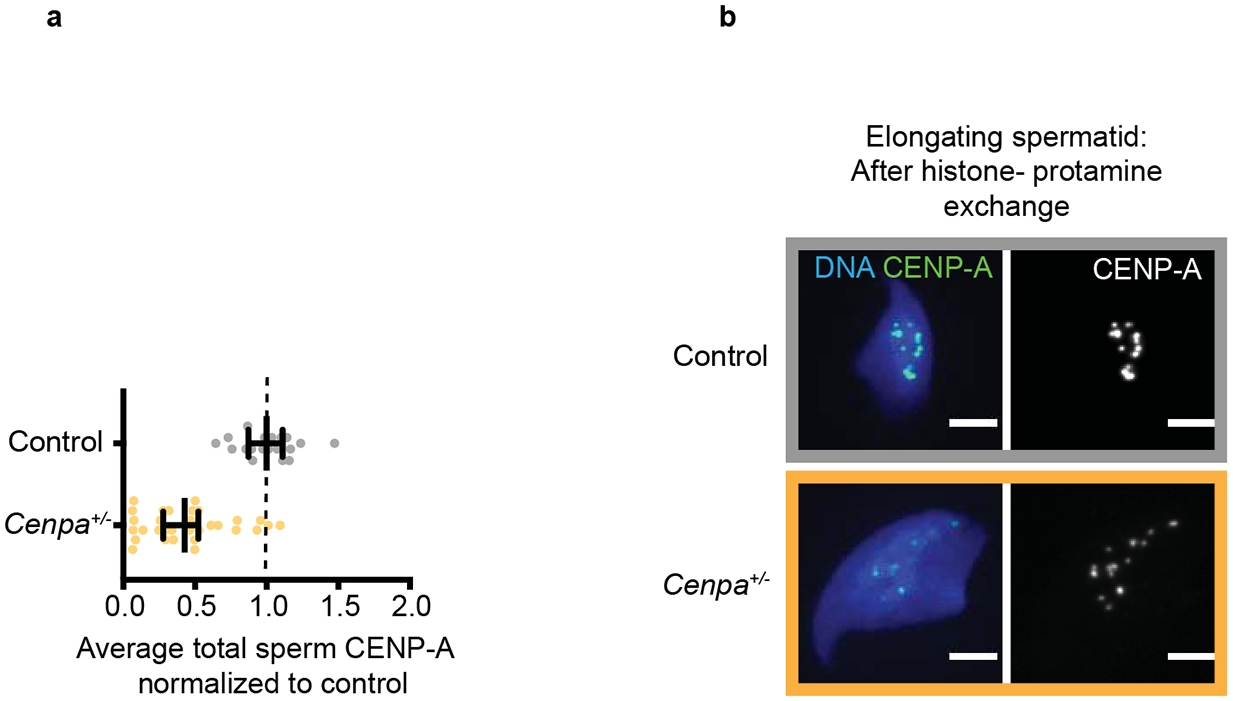
a, Quantification and b, images showing CENP-A levels are reduced to 42.7 ± 1.5% in spermatids from Cenpa+/− males compared to WT males, similar to the reduction measured in prophase spermatocytes (Fig. 1c). N = 20 (control), 32 (Cenpa+/−) spermatids. Error bars: median ± 95% CI. Scale bars: 5 μm (main panel), 1μm (inset). Source numerical data are available in source data.
Extended Data Fig. 5. Model to explain equalization of epigenetic differences and subsequent memory.
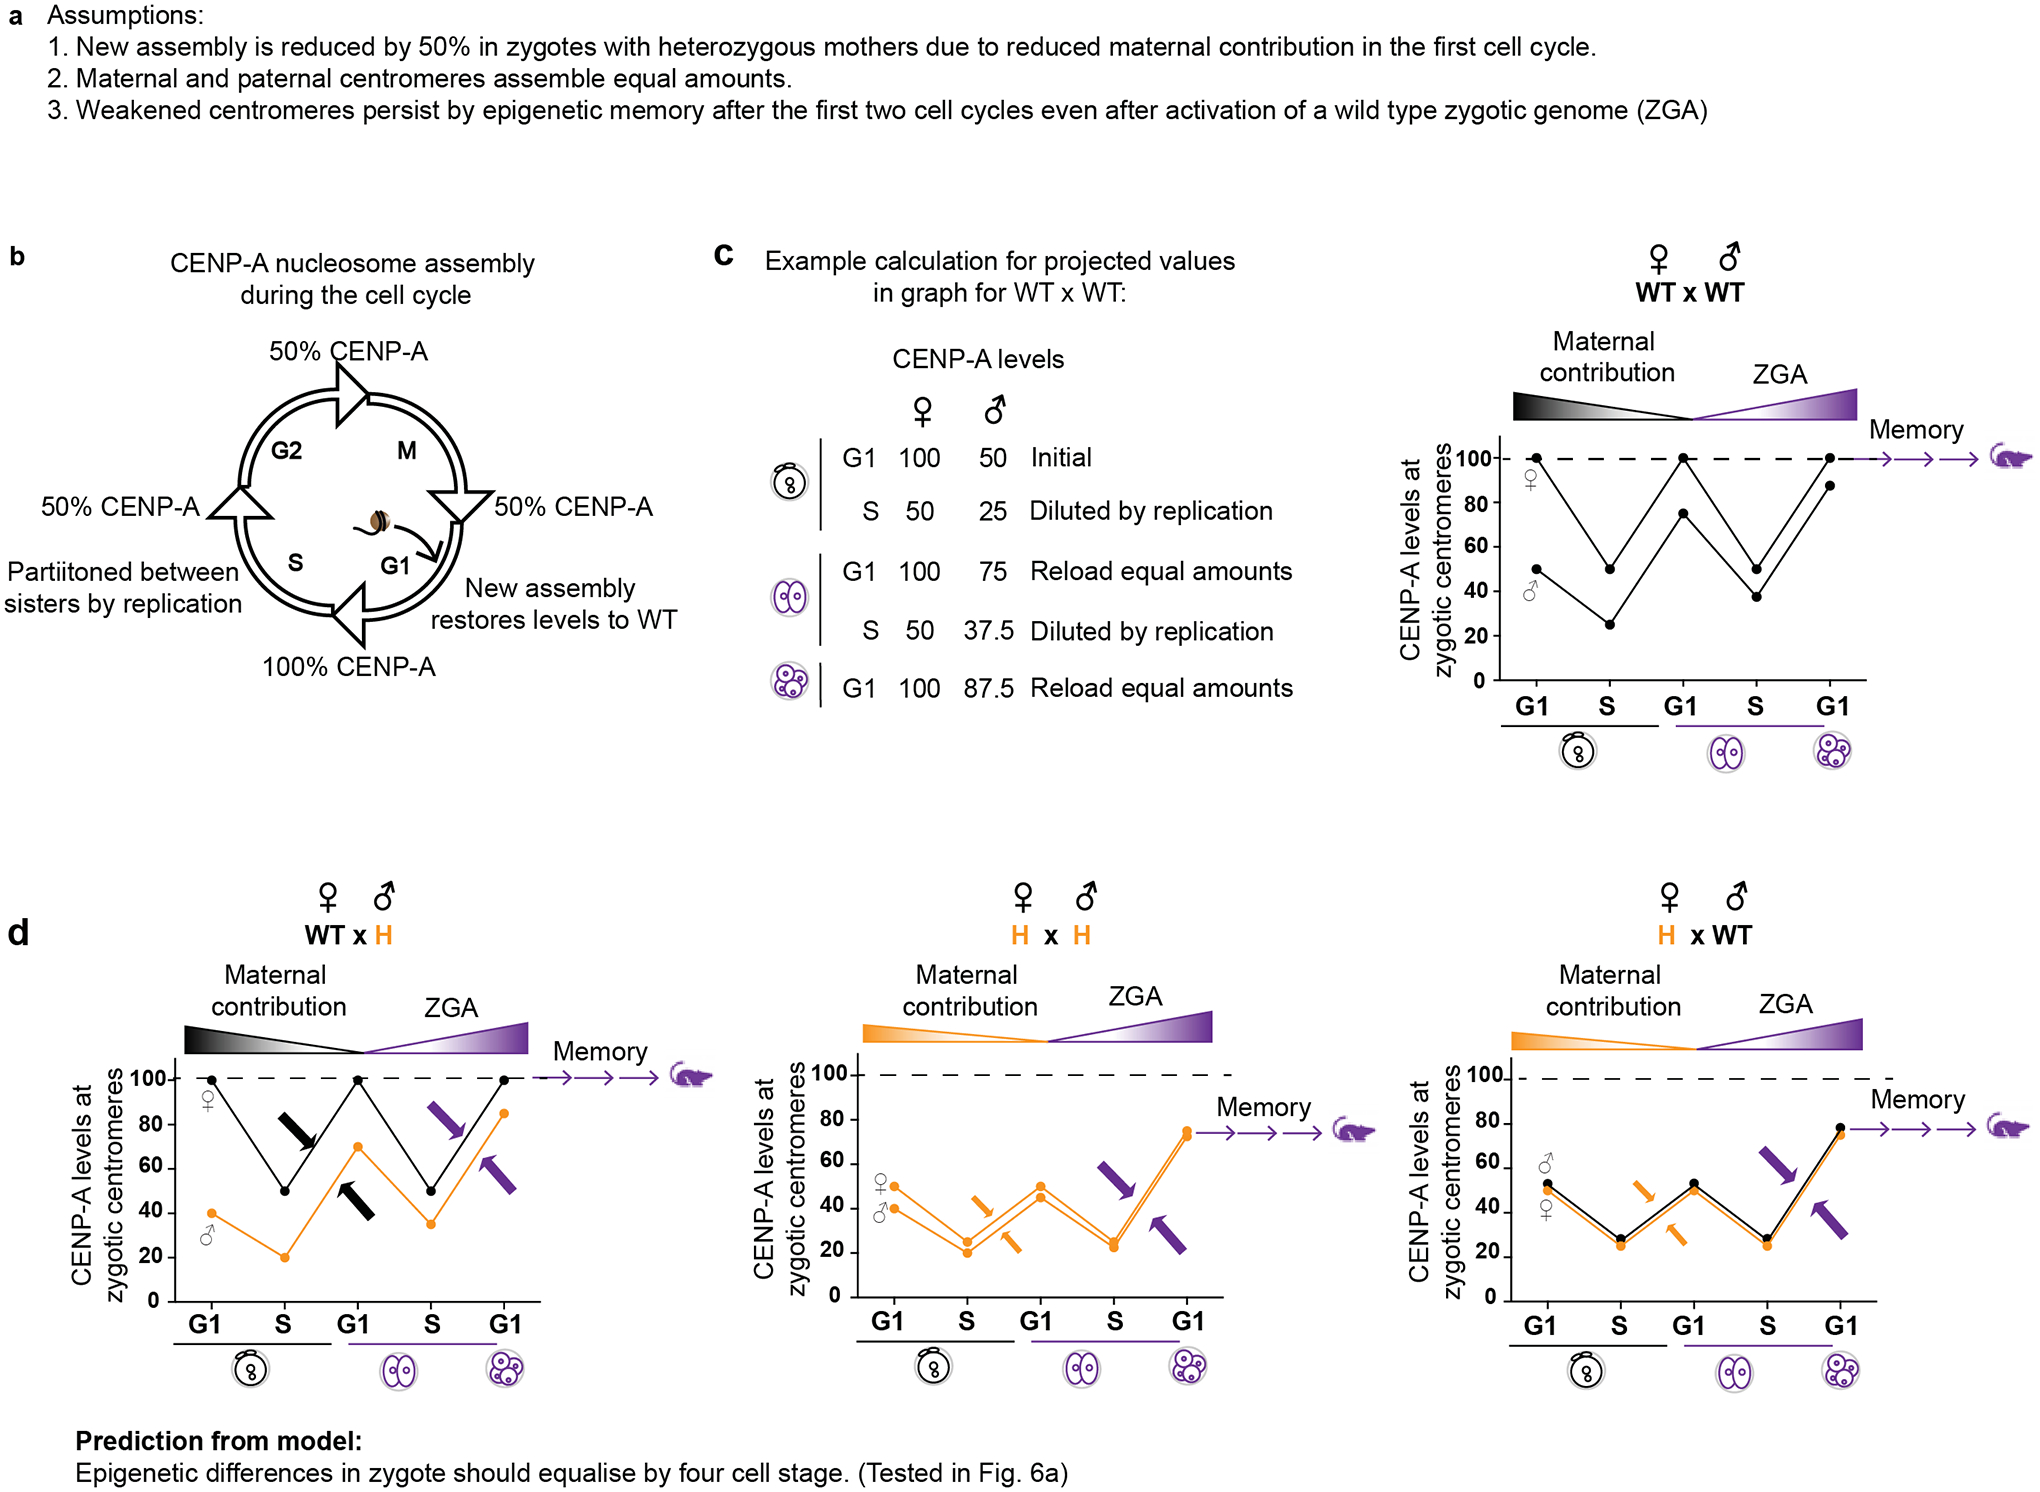
a, Assumptions used for the modeling. b, Epigenetic inheritance of CENP-A as determined in cycling somatic cells in culture by replication coupled dilution and G1 reloading. c, Example calculation and graph for CENP-A assembly in the first two embryonic cell cycles for progeny of a WT × WT cross. For simplicity, initial CENP-A levels are set to 100 and 50 on the maternal and paternal centromeres, respectively, based on our measurements in zygotes (Fig. 3c). At each S-phase, CENP-A levels are diluted by half on each centromere, and we assume equal assembly on maternal and paternal centromeres in the following G1. Assembly in the first cell cycle depends on the maternal pool, set to 100 for a zygote from a WT female, giving an increase of 50 on both maternal and paternal centromeres. Assembly in the second cell cycle depends on the zygotic pool, which is set to 100 for a WT zygotic genotype. d, Graphs from similar calculations as b, for the designated crosses. Initial CENP-A levels are set to 50 for maternal centromeres from Cenpa+/− mothers and 40 for paternal centromeres from Cenpa+/− fathers, based on our measurements (Fig. 1c and Fig. 2c). Arrows indicate equal assembly on maternal and paternal centromeres. In the first cell cycle, assembly is from a maternal pool of 100 (black arrows) or 50 (yellow arrows) for WT or Cenpa+/− mothers, respectively. In the second cell cycle, assembly is from a zygotic pool of 100 (purple arrows), reflecting a WT zygotic genotype. Calculations show equalization by the four-cell stage in all crosses. Furthermore, crosses with reduced maternal contribution (H♀) equalize to a lower level, which is then remembered through development. Source numerical data are available in source data.
Extended Data Fig. 6. 3’ UTR of Cenpa message has hallmarks of dormant maternal mRNA.
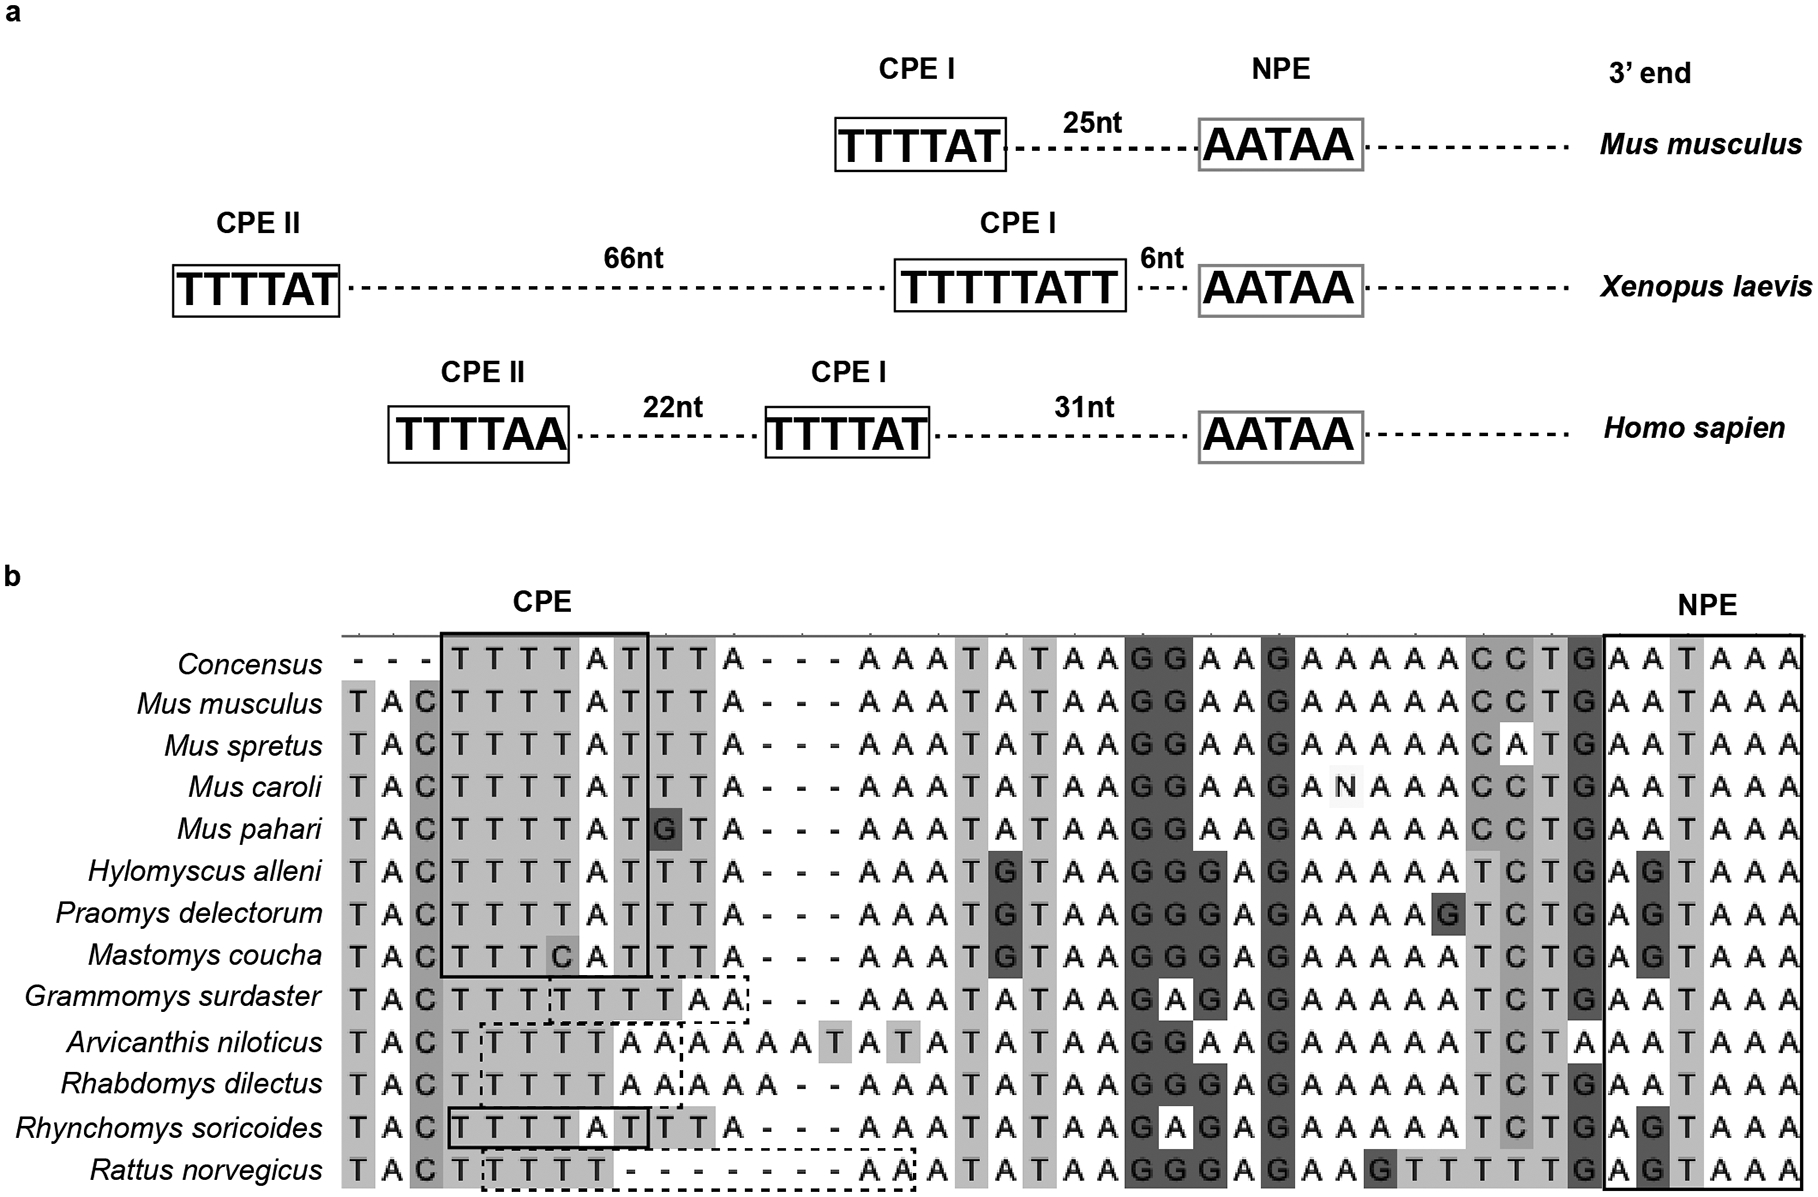
a, Polyadenylation (addition of a poly (A) tail) of mRNA is a mechanism to control gene expression. Nuclear polyadenylation is an essential part of post-transcriptional processing of most mRNAs, dictated by the ubiquitous cis-element 3’ UTR hexameric motif AATAAA (nuclear polyadenylation element, NPE). Dormant maternal mRNAs are deposited in the oocyte with short poly(A) tails and are translationally inactive. After fertilization, these maternal mRNAs undergo translation by elongation of the poly(A) tail, controlled by a cytoplasmic polyadenylation element (CPE) usually present within 100 nt upstream of the NPE28. We find conserved CPEs in the mouse, human and frog Cenpa 3’ UTRs (CPE I = TTTTAT or CPE II = TTTTAA) upstream of the NPE as expected for dormant maternal mRNAs. b, Analysis of 12 sequenced rodent species38 reveals that CPEs (CPE I in bold boxes and CPE II in dashed boxes) are present upstream of the NPE in every species as expected for a maternal effect gene.
Extended Data Fig. 7. Symmetric distribution of H3K9me3 at the four-cell stage.
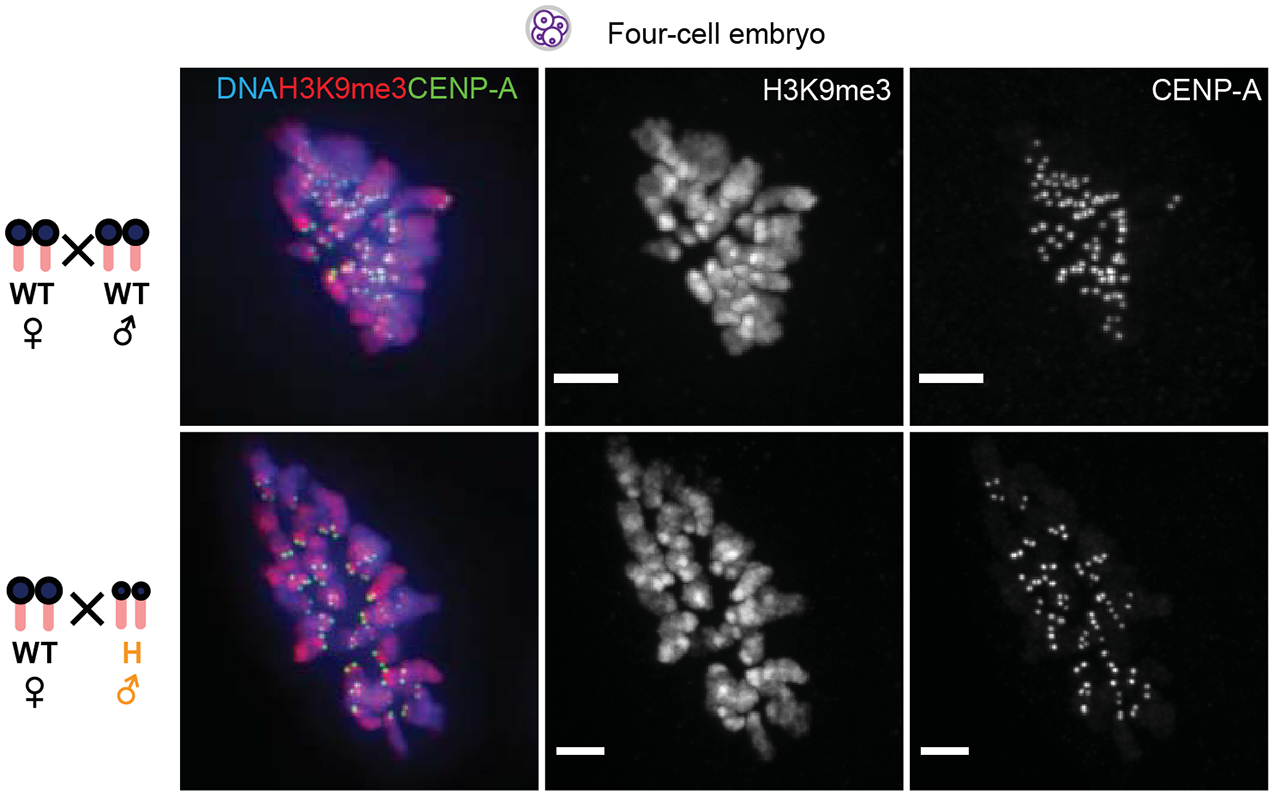
Representative cell from four-cell embryos for each of the two denoted crosses with H3K9me3 (red), CENP-A (green) and DNA (blue). H3K9me3 is present on both maternal and paternal chromatin at this stage, in contrast to zygotes (Fig. 3b and Fig. 6b–e). Scale bars: 5 μm.
Extended Data Fig. 8. CENP-A intensity distribution changes from bimodal to unimodal in early embryogenesis.
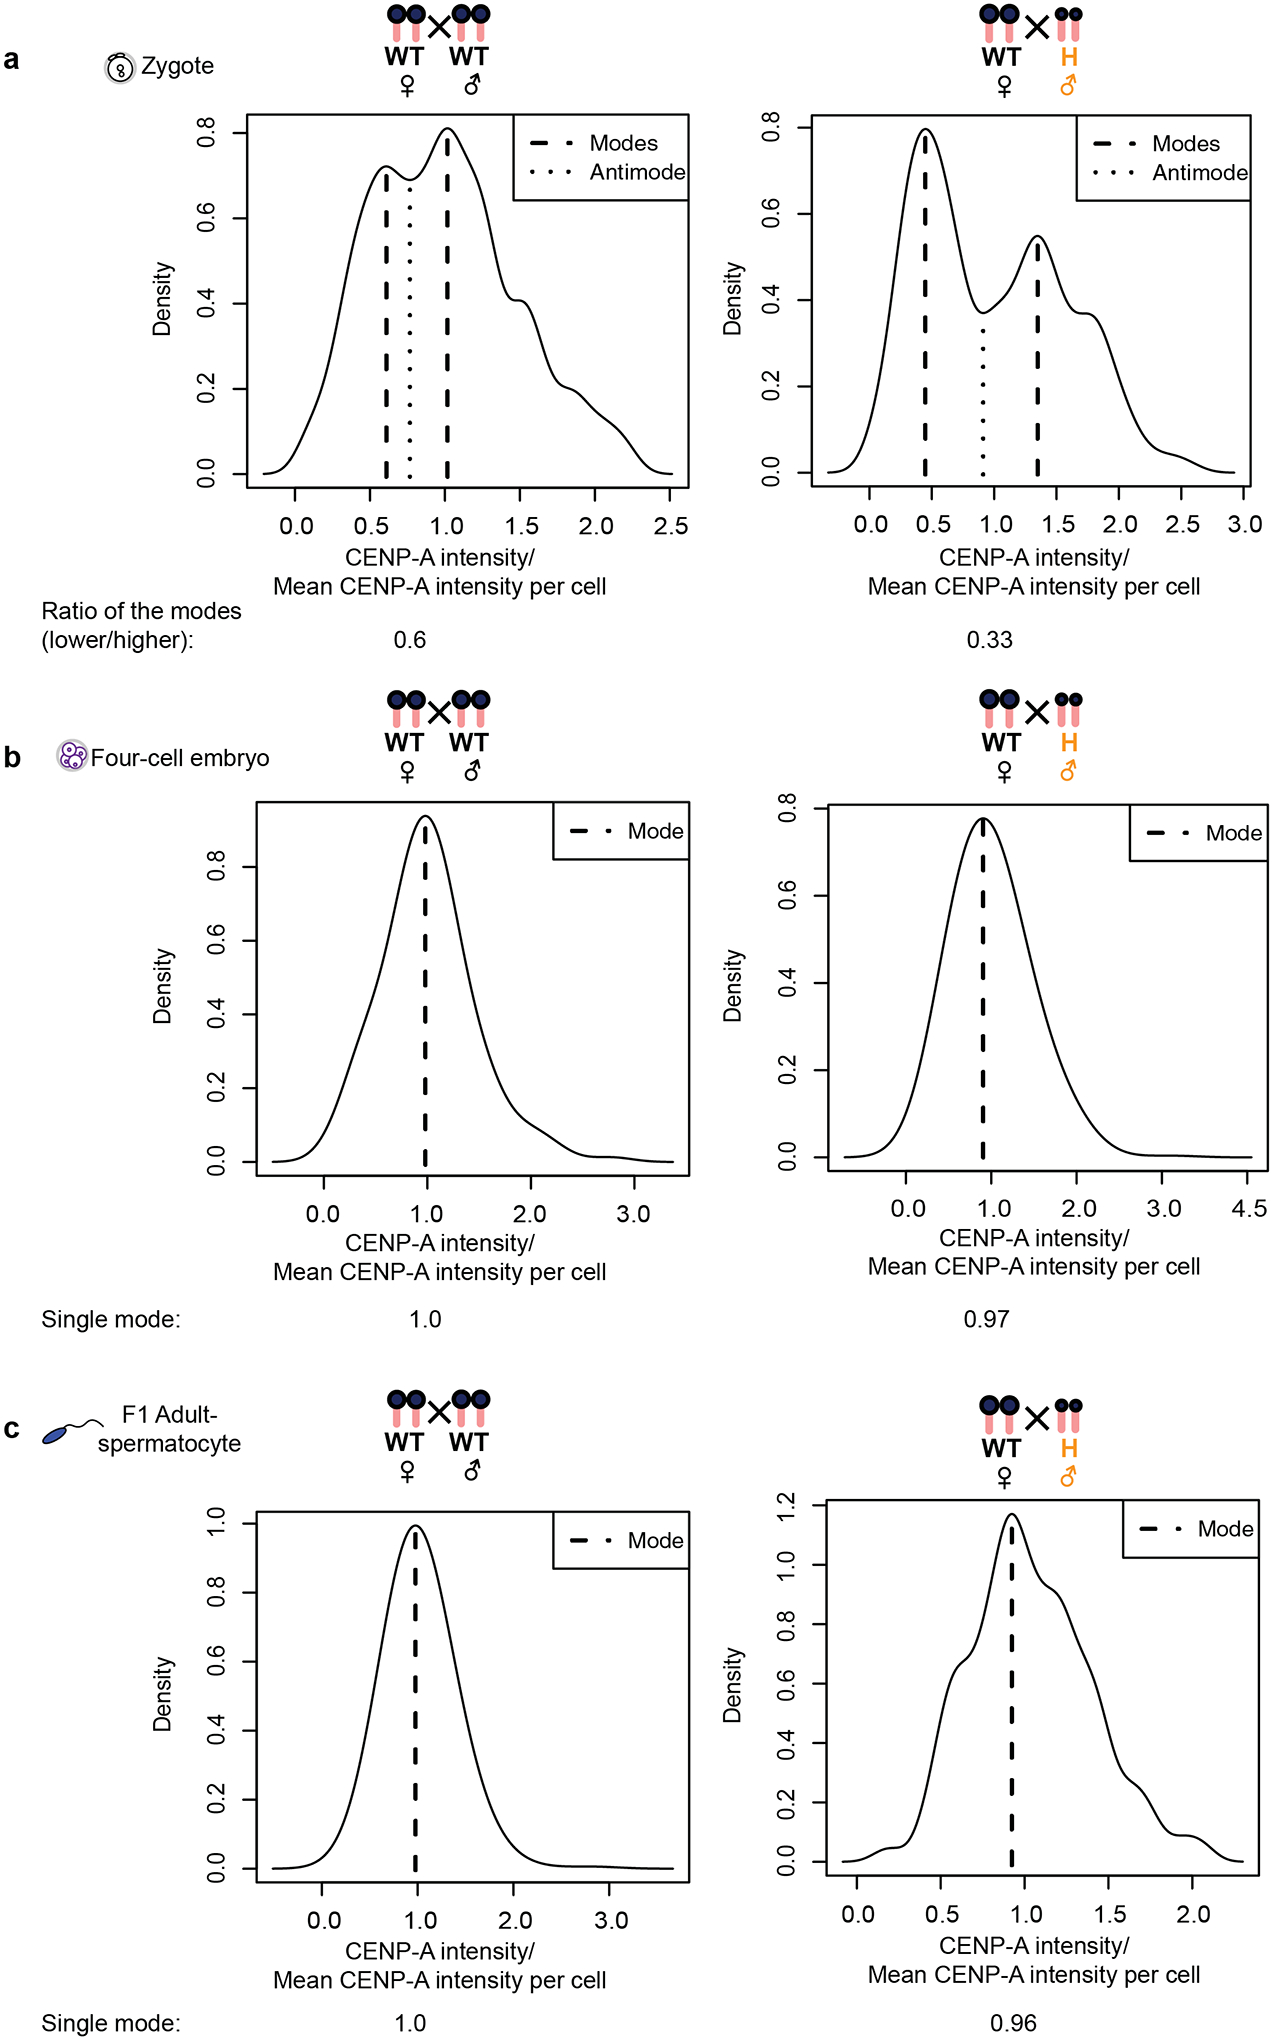
Graphs show locations of the modes in each distribution from Fig. 6a. a, The WT × WT and WT♀ × H♂ zygote distributions contain two modes (dashed lines) on either side of a central antimode (dip, pointed lines) characteristic of bimodal distributions52. The separation between the two modes is greater in the WT♀ × H♂ cross as expected. In addition, the ratios of the values of the two modes (x-axis) denoted under each cross agree well with the ratios of paternal to maternal centromere intensities calculated in Figs. 3c and 6f. b,c, Similar plots of four-cell embryos (b) from the same crosses show a single central mode characteristic of a unimodal population, like the F1 adult spermatocytes (c), which represents a uniform centromere population. The ratio of the modes in bimodal or the value of the mode in unimodal distribution is indicated below the graphs. Source numerical data are available in source data.
Extended Data Fig. 9. Genetic pathway for centromere equalization.
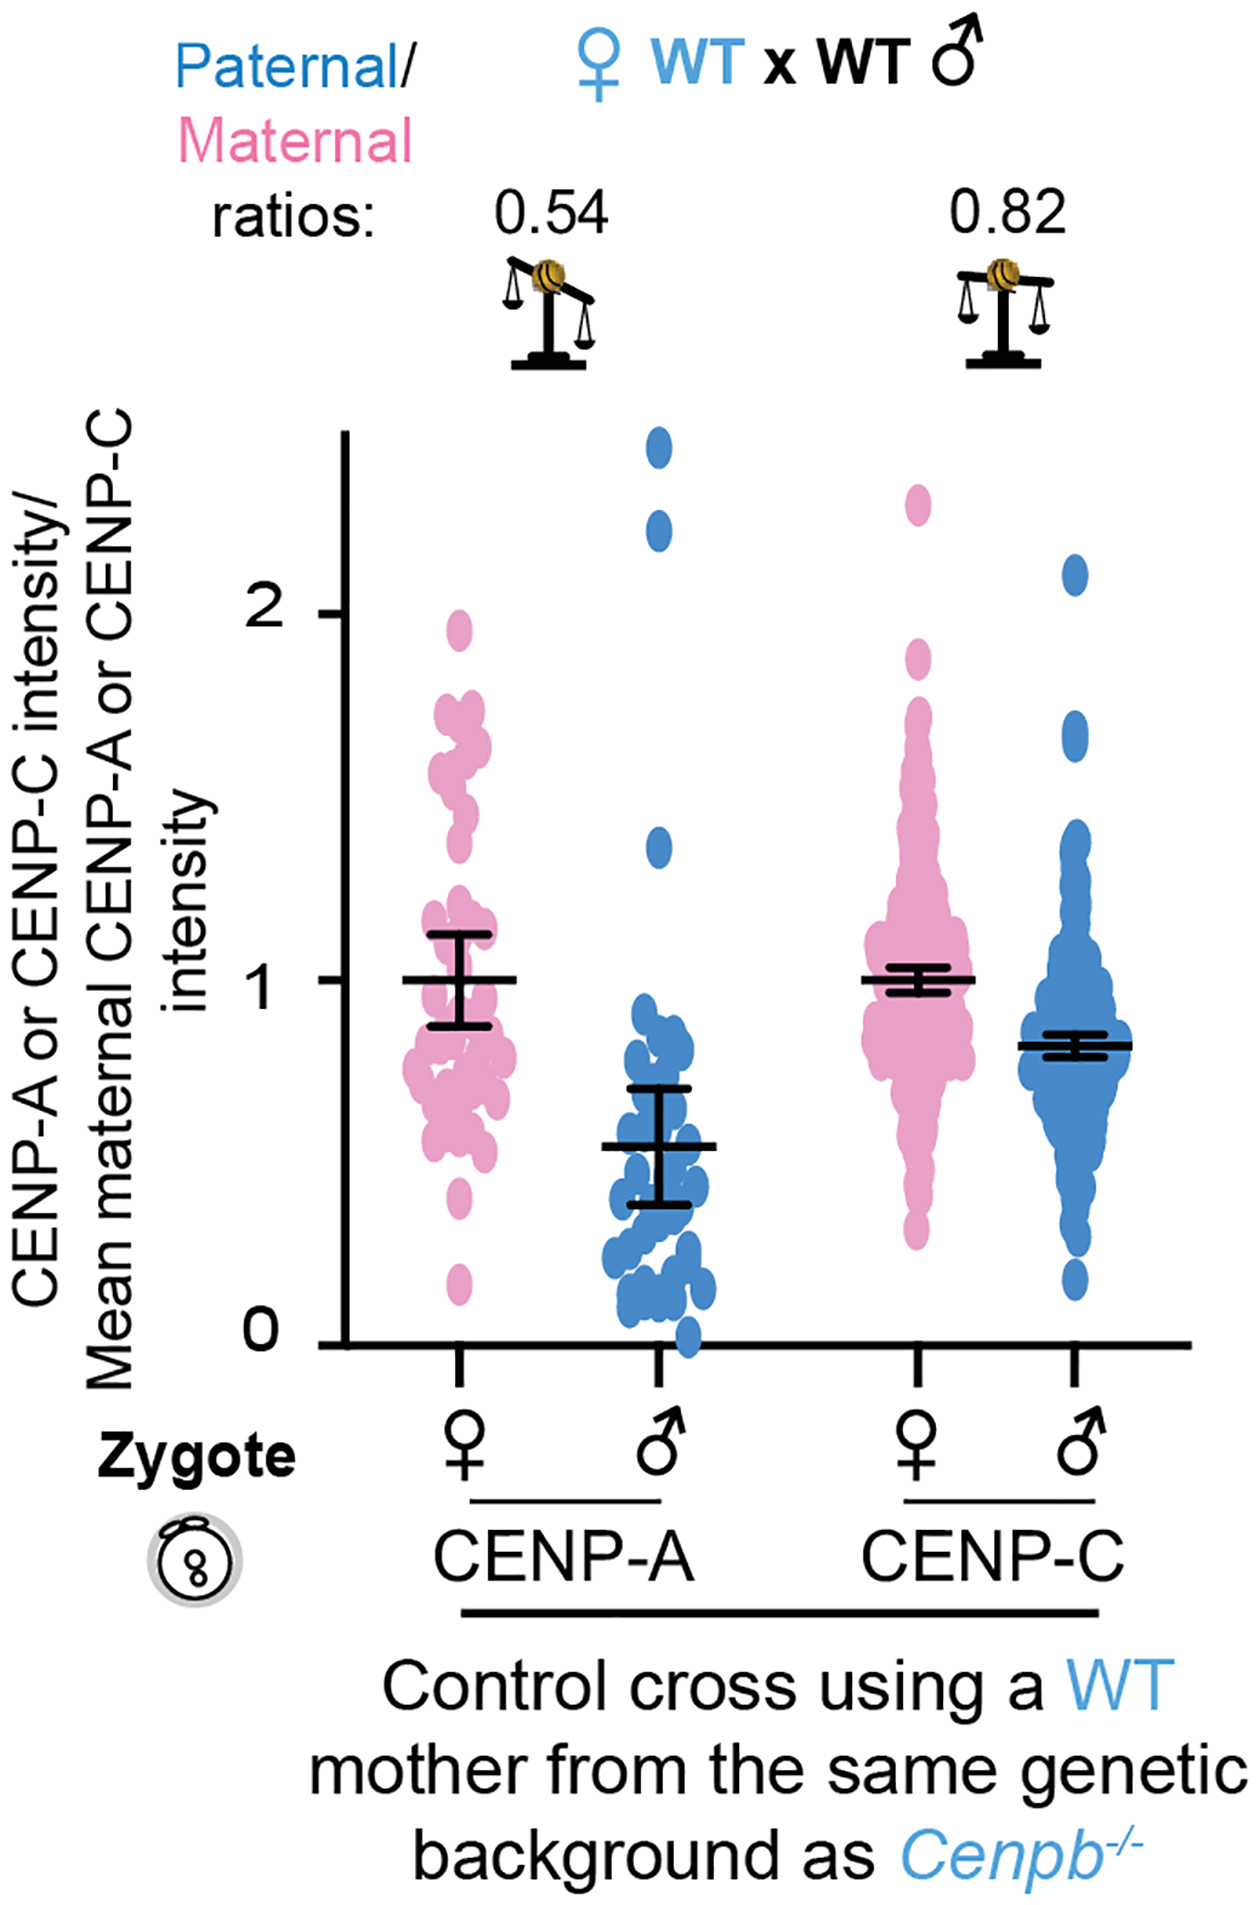
a, Quantifications of maternal (pink) and paternal (blue) CENP-A and CENP-C intensities in zygotes from a WT × WT control for the Cenpb−/− strain38, with average paternal/maternal CENP-A or CENP-C ratios above; N = 46, 42, 237, 231 centromeres (left to right). Error bars: median ± 95% CI. Although these animals are in a CF-1/C57BL/6J/DBA/2J background, CENP-A and CENP-C ratios in WT zygotes using mothers from this background are consistent with those of C57BL/6J alone (Fig. 6e,f). Source numerical data are available in source data.
Supplementary Material
Acknowledgements
We thank D.P. Dudka, V. Fu and M. Barmada for assistance with genotyping, G. Logsdon for cloning a protein expression vector, M. Gerace for antigen preparation, D.P. Dudka for help with multiple sequence alignments, and R.M. Schultz, M.S. Bartolomei and M.T. Levine for comments and discussion. This work was supported by the NIH (HD058730) to B.E.B. and M.A.L.
Footnotes
Competing interest declaration
The authors declare no competing interests.
Supplementary information is available for this paper.
References
- 1.Kixmoeller K, Allu PK & Black BE The centromere comes into focus: from CENP-A nucleosomes to kinetochore connections with the spindle. Open Biol 10, 200051 (2020). [DOI] [PMC free article] [PubMed] [Google Scholar]
- 2.Dumont M & Fachinetti D DNA Sequences in Centromere Formation and Function. Prog Mol Subcell Biol 56 305–336 (2017). [DOI] [PubMed] [Google Scholar]
- 3.Chmátal L, Schultz RM, Black BE & Lampson MA Cell Biology of Cheating-Transmission of Centromeres and Other Selfish Elements Through Asymmetric Meiosis. Prog Mol Subcell Biol 56 377–396 (2017). [DOI] [PubMed] [Google Scholar]
- 4.Iwata-Otsubo A et al. Expanded Satellite Repeats Amplify a Discrete CENP-A Nucleosome Assembly Site on Chromosomes that Drive in Female Meiosis. Curr. Biol 27, 2365–2373.e8 (2017). [DOI] [PMC free article] [PubMed] [Google Scholar]
- 5.Akera T, Trimm E & Lampson MA Molecular Strategies of Meiotic Cheating by Selfish Centromeres. Cell 178, 1132–1144.e10 (2019). [DOI] [PMC free article] [PubMed] [Google Scholar]
- 6.Fishman L, & Saunders A (2008). Centromere-associated female meiotic drive entails male fitness costs in monkeyflowers. Science 322, 1559–1562. [DOI] [PubMed] [Google Scholar]
- 7.Voullaire LE, Slater HR, Petrovic V & Choo KHA A functional marker centromere with no detectable alpha-satellite, satellite III, or CENP-B protein: Activation of a latent centromere? Am. J. Hum. Genet 52, 1153–1163 (1993). [PMC free article] [PubMed] [Google Scholar]
- 8.Logsdon GA et al. Human Artificial Chromosomes that Bypass Centromeric DNA. Cell 178, 624–639.e19 (2019). [DOI] [PMC free article] [PubMed] [Google Scholar]
- 9.Depinet TW et al. Characterization of neo-centromeres in marker chromosomes lacking detectable alpha-satellite DNA. Hum. Mol. Genet 6, 1195–204 (1997). [DOI] [PubMed] [Google Scholar]
- 10.Du Sart D et al. A functional neo-centromere formed through activation of a latent human centromere and consisting of non-alpha-satellite DNA. Nat. Genet 16, 144–153 (1997). [DOI] [PubMed] [Google Scholar]
- 11.Black BE & Cleveland DW Epigenetic centromere propagation and the nature of CENP-A nucleosomes. Cell 144, 471–479 (2011). [DOI] [PMC free article] [PubMed] [Google Scholar]
- 12.Foltz DR et al. Centromere-Specific Assembly of CENP-A Nucleosomes Is Mediated by HJURP. Cell 137, 472–484 (2009). [DOI] [PMC free article] [PubMed] [Google Scholar]
- 13.Jansen LET, Black BE, Foltz DR & Cleveland DW Propagation of centromeric chromatin requires exit from mitosis. J. Cell Biol 176, 795–805 (2007). [DOI] [PMC free article] [PubMed] [Google Scholar]
- 14.Dunleavy EM et al. HJURP Is a Cell-Cycle-Dependent Maintenance and Deposition Factor of CENP-A at Centromeres. Cell 137, 485–497 (2009). [DOI] [PubMed] [Google Scholar]
- 15.Schuh M, Lehner CF & Heidmann S Incorporation of Drosophila CID/CENP-A and CENP-C into centromeres during early embryonic anaphase. Curr. Biol 17, 237–43 (2007). [DOI] [PubMed] [Google Scholar]
- 16.Moree B, Meyer CB, Fuller CJ & Straight AF CENP-C recruits M18BP1 to centromeres to promote CENP-A chromatin assembly. J. Cell Biol 194, 855–871 (2011). [DOI] [PMC free article] [PubMed] [Google Scholar]
- 17.Ravi M & Chan SWL Haploid plants produced by centromere-mediated genome elimination. Nature 464, 615–8 (2010). [DOI] [PubMed] [Google Scholar]
- 18.Comai L & Tan EH Haploid Induction and Genome Instability. Trends in Genetics vol. 35 791–803 (2019). [DOI] [PubMed] [Google Scholar]
- 19.Raychaudhuri N et al. Transgenerational Propagation and Quantitative Maintenance of Paternal Centromeres Depends on Cid/Cenp-A Presence in Drosophila Sperm. Plos Biol 10, (12) e1001434 (2012). [DOI] [PMC free article] [PubMed] [Google Scholar]
- 20.Gassmann R et al. An inverse relationship to germline transcription defines centromeric chromatin in C. Elegans. Nature, 484, 534–537 (2012). [DOI] [PMC free article] [PubMed] [Google Scholar]
- 21.Liu H, Kim JM & Aoki F Regulation of histone H3 lysine 9 methylation in oocytes and early pre-implantation embryos. Development 131, 2269–2280 (2004). [DOI] [PubMed] [Google Scholar]
- 22.Burton A et al. Heterochromatin establishment during early mammalian development is regulated by pericentromeric RNA and characterized by non-repressive h3k9me3. Nat. Cell Biol 22, 767–778 (2020). [DOI] [PMC free article] [PubMed] [Google Scholar]
- 23.Puschendorf M et al. PRC1 and Suv39h specify parental asymmetry at constitutive heterochromatin in early mouse embryos. Nat. Genet 40, 411–420 (2008). [DOI] [PubMed] [Google Scholar]
- 24.Palmer DK, O’Day K & Margolis RL The centromere specific histone CENP-A is selectively retained in discrete foci in mammalian sperm nuclei. Chromosoma 100, 32–6 (1990). [DOI] [PubMed] [Google Scholar]
- 25.Palmer DK, Day KO, Trongt H. Le, Charbonneau H & Margolis RL Purification of the centromere-specific protein CENP-A and demonstration that it is a distinctive histone. Proc. Natl. Acad. Sci. U. S. A 88, 3734–3738 (1991). [DOI] [PMC free article] [PubMed] [Google Scholar]
- 26.Brinkley BR et al. Arrangements of kinetochores in mouse cells during meiosis and spermiogenesis. Chromosoma 94, 309–317 (1986). [DOI] [PubMed] [Google Scholar]
- 27.Smoak EM, Stein P, Schultz RM, Lampson MA & Black BE Long-Term Retention of CENP-A Nucleosomes in Mammalian Oocytes Underpins Transgenerational Inheritance of Centromere Identity. Curr. Biol 26, 1110–6 (2016). [DOI] [PMC free article] [PubMed] [Google Scholar]
- 28.Richter JD Cytoplasmic Polyadenylation in Development and Beyond. Microbiol. Mol. Biol. Rev 63, 446–456 (1999). [DOI] [PMC free article] [PubMed] [Google Scholar]
- 29.Zeng F, Baldwin DA & Schultz RM Transcript profiling during preimplantation mouse development. Dev. Biol 272, 483–496 (2004). [DOI] [PubMed] [Google Scholar]
- 30.Ishiuchi T et al. Reprogramming of the histone H3.3 landscape in the early mouse embryo. Nat. Struct. Mol. Biol 28, 38–49 (2021). [DOI] [PubMed] [Google Scholar]
- 31.Barnhart MC et al. HJURP is a CENP-A chromatin assembly factor sufficient to form a functional de novo kinetochore. J. Cell Biol 194, 229–43 (2011). [DOI] [PMC free article] [PubMed] [Google Scholar]
- 32.Fujita Y et al. Priming of Centromere for CENP-A Recruitment by Human hmis18α, hmis18β, and M18BP1. Dev. Cell 12, 17–30 (2007). [DOI] [PubMed] [Google Scholar]
- 33.Nardi IK, Zasadzińska E, Stellfox ME, Knippler CM & Foltz DR Licensing of Centromeric Chromatin Assembly through the Mis18α-Mis18β Heterotetramer. Mol. Cell 61, 774–87 (2016). [DOI] [PMC free article] [PubMed] [Google Scholar]
- 34.Stellfox ME, Nardi IK, Knippler CM & Foltz DR Differential Binding Partners of the Mis18α/β YIPPEE Domains Regulate Mis18 Complex Recruitment to Centromeres. Cell Rep 15, 2127–35 (2016). [DOI] [PMC free article] [PubMed] [Google Scholar]
- 35.Bodor DL et al. The quantitative architecture of centromeric chromatin. Elife 3, e02137 (2014). [DOI] [PMC free article] [PubMed] [Google Scholar]
- 36.Masumoto H, Masukata H, Muro Y, Nozaki N & Okazaki T A human centromere antigen (CENP-B) interacts with a short specific sequence in alphoid DNA, a human centromeric satellite. J. Cell Biol 109, 1963–1973 (1989). [DOI] [PMC free article] [PubMed] [Google Scholar]
- 37.Fachinetti D et al. DNA Sequence-Specific Binding of CENP-B Enhances the Fidelity of Human Centromere Function. Dev. Cell 33, 314–327 (2015). [DOI] [PMC free article] [PubMed] [Google Scholar]
- 38.Kumon T et al. Parallel pathways for recruiting effector proteins determine centromere drive and suppression. Cell 184, 4904–4918 (2021). [DOI] [PMC free article] [PubMed] [Google Scholar]
- 39.Rossant J Postimplantation development of blastomeres isolated from 4 and 8 cell mouse eggs. J. Embryol. Exp. Morphol 36, 283–290 (1976). [PubMed] [Google Scholar]
- 40.Lepikhov K & Walter J Differential dynamics of histone H3 methylation at positions K4 and K9 in the mouse zygote. BMC Dev. Biol 4 (2004). [DOI] [PMC free article] [PubMed] [Google Scholar]
- 41.Lepikhov K et al. Evidence for conserved DNA and histone H3 methylation reprogramming in mouse, bovine and rabbit zygotes. Epigenetics Chromatin 1, 8 (2008). [DOI] [PMC free article] [PubMed] [Google Scholar]
- 42.Xu Q & Xie W Epigenome in Early Mammalian Development: Inheritance, Reprogramming and Establishment. Trends Cell Biol 28, 237–253 (2018). [DOI] [PubMed] [Google Scholar]
- 43.Xie B et al. Histone H3 lysine 27 trimethylation acts as an epigenetic barrier in porcine nuclear reprogramming. Reproduction 151, 9–16 (2016). [DOI] [PubMed] [Google Scholar]
- 44.Van Der Heijden GW et al. Asymmetry in Histone H3 variants and lysine methylation between paternal and maternal chromatin of the early mouse zygote. Mech. Dev 122, 1008–1022 (2005). [DOI] [PubMed] [Google Scholar]
- 45.Hou H et al. Centromeres are dismantled by foundational meiotic proteins Spo11 and Rec8. Nature 591, 671–676 (2021). [DOI] [PMC free article] [PubMed] [Google Scholar]
- 46.Monen J, Maddox PS, Hyndman F, Oegema K & Desai A Differential role of CENP-A in the segregation of holocentric C. Elegans chromosomes during meiosis and mitosis. Nat. Cell Biol 7, 1248–55 (2005). [DOI] [PubMed] [Google Scholar]
- 47.Prosée RF et al. Trans-generational inheritance of centromere identity requires the CENP-A N-terminal tail in the C. elegans maternal germ line. PLoS Biol 19, e3000968 (2021). [DOI] [PMC free article] [PubMed] [Google Scholar]
- 48.Malik HS, & Henikoff S Major evolutionary transitions in centromere complexity. Cell, 138, 1067–1082 (2009). [DOI] [PubMed] [Google Scholar]
- 49.Maheshwari S, Tan EH, West A, Franklin FC, Comai L, & Chan SW Naturally occurring differences in CENH3 affect chromosome segregation in zygotic mitosis of hybrids. PloS genetics, 11, e1004970 (2015). [DOI] [PMC free article] [PubMed] [Google Scholar]
- 50.Bao J & Bedford MT Epigenetic regulation of the histone-protamine transiiton during spermiogenesis. Reproduction 151, R55–R70 (2016). [DOI] [PMC free article] [PubMed] [Google Scholar]
- 51.Rathke C, Baarends WM, Awe S & Renkawitz-Pohl R Chromatin dynamics during spermiogenesis. Biochim. Biophys. Acta 1839, 155–168 (2014). [DOI] [PubMed] [Google Scholar]
- 52.Ameijeiras-Alonso J, Crujeiras RM & Rodríguez-Casal A Mode testing, critical bandwidth and excess mass. Test 28, 900–919 (2019). [Google Scholar]
- 53.Stein P & Schindler K Mouse oocyte microinjection, maturation and ploidy assessment. J. Vis. Exp 53, 2851 (2011). [DOI] [PMC free article] [PubMed] [Google Scholar]
- 54.Chatot CL, Ziomek CA, Bavister BD, Lewis JL & Torres I An improved culture medium supports development of random-bred 1-cell mouse embryos in vitro. J. Reprod. Fertil 86, 679–688 (1989). [DOI] [PubMed] [Google Scholar]
- 55.Dia F, Strange T, Liang J, Hamilton J & Berkowitz KM Preparation of meiotic chromosome spreads from mouse spermatocytes. J. Vis. Exp 129, 55378 (2017). [DOI] [PMC free article] [PubMed] [Google Scholar]
- 56.Taft R In Vitro Fertilization in Mice. Cold Spring Harb. Protoc 11, pdb.prot094508 (2017). [DOI] [PubMed] [Google Scholar]
- 57.Team, R. C. R Core Team (2017). R: A language and environment for statistical computing R Found. Stat. Comput. Vienna, Austria. URL http//www.R-project. (2017). [Google Scholar]
- 58.Ameijeiras-Alonso J, Crujeiras RM & Rodríguez-Casal A Multimode: An R Package for Mode Assessment. arXiv (2018) doi: 10.18637/jss.v097.i09. [DOI] [Google Scholar]
Associated Data
This section collects any data citations, data availability statements, or supplementary materials included in this article.
Supplementary Materials
Data Availability Statement
Previously published microarray data for long poly-(A) tailed Cenpa mRNA in pre-implantation development is available freely on NCBI Gene Expression Omnibus (GEO) database (Accession no: GDS813 from reference series: GSE1749). The 12 mouse genomes used for Cenpa 3’UTR analysis are available at NCBI BioProject database (https://www.ncbi.nlm.nih.gov/bioproject) under accession number PRJNA669840. Source data have been provided in Source Data. All other data supporting the findings of this study are available from the corresponding author on reasonable request.


