

Abstract
How are hematopoietic stem cells (HSCs) protected from inflammation, which increases with age and can deplete HSCs? Adiponectin, an anti-inflammatory factor that is not required for HSC function or hematopoiesis, promotes stem/progenitor cell proliferation after bacterial infection and myeloablation. Adiponectin binds two receptors, AdipoR1 and AdipoR2, which have ceramidase activity that increases upon adiponectin binding. We found adiponectin receptors are non-cell-autonomously required in hematopoietic cells to promote HSC quiescence and self-renewal. Adiponectin receptor signaling suppresses inflammatory cytokine expression by myeloid cells and T cells, including interferon gamma (IFNγ) and tumor necrosis factor (TNF). Without adiponectin receptors, the levels of these factors increase, chronically activating HSCs, reducing their self-renewal potential, and depleting them during aging. Pathogen infection accelerates this loss of HSC self-renewal potential. Blocking IFNγ or TNF signaling partially rescues these effects. Adiponectin receptors are thus required in immune cells to sustain HSC quiescence and to prevent premature HSC depletion by reducing inflammation.
Introduction
Adiponectin is a circulating factor that suppresses inflammation and regulates glucose and fatty acid metabolism in multiple tissues1–3. Adiponectin is synthesized by adipocytes throughout the body4–7 and by Leptin Receptor+ stromal cells in the bone marrow8–11. Adiponectin suppresses the activation of macrophages12,13, NK cells14, and T cells15 through multiple mechanisms, reducing their production of inflammatory factors, including IFNγ15 and TNF12,16,17. Adiponectin deficiency has no effect on HSCs or hematopoiesis in the bone marrow of specific pathogen free mice but after bacterial infection, adiponectin promotes hematopoietic progenitor proliferation by suppressing TNF expression17. Adiponectin also promotes HSC proliferation after myeloablation8,9,17.
Adiponectin has two ubiquitously expressed receptors with enzymatic activity18,19, AdipoR1 and AdipoR220, and a third receptor that binds adiponectin but lacks an intracellular signaling domain, Tcad21. AdipoR1 and AdipoR2 have constitutive ceramidase activity that increases upon adiponectin binding18,19. They convert ceramide to sphingosine and sphingosine-1-phosphate22, which regulates HSC proliferation, migration, and survival23–26. AdipoR1/R2 deficiency causes more severe insulin resistance and glucose intolerance than adiponectin deficiency20, perhaps because the receptors signal even in the absence of adiponectin18,19. This raises the possibility that AdipoR1/R2 may be necessary to regulate aspects of HSC function that do not necessarily require adiponectin.
The bone marrow becomes more inflammatory during aging27–32. Inflammatory factors promote HSC activation and chronic inflammation promotes HSC depletion33–36. However, HSCs remain mainly quiescent37 and increase in number with age in most mouse strains38. This suggests the existence of mechanisms to protect HSCs from chronic inflammation in adult bone marrow. Regulatory T cells protect HSCs from immune cells after allogeneic transplantation 39,40, raising the question of whether there are factors that protect HSCs from immune cells and sustain HSC quiescence in normal adult bone marrow.
Results
Adiponectin receptors promote HSC quiescence
Adipor1 and Adipor2 are ubiquitously expressed by hematopoietic cells12,15,41 (Fig.1a–b) while Tcad was not detected (Fig.1c). To test if adiponectin receptors are required by hematopoietic cells, we generated Vav1-Cre; Adipor1fl/fl; Adipor2fl/fl mice. Vav1-Cre; Adipor1fl/fl; Adipor2fl/fl mice were born at expected mendelian frequencies (Extended Data Fig.1a) and were grossly normal in size and appearance (Extended Data Fig.1b–c). Vav1-Cre itself did not have any effect on bone marrow or spleen cellularity, blood cell counts, or the frequencies of HSCs, multipotent progenitors (MPPs), or restricted hematopoietic progenitors in the bone marrow or spleen (Extended Data Fig. 1d–m). At 8-10 weeks of age, Vav1-Cre; Adipor1fl/fl; Adipor2fl/fl mice had normal bone marrow and thymus cellularity, but increased spleen cellularity (Fig.1d) and normal blood cell counts (Fig.1e) relative to Adipor1fl/fl; Adipor2fl/fl controls. In the bone marrow, Vav1-Cre; Adipor1fl/fl; Adipor2fl/fl mice did not significantly differ from Adipor1fl/fl; Adipor2fl/fl controls in the frequencies of HSCs (Fig.1f), MPPs (Fig.1g), common myeloid progenitors (CMPs), granulocyte-macrophage progenitors (GMPs), or megakaryocyte-erythroid progenitors (MEPs) (Fig.1i), though they did have a modest increase in the frequency of Lineage−Sca-1+c-kit+CD48+ hematopoietic progenitor cells (HPCs) (Fig.1h). Vav1-Cre; Adipor1fl/fl; Adipor2fl/fl mice also did not significantly differ from Adipor1fl/fl; Adipor2fl/fl controls in the frequencies of CD3+ T cells or CD71+Ter119+ erythrocyte precursors in the bone marrow but had a lower frequency of B220+ B cells and a higher frequency of Mac-1+Gr-1+ myeloid cells (Fig. 1j). The markers used to identify each cell population are listed in Supplementary Table 1 and the gates used to isolate the cells by flow cytometry are shown in Extended Data Fig. 2.
Figure 1. Adiponectin receptors promote HSC quiescence.
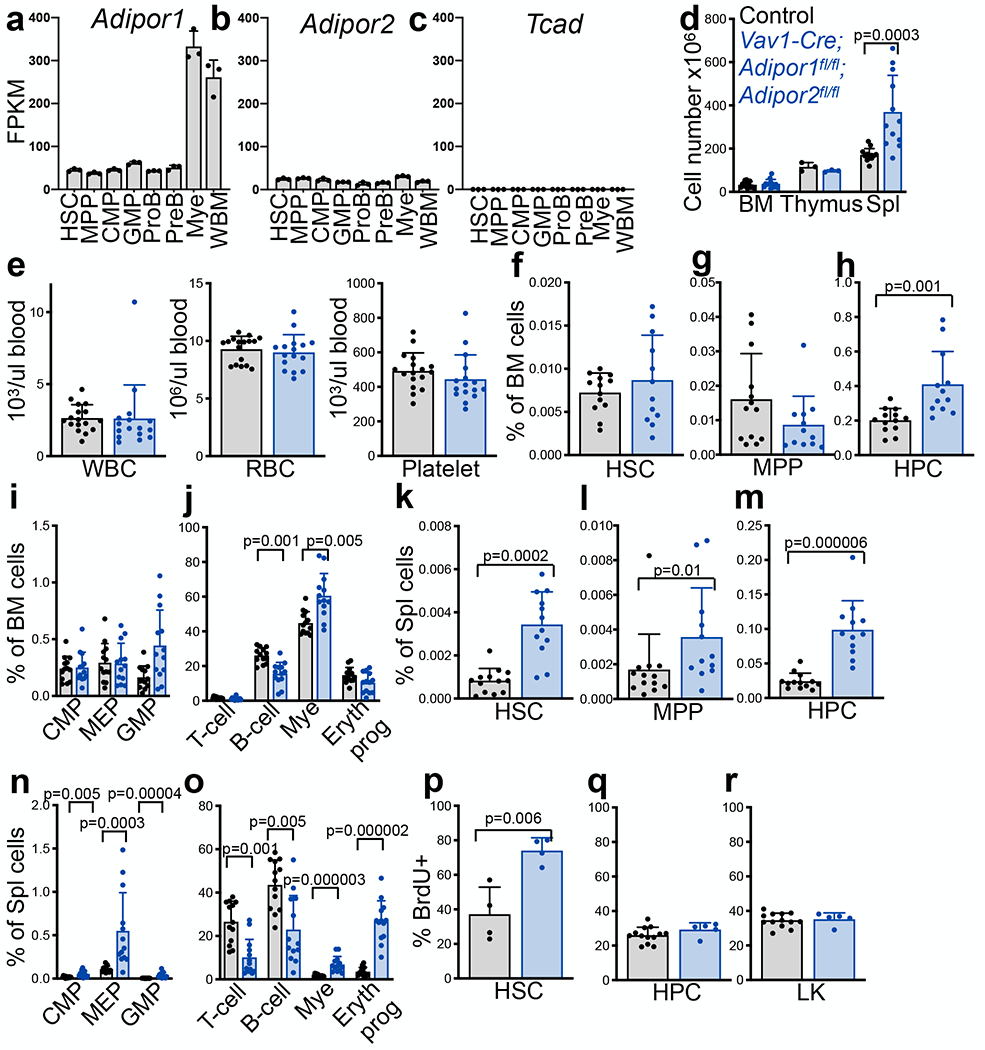
a-c. RNAseq analysis of the adiponectin receptors Adipor1, Adipor2, and Tcad in hematopoietic stem and progenitor cell populations (n=3 mice per genotype in one experiment). d. The number of cells in one femur and one tibia, the thymus, and the spleen of 8–10-week-old Vav1-Cre; Adipor1fl/fl; Adipor2fl/fl and Adipor1fl/fl; Adipor2fl/fl control mice (n=12 Vav1-Cre; Adipor1fl/fl; Adipor2fl/fl mice and n=13 control mice in six independent experiments for bone marrow and spleen, n=3 mice per genotype in one experiment for thymus). e. White blood cell, red blood cell, and platelet counts in the blood of 8–10-week-old Vav1-Cre; Adipor1fl/fl; Adipor2fl/fl and control mice (n=16 Vav1-Cre; Adipor1fl/fl; Adipor2fl/fl mice and n=17 control mice in seven independent experiments). f-j. The frequencies of HSCs (f), MPPs (g), HPCs (h), CMPs, GMPs, MEPs (i) and differentiated T, B, myeloid, and erythroid cells (j) in bone marrow cells from one femur and one tibia of Vav1-Cre; Adipor1fl/fl; Adipor2fl/fl and control mice (n=12 (f-h) or n=13 (i-j) Vav1-Cre; Adipor1fl/fl; Adipor2fl/fl mice and n=13 control mice in six independent experiments). k-o. The frequencies of HSCs (k), MPPs (l), HPCs (m), CMPs, GMPs, MEPs (n) and differentiated T, B, myeloid, and erythroid cells (o) in the spleens of Vav1-Cre; Adipor1fl/fl; Adipor2fl/fl and control mice (n=12 (k-m) or n=13 (n-o) Vav1-Cre; Adipor1fl/fl; Adipor2fl/fl mice and n=13 control mice in six independent experiments). p-r. The percentage of HSCs (p), HPCs (q), and LK myeloid progenitors (r) that incorporated a 72 (p) or 2 (q, r) hour pulse of BrdU in Vav1-Cre; Adipor1fl/fl; Adipor2fl/fl and control mice (n=4 mice per genotype for HSCs; n=5 Vav1-Cre; Adipor1fl/fl; Adipor2fl/fl mice and n=13 control mice for HPCs and LKs in two independent experiments for each cell population). All data represent mean ± standard deviation and each dot reflects a different mouse. Statistical significance was assessed using Mann-Whitney tests followed by the Holm-Sidak’s multiple comparisons adjustment (d-o), a Student’s t-test (p), or matched samples two-way ANOVAs followed by Sidak’s multiple comparisons adjustments (q-r). All statistical tests were two-sided. Source numerical data are in the source data files.
In contrast to the bone marrow, Vav1-Cre; Adipor1fl/fl; Adipor2fl/fl mice exhibited splenic extramedullary hematopoiesis with increased numbers of erythroid cells, myeloid cells, and megakaryocytes throughout the red pulp (Extended Data Figure 2d) that was not evident in Adipor1fl/fl; Adipor2fl/fl controls. The spleens of Vav1-Cre; Adipor1fl/fl; Adipor2fl/fl mice had significantly increased frequencies of HSCs, MPPs, HPCs, CMPs, MEPs, and GMPs (Fig. 1k–n) as well as higher frequencies of differentiated myeloid and erythroid cells and lower frequencies of B and T cells as compared to Adipor1fl/fl; Adipor2fl/fl controls (Fig. 1o).
Consistent with extramedullary hematopoiesis, a significantly higher percentage of bone marrow HSCs incorporated a 3-day pulse of 5-bromo-2′-deoxyuridine (BrdU) in Vav1-Cre; Adipor1fl/fl; Adipor2fl/fl mice as compared to Adipor1fl/fl; Adipor2fl/fl controls (Fig. 1p). We did not observe any difference in the rate of proliferation of HPCs or Lineage−c-kit+ (LK) myeloid progenitors in the bone marrow of Vav1-Cre; Adipor1fl/fl; Adipor2fl/fl mice and Adipor1fl/fl; Adipor2fl/fl controls (Fig. 1q and 1r). Adiponectin receptors, therefore, reduced HSC proliferation and the induction of extramedullary hematopoiesis in young adult mice.
Adiponectin receptors maintain HSC function
To test if adiponectin receptors promote HSC function we performed competitive reconstitution assays in irradiated mice. Young adult (8-10 week old) Vav1-Cre; Adipor1fl/fl; Adipor2fl/fl bone marrow cells gave significantly lower levels of donor cell reconstitution as compared to control donor cells in primary recipient mice, though all recipients were long-term multilineage reconstituted by donor cells (Fig. 2a). Upon serial transplantation into secondary and tertiary recipient mice, Vav1-Cre; Adipor1fl/fl; Adipor2fl/fl donor cells continued to give significantly lower levels of reconstitution (Fig. 2b and 2c). In tertiary recipient mice, control cells gave long-term multilineage reconstitution in all 20 recipients but Vav1-Cre; Adipor1fl/fl; Adipor2fl/fl cells gave long-term multilineage reconstitution in only 5 of 20 recipients (Fig. 2d). Tertiary recipients of Vav1-Cre; Adipor1fl/fl; Adipor2fl/fl cells had significantly lower frequencies of donor HSCs, MPPs, HPCs, and LK myeloid progenitors as compared to recipients of control cells (Fig. 2e). AdipoR1/R2 deficiency, therefore, reduced the self-renewal potential of HSCs.
Figure 2. Adiponectin receptors are required to sustain HSC function.
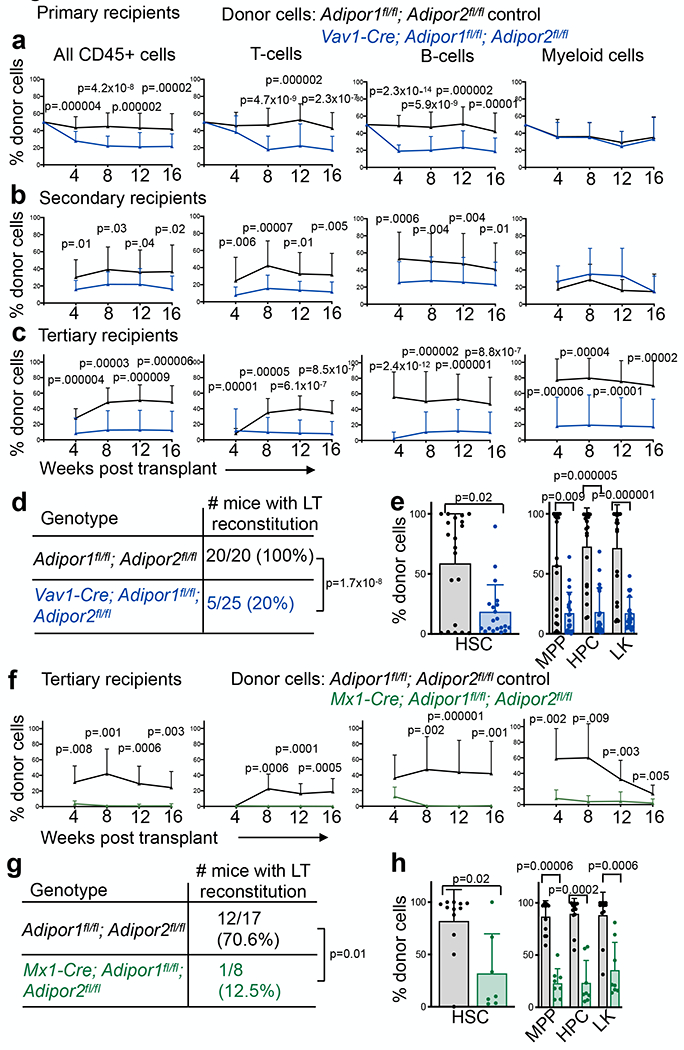
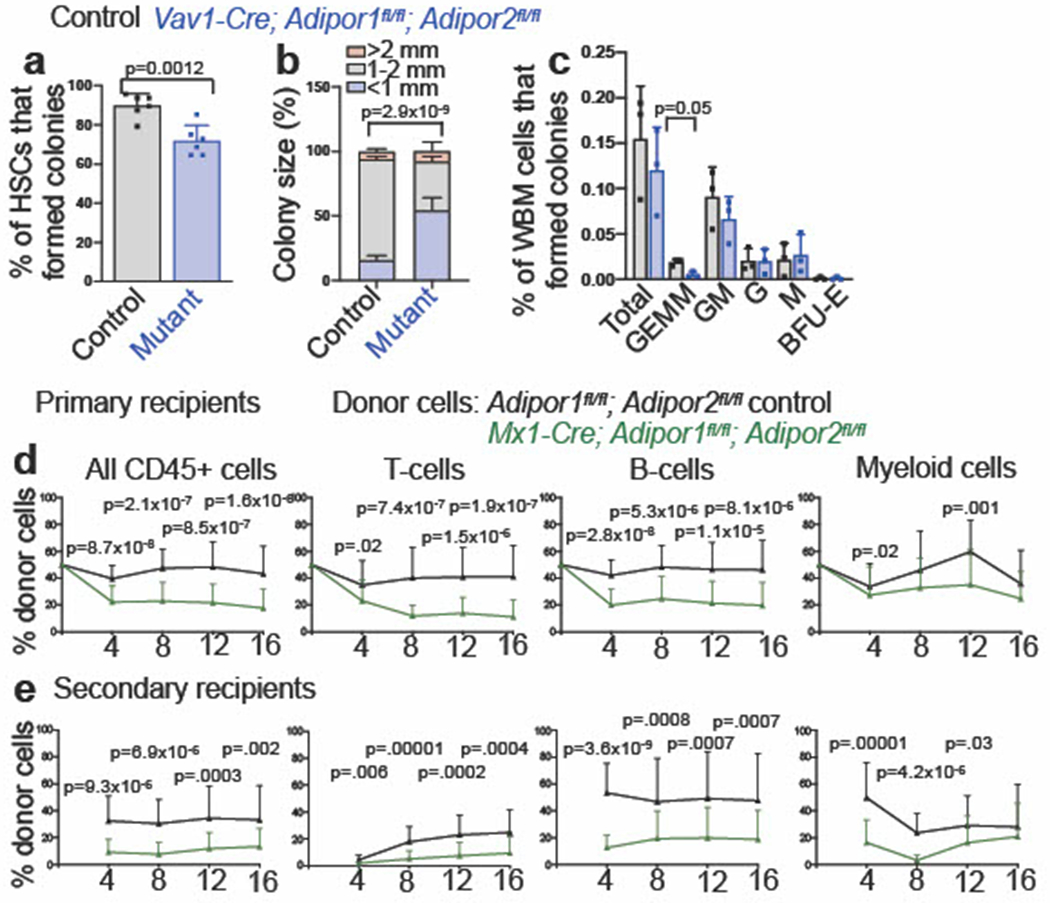
a. Donor CD45+ cells, T, B, and myeloid cells from the blood of mice competitively transplanted with donor bone marrow cells from Vav1-Cre; Adipor1fl/fl; Adipor2fl/fl (n=29 recipients) or control (n=34 recipients) mice (four donors per genotype in four independent experiments). b. Secondary recipients of bone marrow cells from the mice in (a) (n=29 recipients from eight Vav1-Cre; Adipor1fl/fl; Adipor2fl/fl donors and n=32 recipients from seven control donors in seven independent experiments). c. Tertiary recipients of bone marrow cells from the mice in (b) (n=25 recipients from six Vav1-Cre; Adipor1fl/fl; Adipor2fl/fl donors and n=20 recipients from four control donors in four independent experiments). d. The number of tertiary recipients in (c) with long term (>16 weeks) multilineage reconstitution by donor cells. e. The frequencies of donor HSCs, MPPs, HPCs, and LK cells in the bone marrow of tertiary recipients in (c) 16 weeks after transplantation (n=20 mice per genotype in three independent experiments). f. Tertiary recipients of bone marrow cells from the mice in Extended Data Fig. 3e (n=8 recipients from four Mx1-Cre; Adipor1fl/fl; Adipor2fl/fl donors and n=17 recipients from four control donors in four independent experiments). g. The number of tertiary recipients in (f) that had long term (LT; >16 weeks) multilineage reconstitution by donor T, B, and myeloid cells. h. The frequencies of donor HSCs, MPPs, HPCs, and LK cells in the bone marrow of tertiary recipients in (f) 16 weeks after transplantation (n=8 Mx1-Cre; Adipor1fl/fl; Adipor2fl/fl mice and n=12 control mice in two independent experiments). All data represent mean ± standard deviation and each dot reflects a different mouse. Statistical significance was assessed with Mann-Whitney tests (a-c, e, f, and h) followed by Holm-Sidak’s multiple comparisons adjustments (e and h), or a Fischer’s exact test (d and g). All statistical tests were two-sided. Source numerical data are in the source data files.
Consistent with reduced HSC function in the absence of the adiponectin receptors, sorted HSCs from Vav1-Cre; Adipor1fl/fl; Adipor2fl/fl mice produced fewer and smaller colonies in culture as compared to control HSCs (Extended data fig. 3a–b). Whole bone marrow cells from Vav1-Cre; Adipor1fl/fl; Adipor2fl/fl mice produced fewer granulocyte, erythrocyte, macrophage, and megakaryocyte (CFU-GEMM) colonies as compared to control bone marrow cells (Extended data fig. 3c); however, we observed no differences between Vav1-Cre; Adipor1fl/fl; Adipor2fl/fl and control bone marrow cells in the frequencies of more mature colonies, including CFU-GM, CFU-G, CFU-M, and BFU-E (Extended data fig. 3c). This suggests that HSCs were more dependent upon adiponectin receptors than restricted progenitors.
We also performed competitive transplant experiments with bone marrow cells obtained from Mx1-Cre; Adipor1fl/fl; Adipor2fl/fl mice and Adipor1fl/fl; Adipor2fl/fl controls that had been treated with polyinosine-polycytidine (pIpC) to induce Cre expression at 6 weeks of age. Again, we observed significantly lower levels of donor cell reconstitution by Mx1-Cre; Adipor1fl/fl; Adipor2fl/fl cells as compared to Adipor1fl/fl; Adipor2fl/fl controls in primary, secondary, and tertiary recipient mice (Extended data fig. 3d–e and Fig. 2f). In tertiary recipient mice, the control cells gave long-term multilineage reconstitution in 12 of 17 recipients but Mx1-Cre; Adipor1fl/fl; Adipor2fl/fl cells gave long-term multilineage reconstitution in only 1 of 8 recipients (Fig. 2g). Tertiary recipients of Mx1-Cre; Adipor1fl/fl; Adipor2fl/fl cells had significantly lower frequencies of donor HSCs, MPPs, HPCs, and LK cells as compared to recipients of control cells (Fig. 2h). This confirmed AdipoR1/R2 deficiency reduced HSC self-renewal potential.
Adiponectin receptors protect HSCs from inflammation
To assess the mechanism by which adiponectin receptors preserve HSC function, we sequenced RNA from HSCs and HPCs from Vav1-Cre; Adipor1fl/fl; Adipor2fl/fl and control bone marrow. Gene set enrichment analysis showed that four of the seven pathways that were significantly enriched (FDR<0.05 and Normalized Enrichment Score>1.5) in AdipoR1/R2 deficient as compared to control HSCs were related to interferon signaling (Fig. 3a). The other three pathways were related to cell cycle progression, consistent with the increased division of AdipoR1/R2 deficient HSCs (Fig. 1p). These results suggest that adiponectin receptors are required in hematopoietic cells to protect bone marrow HSCs from inflammation. None of these pathways, nor any other pathways, significantly differed between Vav1-Cre; Adipor1fl/fl; Adipor2fl/fl and control HPCs. Restricted progenitors, thus, did not exhibit an interferon response. This is consistent with the observation that HSCs are more sensitive to inflammatory cytokines than restricted progenitors and differentiated cells42.
Figure 3. Adiponectin receptors suppress the expression of inflammatory cytokines in bone marrow lymphocytes.
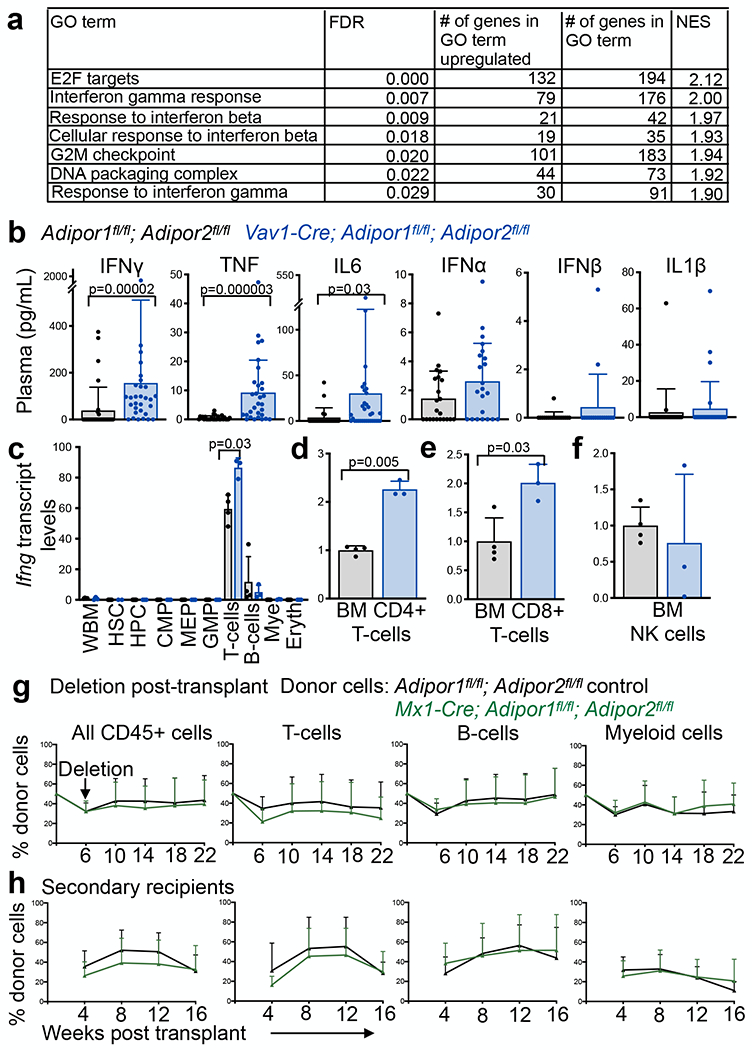
a. Gene set enrichment analysis showing significant enrichment of genes (FDR<0.05 and NES>1.5) related to interferon signaling and cell cycle progression in Vav1-Cre; Adipor1fl/fl; Adipor2fl/fl as compared to control HSCs (FDR: false discovery rate; GO: gene ontology; NES: normalized enrichment score). b. ELISA analysis of inflammatory cytokines in blood plasma from Vav1-Cre; Adipor1fl/fl; Adipor2fl/fl and control mice (blood plasma from 30 (IFNγ and TNF), 33 (IL6), 22 (IFNα), 17 (IFNβ), and 30 (Il1β) Vav1-Cre; Adipor1fl/fl; Adipor2fl/fl mice and 32 (IFNγ), 28 (TNF), 22 (IL6 and IFNα), 17 (IFNβ), and 24 (Il1β) control mice in two independent ELISAs per cytokine). c. qRT-PCR analysis of Ifng transcript levels in sorted bone marrow cells. Data are normalized to transcript levels in wildtype whole bone marrow (WBM) cells (three Vav1-Cre; Adipor1fl/fl; Adipor2fl/fl mice and four control mice in one experiment). d-f. qRT-PCR analysis of Ifng transcripts in sorted CD4+ T cells (d), CD8+ T cells (e), or NK cells (f) from the bone marrow (three Vav1-Cre; Adipor1fl/fl; Adipor2fl/fl mice and four control mice in one experiment). g. Donor CD45+ cells, T, B, and myeloid cells from the blood of mice competitively transplanted with Mx1-Cre; Adipor1fl/fl; Adipor2fl/fl or control bone marrow cells and then treated with pIpC to delete adiponectin receptors 6 weeks after transplantation (n=21 Mx1-Cre; Adipor1fl/fl; Adipor2fl/fl and n=19 control recipients with five donors per genotype in five independent experiments). h. Secondary recipients of bone marrow cells from the primary recipients in (g) (n=7 Vav1-Cre; Adipor1fl/fl; Adipor2fl/fl and n=17 control recipients from four Vav1-Cre; Adipor1fl/fl; Adipor2fl/fl and three control donors in three independent experiments). All data represent mean ± standard deviation and each dot reflects a different mouse. Statistical significance was assessed with Mann-Whitney tests (b, g, and h) followed by Holm-Sidak’s multiple comparisons adjustments (b), or Student’s t-tests (c) or Welch’s t-tests (d-f) followed by Holm-Sidak’s multiple comparisons adjustments (c-f). All statistical tests were two-sided. Source numerical data are available in the source data files.
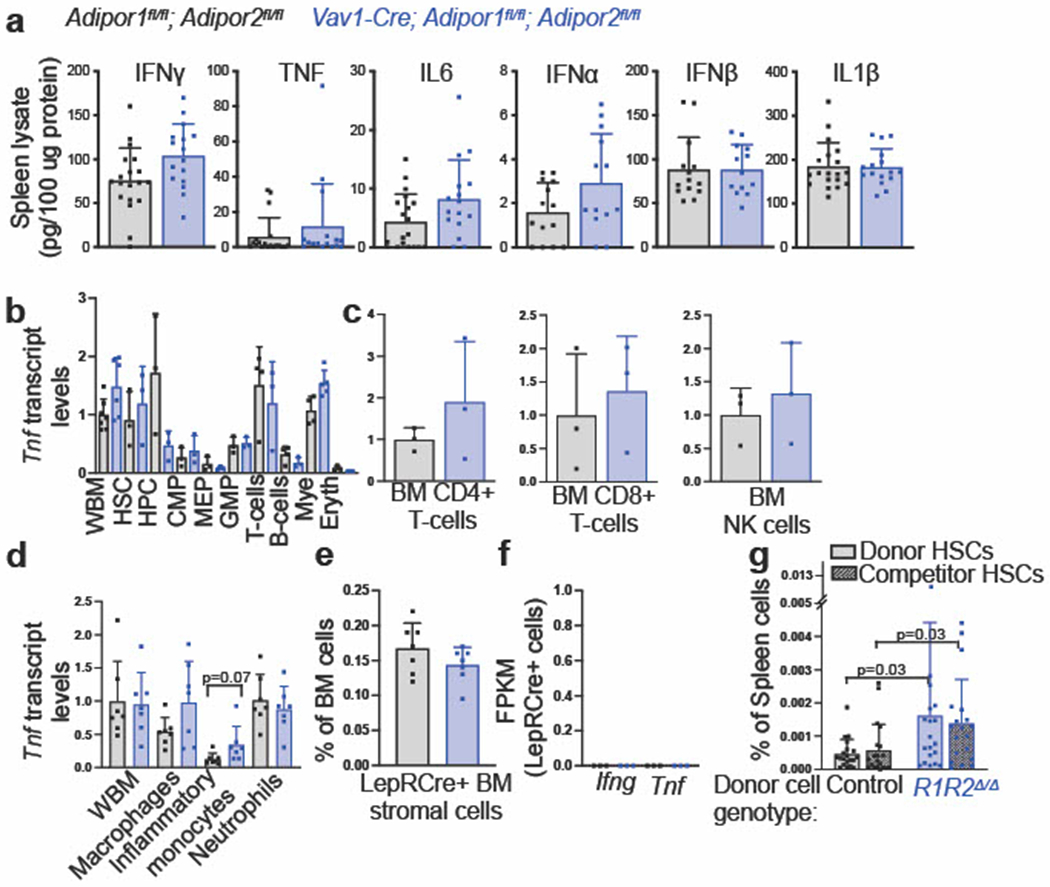
Consistent with the interferon response in AdipoR1/R2 deficient HSCs, the levels of IFNγ, TNF, and IL6 were all significantly elevated in the blood plasma of Vav1-Cre; Adipor1fl/fl; Adipor2fl/fl as compared to control mice (Fig. 3b). We did not detect significant increases in the levels of IFNα, IFNβ, or IL1β (Fig. 3b). We also did not detect significantly increased levels of inflammatory factors in spleen lysates (Extended data fig. 4a). Adiponectin receptors in hematopoietic cells thus systemically suppressed the levels of multiple pro-inflammatory cytokines.
To determine the cellular sources of IFNγ and TNF, we performed quantitative reverse transcription polymerase chain reaction on whole bone marrow cells, HSCs, restricted progenitors, and differentiated cells from Vav1-Cre; Adipor1fl/fl; Adipor2fl/fl and Adipor1fl/fl; Adipor2fl/fl bone marrow. The only cell populations in which we detected Ifng transcripts were T cells, B cells, and NK cells (Fig. 3c–f). CD4+ and CD8+ T cells were the only cells in the bone marrow in which Ifng transcripts were significantly elevated in AdipoR1/R2 deficient as compared to control mice (Fig. 3c–e). Inflammatory monocytes in the bone marrow exhibited higher levels of Tnf transcripts in AdipoR1/R2 deficient as compared to control mice (Extended data fig. 4b–d). We observed no difference in the frequency of LepR+ stromal cells in the bone marrow of AdipoR1/R2 deficient and control mice (Extended data fig. 4e) and did not detect Ifng or Tnf expression by these cells (Extended data fig. 4f). Myeloid and lymphoid cells thus increased their expression of inflammatory cytokines in the bone marrow of AdipoR1/R2 deficient mice.
Adiponectin receptors non-cell-autonomously protect HSCs
These results raised the possibility that adiponectin receptors maintain the quiescence and self-renewal potential of HSCs by acting within immune cells to suppress their production of inflammatory cytokines. If so, the reduced reconstituting activity of HSCs from Vav1-Cre; Adipor1fl/fl; Adipor2fl/fl mice may have reflected chronic exposure to elevated levels of inflammatory cytokines in the donor mice prior to transplantation. To test this, we transplanted equal numbers of Mx1-Cre; Adipor1fl/fl; Adipor2fl/fl and control bone marrow cells into irradiated mice and then administered pIpC to induce recombination six weeks after transplantation. In this experiment, if adiponectin receptors are autonomously required in HSCs, we would expect donor cell reconstitution by Mx1-Cre; Adipor1fl/fl; Adipor2fl/fl cells to decline after pIpC treatment. Conversely, if adiponectin receptors are non-autonomously required in immune cells to sustain HSC function, we would not expect any effect of post-transplant pIpC treatment on donor cell reconstitution because both donor and competitor HSCs in the recipient mice would be exposed to the same inflammatory factors. In fact, we observed no effect of post-transplant pIpC treatment on donor cell reconstitution by Mx1-Cre; Adipor1fl/fl; Adipor2fl/fl cells in either primary (Fig. 3g) or secondary recipient mice (Fig. 3h), confirming that adiponectin receptors acted non-cell-autonomously to promote HSC function.
To independently test this, we also examined the frequencies of AdipoR1/R2 deficient donor and wild-type competitor HSCs in the spleens of mice transplanted with Vav1-Cre; Adipor1fl/fl; Adipor2fl/fl and control bone marrow cells. If adiponectin receptors act cell-autonomously within HSCs to suppress mobilization and extramedullary hematopoiesis, we would expect a higher frequency of AdipoR1/R2 deficient donor HSCs as compared to wild-type competitor HSCs in the spleens of these mice. Conversely, if adiponectin receptors act non-cell-autonomously to promote HSC quiescence then we would not expect to observe any difference in the frequencies of AdipoR1/R2 deficient donor and wild-type competitor HSCs in the spleens as HSCs of both genotypes would be exposed to the same inflammatory factors. In fact, we observed no difference in the frequency of AdipoR1/R2 deficient donor as compared to wild-type competitor HSCs in the spleens (Extended data fig. 4g). When we transplanted control donor HSCs instead of AdipoR1/R2 deficient donor HSCs, we observed lower overall frequencies of HSCs in the spleen, confirming that AdipoR1/R2 deficient cells promoted HSC mobilization in these experiments (Extended data fig. 4g). These results further demonstrate that adiponectin receptors act non-cell-autonomously to suppress mobilization and extramedullary hematopoiesis.
IFN and TNF impair HSC function in the absence of AdipoR1/R2
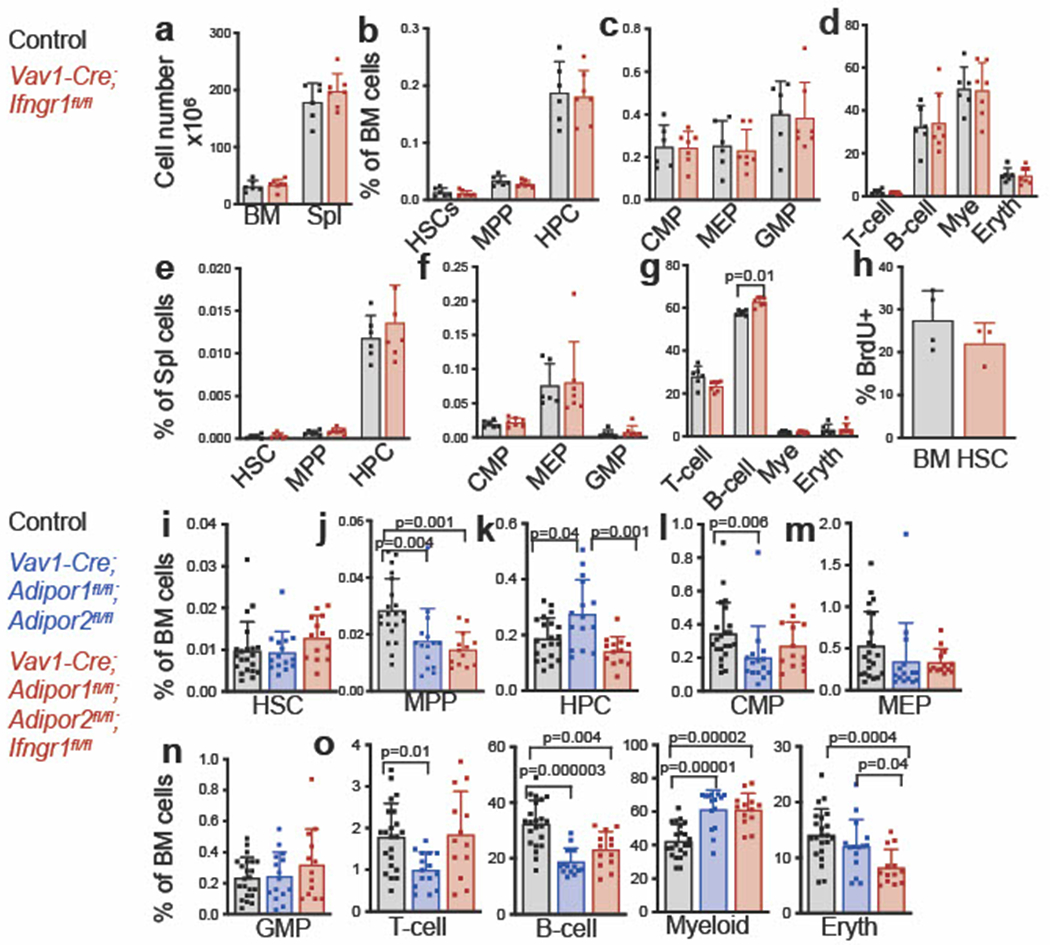
To test if IFNγ contributed to the defects in HSC function in Vav1-Cre; Adipor1fl/fl; Adipor2fl/fl mice we tested if we could restore normal hematopoiesis by deleting interferon γ receptor 1 (Ifngr1) from hematopoietic cells. Consistent with a prior study33, Ifngr1 deficiency alone had no effect on bone marrow or spleen cellularity (Extended data fig. 5a) or on the frequencies of HSCs, MPPs, restricted progenitors, or differentiated hematopoietic cells in the bone marrow (Extended data fig. 5b–d) or spleen (Extended data fig. 5e–g). Most hematopoietic parameters in the bone marrow of Vav1-Cre; Adipor1fl/fl; Adipor2fl/fl; Ifngr1fl/fl and Vav1-Cre; Adipor1fl/fl; Adipor2fl/fl mice did not significantly differ (Extended data fig. 5i–o); however, Ifngr1 deficiency did significantly rescue the increased frequency of HPCs in the bone marrow of Vav1-Cre; Adipor1fl/fl; Adipor2fl/fl mice (Extended data fig. 5k) as well as the frequencies of MPPs, HPCs, Mac-1+Gr-1+ myeloid cells, and CD71+Ter119+ erythroid cells in the spleens (Fig. 4c–h). We observed trends toward reduced splenic cellularity (Fig. 4a) and HSC frequency (Fig. 4b) in Vav1-Cre; Adipor1fl/fl; Adipor2fl/fl; Ifngr1fl/fl as compared to Vav1-Cre; Adipor1fl/fl; Adipor2fl/fl mice. Ifngr1 deficiency thus partially rescued multiple hematopoietic changes in Vav1-Cre; Adipor1fl/fl; Adipor2fl/fl mice.
Figure 4. Adiponectin receptors promote HSC function by reducing IFNγ signaling.
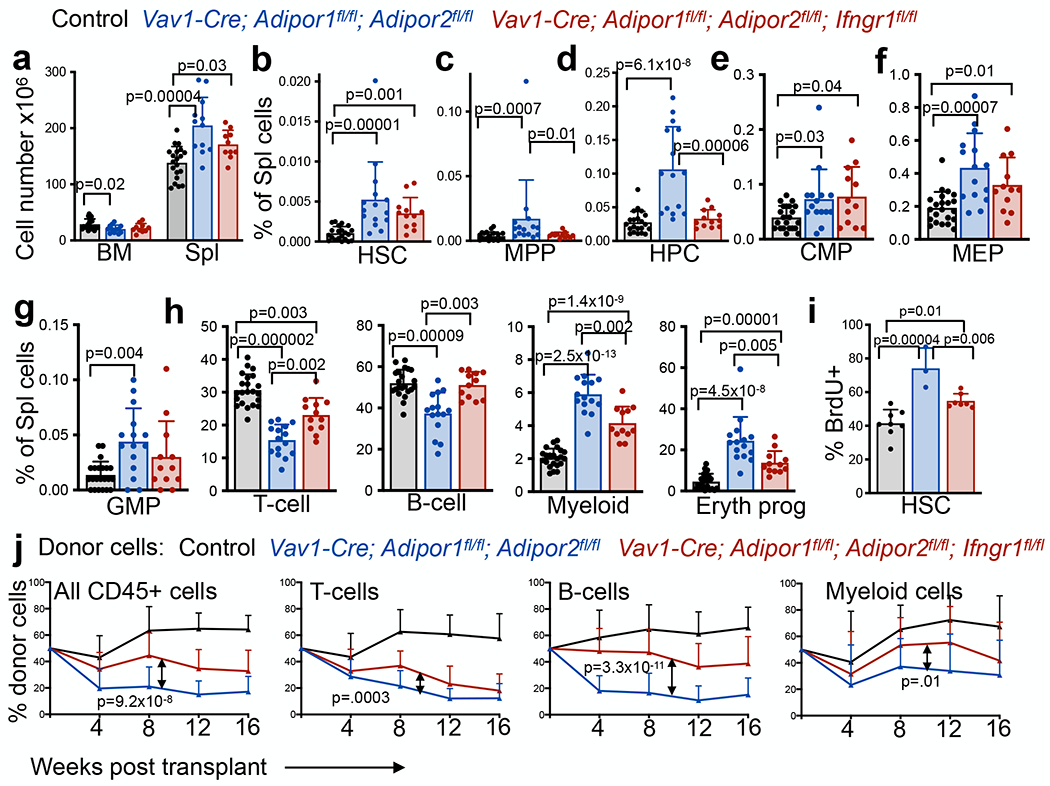
a. The number of cells in one femur and one tibia or in the spleen of Vav1-Cre; Adipor1fl/fl; Adipor2fl/fl, Vav1-Cre; Adipor1fl/fl; Adipor2fl/fl; Ifngrfl/f or control mice (n=12 Vav1-Cre; Adipor1fl/fl; Adipor2fl/fl mice, n=10 Vav1-Cre; Adipor1fl/fl; Adipor2fl/fl; Ifngrfl/f mice and n=20 control mice in five independent experiments). b-h. The frequencies of HSCs (b), MPPs (c), HPCs (d), CMPs (e), MEPs (f), GMPs (g), or differentiated T, B, myeloid, and erythroid cells (h) in the spleen of Vav1-Cre; Adipor1fl/fl; Adipor2fl/fl, or Vav1-Cre; Adipor1fl/fl; Adipor2fl/fl; Ifngrfl/fl or control mice (n=15 Vav1-Cre; Adipor1fl/fl; Adipor2fl/fl mice, n=12 Vav1-Cre; Adipor1fl/fl; Adipor2fl/fl; Ifngrfl/f mice and n=20 (b-d) or n=21(e-h) control mice in five independent experiments). i. The percentage of HSCs that incorporated a 72 hour pulse of BrdU (n=3 Vav1-Cre; Adipor1fl/fl; Adipor2fl/fl mice, n=7 Vav1-Cre; Adipor1fl/fl; Adipor2fl/fl; Ifngrfl/f mice and n=8 control mice in two independent experiments). j. Donor CD45+, T, B, and myeloid cells from the blood of mice competitively transplanted with Vav1-Cre; Adipor1fl/fl; Adipor2fl/fl (n=19 recipients from five donors), Vav1-Cre; Adipor1fl/fl; Adipor2fl/fl; Ifngrfl/fl (n=18 recipients from five donors), or control donor bone marrow cells (n=19 recipients from four donors) in four independent experiments. All data represent mean ± standard deviation and each dot reflects a different mouse. Statistical significance was assessed using one-way ANOVAs followed by Tukey’s multiple comparisons adjustments (a, d-f, h, and i), Kruskal-Wallis tests followed by Dunn’s multiple comparisons adjustments (b, g, and h), Welch’s one-way ANOVAs followed by Dunnett’s T3 multiple comparisons adjustments (c and h), or nparLD tests followed by FDR multiple comparisons adjustments (j). All statistical tests were two-sided. Source numerical data are available in the source data files.
Ifngr1 deficiency, by itself, did not affect HSC proliferation (Extended data fig. 5h) but partially rescued the increased division of Vav1-Cre; Adipor1fl/fl; Adipor2fl/fl as compared to control HSCs (Fig. 4i). Ifngr1 deficiency also partially rescued the reconstituting capacity of Vav1-Cre; Adipor1fl/fl; Adipor2fl/fl bone marrow cells upon competitive transplantation into irradiated mice (Fig. 4j). The defects in HSC function in AdipoR1/R2 deficient mice were thus caused partly by increased IFNγ receptor signaling.
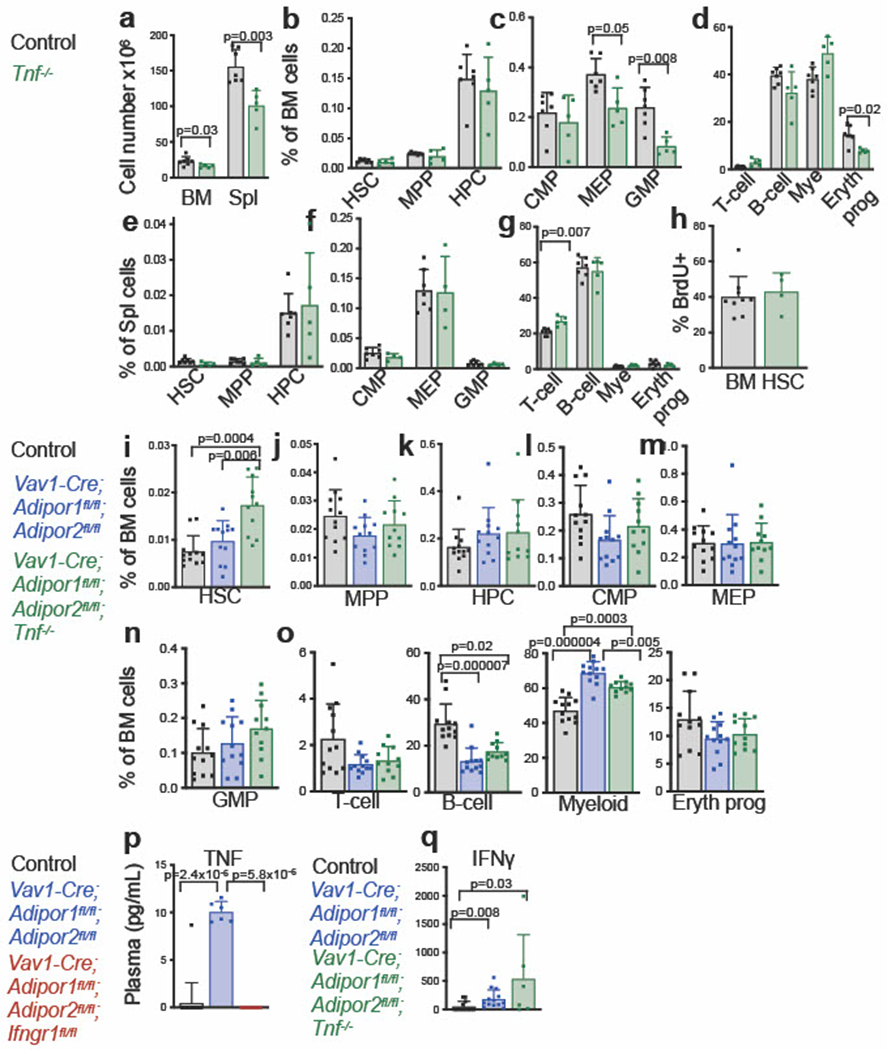
We also tested whether TNF contributed to the hematopoietic changes in Vav1-Cre; Adipor1fl/fl; Adipor2fl/fl mice. TNF has both positive28,43 and negative44,45 effects on HSC function. We found that, by itself, Tnf deficiency had limited effects on bone marrow and spleen hematopoiesis (Extended data fig. 6a–g). The frequencies of most HSC and restricted progenitor populations in the bone marrow and spleen were unaffected, but Tnf deficiency modestly reduced bone marrow and spleen cellularity (Extended data fig. 6a) as well as the frequencies of MEPs, GMPs, and erythroid progenitors in the bone marrow (Extended data fig. 6c–d). Most hematopoietic parameters in the bone marrow of Vav1-Cre; Adipor1fl/fl; Adipor2fl/fl; Tnf-−/− and Vav1-Cre; Adipor1fl/fl; Adipor2fl/fl mice did not significantly differ (Extended data fig. 6i–o). However, Tnf deficiency significantly rescued most of the changes in splenic hematopoiesis in AdipoR1/R2 deficient as compared to control mice, including the increases in spleen cellularity (Fig. 5a), and the frequencies of MPPs, HPCs, CMPs, MEPs, Mac-1+Gr-1+ myeloid cells, and CD71+Ter119+ erythroid cells (Fig. 5c–h). We observed a trend toward reduced HSC frequency in the spleen (Fig. 5b). Tnf deficiency also significantly rescued the decline in B cell frequency in the spleens of AdipoR1/R2 deficient as compared to control mice (Fig. 5h). Elevated TNF levels thus contributed to the induction of extramedullary hematopoiesis in AdipoR1/R2 deficient mice.
Figure 5. Adiponectin receptors promote HSC function by reducing TNF signaling.
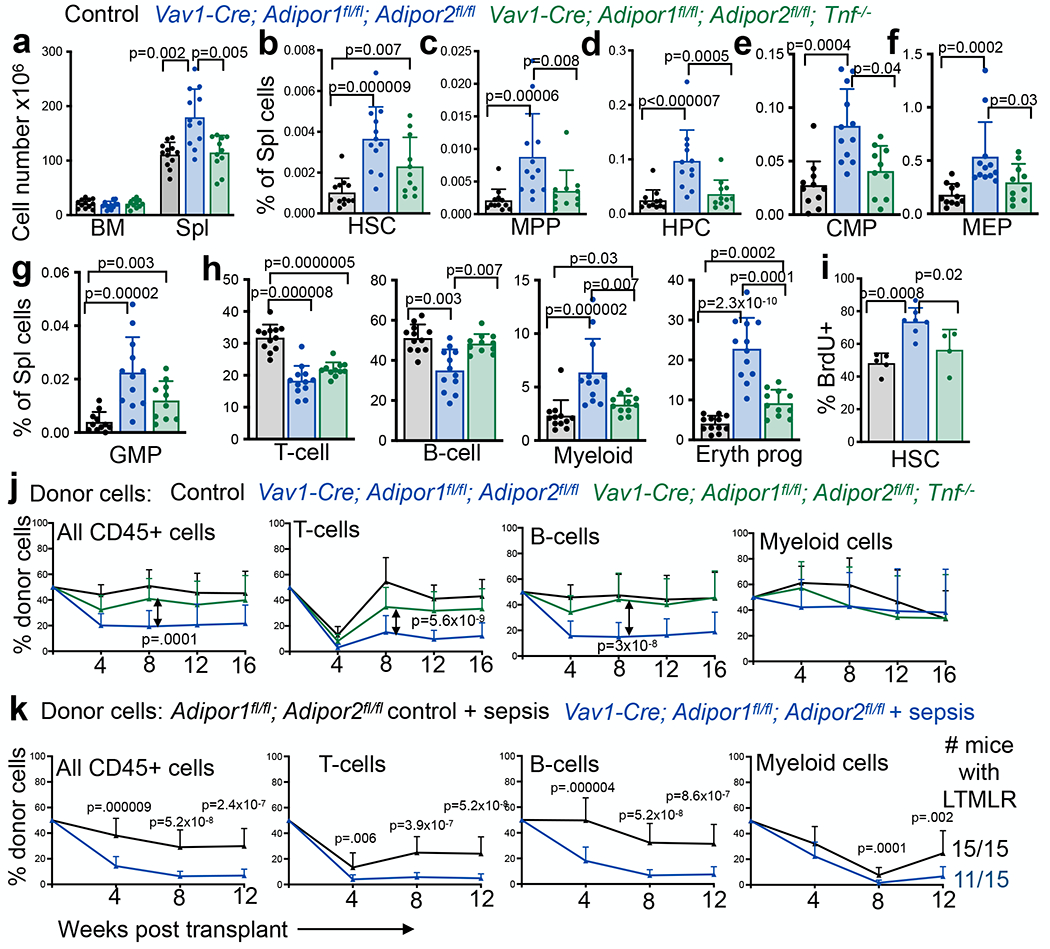
a. The number of cells in one femur and one tibia or in the spleen of control, Vav1-Cre; Adipor1fl/fl; Adipor2fl/fl, and Vav1-Cre; Adipor1fl/fl; Adipor2fl/fl; Tnf−/− mice (n=12 Vav1-Cre; Adipor1fl/fl; Adipor2fl/fl mice, n=11 Vav1-Cre; Adipor1fl/fl; Adipor2fl/fl; Tnf−/− mice and n=12 control mice in five independent experiments). b-h. The frequencies of HSCs (b), MPPs (c), HPCs (d), CMPs (e), MEPs (f), GMPs (g), and differentiated T, B, myeloid, and erythroid cells (h) in the spleen of control, Vav1-Cre; Adipor1fl/fl; Adipor2fl/fl, and Vav1-Cre; Adipor1fl/fl; Adipor2fl/fl; Tnf−/− mice (n=12 Vav1-Cre; Adipor1fl/fl; Adipor2fl/fl mice, n=11 (b-d and h) or n=10 (e-g) Vav1-Cre; Adipor1fl/fl; Adipor2fl/fl; Tnf−/− mice and n=12 (b-d and h) or n=11(e-g) control mice in five independent experiments). i. The percentage of HSCs that incorporated a 72-hour pulse of BrdU (n=7 Vav1-Cre; Adipor1fl/fl; Adipor2fl/fl mice, n=4 Vav1-Cre; Adipor1fl/fl; Adipor2fl/fl; Tnf−/− mice and n=5 control mice in two independent experiments). j. Donor CD45+, T, B, and myeloid from the blood of mice competitively transplanted with Vav1-Cre; Adipor1fl/fl; Adipor2fl/fl (n=15 recipients), Vav1-Cre; Adipor1fl/fl; Adipor2fl/fl; Tnf−/− (n=18 recipients) or control (n=17 recipients) donor bone marrow cells (four donors per genotype in four independent experiments). k. Donor CD45+ cells, T, B, and myeloid cells from the blood of mice competitively transplanted with bone marrow cells from 8–10 week-old septic Vav1-Cre; Adipor1fl/fl; Adipor2fl/fl or septic control donor mice and the number of mice with long term multilineage reconstitution (LTMLR) by donor cells (n=3 donors per genotype transplanted into 15 recipients per genotype in three independent experiments). All data represent mean ± standard deviation and each dot reflects a different mouse. Statistical significance was assessed using Welch’s one-way ANOVAs followed by Dunnett’s T3 multiple comparisons adjustments (a and h), one-way ANOVAs followed by Tukey’s multiple comparisons adjustments (b-d and f-i), Kruskal-Wallis tests followed by Dunn’s multiple comparisons adjustments (e), nparLD tests followed by FDR multiple comparisons adjustments (j), or Mann-Whitney tests (k). All statistical tests were two-sided. Source numerical data are available in the source data files.
By itself, Tnf deficiency had no effect on the rate of HSC cell division (Extended data fig. 6h) but Tnf deficiency partially rescued the increased division of AdipoR1/R2 deficient HSCs (Fig. 5i). Tnf deficiency also partially rescued the reconstituting capacity of AdipoR1/R2 deficient bone marrow cells upon competitive transplantation into irradiated mice (Fig. 5j). The defects in bone marrow HSC function in AdipoR1/R2 deficient mice were thus caused partly by increased TNF levels.
Since IFNγ and TFN regulate each other’s expression46–48, we tested whether there is cross regulation of these cytokines in AdipoR1/R2 deficient mice. We observed a significant reduction in TNF levels in Vav1-Cre; Adipor1fl/fl; Adipor2fl/fl; Ifngr1fl/fl as compared to Vav1-Cre; Adipor1fl/fl; Adipor2fl/fl mice (Extended Data Fig. 6p). This indicates that IFNγ signaling promotes TNF expression in AdipoR1/R2 deficient mice. However, given that Tnf deficiency gave a stronger rescue than Ifngr1 deficiency of some of the extramedullary hematopoiesis phenotypes in AdipoR1/R2 deficient mice, the evidence suggests there may be IFNγ-dependent as well as IFNγ-independent effects of TNF.
We also performed IFNγ ELISAs on the serum of control, Vav1-Cre; Adipor1fl/fl; Adipor2fl/fl, and Vav1-Cre; Adipor1fl/fl; Adipor2fl/fl; Tnf-−/− mice. We found no statistically significant differences in IFNγ levels between AdipoR1/R2/Tnf deficient and AdipoR1/R2 deficient mice, though there was a trend toward increased IFNγ levels in a subset of the AdipoR1/R2/Tnf deficient mice (Extended Data Fig. 6q). This suggested that TNF negatively regulated IFNγ levels in certain circumstances, as has been reported48.
Our results are thus consistent with the known cross-talk between these inflammatory cytokines. Beyond TNF and IFNγ, additional pro-inflammatory cytokines were also elevated in AdipoR1/R2 deficient mice, including IL6 (Fig. 3b). Therefore, multiple inflammatory pathways were activated in the absence of adiponectin receptors. These pathways likely make partially overlapping contributions to the phenotypes observed in AdipoR1/R2 deficient mice.
Adiponectin receptors protect HSCs from pathogen infection
To test if pathogen infection accelerates the loss of HSC self-renewal potential in the absence of adiponectin receptors, we gave 8-10 week old Vav1-Cre; Adipor1fl/fl; Adipor2fl/fl or control mice sepsis by intraperitoneally injecting cecal contents from wildtype mice49. Forty-eight hours later we competitively transplanted bone marrow cells from septic AdipR1/R2 deficient or control donor mice into irradiated recipients. AdipoR1/R2 deficient bone marrow cells from septic donor mice gave significantly lower levels of reconstitution than bone marrow cells from septic control mice (Fig. 5k). All recipients of septic control cells were long-term multilineage reconstituted by donor cells (15/15) whereas only some recipients of septic AdipoR1/R2 deficient cells were long-term multilineage reconstituted (11/15) (Fig. 5k). In contrast, all (29/29) recipients of AdipoR1/R2 deficient bone marrow cells from young non-septic donors were long term multilineage reconstituted (Fig. 2a). This suggests that acute pathogen infection accelerates the loss of HSC self-renewal potential in the absence of adiponectin receptors.
Adiponectin receptors sustain HSCs during aging
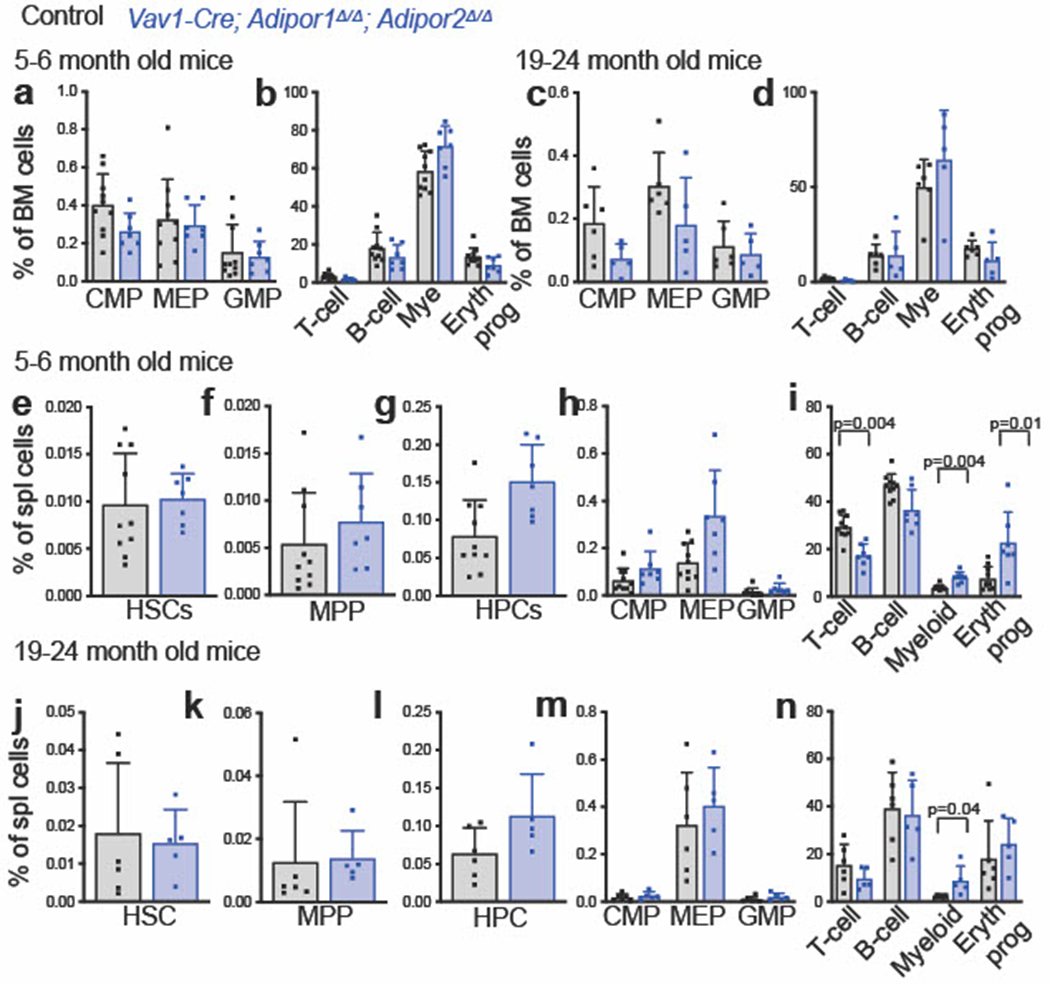
To test if adiponectin receptors are required to preserve HSC function during aging, we examined 5-6 month old and 19-24 month old mice. Bone marrow and spleen cellularity did not significantly differ between Vav1-Cre; Adipor1fl/fl; Adipor2fl/fl mice and Adipor1fl/fl; Adipor2fl/fl controls in either 5-6 month old (Fig. 6a) or 19-24 month-old (Fig. 6b) mice. In contrast to 2 month old mice, in which HSC frequency was normal in the bone marrow (Fig. 1f), HSCs were depleted from the bone marrow of Vav1-Cre; Adipor1fl/fl; Adipor2fl/fl mice as compared to controls at 5-6 months (Fig. 6c) and 19-24 months (Fig. 6d) of age. The rate of HSC division was substantially increased in the bone marrow of 19-24 month old Vav1-Cre; Adipor1fl/fl; Adipor2fl/fl mice as compared to controls (Fig. 6e). HSCs appeared to be more dependent upon adiponectin receptor function than restricted hematopoietic progenitors as MPPs, HPCs, CMPs, MEPs, GMPs, and differentiated hematopoietic cells did not significantly differ between Vav1-Cre; Adipor1fl/fl; Adipor2fl/fl mice and controls in either 5-6 month old (Fig. 6f–g and Extended Data Fig. 7a–b) or 19-24 month old (Fig. 6h–i and Extended Data Fig. 7c–d) mice.
Figure 6. Adiponectin receptors are required to sustain HSCs during aging.
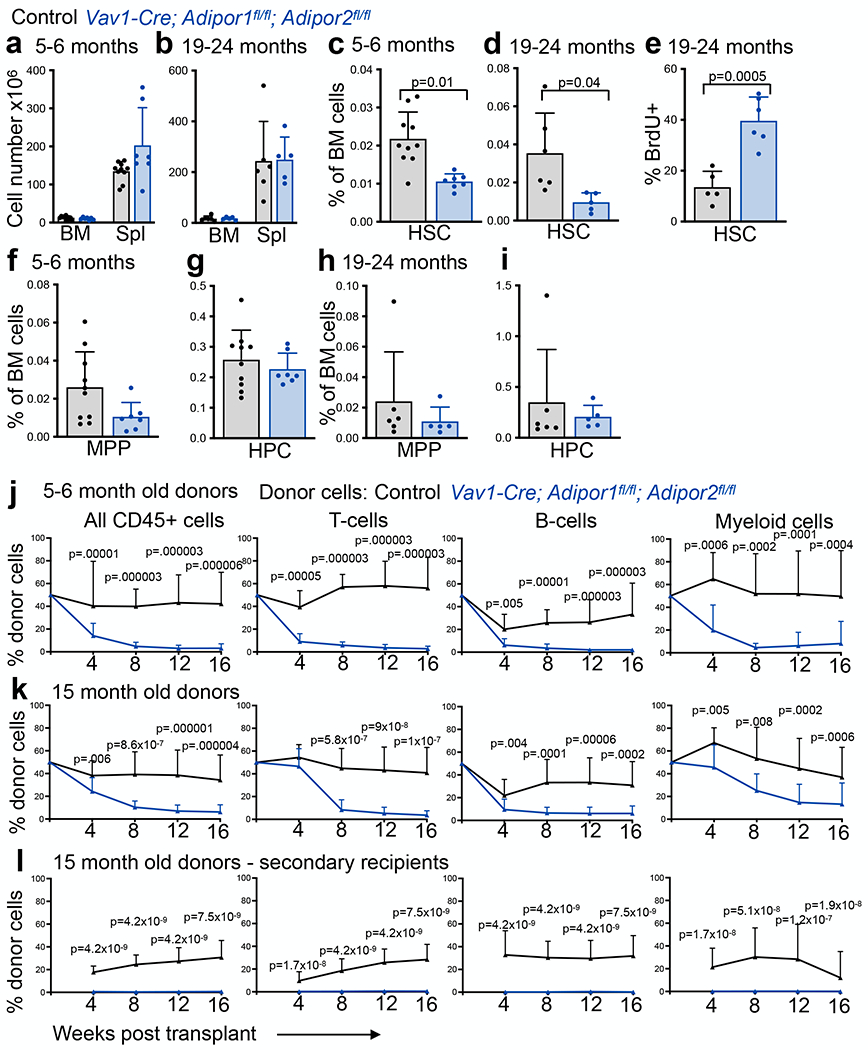
a-b. The number of cells in one femur and one tibia or in the spleen of 5–6-month-old (a) or 19–24-month-old (b) Vav1-Cre; Adipor1fl/fl; Adipor2fl/fl and Adipor1fl/fl; Adipor2fl/fl control mice (n=7 (a) or n=5 (b) Vav1-Cre; Adipor1fl/fl; Adipor2fl/fl mice and n=10 (a) or n=6 (b) control mice in two independent experiments for each age group). c-d. The frequencies of bone marrow HSCs in 5–6-month-old (c) and 19–24-month-old (d) Vav1-Cre; Adipor1fl/fl; Adipor2fl/fl and Adipor1fl/fl; Adipor2fl/fl control mice (n=7 (c) or n=5 (d) Vav1-Cre; Adipor1fl/fl; Adipor2fl/fl mice and n=10 (c) or n=6 (d) control mice in two independent experiments for each age group). e. The percentage of HSCs from 19–24 month old mice that incorporated a 72-hour pulse of BrdU (n=6 Vav1-Cre; Adipor1fl/fl; Adipor2fl/fl mice and n=5 control mice in two independent experiments). f-i. The frequencies of MPPs (f, h) and HPCs (g, i) in the bone marrow from 5–6 month old (f-g) or 19–24 month old (h-i) Vav1-Cre; Adipor1fl/fl; Adipor2fl/fl and Adipor1fl/fl; Adipor2fl/fl control mice (n=7 (f-g) or n=5 (h-i) Vav1-Cre; Adipor1fl/fl; Adipor2fl/fl mice and n=10 (f-g) or n=6 (h-i) control mice in two independent experiments for each age group). j. Donor cells from the blood of mice competitively transplanted with bone marrow cells from 5–6 month-old Vav1-Cre; Adipor1fl/fl; Adipor2fl/fl (n=11 recipients) or control (n=11 recipients) mice (three donors per genotype in three independent experiments). k. Donor cells from the blood of mice competitively transplanted with bone marrow cells from 15 month old Vav1-Cre; Adipor1fl/fl; Adipor2fl/fl (n=15 recipients) or control (n=14 recipients) mice (three donors per genotype in three independent experiments). l. Secondary recipients of bone marrow cells from the primary recipients in (k) (n=17 recipients from four Vav1-Cre; Adipor1fl/fl; Adipor2fl/fl donors and n=14 recipients from three control donors in three independent experiments). All data represent mean ± standard deviation and each dot reflects a different mouse. Statistical significance was assessed using matched samples two-way ANOVAs followed by Sidak’s multiple comparisons adjustments (a-b), Mann-Whitney tests (c-d, and f-l) followed by Holm-Sidak’s multiple comparisons adjustments (c-d and f-i), or a Student’s t-test (e). All statistical tests were two-sided. Source numerical data are available in the source data files.
We observed no significant differences in the spleens of Vav1-Cre; Adipor1fl/fl; Adipor2fl/fl mice versus Adipor1fl/fl; Adipor2fl/fl controls in terms of the frequencies of HSCs, MPPs, HPCs, CMPs, MEPs, or GMPs at either 5-6 months (Extended Data Fig. 7e–h) or 19-24 months (Extended Data Fig. 7j–m) of age. As in 2 month old mice, the spleens of Vav1-Cre; Adipor1fl/fl; Adipor2fl/fl mice continued to have higher frequencies of myeloid and erythroid cells and a lower frequency of T cells as compared to controls at 5-6 months of age (Extended Data Fig. 7i) and a higher frequency of myeloid cells at 19-24 months of age (Extended Data Fig. 7n).
To test if adiponectin receptors are required to sustain HSC function during aging we performed competitive transplants into irradiated recipients. Bone marrow cells from 5-6 month old (Fig. 6j) and 15 month old (Fig. 6k) Vav1-Cre; Adipor1fl/fl; Adipor2fl/fl mice gave significantly lower levels of donor cell reconstitution in all lineages as compared to bone marrow cells from age-matched controls. We performed secondary transplants of bone marrow cells from primary recipients of 15 month old bone marrow and found that while control cells gave long-term multilineage reconstitution in most (9 of 14) secondary recipients, AdipoR1/R2 deficient donor cells did not give long-term multilineage reconstitution in any (0 of 17) secondary recipients (Fig. 6l). The self-renewal potential of HSCs, therefore, declined at an accelerated rate during adulthood in the absence of adiponectin receptors in hematopoietic cells.
Discussion
Adiponectin receptors are, thus, non-cell-autonomously required to preserve the frequency, quiescence, and self-renewal potential of HSCs throughout adulthood. They act by suppressing the production of inflammatory cytokines, including TNF and IFNγ, by immune cells. In the absence of adiponectin receptors, the levels of these inflammatory cytokines increase and drive HSCs into cycle, chronically activating them, reducing their self-renewal potential, and depleting HSCs during aging. Adiponectin receptors were not required for the maintenance or function of restricted progenitors in the bone marrow, suggesting that HSCs were preferentially sensitive to this inflammatory environment. HSCs are known to be more sensitive to inflammatory cytokines than restricted hematopoietic progenitors, a mechanism that may protect HSCs from viral infection42. Our data suggest that the cost of this hyper-sensitivity is increased dependence upon adiponectin receptors in immune cells to protect HSCs from inflammation.
While we found that adiponectin receptors were required to maintain HSC quiescence and HSC frequency, deficiency for the ligand, adiponectin, does not affect HSC quiescence or HSC frequency in specific pathogen free mice17. Moreover, adiponectin modulates HSC function after myeloablation or bacterial infection by promoting the proliferation of HSCs8,9 and restricted progenitors17, rather than promoting quiescence. The differences in phenotype between adiponectin receptor and adiponectin mutant mice might reflect ligand-independent signaling by the adiponectin receptors18–20 or the influence of a different ligand20. It is also possible that increased HSC division or impaired HSC function would be observed in adiponectin deficient mice if these mice were aged or housed in conventional colonies that are not pathogen free. Either way, our data make the broader point that inflammation is actively suppressed in the adult hematopoietic system and that this is necessary for the maintenance and quiescence of HSCs throughout adulthood.
METHODS
Mice
All mouse experiments complied with all relevant ethical regulations and were performed according to protocols approved by the Institutional Animal Care and Use Committees at University of Texas Southwestern Medical Center (protocols 2019-102632-G and 102427). Mx1-Cre50, Vav1-Cre51, Ifngr1fl/fl (ref52), and TNF−/− mice were obtained from the Jackson Laboratory. Adipor1fl/fl and Adipor2 fl/fl mice53 were obtained from Gerard Karsenty. All mice were backcrossed at least 4 times onto a C57BL/Ka (CD45.2) background. To induce Cre expression, 6 week old Mx1-Cre; Adipor1fl/fl; Adipor2 fl/fl mice were injected with five intraperitoneal injections of 20 μg poly(I:C) (in PBS) every other day (GE Healthcare). Mx1-Cre mice were analyzed at least 2 weeks after the last pIpC dose. All other mice were analyzed between 7 and 11 weeks of age unless otherwise indicated. Male and female mice were used in all studies. C57BL/Ka-Thy-1.1/ C57BL/Ka-Thy-1.2 (CD45.2/CD45.2) mice or C57BL/Ka-Thy-1.2 (CD45.1) mice were used as recipients or as a source of competitor bone marrow cells in transplantation experiments. To induce sepsis, 8-10 week old mice were intraperitonially injected with 15 mg of cecal contents from wildtype mice and bone marrow cells were collected 48 hours later for competitive transplantation into irradiated recipients49. Mice were housed at the Animal Resource Center at the University of Texas Southwestern Medical Center in AAALAC-accredited, specific-pathogen-free animal care facilities under a 12 h:12 h light:dark cycle with a temperature of 18–24 °C and humidity of 35–60%.
Primary cell culture
To assess the frequencies of colony forming units, 1.5x10⁴ whole bone marrow cells were plated per well in Methocult GM M3434 medium supplemented with 10 ng/mL of TPO and 1x penicillin/streptomycin in six well plates (3 wells per sample). Colonies were counted after 10-12 days using an inverted microscope. To assess the colony-forming capacity of HSCs, individual HSCs were sorted by flow cytometry, one cell per well, into 96 well plates containing Methocult GM M3434 medium supplemented with 10 ng/mL of TPO and 1x penicillin/streptomycin. HSC colonies were counted and the colony diameter was measured after 10-12 days using an inverted microscope.
Flow cytometric analysis and sorting of hematopoietic cells
Bone marrow was flushed from one tibia and one femur using staining medium (Ca2+ and Mg2+ -free HBSS supplemented with 2% heat inactivated bovine serum). Spleens and thymuses were mechanically dissociated by crushing them between two glass slides. The cells were dissociated into a single cell suspension by gently passing through a 25-gauge needle and then filtering through 70-μm nylon mesh. Cells were counted, and stained with antibodies by incubating cell suspensions on ice for 30 minutes. For analysis of HSCs, cells were stained with fluorophore-conjugated antibodies against lineage markers (CD2 (RM2-5, Tonbo #35-0021), CD3 (17A2, Biolegend #100204), CD5 (53-7.3, Biolegend #100606), CD8a (53-6.7, Tonbo #35-0081), Gr1 (RB6-8C5, Biolegend #108406), Ter119 (TER-119, Biolegend #116206) and B220 (RA3-6B2, Biolegend #103206)), c-kit (2B8, Thermo #47-1171-82), Sca1 (D7, Thermo #45-5981-82), CD150 (TC15-12F12.2, Biolegend #115904), and CD48 (HM48-1, Thermo #17-0481-82). For analysis of restricted progenitors, cells were stained with fluorophore-conjugated antibodies against lineage markers, c-kit (2B8, Thermo #47-1171-82), Sca1 (D7, Biolegend #122514), CD16/32 (93, Thermo #56-0161-82), CD34 (RAM34, Thermo #11-0341-82), and CD135 (A2F10, Biolegend #135312). For analysis of differentiated cells, cells were stained with fluorophore-conjugated antibodies against Mac-1 (M1/70, Thermo #47-0112-82), Gr1 (RB6-8C5, Tonbo #60-5931), B220 (RA3-6B2, Tonbo #65-0452), CD3 (17A2, Biolegend #100206), Ter119 (TER-119, Tonbo #20-5921) and CD71 (R17217, Thermo #11-0711-82). Cells were analyzed using a FACS Canto RUO (BD Biosciences), a FACSAria II (BD Biosciences) or a FACSAria Fusion (BD Biosciences) cytometer. Dead cells were identified and gated out of all analyses by including 1 μg/mL 4′,6-diamidino-2-phenylindole (DAPI) or propidium iodide in the staining medium used to resuspend cells for flow cytometry. Flow cytometry data were analyzed using Flowjo (BD Biosciences). The markers used to identify each cell population in this study are summarized in Supplementary Table 1 and the gates used to identify these populations by flow cytometry are shown in Extended Data Figure 2. All antibodies were used at 1:400 dilution.
To sort HSCs, bone marrow cells were obtained from tibias, femurs, pelvises, and spines, crushed using a mortar and pestle. The bone marrow cells were then gently pipetted and filtered, as above, to obtain a single cell suspension. Cells were stained with APC-efluor780 conjugated anti-c-kit antibody (2B8, Thermo #47-1171-82) and c-kit+ cells were enriched using anti-APC paramagnetic microbeads (Miltenyi Biotec). Cells were then stained with fluorophore-conjugated antibodies against lineage markers, Sca1 (D7, Thermo #45-5981-82), c-kit (2B8, Thermo #47-1171-82), CD48 (HM48-1, Biolegend #103426), and CD150 (TC15-12F12.2, Biolegend #115904). To sort NK cells and T-cells, cells were stained with antibodies against CD3 (17A2, Biolegend #100204), CD4 (GK1.5, Biolegend #100422), CD8 (53-6.7, Tonbo #50-0081), and NK1.1 (PK136, Tonbo #20-5941). To sort myeloid cell subsets, cells were stained with antibodies against Mac-1 (M1/70, Thermo #47-0112-82), Ly6c (HK1.4, Biolegend #128024), Ly6g (1A8, Tonbo #20-1276), CD115 (AFS98, Biolegend #135526), and F4/80 (BM8, Biolegend #123110). Cells were isolated by two successive rounds of sorting to ensure purity using a FACSAria II or a FACSAria Fusion cytometer. For blood analysis, 100-300 μl of blood was collected from the tail vein or from the heart after euthanasia and mixed with 10μl of 500mM EDTA to prevent clotting. White blood cell, red blood cell, and platelet counts were determined using a Hemavet HV950 (Drew Scientific).
For flow cytometric analysis and sorting of bone marrow stromal cells, bone marrow was flushed from the diaphysis of one femur and one tibia with digestion buffer (HBSS with calcium and magnesium (Gibco) containing type I collagenase (3mg/ml, Worthington), dispase II (4mg/ml, Sigma-Aldrich) and DNase I (1mg/ml, Roche)). The metaphysis of each bone was crushed in digestion buffer to release bone marrow and stromal cells. Bone marrow cells from the diaphysis and metaphysis were subjected to two rounds of enzymatic digestion at 37°C for 15 min each54. The cells were resuspended in staining medium (HBSS + 2% fetal bovine serum) to stop digestion. Samples were stained with fluorophore-conjugated antibodies against LepR (BAF497, Thermo #BAF497) at a 1:100 dilution for 90 minutes on ice, followed by staining with antibodies against CD45 (30-F11, Tonbo #20-0451) at a 1:200 dilution, TER119 (TER-119, Tonbo #20-5921) at a 1:200 dilution, CD144 (BV13, eBioscience #50-1441-82) at a 1:100 dilution, and Streptavidin-Brilliant Violet 421 at 1:500 dilution for 20 minutes on ice. Cells were analyzed or sorted using a FACSAria flow cytometer (BD Biosciences). Dead cells were gated out of all analyses by including propidium iodide in the staining medium.
Competitive reconstitution assays
Recipient mice (CD45.1/CD45.2 or CD45.1) were irradiated using an XRAD 320 X-ray irradiator (Precision X-Ray Inc.) with two doses of 540 rad delivered at least 3h apart. For bone marrow transplantation, 3x10⁵ bone marrow cells from donor (CD45.2) and competitor mice (CD45.1 or CD45.1/CD45.2) were mixed and injected intravenously through the tail vein. Every 4 weeks until 16 weeks after transplantation, 50-100 μl of blood was collected from the tail vein and mixed with 200μl of 10mM EDTA in PBS to prevent clotting. Cells were subjected to ammonium-chloride potassium chloride red cell lysis. Cells were stained with antibodies against CD45.1 (A20, Biolegend #110706), CD45.2 (104, Tonbo #75-0454), Mac-1 (M1/70, Thermo #47-0112-82), Gr1 (RB6-8C5, Tonbo #60-5931), B220 (RA3-6B2, Tonbo #20-0452), and CD3 (17A2, Biolegend #100206) to evaluate the frequencies of donor myeloid, B, and T cells. All antibodies were used at 1:400 dilution and cells were stained for thirty minutes on ice. For serial transplantation, bone marrow was obtained from the femurs and spines of recipient mice and 5x10⁶ cells were transplanted non-competitively into irradiated recipients (CD45.1/CD45.2 or CD45.1).
5-bromo-2’-deoxyuridine incorporation
Mice were intraperitonially injected with 0.1 mg/g body mass of 5-bromo-2’-deoxyuridine (BrdU) dissolved in PBS and killed two hours later for analysis of progenitor cells, or 72 hours later for analysis of HSCs. In the HSC experiments, mice were maintained on 1 mg/ml BrdU in the drinking water for 72 hours after the initial injection. Bone marrow cells were obtained from the spine and legs and c-kit+ cells were enriched and stained as described above. HSCs, HPCs, or LK cells were double sorted into a 1.5 mL tube containing 2x10⁶ carrier bone marrow cells from a mouse not treated with BrdU. The cells were then stained for BrdU incorporation using the BD APC BrdU Flow Kit following the manufacturer’s instructions. BrdU levels in the HSCs, HPCs, or LK cells were analyzed using a FACSAria II or a FACSAria Fusion cytometer.
Measurement of inflammatory cytokines by ELISA
Plasma was obtained from the blood after centrifugation at 900 x g for ten minutes. Spleens were lysed in protein lysis buffer (100 mM Tris, 150 mM NaCl, 1 mM EGTA, 1 mM EDTA, 1% Triton, and 0.5% sodium deoxycholate). Inflammatory cytokines were measured using Biolegend Legend Max (IFNβ, IFNγ, TNF, and IL6), Biolegend ELISA Max Deluxe (IL1β), and PBL high sensitivity (IFNα) mouse ELISA kits according to the manufacturer’s instructions.
RNA extraction and real time qPCR
For RNA extraction from sorted hematopoietic cells, 5,000-15,000 cells were double sorted into 300 ul of buffer RLT (Qiagen RNAeasy Micro kit) and purified according to the manufacturer’s instructions. RNA was reverse transcribed using iScript Reverse Transcription Supermix (Bio-Rad). The primers used for qPCR analysis included Ifng: 5’-ACA-GCA-AGG-CGA-AAA-AGG-ATG-3’ and 5’-TGG-TGG-ACC-ACT-CGG-ATG-3’; Tnf: 5’-GAT-GAG-AAG-TTC-CCA-AAT-GGC-3’ and 5’-ACT-TGG-TGG-TTT-GCT-ACG-A-3’; and Actb: 5’-CAC-TGT-CGA-GTC-GCG-TCC-3’ and 5’-TCA-TCC-ATG-GCG-AAC-TGG-TG-3’. Transcript levels were normalized to Actb and fold change was calculated using the ΔCt method.
RNA-Seq library preparation and data analysis
5,000–10,000 HSCs, HPCs, and LepR+ bone marrow stromal cells were sorted and then resorted into tubes containing 300 ul of RLT buffer (Qiagen RNAeasy Micro kit) and RNA was purified according to the manufacturer’s instructions. RNA integrity and concentration were measured using a Pico Bioanalyzer. cDNA libraries were generated using the SMARTer Stranded Total RNA-Seq Kit v2 - Pico Input Mammalian (Clonetech). Library fragment size was measured using high sensitivity D1000 Screen Tapes (Agilent) and libraries were quantified using the Qubit dsDNA high sensitivity assay kit (Life Technologies). Libraries were sequenced using an Illumina NextSeq 500. RNAseq data were analyzed with workflows based on the Tuxedo protocol55,56. The quality of RNA-seq raw reads was checked using FastQC 0.11. Raw reads were trimmed using TrimGalore 0.6 and mapped to the Ensembl GRCm38 mouse reference genome using TopHat2 with Bowtie2. Mapped reads were quality-filtered using SAMtools 1.9 to keep uniquely mapped reads only and quantified using Cufflinks 2. Quantified mapped reads were normalized to fragments per 1000 exonic bases per million mapped reads (FPKMs) and gene expression levels were measured as FPKMs using Cuffnorm. Differential expression was assessed using Cuffdiff from the Cufflinks software suite. Gene set enrichment analyses were performed using GSEA457,58.
Statistical methods
In each type of experiment, multiple mice were tested in multiple independent experiments performed on different days. Mice were allocated to experiments randomly and samples processed in an arbitrary order, but formal randomization techniques were not used. No formal blinding was applied when performing the experiments or analyzing the data. Samples sizes were not pre-determined based on statistical power calculations but were based on our experience with these assays. The same samples were not repeatedly measured. No data were excluded. Different replicates typically reflected samples obtained from different mice, though in competitive transplant assays the same mice were repeatedly bled at different time points from 4 to 16 weeks after transplantation.
In Figures 1a–d, 3c–f, and Extended Data Figs. 1b, 1d–m, 3a–c, 4b–c, 4f, 5h, and 6p–q, between 3 and 17 mice were analyzed in a single experiment. In Figures 1p–r, 2h, 3b, 4i, 5i, 6a–i, and Extended Data Figs. 4a, 4d–e, 6h, and 7a–n, a total of 3 to 33 mice were analyzed in two independent experiments. In most of these figure panels, we either observed no differences among treatments or similar differences were observed in multiple figure panels.
Prior to analyzing the statistical significance of differences among groups we tested whether data were normally distributed and whether variance was similar among groups. To test for normality, we performed the Shapiro–Wilk tests when 3≤n<20 or D’Agostino Omnibus tests when n≥20. To test whether variability significantly differed among groups we performed F-tests (for experiments with two groups) or Levene’s median tests (for experiments with more than two groups). When the data significantly deviated from normality or variability significantly differed among groups, we log2-transformed the data and tested again for normality and variability. If the transformed data no longer significantly deviated from normality and equal variability, we performed parametric tests on the transformed data. If log2-transformation was not possible or the transformed data still significantly deviated from normality or equal variability, we performed non-parametric tests on the non-transformed data. The dagoTest and shapiroTest functions of the fBasics package were used to perform the normality tests, and the leveneTest function of the car package was used to perform the Levene’s median test for variances.
When data or log2-transformed data were normal and equally variable, statistical analyses were performed using Student’s t-tests (when there were two groups), one-way ANOVAs (when there were more than two groups), or two-way ANOVAs or matched samples two-way ANOVAs (when there were two or more groups with multiple tissues or cell populations). When the data or log2-transformed data were normal but unequally variable, statistical analyses were performed using Welch’s t-tests (when there were two groups) or Welch’s one-way ANOVAs (when there were more than two groups). When the data and log2-transformed data were abnormal or unequally variable, statistical analysis was performed using Mann-Whitney tests (when there were two groups), Kruskal-Wallis tests (when there were more than two groups), or nparLD tests59 (when there were two or more groups measured at multiple time points). Fisher’s exact tests were used to compare the fractions of mice that were long-term multilineage reconstituted by donor cells in transplantation assays. Multinomial logistic regression analysis was used to compare HSC colony sizes. P-values from multiple comparisons were adjusted using Tukey’s (when there were more than two groups and all the comparisons were of interest) or Sidak’s method (when there were more than two groups and planned comparisons) after ANOVAs, Dunnett’s T3 method after Welch’s one-way ANOVAs, Dunn’s method after Kruskal-Wallis tests, or Benjiamini-Hochberg’s false discovery rate (FDR) method after nparLD tests. Holm-Sidak’s method was used to adjust comparisons involving multiple cell populations with two groups after multiple Student’s t-tests or Mann-Whitney tests. All statistical tests were two-sided. All data represent mean ± standard deviation. Statistical tests were performed using GraphPad Prism V9.1.0 or R 4.0.2.
Data availability
Source data files are provided with this paper. RNA sequencing data associated with this paper are accessible in the NCBI Sequence Read Archive (SRA), BioProjects PRJNA699097 (associated with Figure 1 a–c), PRJNA729963 (associated with Figure 3a), and PRJNA765672 (associated with Extended Data Figure 4f). All other data supporting the findings of this study are available from the corresponding author on reasonable request.
Reporting summary
Further information on research design is available in the Nature Research Reporting Summary linked to this paper.
Extended Data
Extended Data Fig. 1. Adiponectin receptor deficient mice are born in normal numbers and are normal in size (related to Fig. 1).
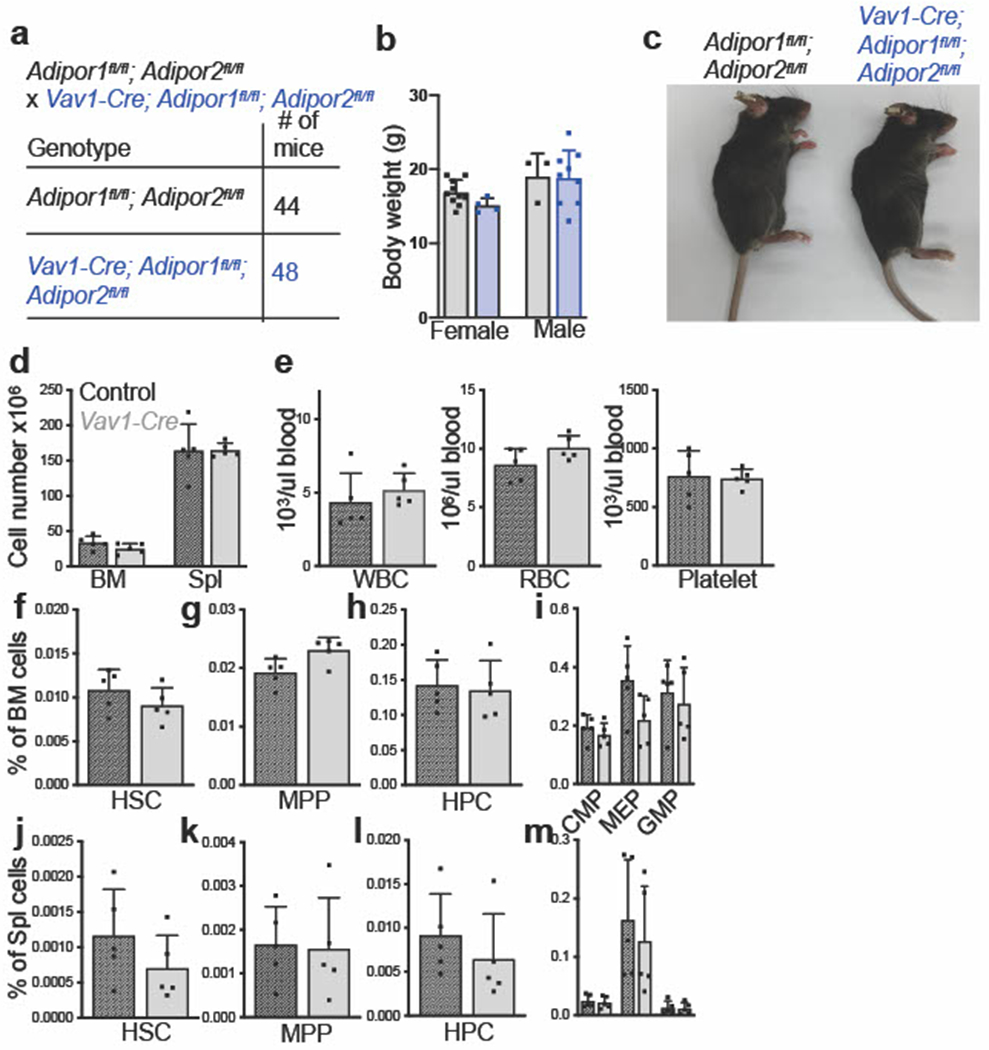
a-c. Vav1-Cre; Adipor1fl/fl; Adipor2fl/fl mice were born at the expected mendelian frequencies (a) and were grossly normal in size (b) and appearance (c) (n=4 female and n=8 male Vav1-Cre; Adipor1fl/fl; Adipor2fl/fl mice and n=10 female and n=3 male control mice in one experiment (b)). d. The number of bone marrow cells in one femur and one tibia or in the spleen of 8-10-week-old Vav1-Cre and control mice (five mice per genotype in one experiment). e. White blood cell, red blood cell, and platelet counts in the blood of 8-10-week-old Vav1-Cre and control mice (five mice per genotype in one experiment). f-i. The frequencies of HSCs (f), MPPs (g), HPCs (h), CMPs, MEPs, and GMPs (i) in bone marrow from one femur and one tibia of Vav1-Cre and control mice (five mice per genotype in one experiment). j-m. The frequencies of HSCs (j), MPPs (k), HPCs (l), CMPs, MEPs, and GMPs (m) in splenocytes from Vav1-Cre and control mice (five mice per genotype in one experiment). All data represent mean ± standard deviation and each dot reflects a different mouse. Statistical significance was assessed using Mann-Whitney tests followed by Holm-Sidak’s multiple comparisons adjustments (b and d-e) or Student’s t-tests followed by Holm-Sidak’s multiple comparisons adjustments (f-m). All statistical tests were two-sided. Source numerical data are available in the source data files.
Extended Data Fig. 2. Flow cytometry gating strategy for the isolation of hematopoietic stem cells, progenitor cells, and differentiated cells (related to Figs. 1–6).
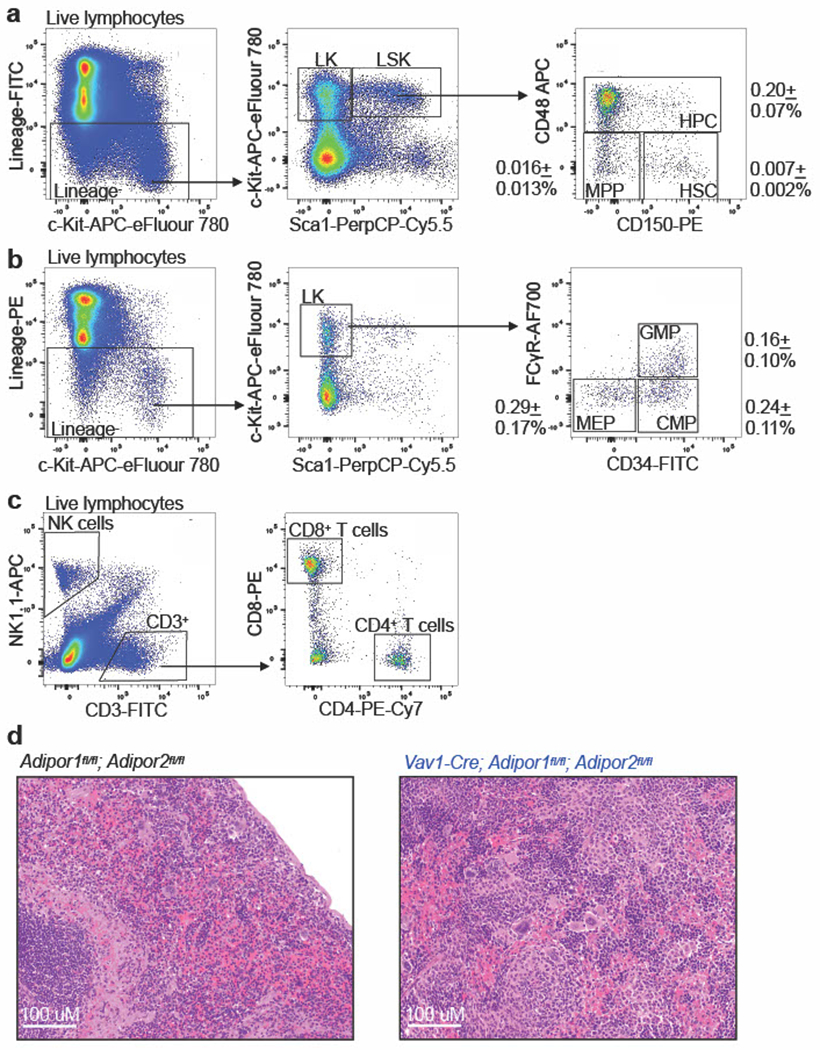
a-c. Representative flow cytometry gates used to identify hematopoietic stem and progenitor cells (a-b), NK cells, CD4+ T cells, and CD8+ T cells (c) in the bone marrow. The markers used to identify each of the cell populations characterized in this study are listed in Supplementary Table 1. d. Hematoxylin and Eosin stained sections from the spleens of Vav1-Cre; Adipor1fl/fl; Adipor2fl/fl and control mice. In Vav1-Cre; Adipor1fl/fl; Adipor2fl/fl mice the spleens were enlarged (Fig. 1d) and the red pulp was expanded throughout the spleen with increased numbers of myeloid, erythroid, and megakaryocytic cells. In control spleens there was limited extramedullary hematopoiesis confined to the subcapsular region. Representative images from three mice per genotype in one experiment are shown.
Extended Data Fig. 3. Adiponectin receptors are required to sustain HSC function (related to Fig. 2).
a-b. The percentages of HSCs that formed colonies (n=6 mice per genotype in two independent experiments) (a) and colony size (n=3 mice per genotype in one experiment) (b) from Vav1-Cre; Adipor1fl/fl; Adipor2fl/fl and control mice. c. The percentage of whole bone marrow cells that formed CFU-GEMM, CFU-GM, CFU-G, CFU-M, and BFU-E colonies (n=3 mice per genotype in one experiment). d. Donor CD45+ cells, T, B, and myeloid cells from the blood of mice competitively transplanted with donor bone marrow cells from Mx1-Cre; Adipor1fl/fl; Adipor2fl/fl (n=27 recipients) or control (n=25 recipients) mice (five donors per genotype in five independent experiments). e. Secondary recipients of bone marrow cells from the mice in (d) (n=25 recipients from six Mx1-Cre; Adipor1fl/fl; Adipor2fl/fl donors and n=24 recipients from five control donors in five independent experiments). All data represent mean ± standard deviation and each dot reflects a different mouse. Statistical significance was assessed using Mann-Whitney tests (d-e), a Student’s t-test (a), a multinomial logistic regression (b), and Student’s t-tests followed by Holm-Sidak’s multiple comparisons adjustments (c), or Mann-Whitney tests (d-e). All statistical tests were two-sided. Source numerical data are available in the source data files.
Extended Data Fig. 4. Adiponectin receptors suppress the production of inflammatory factors (related to Fig. 3).
a. ELISA analysis of inflammatory cytokines in spleen lysates from Vav1-Cre; Adipor1fl/fl; Adipor2fl/fl and control mice (spleen lysates from 16 (IFNγ, TNF, IL6, and Il1β) or 13 (IFNα and IFNβ) Vav1-Cre; Adipor1fl/fl; Adipor2fl/fl mice and 19 (IFNγ, TNF, IL6, and Il1β) or 14 (IFNα and IFNβ) control mice in two independent ELISAs per cytokine). b. qRT-PCR analysis of Tnf transcript levels in sorted bone marrow cells. Data are normalized to transcript levels in wildtype whole bone marrow (WBM) cells (cells sorted from six (WBM), three (HSC, HPC, CMP, MEP, GMP, T-cells, B-cells, and erythroid progenitors), or five (myeloid cells) Vav1-Cre; Adipor1fl/fl; Adipor2fl/fl mice and from seven (WBM), three (HSC, HPC, CMP, MEP, GMP, and erythroid progenitors), or four (T-cells, B-cells, and myeloid cells) control mice in one experiment). c. qRT-PCR analysis of Tnf transcripts in sorted CD4+ T cells, CD8+ T cells, or NK cells from the bone marrow (cells sorted from three mice per genotype in one experiment). d. qRT-PCR analysis of Tnf transcripts in sorted macrophages, inflammatory monocytes, and neutrophils from the bone marrow. Data are normalized to transcript levels in wildtype WBM (cells sorted from seven mice per genotype in two independent experiments). e. The frequency of LepR+ stromal cells in bone marrow from 8-10 week old Vav1-Cre; Adipor1fl/fl; Adipor2fl/fl and control mice (n=7 mice per genotype in two independent experiments). f. RNAseq analysis of transcripts for Ifng and Tnf in LepR+ cells from 8-10 week old Vav1-Cre; Adipor1fl/fl; Adipor2fl/fl and control mice (n=3 mice per genotype one experiment). g. The frequencies of donor and competitor HSCs in the spleens of recipient mice co-transplanted with Vav1-Cre; Adipor1fl/fl; Adipor2fl/fl or control donor cells and wildtype competitor cells 16 weeks after transplantation (n=19 recipients from Vav1-Cre; Adipor1fl/fl; Adipor2fl/fl donors and n=20 recipients from control donors in four independent experiments). All data represent mean ± standard deviation and each dot reflects a different mouse. Statistical significance was assessed using Student’s t-tests followed by Holm-Sidak’s multiple comparisons adjustments (a-b and d), a matched samples two-way ANOVA followed by Sidak’s multiple comparisons adjustment (c), Student’s t-tests (e), or Mann-Whitney tests followed by Holm-Sidak’s multiple comparisons adjustments (a and g). All statistical tests were two-sided. Source numerical data are available in the source data files.
Extended Data Fig. 5. Adiponectin receptors promote HSC function by reducing IFNγ receptor signaling (related to Fig. 4).
a. Bone marrow (one femur and one tibia) and spleen cellularity in Vav1-Cre; Ifngr1fl/fl and control mice (n=7 Vav1-Cre; Ifngrfl/fl mice and n=6 control mice in three independent experiments). b-d. The frequencies of HSCs, MPPs, HPCs (b), CMPs, MEPs, GMPs (c), and differentiated T, B, myeloid, and erythroid cells (d) in the bone marrow of Vav1-Cre; Ifngr1fl/fl and control mice (n=7 Vav1-Cre; Ifngrfl/fl mice and n=6 control mice in three independent experiments). e-g. The frequencies of HSCs, MPPs, HPCs (e), CMPs, MEPs, GMPs (f), and differentiated cells (g) in the spleens of Vav1-Cre; Ifngr1fl/fl and control mice (n=7 Vav1-Cre; Ifngrfl/fl mice and n=6 control mice in three independent experiments). h. The percentage of HSCs that incorporated a 72 hour pulse of BrdU (n=3 Vav1-Cre; Ifngrfl/fl mice and n=4 control mice one experiment). i-o. The frequencies of HSCs (i), MPPs (j), HPCs (k), CMPs (l), MEPs (m), GMPs (n) and differentiated cells (o) in the bone marrow of control, Vav1-Cre; Adipor1fl/fl; Adipor2fl/fl, and Vav1-Cre; Adipor1fl/fl; Adipor2fl/fl; Ifngrfl/fl mice (n=15 Vav1-Cre; Adipor1fl/fl; Adipor2fl/fl mice, n=13 Vav1-Cre; Adipor1fl/fl; Adipor2fl/fl; Ifngrfl/f mice and n=21 control mice in five independent experiments). All data represent mean ± standard deviation and each dot reflects a different mouse. Statistical significance was assessed using a matched samples two-way ANOVA followed by Sidak’s multiple comparisons adjustment (a), Mann-Whitney tests followed by Holm-Sidak’s multiple comparisons adjustments (b-g), a Student’s t-test (h), or one-way ANOVAs followed by Tukey’s multiple comparisons adjustments (i-o). All statistical tests were two-sided. Source numerical data are available in the source data files.
Extended Data Fig. 6. Adiponectin receptors promote HSC function by reducing TNF levels (related to Fig. 5).
a. Bone marrow (one femur and one tibia) and spleen cellularity in Tnf deficient and control mice (n=5 Tnf−/− mice and n=7 control mice in four independent experiments). b-d. The frequencies of HSCs, MPPs, HPCs (b), CMPs, MEPs, GMPs (c) and differentiated T, B, myeloid, and erythroid cells (d), in the bone marrow of Tnf deficient and control mice (n=5 Tnf−/− mice and n=7 control mice in four independent experiments). e-g. The frequencies of HSCs, MPPs, HPCs (e), CMPs, MEPs, GMPs (f) and differentiated cells (g), in the spleens of Tnf deficient and control mice (n=5 (e and g) or n=4 (f) Tnf−/− mice and n=7 control mice in four independent experiments). h. The percentage of HSCs that incorporated a 72 hour pulse of BrdU (n=4 Tnf−/− mice and n=9 control mice in two independent experiments) i-o. The frequencies of HSCs (i), MPPs (j), HPCs (k), CMPs (l), MEPs (m), GMPs (n) and differentiated cells (o) in the bone marrow of control, Vav1-Cre; Adipor1fl/fl; Adipor2fl/fl, and Vav1-Cre; Adipor1fl/fl; Adipor2fl/fl; Tnf−/− mice (n=12 Vav1-Cre; Adipor1fl/fl; Adipor2fl/fl mice, n=11 Vav1-Cre; Adipor1fl/fl; Adipor2fl/fl; Tnf−/− mice and n=12 control mice in five independent experiments). p-q. ELISA of TNF (p) or INFg (q) in blood plasma from Vav1-Cre; Adipor1fl/fl; Adipor2fl/fl; Ifngrfl/fl (p), Vav1-Cre; Adipor1fl/fl; Adipor2fl/fl; Tnf−/− (q), Vav1-Cre; Adipor1fl/fl; Adipor2fl/fl and control mice (n=6 Vav1-Cre; Adipor1fl/fl; Adipor2fl/fl mice, n=10 Vav1-Cre; Adipor1fl/fl; Adipor2fl/fl; Ifngrfl/f mice and n=17 control mice run in one ELISA per cytokine (p) and n=13 Vav1-Cre; Adipor1fl/fl; Adipor2fl/fl mice, n=6 Vav1-Cre; Adipor1fl/fl; Adipor2fl/fl; Tnf−/− mice and n=12 control mice in one ELISA per cytokine (q)). All data represent mean ± standard deviation and each dot reflects a different mouse. Statistical significance was assessed using a matched samples two-way ANOVA followed by Sidak’s multiple comparisons adjustment (a), Student’s t-tests (b-h) followed by Holm-Sidak’s multiple comparisons adjustments (b-g), one-way ANOVAs followed by Tukey’s multiple comparisons adjustments (i-o and q), a Welch’s one-way ANOVA followed by Dunnett’s T3 multiple comparisons adjustment (o), or a Kruskal-Wallis test followed by Dunn’s multiple comparisons adjustment (o and p). All statistical tests were two-sided. Source numerical data are available in the source data files.
Extended Data Fig. 7. Adiponectin receptor function reduces the frequencies of splenic myeloid cells in 5-6 and 19-24 month old mice (related to Fig. 6).
a-d. The frequencies of CMPs, MEPs, GMPs (a, c), differentiated T, B, myeloid, and erythroid cells (b, d) in the bone marrow from 5-6 month old (a-b) or 19-24 month old (c-d) Vav1-Cre; Adipor1fl/fl; Adipor2fl/fl or control mice (n=7 (a-b) or n=5 (c-d) Vav1-Cre; Adipor1fl/fl; Adipor2fl/fl mice and n=10 (a-b) or n=6 (c-d) control mice in two independent experiments per age group). e-n. The frequencies of HSCs (e, j), MPPs (f, k), HPCs (g, l), CMPs, MEPs, GMPs (h, m), and differentiated T, B, myeloid, and erythroid cells (i, n) in the spleens of 5-6-month-old (e-i) and 19-24 month-old (j-n) Vav1-Cre; Adipor1fl/fl; Adipor2fl/fl or control mice (n=7 (e-i) or n=5 (j-n) Vav1-Cre; Adipor1fl/fl; Adipor2fl/fl mice and n= 10 (e-i) or n=6 (j-n) control mice in two independent experiments per age group). All data represent mean ± standard deviation and each dot reflects a different mouse. Statistical significance was assessed using Mann-Whitney tests followed by Holm-Sidak’s multiple comparisons adjustments (a-n). All statistical tests were two-sided. Source numerical data are available in the source data files.
Supplementary Material
Supplementary Table: Cell populations analyzed by flow cytometry in this study
ACKNOWLEDGEMENTS
S.J.M. is a Howard Hughes Medical Institute (HHMI) Investigator, the Mary McDermott Cook Chair in Pediatric Genetics, the Kathryn and Gene Bishop Distinguished Chair in Pediatric Research, the director of the Hamon Laboratory for Stem Cells and Cancer, and a Cancer Prevention and Research Institute of Texas Scholar. This work was supported by the National Institutes of Health (DK118745), the Moody Medical Research Institute, the Josephine Hughes Sterling Foundation, and the Robert J. Kleberg, Jr. and Helen C. Kleberg Foundation (all to S.J.M). C.E.M. was supported by a Postdoctoral Fellowship from the American Cancer Society (PF-13-245-01-LIB). E.C.J. was supported by a Postdoctoral Fellowship from the Damon Runyon Cancer Research Foundation (2278-16). R.B.J was supported by Ruth L. Kirschstein National Research Service Award Postdoctoral Fellowship from the National Heart, Lung, and Blood Institute (F32HL122095-01). Funding for the UT Dallas/UT Southwestern Green Fellows Program (C.D.S.) was supported, in part, by the Cecil and Ida Green Foundation. We thank G. Karsenty for providing the Adipor1fl/fl and Adipor2fl/fl mice, N. Loof, C. Cantu, T. Shih, G. Wilson and the Moody Foundation Flow Cytometry Facility, M. Mulkey for mouse colony management, and the BioHPC high-performance computing cloud at the University of Texas Southwestern Medical Center for providing computational resources.
Footnotes
Competing interests
The authors declare no competing interests.
REFERENCES
- 1.Berg AH, Combs TP, Du X, Brownlee M & Scherer PE The adipocyte-secreted protein Acrp30 enhances hepatic insulin action. Nat Med 7, 947–953 (2001). [DOI] [PubMed] [Google Scholar]
- 2.Yamauchi T et al. The fat-derived hormone adiponectin reverses insulin resistance associated with both lipoatrophy and obesity. Nat Med 7, 941–946 (2001). [DOI] [PubMed] [Google Scholar]
- 3.Fruebis J et al. Proteolytic cleavage product of 30-kDa adipocyte complement-related protein increases fatty acid oxidation in muscle and causes weight loss in mice. Proc Natl Acad Sci U S A 98, 2005–2010 (2001). [DOI] [PMC free article] [PubMed] [Google Scholar]
- 4.Scherer PE, Williams S, Fogliano M, Baldini G & Lodish HF A novel serum protein similar to C1q, produced exclusively in adipocytes. J Biol Chem 270, 26746–26749 (1995). [DOI] [PubMed] [Google Scholar]
- 5.Maeda K et al. cDNA cloning and expression of a novel adipose specific collagen-like factor, apM1 (AdiPose Most abundant Gene transcript 1). Biochem Biophys Res Commun 221, 286–289 (1996). [DOI] [PubMed] [Google Scholar]
- 6.Nakano Y, Tobe T, Choi-Miura NH, Mazda T & Tomita M Isolation and characterization of GBP28, a novel gelatin-binding protein purified from human plasma. J Biochem 120, 803–812 (1996). [DOI] [PubMed] [Google Scholar]
- 7.Hu E, Liang P & Spiegelman BM AdipoQ is a novel adipose-specific gene dysregulated in obesity. J Biol Chem 271, 10697–10703 (1996). [DOI] [PubMed] [Google Scholar]
- 8.Masamoto Y et al. Adiponectin Enhances Quiescence Exit of Murine Hematopoietic Stem Cells and Hematopoietic Recovery Through mTORC1 Potentiation. Stem Cells 35, 1835–1848 (2017). [DOI] [PubMed] [Google Scholar]
- 9.DiMascio L et al. Identification of adiponectin as a novel hemopoietic stem cell growth factor. J Immunol 178, 3511–3520 (2007). [DOI] [PubMed] [Google Scholar]
- 10.Tikhonova AN et al. The bone marrow microenvironment at single-cell resolution. Nature 569, 222–228 (2019). [DOI] [PMC free article] [PubMed] [Google Scholar]
- 11.Cawthorn WP et al. Bone marrow adipose tissue is an endocrine organ that contributes to increased circulating adiponectin during caloric restriction. Cell Metab 20, 368–375 (2014). [DOI] [PMC free article] [PubMed] [Google Scholar]
- 12.Ohashi K et al. Adiponectin promotes macrophage polarization toward an anti-inflammatory phenotype. J Biol Chem 285, 6153–6160 (2010). [DOI] [PMC free article] [PubMed] [Google Scholar]
- 13.Yamaguchi N et al. Adiponectin inhibits Toll-like receptor family-induced signaling. FEBS Lett 579, 6821–6826 (2005). [DOI] [PubMed] [Google Scholar]
- 14.Wilk S et al. Adiponectin modulates NK-cell function. Eur J Immunol 43, 1024–1033 (2013). [DOI] [PubMed] [Google Scholar]
- 15.Surendar J et al. Adiponectin Limits IFN-gamma and IL-17 Producing CD4 T Cells in Obesity by Restraining Cell Intrinsic Glycolysis. Front Immunol 10, 2555 (2019). [DOI] [PMC free article] [PubMed] [Google Scholar]
- 16.Maeda N et al. Diet-induced insulin resistance in mice lacking adiponectin/ACRP30. Nat Med 8, 731–737 (2002). [DOI] [PubMed] [Google Scholar]
- 17.Masamoto Y et al. Adiponectin Enhances Antibacterial Activity of Hematopoietic Cells by Suppressing Bone Marrow Inflammation. Immunity 44, 1422–1433 (2016). [DOI] [PubMed] [Google Scholar]
- 18.Holland WL et al. Receptor-mediated activation of ceramidase activity initiates the pleiotropic actions of adiponectin. Nat Med 17, 55–63 (2011). [DOI] [PMC free article] [PubMed] [Google Scholar]
- 19.Vasiliauskaite-Brooks I et al. Structural insights into adiponectin receptors suggest ceramidase activity. Nature 544, 120–123 (2017). [DOI] [PMC free article] [PubMed] [Google Scholar]
- 20.Yamauchi T et al. Targeted disruption of AdipoR1 and AdipoR2 causes abrogation of adiponectin binding and metabolic actions. Nat Med 13, 332–339 (2007). [DOI] [PubMed] [Google Scholar]
- 21.Hug C et al. T-cadherin is a receptor for hexameric and high-molecular-weight forms of Acrp30/adiponectin. Proc Natl Acad Sci U S A 101, 10308–10313 (2004). [DOI] [PMC free article] [PubMed] [Google Scholar]
- 22.Hannun YA & Obeid LM Sphingolipids and their metabolism in physiology and disease. Nat Rev Mol Cell Biol 19, 175–191 (2018). [DOI] [PMC free article] [PubMed] [Google Scholar]
- 23.Xie SZ et al. Sphingolipid Modulation Activates Proteostasis Programs to Govern Human Hematopoietic Stem Cell Self-Renewal. Cell Stem Cell 25, 639–653 (2019). [DOI] [PMC free article] [PubMed] [Google Scholar]
- 24.Golan K et al. S1P promotes murine progenitor cell egress and mobilization via S1P1-mediated ROS signaling and SDF-1 release. Blood 119, 2478–2488 (2012). [DOI] [PMC free article] [PubMed] [Google Scholar]
- 25.Juarez JG et al. Sphingosine-1-phosphate facilitates trafficking of hematopoietic stem cells and their mobilization by CXCR4 antagonists in mice. Blood 119, 707–716 (2012). [DOI] [PubMed] [Google Scholar]
- 26.Massberg S et al. Immunosurveillance by hematopoietic progenitor cells trafficking through blood, lymph, and peripheral tissues. Cell 131, 994–1008 (2007). [DOI] [PMC free article] [PubMed] [Google Scholar]
- 27.Ergen AV, Boles NC & Goodell MA Rantes/Ccl5 influences hematopoietic stem cell subtypes and causes myeloid skewing. Blood 119, 2500–2509 (2012). [DOI] [PMC free article] [PubMed] [Google Scholar]
- 28.Yamashita M & Passegue E TNF-alpha Coordinates Hematopoietic Stem Cell Survival and Myeloid Regeneration. Cell Stem Cell 25, 357–372 (2019). [DOI] [PMC free article] [PubMed] [Google Scholar]
- 29.Chambers SM et al. Aging hematopoietic stem cells decline in function and exhibit epigenetic dysregulation. PLoS Biol 5, e201 (2007). [DOI] [PMC free article] [PubMed] [Google Scholar]
- 30.Valletta S et al. Micro-environmental sensing by bone marrow stroma identifies IL-6 and TGFbeta1 as regulators of hematopoietic ageing. Nat Commun 11, 4075 (2020). [DOI] [PMC free article] [PubMed] [Google Scholar]
- 31.Young K et al. Decline in IGF1 in the bone marrow microenvironment initiates hematopoietic stem cell aging. Cell Stem Cell 28, 1473–1482 (2021). [DOI] [PMC free article] [PubMed] [Google Scholar]
- 32.Henry CJ et al. Aging-associated inflammation promotes selection for adaptive oncogenic events in B cell progenitors. J Clin Invest 125, 4666–4680 (2015). [DOI] [PMC free article] [PubMed] [Google Scholar]
- 33.Baldridge MT, King KY, Boles NC, Weksberg DC & Goodell MA Quiescent haematopoietic stem cells are activated by IFN-gamma in response to chronic infection. Nature 465, 793–797 (2010). [DOI] [PMC free article] [PubMed] [Google Scholar]
- 34.Essers MA et al. IFNalpha activates dormant haematopoietic stem cells in vivo. Nature 458, 904–908 (2009). [DOI] [PubMed] [Google Scholar]
- 35.Matatall KA et al. Chronic Infection Depletes Hematopoietic Stem Cells through Stress-Induced Terminal Differentiation. Cell Rep 17, 2584–2595 (2016). [DOI] [PMC free article] [PubMed] [Google Scholar]
- 36.Pietras EM et al. Chronic interleukin-1 exposure drives haematopoietic stem cells towards precocious myeloid differentiation at the expense of self-renewal. Nat Cell Biol 18, 607–618 (2016). [DOI] [PMC free article] [PubMed] [Google Scholar]
- 37.Pietras EM, Warr MR & Passegue E Cell cycle regulation in hematopoietic stem cells. J Cell Biol 195, 709–720 (2011). [DOI] [PMC free article] [PubMed] [Google Scholar]
- 38.Morrison SJ, Wandycz AM, Akashi K, Globerson A & Weissman IL The aging of hematopoietic stem cells. Nat Med 2, 1011–1016 (1996). [DOI] [PubMed] [Google Scholar]
- 39.Fujisaki J et al. In vivo imaging of Treg cells providing immune privilege to the haematopoietic stem-cell niche. Nature 474, 216–219 (2011). [DOI] [PMC free article] [PubMed] [Google Scholar]
- 40.Hirata Y et al. CD150(high) Bone Marrow Tregs Maintain Hematopoietic Stem Cell Quiescence and Immune Privilege via Adenosine. Cell Stem Cell 22, 445–453 (2018). [DOI] [PMC free article] [PubMed] [Google Scholar]
- 41.Luo Y & Liu M Adiponectin: a versatile player of innate immunity. J Mol Cell Biol 8, 120–128 (2016). [DOI] [PMC free article] [PubMed] [Google Scholar]
- 42.Wu X et al. Intrinsic Immunity Shapes Viral Resistance of Stem Cells. Cell 172, 423–438 (2018). [DOI] [PMC free article] [PubMed] [Google Scholar]
- 43.Pearl-Yafe M et al. Tumor necrosis factor receptors support murine hematopoietic progenitor function in the early stages of engraftment. Stem Cells 28, 1270–1280 (2010). [DOI] [PubMed] [Google Scholar]
- 44.Pronk CJ, Veiby OP, Bryder D & Jacobsen SE Tumor necrosis factor restricts hematopoietic stem cell activity in mice: involvement of two distinct receptors. J Exp Med 208, 1563–1570 (2011). [DOI] [PMC free article] [PubMed] [Google Scholar]
- 45.Ishida T et al. Pre-Transplantation Blockade of TNF-alpha-Mediated Oxygen Species Accumulation Protects Hematopoietic Stem Cells. Stem Cells 35, 989–1002 (2017). [DOI] [PubMed] [Google Scholar]
- 46.Donnelly RP, Freeman SL & Hayes MP Inhibition of IL-10 expression by IFN-gamma up-regulates transcription of TNF-alpha in human monocytes. J Immunol 155, 1420–1427 (1995). [PubMed] [Google Scholar]
- 47.Vila-del Sol V, Punzon C & Fresno M IFN-gamma-induced TNF-alpha expression is regulated by interferon regulatory factors 1 and 8 in mouse macrophages. J Immunol 181, 4461–4470 (2008). [DOI] [PubMed] [Google Scholar]
- 48.Palucka AK, Blanck JP, Bennett L, Pascual V & Banchereau J Cross-regulation of TNF and IFN-alpha in autoimmune diseases. Proc Natl Acad Sci U S A 102, 3372–3377 (2005). [DOI] [PMC free article] [PubMed] [Google Scholar]
- 49.Raju R et al. A New Cecal Slurry Preparation Protocol with Improved Long-Term Reproducibility for Animal Models of Sepsis. PLoS ONE 9 (2014). [DOI] [PMC free article] [PubMed] [Google Scholar]
- 50.Kuhn R, Schwenk F, Aguet M & Rajewsky K Inducible gene targeting in mice. Science 269, 1427–1429 (1995). [DOI] [PubMed] [Google Scholar]
- 51.de Boer J et al. Transgenic mice with hematopoietic and lymphoid specific expression of Cre. Eur J Immunol 33, 314–325 (2003). [DOI] [PubMed] [Google Scholar]
- 52.Lee SH et al. Identifying the initiating events of anti-Listeria responses using mice with conditional loss of IFN-gamma receptor subunit 1 (IFNGR1). J Immunol 191, 4223–4234 (2013). [DOI] [PMC free article] [PubMed] [Google Scholar]
- 53.Kajimura D et al. Adiponectin regulates bone mass via opposite central and peripheral mechanisms through FoxO1. Cell Metab 17, 901–915 (2013). [DOI] [PMC free article] [PubMed] [Google Scholar]
- 54.Yue R, Shen B & Morrison SJ Clec11a/osteolectin is an osteogenic growth factor that promotes the maintenance of the adult skeleton. Elife 5 (2016). [DOI] [PMC free article] [PubMed] [Google Scholar]
- 55.Trapnell C et al. Differential gene and transcript expression analysis of RNA-seq experiments with TopHat and Cufflinks. Nat Protoc 7, 562–578 (2012). [DOI] [PMC free article] [PubMed] [Google Scholar]
- 56.Pertea M, Kim D, Pertea GM, Leek JT & Salzberg SL Transcript-level expression analysis of RNA-seq experiments with HISAT, StringTie and Ballgown. Nat Protoc 11, 1650–1667 (2016). [DOI] [PMC free article] [PubMed] [Google Scholar]
- 57.Subramanian A et al. Gene set enrichment analysis: a knowledge-based approach for interpreting genome-wide expression profiles. Proc Natl Acad Sci U S A 102, 15545–15550 (2005). [DOI] [PMC free article] [PubMed] [Google Scholar]
- 58.Mootha VK et al. PGC-1alpha-responsive genes involved in oxidative phosphorylation are coordinately downregulated in human diabetes. Nat Genet 34, 267–273 (2003). [DOI] [PubMed] [Google Scholar]
- 59.Noguchi K, Gel YR, Brunner E & Konietschke F nparLD: AnRSoftware Package for the Nonparametric Analysis of Longitudinal Data in Factorial Experiments. Journal of Statistical Software 50 (2012). [Google Scholar]
Associated Data
This section collects any data citations, data availability statements, or supplementary materials included in this article.
Supplementary Materials
Supplementary Table: Cell populations analyzed by flow cytometry in this study
Data Availability Statement
Source data files are provided with this paper. RNA sequencing data associated with this paper are accessible in the NCBI Sequence Read Archive (SRA), BioProjects PRJNA699097 (associated with Figure 1 a–c), PRJNA729963 (associated with Figure 3a), and PRJNA765672 (associated with Extended Data Figure 4f). All other data supporting the findings of this study are available from the corresponding author on reasonable request.