

Abstract
Purpose
To investigate whether fatty acid changes in granulosa cells (GCs) underly the pathogenic mechanisms of diminished ovarian reserve (DOR).
Methods
GCs were obtained from patients with DOR (n = 70) and normal ovarian reserve (NOR, n = 70). Analysis of fatty acids changes in GCs was then analyzed.
Results
Patients with DOR had significantly lower levels of antral follicle count and anti-Mullerian hormone and higher levels of follicle-stimulating hormone compared with NOR patients (P < 0.001). The good-quality embryo rate was notably decreased in DOR patients (51.99 vs 39.52%, P < 0.05). A total of 15 significantly decreased fatty acids in GCs from patients with DOR. The ATP levels were markedly lower in DOR patients than in NOR patients (39.07 ± 12.89 vs 23.21 ± 13.69%, P < 0.05). Mitochondrial membrane potential decreased in DOR patients (P < 0.01). In GCs from DOR patients, the β-oxidation genes (HADHA and ACSL) and DNA repair genes (PRKDC and RAD50) were significantly downregulated (P < 0.05). The γH2AX foci/nucleus ratio in DOR patients markedly increased relative to that of NOR patients (0.31 ± 0.03 vs 0.87 ± 0.07, P < 0.001). Meanwhile, the apoptosis rate of GCs was significantly higher in DOR patients (6.43 ± 2.11 vs 48.06 ± 6.72%, P < 0.01).
Conclusion
GC apoptosis resulting from the decrease of fatty acids, and associated with reduced ATP production and DNA damage, may contribute to the pathogenic mechanisms responsible for DOR.
Supplementary Information
The online version contains supplementary material available at 10.1007/s10815-022-02462-8.
Keywords: Diminished ovarian reserve, Fatty acids, ATP production, DNA damage, Granulosa cell apoptosis
Introduction
Diminished ovarian reserve (DOR) is defined by the depletion of oocyte quality and quantity, affecting approximately 10% of infertile women [1]. Several factors, including aging, autoimmune, genetic, environment, radiotherapy, and chemotherapy, contribute to the development of DOR [2]. DOR is associated with ovarian hypo-response, low pregnancy rates, and high miscarriage rate in even in vitro fertilization (IVF) [3]. DOR is one of the most serious challenges that reproductive specialists are facing.
Granulosa cells (GCs), which supply nutrients and growth regulators to oocytes, are a key factor in oocyte development and maturation [4]. Fatty acids are indispensable energy substates, providing a potent source of energy through β-oxidation, which is a mainly adenosine triphosphate (ATP) generating way for oocytes [5]. There is increasing evidence that adding β-oxidation inhibitors leads to oocyte meiotic arrest and post-fertilization developmental failure [6, 7]. Carnitine palmitoyltransferase I (CPT1B) is the limited step of activating fatty acids into mitochondria to synthesize ATP [8]. Meanwhile, β-oxidation is catalyzed by hydroacyl-CoA dehydrogenase-β (HADHB), hydroacyl-CoA dehydrogenase-α (HADHA), long-chain acyl-CoA synthetase (ACSL) [9]. A large amount of fatty acids influence oocyte quality and developmental potential [10]. β-oxidation is vital for oocyte development [11]. Thus, fatty acid changes and abnormal β-oxidation may be an underlying mechanism of DOR.
Mitochondrial membrane potential is a hallmark feature of mitochondrial function. The potential difference between the inner and outer membrane provides energy for ATP production [12]. ATP production plays an indispensable role in oocyte growth, maturation, fertilization, and embryonic development [13]. Mitochondrial dysfunction leads to reduced ATP production and decreased mitochondrial membrane potential, which results in impaired oocyte and embryo development [14]. Hence, ATP production and mitochondrial membrane potential levels may provide a good understanding of DOR pathogenesis.
Decreased fatty acids cause DNA damage [15]. The double-strand DNA breaks (DSBs) have been considered the most destructive type of DNA damage. Studies have shown that increased DSBs and decreased DNA repair in GCs may trigger apoptosis, thereby accelerating ovarian aging [16, 17]. Ataxia-telangiectasia mutated (ATM) is a vital element of the DNA repair system. Once activated, the Mre11-Rad50-Nbs1 (MRN) complex subsequently acts as a DSBs sensor for ATM, recruiting ATM to the broken DNA molecule [18]. PRKDC is involved in DNA repair and maintenance of genomic stability [19]. Apoptosis is activated if DNA repair fails or DNA damage intensifies [20]. GC apoptosis has been associated with poor oocyte and embryo quality [21]. DNA damage-induced GC apoptosis plays a crucial role in the occurrence of DOR.
The purpose of this research was to investigate if fatty acid changes in GCs are the pathogenic mechanism of DOR. We evaluated the effect of fatty acid changes on GC apoptosis using liquid chromatography-tandem mass spectrometry (LC–MS/MS), gas chromatography–mass spectrometry (GC–MS), mitochondrial function, and DNA damage analysis. This research may further clarify the pathogenic mechanism of DOR contributing to timely clinical diagnosis and therapy.
Materials and methods
Subjects
A set of 140 patients were recruited at our reproductive center from January to December 2019. The study was approved by the ethics committee of the First Hospital of Lanzhou University (LDYYLL2019-44). All participants gave written informed consent in the research. The diagnosis of DOR was made as follows: age ≤ 35 years; total antral follicle count (AFC) ≤ 7; 12 IU/L ≤ follicle-stimulating hormone (FSH) ≤ 25 IU/L and antimullerian hormone (AMH) ≤ 1.1 ng/mL [22, 23]. Exclusion criteria included polycystic ovarian syndrome, ovarian benign or malignant tumor, endometriosis, and premature ovarian failure caused by genetic problems.
GCs collection and isolation
Follicular fluid was extracted from follicles 14 mm in diameter, and the number of retrieved oocytes varied from 7 to 15 in the NOR group and 2 to 6 in the DOR group. After 36 h of administrating human chorionic gonadotropin, GCs were obtained from the follicular fluid. The follicular fluid was centrifuged at 800 × g for 10 min, and the supernatant was removed. The cell suspensions were layered on 6.0 mL Ficoll-Paque PLUS and centrifuged at 600 × g for 20 min for GC collection. A total of NOR (n = 70) and DOR (n = 70) GCs were collected in this study. The participants represented a convenience sample, and the purpose of oocyte extraction was primarily for IVF.
LC–MS/MS analysis
We detected different metabolites changes in GCs from 3 DOR patients and 3 NOR patients by LC–MS/MS analysis. GCs were added 800 μL of extraction reagent consisting of methanol/acetonitrile/water (v:v:v = 2:2:1) to homogenize. The cell suspensions were centrifuged at 25,000 rpm for 15 min, and the supernatant was transferred for vacuum freeze-drying. The metabolites were resuspended in 200 µL methanol and centrifuged at 25,000 rpm for 15 min. The supernatant was analyzed by LC–MS/MS analysis. LC–MS/MS analysis was performed on a Waters ACQUITY UPLC BEH C18 column (1.7 μm, 2.1 mm × 100 mm). A total of 5 μL of each sample was injected. The flow rate was 0.35 mL/min. In the positive mode, the mobile phase consisted of (A) 0.1% formic acid and (B) acetonitrile. In the negative mode, the mobile phase consisted of (A) 10 mM ammonium formate and (B) acetonitrile. The program was set as follows: 0–1 min, 2% B; 1–9 min, 2%-98% B; 9–12 min, 98% B; 12–12.1 min, 98% B to 2% B; and 12.1–15 min, 2% B. The mass spectrometry data were obtained by scanning.
GC–MS analysis
We analyzed fatty acid changes in GCs from 3 DOR patients and 3 NOR patients using GC–MS analysis. GCs were added 500 μL of extraction liquid consisting of isopropanol/hexane (v:v = 2:3) to homogenize. The cell suspensions were centrifuged at 12,000 × g for 2 min, and 400 μL supernatant was transferred and vacuum dried. Next, 200 μL methanol and hexane were added for dissolution. The supernatant was analyzed by GC–MS analysis. GC–MS analysis was utilized using a SHIMADZU 2010 PLUS system with a CP-Sil88 capillary column (60 m × 250 μm × 0.20 μm). A total of 1 μL of each sample was injected. Helium was utilized as carrier gas. The gas flow rate was 1.05 mL/min. The column temperature program was set as follows: 50 °C for 1 min; 50 to 175 °C for 20 °C/min; 175 °C for 5 min; 175 to 190 °C for 5 °C/min; 190 °C for 5 min; 190 to 225 °C for 5 °C/min; 225 °C for 2 min; 225 to 240 °C for 5 °C/min; 240 °C for 2 min. The mass spectrometry data were obtained by scanning.
Mitochondrial membrane potential analysis
Mitochondrial function in GCs was measured using a mitochondrial membrane potential assay kit with JC-1 (Beyotime, China). We examined the changes of mitochondrial membrane potential in GCs from 6 DOR patients and 6 NOR patients. GCs in each group were incubated with JC-1 staining solution at 37 °C for 20 min. They were washed twice by JC-1 staining buffer. The fluorescence intensity of GCs was imaged using laser scanning microscopy (LSM 800, Germany) with red and green channels selected.
ATP content
The ATP content in GCs was detected using the ATP assay kit (Beyotime, China). We measured ATP content in GCs from 10 DOR patients and 10 NOR patients. GCs in each group were lysed in 100 μL ATP lysis solution for 1 min. The mixtures were centrifuged at 12,000 × g for 5 min, and the supernatant was obtained. The 20 μL supernatant or standard were added with a 100 μL ATP detection working solution. The ATP content was detected using a luminescent microplate reader. The standard curve formula was derived from three standard points (0.1, 1, and 10 μmol/L ATP), and the ATP content was calculated. To eliminate errors due to differences in protein content during sample preparation, the BCA assay kit (Beyotime, China) was utilized to detect the protein content. The ATP content was then converted to nmol/mg protein.
Immunofluorescence
We examined DNA damage in GCs from 6 DOR patients and 6 NOR patients. For immunofluorescence staining of γH2AX, GCs were placed on glass slides and fixed in 4% paraformaldehyde (Servicebio, China) for 15 min. The slides were permeabilized with 0.3% Triton X-100 for 20 min. Then, the slides were blocked with 3% bovine serum albumin (BSA) for 30 min at room temperature. Anti-γH2AX (phosphor S139) rabbit antibody and goat anti-rabbit secondary antibody were added and incubated for 50 min at room temperature. The slides were mounted with 4′6-diamidino-2-phenylindole (DAPI, Sigma). Stained GCs were examined under a fluorescence microscope (Nikon Eclipse C1, Japan).
Cell cycle analysis
We determined cell cycle in GCs from 6 DOR patients and 6 NOR patients. GCs were incubated in 6-well culture plates (5 × 10⁶ cells/mL) for 24 h to ensure they were adhesive. The cells were obtained and fixed in 70% cold ethanol overnight at 4 °C. Then, the cells were incubated with 100 mg/ml ribonuclease A, 20 mg/ml propidium iodide, 0.1% Triton X-100 for 30 min at 37 °C in the dark. Cell cycle phase distributions were utilized by flow cytometry (Beckman, USA).
Apoptosis analysis
We analyzed GC apoptosis from 6 DOR patients and 6 NOR patients. GCs were placed at 6-well culture plates (5 × 10⁶ cells/mL). After centrifugation at 1500 × g for 5 min, the cells were resuspended in 5 μL Annexin V-FITC and 5 μL PI staining solution. The cells were incubated for 20 min at room temperature and analyzed by flow cytometry (Beckman, USA).
Real-time quantitative polymerase chain reaction (RT-qPCR) analysis
Total RNA was extracted from GCs using Trizol (Invitrogen), and the cDNA was obtained using PrimeScipt RT Master Mix (Takara, RR036A). Twenty microliters of RT-qPCR were composed of 10 μL SYBR Premix Ex Taq II (Takara, RR820A), 7 μL nuclease-free water, 2 μL cDNA, 0.5 µL of each the forward and reverse primer. RT-qPCR was utilized using a StepOnePlus Real-Time PCR System (Applied Biosystems, USA). Reactions were carried out in 40 cycles (95 °C for 15 s, 58 °C for 15 s, 72 °C for 20 s). GAPDH served as an internal reference for gene expression analysis. The RT-qPCR primers used are listed in Table 2S.
Statistical analysis
Results were presented as mean ± standard deviation (SD). Differences were analyzed by Mann–Whitney U test or the Student’s t-test. P < 0.05 was considered significant. SPSS 20.0 statistical software (IBM Corp, USA) was utilized for statistical analysis.
Results
Baseline characteristics of DOR patients
Totally, 140 patients were recruited in the research, of which 70 patients with NOR and 70 patients with DOR. The baseline characteristics are listed in Table 1. There were no differences regarding BMI, age, basic hormone levels (LH, E2, PRL, P, and TSH), duration of infertility, TG, TC, LDL, HDL, live birth rate, and miscarriage rate between the two groups. The DOR group had a lower AFC level (15.76 ± 6.67 vs 4.07 ± 1.96, P < 0.001), lower AMH level (4.09 ± 2.76 vs 0.42 ± 0.28 μg/L, P < 0.001), and higher FSH level (6.15 ± 1.47 vs 14.34 ± 2.23 IU/L, P < 0.001) than the NOR group. In addition, the good-quality embryo rate calculated in the DOR group, compared with the NOR group, was significantly lower (51.99 vs 39.52%, P < 0.05).
Table 1.
Baseline characteristics of NOR and DOR groups
| Parameters | NOR (n = 70) | DOR (n = 70) | P-value |
|---|---|---|---|
| BMI (kg/m2) | 22.26 ± 3.11 | 21.83 ± 2.31 | 0.353 |
| Age (years) | 30.01 ± 3.10 | 30.93 ± 2.53 | 0.058 |
| AFC (n) | 15.76 ± 6.67 | 4.07 ± 1.96 | 0.000 |
| Basal FSH (IU/L) | 6.15 ± 1.47 | 14.34 ± 2.23 | 0.000 |
| Basal LH (IU/L) | 5.57 ± 3.34 | 4.71 ± 2.12 | 0.070 |
| Basal E2 (ng/L) | 45.24 ± 27.88 | 41.15 ± 31.54 | 0.422 |
| Basal PRL (ng/mL) | 18.57 ± 7.43 | 17.20 ± 7.28 | 0.287 |
| Basal P (ng/mL) | 0.74 ± 0.40 | 0.64 ± 0.52 | 0.190 |
| Basal TSH (mU/L) | 3.40 ± 1.46 | 3.28 ± 2.09 | 0.703 |
| AMH (μg/L) | 4.09 ± 2.76 | 0.42 ± 0.28 | 0.000 |
| Duration of infertility (years) | 3.57 ± 2.31 | 3.73 ± 1.96 | 0.665 |
| TC (mg/dL) | 166.55 ± 33.40 | 169.44 ± 28.55 | 0.583 |
| TG (mg/dL) | 114.15 ± 59.79 | 99.69 ± 44.88 | 0.108 |
| HDL (mg/dL) | 45.98 ± 10.33 | 46.54 ± 10.51 | 0.752 |
| LDL (mg/dL) | 95.23 ± 32.37 | 92.70 ± 23.36 | 0.597 |
| Miscarriage rate (%) | 17.24 (10/58) | 23.53 (12/51) | 0.414 |
| Live birth rate (%) | 55.17 (32/58) | 43.13 (22/51) | 0.210 |
| Good-quality embryo rate (%) | 51.99 (432/831) | 39.52 (49/124) | 0.010 |
Data were presented as mean ± SD. BMI, body mass index; AFC, antral follicle count; FSH, follicle stimulating hormone; LH, luteinizing hormone; E2, estrogen; PRL, prolactin; P, progesterone; TSH, thyroid stimulating hormone; AMH, anti-Mullerian hormone; TC, total cholesterol; TG, triglyceride; HDL, high-density lipoprotein; LDL, low-density lipoprotein
Decreased fatty acids in DOR patients
We performed an untargeted (LC–MS/MS) analysis in 3 DOR patients and 3 NOR patients to screen and identify potential metabolites. In the negative ion mode, fatty acids are the most significantly different metabolites (Fig. 1a). In the positive ion mode, fatty acids are the main significantly different metabolites (Fig. 1b). The decrease of fatty acids in the DOR group is shown in Table 1S. In order to accurately quantify the fatty acids in GCs of NOR and DOR groups, we used targeted (GC–MS) analysis to further study.
Fig. 1.

Decreased fatty acids in GCs of DOR group. LC–MS/MS analysis of different metabolites in GCs of NOR (n = 3) and DOR (n = 3) groups. a Negative ion mode b positive ion mode. The y-axis to metabolite classification entries and the x-axis corresponds to a number of metabolites. GC–MS analysis of fatty acids in GCs of NOR (n = 3) and DOR (n = 3) groups. c Volcano plot. The blue and red points represent downregulated and upregulated fatty acids, respectively. The y-axis to − log10 (P-value) and the x-axis correspond to log2 (fold change). d Hierarchical clustering heatmap. Different color blocks represent different expressions of fatty acids. The y-axis to contrasting fatty acids and the x-axis corresponds to experimental grouping
A total of 3 samples from the DOR group and 3 samples from the NOR group were tested by GC–MS analysis to ensure fatty acids in GCs correspondingly. The volcano plot of fatty acids was presented in Fig. 1c. Of these fatty acids, 28 are downregulated and 1 upregulated. Based on screening criteria (VIP > 0, P < 1), a total of 29 fatty acids was different from NOR to DOR groups (Table 3S). The heat map with unsupervised hierarchical clustering in Fig. 1d showed differences between NOR and DOR groups. The Student’s T-test (P < 0.05) was utilized to investigate significantly differential fatty acids between NOR and DOR groups. We found 15 substances including pentadecanoic acid, cis-10-pentadecenotic acid, tran-9-palmitoleic acid, cis-9-palmitoleic acid, heptadecanoic acid, trans-10-heptadecenoic acid, cis-11-octadecenoic acid, cis,cis,cis-9,12,15-linolenic acid, cis-11-eicosenoic acid, cis,cis-11,14-eicosadienoic acid, behenic acid, cis,cis,cis-11,14,17-eicosatrienoic acid, cis,cis-13,16-docosadienoic acid, all-cis-4,7,10,13,16-docosapentaenoic acid and all-cis-7,10,13,16-docosatetraenoic acid with were significant differences as displayed in Table 2.
Table 2.
Significant fatty acids in GCs of NOR and DOR groups
| Compound name | NOR (n = 3) | DOR (n = 3) | FC b | P-value c | Q-value d | VIP e |
|---|---|---|---|---|---|---|
| Mean a | Mean | |||||
| Pentadecanoic acid | 7.340 | 3.530 | 0.48 | 0.014 | 0.017 | 1.06 |
| cis-10-Pentadecenotic acid | 5.915 | 2.079 | 0.35 | 0.027 | 0.017 | 1.06 |
| tran-9-Palmitoleic acid | 9.236 | 3.887 | 0.42 | 0.045 | 0.017 | 1.05 |
| cis-9-Palmitoleic acid | 28.861 | 11.857 | 0.41 | 0.047 | 0.017 | 1.10 |
| Heptadecanoic acid | 6.446 | 3.066 | 0.48 | 0.045 | 0.017 | 0.94 |
| trans-10-Heptadecenoic acid | 8.002 | 2.783 | 0.35 | 0.032 | 0.017 | 1.09 |
| cis-11-Octadecenoic acid | 44.407 | 21.029 | 0.47 | 0.049 | 0.017 | 1.09 |
| cis,cis,cis-9,12,15-Linolenic acid | 7.587 | 3.018 | 0.40 | 0.013 | 0.017 | 1.17 |
| cis-11-Eicosenoic acid | 15.818 | 10.543 | 0.67 | 0.037 | 0.017 | 1.05 |
| cis,cis-11,14-Eicosadienoic acid | 31.256 | 13.562 | 0.43 | 0.031 | 0.017 | 1.15 |
| Behenic acid | 11.449 | 4.983 | 0.44 | 0.036 | 0.017 | 1.03 |
| cis,cis,cis-11,14,17-Eicosatrienoic acid | 6.382 | 3.088 | 0.48 | 0.010 | 0.017 | 1.12 |
| cis,cis-13,16-Docosadienoic acid | 11.532 | 4.502 | 0.39 | 0.017 | 0.017 | 1.14 |
| All-cis-7,10,13,16-Docosatetraenoic acid | 58.070 | 28.091 | 0.48 | 0.087 | 0.022 | 1.00 |
| All-cis-4,7,10,13,16-Docosapentaenoic acid | 13.101 | 5.955 | 0.45 | 0.050 | 0.017 | 1.06 |
a Mean values were presented as the average value of relative quantitative values of the sample repeated experiments. b The fold change (FC) was presented as the ratio of DOR to NOR. c P-values were presented as using the student’s T-test. d Q-values were implemented to correct for multiple hypothesis tests. e, Variable importance in the projection (VIP) was the importance of variable projection obtained by the OPLS-DA model
Reduced ATP production in DOR patients
The main function of β-oxidation is to produce ATP to cellular energy requirements. We detected the expression of key genes including HADHA, HADHB, ACSL, and CPT1B in the β-oxidation pathway by RT-qPCR. In comparison to the NOR group, the expressions of HADHA and ACSL genes were markedly downregulated in the DOR group (p < 0.05), while HADHB and CPT1B genes had no significant change (Fig. 2). Mitochondrial membrane potential, as a reflection of mitochondrial activity, is a crucial regulator of ATP production. Using JC-1 staining, we further tested changes in mitochondrial membrane potential (ΔΨm), which can be detected by calculating the ratio of red and green fluorescence in GCs. Our results have shown that the ΔΨm levels reduced in the DOR group relative to that of the NOR group were meaningful (1.74 ± 0.13 vs 1.02 ± 0.15%, P < 0.01, Fig. 3b). Moreover, compared with the NOR group, the ability to generate ATP in the DOR group was reduced (39.07 ± 12.89 vs 23.21 ± 13.69%, P < 0.05, Fig. 3c).
Fig. 2.
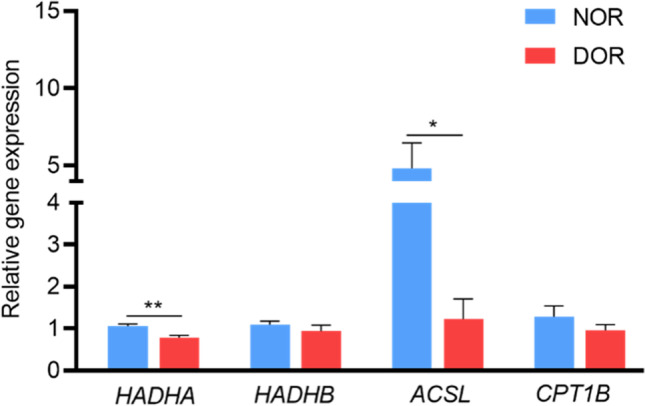
β-oxidation related genes were downregulated in GCs of the DOR group. Relative gene expression levels of HADHA, HADHB, ACSL, and CPT1B in GCs of NOR (n = 30) and DOR (n = 30) groups. The expression levels were normalized to GAPDH. Values were presented as mean ± SEM. *p < 0.05, **p < 0.01 compared with NOR group
Fig. 3.

Mitochondrial membrane potential and ATP levels were decreased in GCs of the DOR group. a Representative images displaying GCs in NOR and DOR groups stained with JC-1 dye. Red and green fluorescence represent JC-1 aggregate and JC-1 monomer fluorescence, respectively. b Ratios of red to green JC-1 fluorescence in GCs of NOR (n = 6) and DOR (n = 6) groups. c ATP levels in GCs of NOR (n = 10) and DOR (n = 10) groups. Values were presented as mean ± SEM. *p < 0.05, **p < 0.01 compared with NOR group
DNA damage induced GC apoptosis in DOR patients
Key genes (ATM, PRKDC, MRE11, and RAD50) involved in DNA repair were examined. Among them, the gene expression levels of PRKDC and RAD50 in the GCs of the DOR group were notably lower than that in the NOR group, while the gene expression levels of ATM and MRE11 were not significant (Fig. 4a). We analyzed γH2AX foci (a specific marker of DNA DSBs) in GCs from the NOR and DOR groups. Our results showed that the ratio of γH2AX foci/nucleus was notably increased in GCs from the DOR group compared to the NOR group (0.31 ± 0.03 vs 0.87 ± 0.07, P < 0.001, Fig. 4b). We also found that the rate of apoptosis in the GCs of the DOR group was remarkably higher than the rate of the NOR group (6.43 ± 2.11 vs 48.06 ± 6.72%, P < 0.01, Fig. 4c). There was no obvious change in the cell cycle between the two groups (Fig. 1S).
Fig. 4.

DNA damage and apoptosis levels were increased in GCs of the DOR group. a Relative gene expression levels of ATM, PRKDC, MRE11, and RAD50 in GCs of NOR (n = 30) and DOR (n = 30) groups. The expression levels were normalized to GAPDH. b γH2AX foci in GCs of NOR (n = 6) and DOR (n = 6) groups. GCs were labeled with DAPI (blue) and γH2AX (red). Scale bar = 100 μm. c The apoptosis of GCs in NOR (n = 6) and DOR (n = 6) groups. N: NOR; D: DOR. Values were presented as mean ± SEM. *p < 0.05, **p < 0.01, and ***p < 0.001 compared with NOR group
Discussion
DOR is a complex reproductive endocrine disease caused by a combination of multiple etiologies. As DOR is a serious threat to female reproductive health, its pathogenesis needs to be further clarified. The symbiotic relationship between GCs and oocytes is a key step for oocyte development and maturation [24]. Analysis of GCs fatty acids changes may elucidate the pathogenic mechanism of DOR.
It is known that fatty acid metabolism has played a crucial character in fertility. Fatty acids are essential substrates of oocyte development, and their imbalance plays a vital role in ovarian diseases [25, 26]. Altering the proportion of specific fatty acids in the daily diet or in vitro culture medium can cause disorder in oocyte and embryo development, further leading to infertility [27]. A large amount of fatty acids in the follicular fluid can predict oocyte development [28]. Our results indicated that fatty acids in GCs of the DOR group were markedly decreased (Fig. 1 and Table 2). Thus, fatty acids decreased in GCs may be the cause of DOR development. But on the basis of the clinical data, we have not found any significance of the serum TC, TG, HDL, and LDL levels (Table 1). The reasons for the fatty acid levels were decreased in GCs need to be further explored and studied experimentally in the future. Fatty acids are further metabolized by β-oxidation to generate ATP, which is essential for oocyte maturation [29]. Adding the β-oxidation inhibitors (e.g., etomoxir and mildronate) dose-dependently inhibited oocyte maturation [6]. Our RT-qPCR results indicated that HADHA and ACSL, key genes for β-oxidation, were significantly down-regulated (Fig. 2). In addition, the ATP levels were reduced in the DOR group significantly (Fig. 3c). So, fatty acid β-oxidation was decreased in DOR patients. Decreased β-oxidation leads to poor oocyte quality [30]. It has been reported that inhibition of HADHA and ACSL activity interfered with oocyte development and maturation [31, 32]. The relative deficiency of ATP might lead to poor oocyte developmental potential [33]. Therefore, decreased fatty acid metabolism with reduced ATP production in GCs may be responsible for DOR pathogenesis.
Fatty acids are an important composition of mitochondrial membranes, and they make a contribution to maintaining the integrity of mitochondrial structure and function. Linolenic acid in GCs decreased obviously in the DOR group (Table 2). Linoleic acid plays a crucial role in the mitochondrial membranes [34]. Decreased fatty acids have an important impact on mitochondrial membrane potential. The mitochondrial membrane potential levels were notably reduced in the GCs of the DOR group compared to the NOR group (Fig. 3a, 3b). Reduced mitochondrial membrane potential in GCs correlated with low numbers of oocytes retrieved in IVF [35]. Mitochondrial membrane potential is also directly linked to ATP production. Xu et al. found that reduced mitochondrial membrane potential and ATP production activated GC apoptosis [36]. GC apoptosis may contribute to decreased oocyte maturation rate and fertilization rate [37]. Hence, mitochondrial membrane potential may be an essential factor for DOR development.
Fatty acids play a significant role in maintaining cellular and DNA protection. Decreased fatty acids in the blood or diet caused DNA damage [15, 38]. DNA repair systems ensure the integrity of DNA by removing or tolerating damage. Our results showed that DSBs (γH2AX foci/nucleus ratio) were notably increased in the DOR group (Fig. 4b). The DNA repair genes PRKDC and RAD50 were markedly downregulated in the GCs of the DOR group (Fig. 4a). These results showed increased DNA damage and decreased DNA repair capacity in GCs of DOR patients. The decline in DNA repair capacity was linked to ovular quantity and quality decreasing [39, 40]. GC apoptosis occurs when DNA damage cannot be repaired [41]. The ratio of apoptosis in GCs of the DOR group was remarkably higher than the ratio of the NOR group (Fig. 4c). GC apoptosis in DOR patients was correlated with poor ovarian response and oocyte yield [21]. Follicular atresia caused by GC apoptosis is a predisposing factor for DOR [42].
Fatty acids affect the occurrence of DOR through multiple pathways. Various fatty acids play parts in the development of oocytes and early embryos, such as pentadecanoic, palmitoleic, octadecenoic, linolenic, docosapentaenoic, eicosapentaenoic, and docosahexaenoic acids [43]. Compared with the NOR group, pentadecanoic, palmitoleic, octadecenoic, linolenic and docosapentaenoic acids were decreased in DOR patients’ GCs in a significant way (Table 2). Pentadecanoic acid was a positive correlation with cleavage rate during IVF-ET cycles [44]. Alterations in the levels of palmitoleic acid and octadecenoic acid had a significant effect on embryonic development [45, 46]. Both linolenic acid and docosapentaenoic acid are polyunsaturated fatty acids. Linolenic acid plays a critical role during embryonic development at the four-cell stage [47]. Docosapentaenoic acid was positively correlated with the number of primordial follicles [48]. It has been reported that pentadecanoic acid, palmitoleic acid, and octadecenoic acid were related to estrogen levels to some extent [49]. Estrogen was essential for oocyte maturation and embryonic development [50]. Arachidonic acid was derived as linolenic acid and was involved in the synthesis of prostaglandins [51]. Arachidonic acid has actively participated in many processes, including oocyte development, maturation, and ovulation [52]. Fatty acids are essential for ATP production, DNA damage, and hormone synthesis. Fatty acids have a wide application perspective. Fatty acids supplementation in vitro maturation (IVM) medium may help to promote embryonic development [53]. The intake of fatty acids improves embryo quality [54]. Further studies are still needed on the clinical application of fatty acids.
There are a few limitations to our study. Due to methodological and ethical limitations, it was difficult to design human experiments to confirm these complex interrelationships of decreased fatty acids, reduced ATP production, increased DNA damage, and increased apoptosis in GCs of DOR patients. But these complex causal interrelationships have only been confirmed in animal and cellular experiments by many studies. These complex interrelationships may be but one way to examine the DOR problem in humans. It could provide leads for future experiments to investigate the DOR mechanism.
In conclusion, the GC apoptosis resulting from the decrease of fatty acids with reduced ATP production and DNA damage may be responsible for the pathogenic mechanism of DOR. Fatty acid supplementation in GCs may provide clinical guidance for DOR therapy.
Supplementary Information
Below is the link to the electronic supplementary material.
Acknowledgements
This research was supported by the National Natural Science Foundation of China(No.81960278), the Outstanding Youth Funds of Science and Technology Department of Gansu Province (No.20JR5RA371)(No.20JR10RA701), and Fundamental Research Funds for the Central Universities (No.lzujbky-2021-kd38)
Declarations
Ethics approval
The study was approved by the ethics committee of the First Hospital of Lanzhou University (LDYYLL2019-44).
Consent to participate
Available.
Conflict of interest
The authors declare no competing interests.
Footnotes
Publisher's note
Springer Nature remains neutral with regard to jurisdictional claims in published maps and institutional affiliations.
References
- 1.Greene AD, Patounakis G, Segars JH. Genetic associations with diminished ovarian reserve: a systematic review of the literature. J Assist Reprod Genet. 2014;31(8):935–946. doi: 10.1007/s10815-014-0257-5. [DOI] [PMC free article] [PubMed] [Google Scholar]
- 2.Pal L, Bevilacqua K, Santoro NF. Chronic psychosocial stressors are detrimental to ovarian reserve: a study of infertile women. J Psychosom Obstet Gynaecol. 2010;31(3):130–139. doi: 10.3109/0167482X.2010.485258. [DOI] [PubMed] [Google Scholar]
- 3.Mutlu MF, Erdem A. Evaluation of ovarian reserve in infertile patients. J Turk Ger Gynecol Assoc. 2012;13(3):196–203. doi: 10.5152/jtgga.2012.28. [DOI] [PMC free article] [PubMed] [Google Scholar]
- 4.Gilchrist RB, Ritter LJ, Armstrong DT. Oocyte-somatic cell interactions during follicle development in mammals. Anim Reprod Sci. 2004;82–83:431–446. doi: 10.1016/j.anireprosci.2004.05.017. [DOI] [PubMed] [Google Scholar]
- 5.Dunning KR, Russell DL, Robker RL. Lipids and oocyte developmental competence: the role of fatty acids and β-oxidation. Reproduction. 2014;148(1):R15–27. doi: 10.1530/REP-13-0251. [DOI] [PubMed] [Google Scholar]
- 6.Downs SM, Mosey JL, Klinger J. Fatty acid oxidation and meiotic resumption in mouse oocytes. Mol Reprod Dev. 2009;76(9):844–853. doi: 10.1002/mrd.21047. [DOI] [PMC free article] [PubMed] [Google Scholar]
- 7.Sturmey RG, O'Toole PJ, Leese HJ. Fluorescence resonance energy transfer analysis of mitochondrial:lipid association in the porcine oocyte. Reproduction. 2006;132(6):829–837. doi: 10.1530/REP-06-0073. [DOI] [PubMed] [Google Scholar]
- 8.Dunning KR, et al. Beta-oxidation is essential for mouse oocyte developmental competence and early embryo development. Biol Reprod. 2010;83(6):909–918. doi: 10.1095/biolreprod.110.084145. [DOI] [PubMed] [Google Scholar]
- 9.Zhao Z, et al. The mRNA expression signature and prognostic analysis of multiple fatty acid metabolic enzymes in clear cell renal cell carcinoma. J Cancer. 2019;10(26):6599–6607. doi: 10.7150/jca.33024. [DOI] [PMC free article] [PubMed] [Google Scholar]
- 10.Bradley J, Swann K. Mitochondria and lipid metabolism in mammalian oocytes and early embryos. Int J Dev Biol. 2019;63(3–4–5):93–103. doi: 10.1387/ijdb.180355ks. [DOI] [PubMed] [Google Scholar]
- 11.Dunning KR, et al. Increased beta-oxidation and improved oocyte developmental competence in response to l-carnitine during ovarian in vitro follicle development in mice. Biol Reprod. 2011;85(3):548–555. doi: 10.1095/biolreprod.110.090415. [DOI] [PubMed] [Google Scholar]
- 12.Nagata S, et al. Effect of aging on mitochondria and metabolism of bovine granulosa cells. J Reprod Dev. 2020;66(6):547–554. doi: 10.1262/jrd.2020-071. [DOI] [PMC free article] [PubMed] [Google Scholar]
- 13.Ge H, et al. The importance of mitochondrial metabolic activity and mitochondrial DNA replication during oocyte maturation in vitro on oocyte quality and subsequent embryo developmental competence. Mol Reprod Dev. 2012;79(6):392–401. doi: 10.1002/mrd.22042. [DOI] [PubMed] [Google Scholar]
- 14.Babayev E, Seli E. Oocyte mitochondrial function and reproduction. Curr Opin Obstet Gynecol. 2015;27(3):175–181. doi: 10.1097/GCO.0000000000000164. [DOI] [PMC free article] [PubMed] [Google Scholar]
- 15.de Barros TT, et al. DNA damage is inversely associated to blood levels of DHA and EPA fatty acids in Brazilian children and adolescents. Food Funct. 2020;11(6):5115–5121. doi: 10.1039/C9FO02551K. [DOI] [PubMed] [Google Scholar]
- 16.Zhang D, et al. Increased DNA damage and repair deficiency in granulosa cells are associated with ovarian aging in rhesus monkey. J Assist Reprod Genet. 2015;32(7):1069–1078. doi: 10.1007/s10815-015-0483-5. [DOI] [PMC free article] [PubMed] [Google Scholar]
- 17.Qian M, et al. Boosting ATM activity alleviates aging and extends lifespan in a mouse model of progeria. Elife. 2018;7.e348360 [DOI] [PMC free article] [PubMed]
- 18.Lee JH, Paull TT. ATM activation by DNA double-strand breaks through the Mre11-Rad50-Nbs1 complex. Science. 2005;308(5721):551–554. doi: 10.1126/science.1108297. [DOI] [PubMed] [Google Scholar]
- 19.Goodwin JF, Knudsen KE. Beyond DNA repair: DNA-PK function in cancer. Cancer Discov. 2014;4(10):1126–1139. doi: 10.1158/2159-8290.CD-14-0358. [DOI] [PMC free article] [PubMed] [Google Scholar]
- 20.Roos WP, Kaina B. DNA damage-induced cell death: from specific DNA lesions to the DNA damage response and apoptosis. Cancer Lett. 2013;332(2):237–248. doi: 10.1016/j.canlet.2012.01.007. [DOI] [PubMed] [Google Scholar]
- 21.Fan Y, et al. Apoptosis of mural granulosa cells is increased in women with diminished ovarian reserve. J Assist Reprod Genet. 2019;36(6):1225–1235. doi: 10.1007/s10815-019-01446-5. [DOI] [PMC free article] [PubMed] [Google Scholar]
- 22.Cil AP, et al. Assessment of ovarian reserve and Doppler characteristics in patients with multiple sclerosis using immunomodulating drugs. J Turk Ger Gynecol Assoc. 2009;10(4):213–219. [PMC free article] [PubMed] [Google Scholar]
- 23.Testing and interpreting measures of ovarian reserve: a committee opinion. Fertil Steril. 2020;114(6):1151-1157. [DOI] [PubMed]
- 24.Li R, Albertini DF. The road to maturation: somatic cell interaction and self-organization of the mammalian oocyte. Nat Rev Mol Cell Biol. 2013;14(3):141–152. doi: 10.1038/nrm3531. [DOI] [PubMed] [Google Scholar]
- 25.Huang R, et al. Alterations of polyunsaturated fatty acid metabolism in ovarian tissues of polycystic ovary syndrome rats. J Cell Mol Med. 2018;22(7):3388–3396. doi: 10.1111/jcmm.13614. [DOI] [PMC free article] [PubMed] [Google Scholar]
- 26.Sawyer BT, et al. Targeting fatty acid oxidation to promote anoikis and inhibit ovarian cancer progression. Mol Cancer Res. 2020;18(7):1088–1098. doi: 10.1158/1541-7786.MCR-19-1057. [DOI] [PMC free article] [PubMed] [Google Scholar]
- 27.McKeegan PJ, Sturmey RG. The role of fatty acids in oocyte and early embryo development. Reprod Fertil Dev. 2011;24(1):59–67. doi: 10.1071/RD11907. [DOI] [PubMed] [Google Scholar]
- 28.O'Gorman A, et al. Metabolic profiling of human follicular fluid identifies potential biomarkers of oocyte developmental competence. Reproduction. 2013;146(4):389–395. doi: 10.1530/REP-13-0184. [DOI] [PubMed] [Google Scholar]
- 29.Dubeibe Marin DF, et al. Importance of lipid metabolism on oocyte maturation and early embryo development: can we apply what we know to buffalo? Anim Reprod Sci. 2019;211:106220. doi: 10.1016/j.anireprosci.2019.106220. [DOI] [PubMed] [Google Scholar]
- 30.Dunning KR, et al. Regulation of fatty acid oxidation in mouse cumulus-oocyte complexes during maturation and modulation by PPAR agonists. PLoS One. 2014;9(2):e87327. doi: 10.1371/journal.pone.0087327. [DOI] [PMC free article] [PubMed] [Google Scholar]
- 31.Ohata K, et al. Effects of fatty acid supplementation during vitrification and warming on the developmental competence of mouse, bovine and human oocytes and embryos. Reprod Biomed Online. 2021;43(1):14–25. doi: 10.1016/j.rbmo.2021.03.022. [DOI] [PubMed] [Google Scholar]
- 32.Wang HW, et al. Activity of long-chain acyl-CoA synthetase is required for maintaining meiotic arrest in Xenopus laevis. Biol Reprod. 2012;87(3):74. doi: 10.1095/biolreprod.112.100511. [DOI] [PubMed] [Google Scholar]
- 33.Igarashi H, et al. Aged mouse oocytes fail to readjust intracellular adenosine triphosphates at fertilization. Biol Reprod. 2005;72(5):1256–1261. doi: 10.1095/biolreprod.104.034926. [DOI] [PubMed] [Google Scholar]
- 34.Sullivan EM, et al. Mechanisms by which dietary fatty acids regulate mitochondrial structure-function in health and disease. Adv Nutr. 2018;9(3):247–262. doi: 10.1093/advances/nmy007. [DOI] [PMC free article] [PubMed] [Google Scholar]
- 35.Dumesic DA, et al. Cumulus cell mitochondrial resistance to stress in vitro predicts oocyte development during assisted reproduction. J Clin Endocrinol Metab. 2016;101(5):2235–2245. doi: 10.1210/jc.2016-1464. [DOI] [PubMed] [Google Scholar]
- 36.Xu G, et al. Cadmium induces apoptosis of human granulosa cell line KGN via mitochondrial dysfunction-mediated pathways. Ecotoxicol Environ Saf. 2021;220:112341. doi: 10.1016/j.ecoenv.2021.112341. [DOI] [PubMed] [Google Scholar]
- 37.Lee KS, et al. Cumulus cells apoptosis as an indicator to predict the quality of oocytes and the outcome of IVF-ET. J Assist Reprod Genet. 2001;18(9):490–498. doi: 10.1023/A:1016649026353. [DOI] [PMC free article] [PubMed] [Google Scholar]
- 38.Banim PJ, et al. Dietary oleic acid is inversely associated with pancreatic cancer - data from food diaries in a cohort study. Pancreatology. 2018;18(6):655–660. doi: 10.1016/j.pan.2018.07.004. [DOI] [PubMed] [Google Scholar]
- 39.Winship AL, et al. The importance of DNA repair for maintaining oocyte quality in response to anti-cancer treatments, environmental toxins and maternal ageing. Hum Reprod Update. 2018;24(2):119–134. doi: 10.1093/humupd/dmy002. [DOI] [PubMed] [Google Scholar]
- 40.Stringer JM, et al. The capacity of oocytes for DNA repair. Cell Mol Life Sci. 2018;75(15):2777–2792. doi: 10.1007/s00018-018-2833-9. [DOI] [PMC free article] [PubMed] [Google Scholar]
- 41.Bedoschi GM, Navarro PA, Oktay KH. Novel insights into the pathophysiology of chemotherapy-induced damage to the ovary. Panminerva Med. 2019;61(1):68–75. doi: 10.23736/S0031-0808.18.03494-8. [DOI] [PubMed] [Google Scholar]
- 42.Glamoclija V, et al. Apoptosis and active caspase-3 expression in human granulosa cells. Fertil Steril. 2005;83(2):426–431. doi: 10.1016/j.fertnstert.2004.06.075. [DOI] [PubMed] [Google Scholar]
- 43.Stoffel W, et al. Dietary ω3-and ω6-polyunsaturated fatty acids reconstitute fertility of juvenile and adult Fads2-deficient mice. Mol Metab. 2020;36:100974. doi: 10.1016/j.molmet.2020.100974. [DOI] [PMC free article] [PubMed] [Google Scholar]
- 44.Zarezadeh R, et al. Fatty acids of follicular fluid phospholipids and triglycerides display distinct association with IVF outcomes. Reprod Biomed Online. 2021;42(2):301–309. doi: 10.1016/j.rbmo.2020.09.024. [DOI] [PubMed] [Google Scholar]
- 45.Yang Y, et al. Metabolic changes of maternal uterine fluid, uterus, and plasma during the peri-implantation period of early pregnancy in mice. Reprod Sci. 2020;27(2):488–502. doi: 10.1007/s43032-019-00040-5. [DOI] [PubMed] [Google Scholar]
- 46.Karaşahin T. The effect of oleic and linoleic acid addition to the culture media on bovine embryonic development following vitrification. Pol J Vet Sci. 2019;22(4):661–666. doi: 10.24425/pjvs.2019.129978. [DOI] [PubMed] [Google Scholar]
- 47.Haggarty P, et al. Fatty acid metabolism in human preimplantation embryos. Hum Reprod. 2006;21(3):766–773. doi: 10.1093/humrep/dei385. [DOI] [PubMed] [Google Scholar]
- 48.Hohos NM, et al. Fat-1 transgene is associated with improved reproductive outcomes. Endocrinology. 2018;159(12):3981–3992. doi: 10.1210/en.2018-00723. [DOI] [PMC free article] [PubMed] [Google Scholar]
- 49.Sun X, et al. Research on serum metabolomics of ovariectomized rats and intervention effect of Cuscuta chinensis on metabolic pattern. J Pharm Biomed Anal. 2021;195:113847. doi: 10.1016/j.jpba.2020.113847. [DOI] [PubMed] [Google Scholar]
- 50.Wu TC, Wang L, Wan YJ. Expression of estrogen receptor gene in mouse oocyte and during embryogenesis. Mol Reprod Dev. 1992;33(4):407–412. doi: 10.1002/mrd.1080330406. [DOI] [PubMed] [Google Scholar]
- 51.Panagiotopoulos AA, et al. Eicosanoids in prostate cancer. Cancer Metastasis Rev. 2018;37(2–3):237–243. doi: 10.1007/s10555-018-9750-0. [DOI] [PubMed] [Google Scholar]
- 52.Khajeh M, et al. Potential role of polyunsaturated fatty acids, with particular regard to the signaling pathways of arachidonic acid and its derivatives in the process of maturation of the oocytes: contemporary review. Biomed Pharmacother. 2017;94:458–467. doi: 10.1016/j.biopha.2017.07.140. [DOI] [PubMed] [Google Scholar]
- 53.Hoyos-Marulanda V, et al. Effects of polyunsaturated fatty acids on the development of pig oocytes in vitro following parthenogenetic activation and on the lipid content of oocytes and embryos. Anim Reprod Sci. 2019;205:150–155. doi: 10.1016/j.anireprosci.2019.05.003. [DOI] [PubMed] [Google Scholar]
- 54.Jahangirifar M, et al. Dietary fatty acid intakes and the outcomes of assisted reproductive technique in infertile women. J Reprod Infertil. 2021;22(3):173–183. doi: 10.18502/jri.v22i3.6718. [DOI] [PMC free article] [PubMed] [Google Scholar]
Associated Data
This section collects any data citations, data availability statements, or supplementary materials included in this article.