

Abstract
Objective
Examine whether Medicare Advantage (MA) coverage is associated with more efficient prescribing of Part B drugs than traditional Medicare (TM) coverage.
Data Sources
Twenty percent sample of 2016 outpatient and carrier TM claims and MA encounter records and Master Beneficiary Summary File data.
Study Design
We analyzed whether MA enrollees compared to TM enrollees more often received the low‐cost Part B drug in four clinical scenarios where multiple similarly effective drugs exist: (1) anti‐VEGF agents to treat macular degeneration, (2) bone resorption inhibitors for osteoporosis, (3) bone resorption inhibitors for malignant neoplasms, and (4) intravenous iron for iron deficiency anemia. We then estimated differences in spending if TM prescribing aligned with MA prescribing. Finally, using linear probability models, we examined whether differences in MA and TM prescribing patterns were attributable to differences in the hospitals and clinician practices who treat MA and TM enrollees or differences in how these hospitals and clinician practices treat their MA versus TM patients.
Data Collection/Extraction Methods
Not applicable.
Principal Findings
In all cases, a larger share of MA enrollees received the low‐cost drug compared to TM enrollees, ranging from 8 percentage points higher for anemia to 16 percentage points higher for macular degeneration in the unadjusted analysis. Results were similar in regression analyses controlling for enrollee characteristics and market factors (5–13 percentage points). If TM prescribing matched MA prescribing, we estimated savings ranging from 6% to 20% of TM spending for each scenario. Differences in prescribing patterns were driven both by MA enrollees receiving treatment at more efficient hospitals and clinician practices and hospitals and clinician practices more often prescribing low‐cost drugs to their MA patients.
Conclusions
Our findings show MA enrollees were more likely than TM enrollees to receive low‐cost Part B drugs in four clinical scenarios where multiple similarly or equally effective treatment options exist.
Keywords: drug costs, Medicare, Medicare Part B/economics, Medicare Part C, prescription drugs, reimbursement mechanisms
What is known on this topic
The current traditional Medicare reimbursement system for Part B drugs incentivizes clinician practices and hospital outpatient departments to prescribe more expensive drugs.
Medicare Advantage insurers have a financial incentive to reduce spending on medical services, but it is unknown whether Medicare Advantage coverage reduces wasteful spending on Part B drugs.
There is limited research on whether Medicare Advantage coverage is associated with more efficient or higher quality treatment, and the existing studies have mixed results.
What this study adds
Medicare Advantage coverage was associated with more efficient prescribing of Part B drugs in four scenarios where multiple similarly effective treatments were available.
Medicare Advantage enrollees received treatment at hospitals and clinician practices that favored prescribing lower cost Part B drugs.
In addition, within hospitals and clinician practices, Medicare Advantage enrollees more often received low‐cost drugs than traditional Medicare enrollees.
1. INTRODUCTION
Medicare spending on Part B drugs (i.e., clinician‐administered injections and infusions) grew 9.6% annually from 2009 to 2017, which is more than double the 4.4% annual increase in overall Medicare spending. 1 The growth in Part B drug spending is projected to continue and places an increasing financial burden on the Medicare program and enrollees, as enrollees without supplemental coverage are typically responsible for 20% co‐insurance. 2 Numerous sources, including MedPAC 1 and ASPE, 2 attribute the growth in spending at least in part to incentives embedded in the Medicare reimbursement system for these drugs.
For Part B drugs, in traditional Medicare (TM), clinician practices and hospital outpatient departments are reimbursed based on the average sales price (ASP) of the drug plus a 4.3% add‐on payment (by statute, the add‐on payment is 6%, but the add‐on payment was reduced to 4.3% due to the sequestration provision in the Budget Control Act of 2011). 3 This method of payment creates a higher reimbursement rate for more expensive drugs and may incentivize prescribers to select high‐cost rather than low‐cost drugs. Consistent with this incentive, several studies show that when a similarly or equally effective low‐cost Part B drug exists, clinicians in many hospitals and practices prescribe the high‐cost option. 4 , 5 , 6 , 7
The evidence to date on prescribing of Part B drugs has been limited to TM. A growing proportion of Medicare beneficiaries, however, now receives their coverage through Medicare Advantage (MA), making it increasingly important to extend studies to include these individuals. Further, differences in the financial incentives in MA compared to TM suggest that MA coverage may be associated with more efficient prescribing of Part B drugs, further raising the value of studying Part B prescribing in MA. 8 It has only recently become possible to examine prescribing of Part B drugs in MA, as MA encounter data were not historically released to researchers.
The MA program engages private insurers to manage the care of Medicare beneficiaries by paying the MA insurers a capitated per member per month payment to cover the medical needs of their enrollees. This incentivizes MA insurers to reduce spending under the medical (Part B) benefit, including on Part B drugs. In other clinical settings, such as postacute care and opioid prescribing, MA coverage was found to be associated with reduced spending and better clinical outcomes. 9 , 10 , 11 , 12 , 13 , 14 To date, there is no evidence we are aware of whether MA coverage is associated with more efficient prescribing of Part B drugs.
In contrast to TM, MA insurers may be able to reduce Part B drug spending through tools such as prior authorization for high‐cost drugs, by changing how they pay in‐network hospitals and clinician practices, or by selecting which hospitals and clinician practices they will include in their network. Based on negotiated contracts, MA insurers may reimburse clinicians with a fee‐for‐service payment, for example, ASP plus a percentage add‐on payment. Another option is for MA insurers to pay hospitals and clinician practices a capitated amount based on a larger set of services the hospital or clinician practice provides, thus also incentivizing their in‐network hospitals and clinician practices to reduce spending. 15
We sought to understand whether MA coverage leads to more efficient prescribing (i.e., higher use of low‐cost drugs when both low‐cost and high‐cost drugs are available) compared to TM. If MA insurers are able to incentivize more efficient use of these drugs, this could have broader implications for reforming Part B drug payment and reducing wasteful spending on Part B drugs. These findings would inform ongoing policy efforts to identify and implement payment models to reduce Medicare and enrollee spending on Part B drugs, including recent bills in both chambers of Congress and innovation models from the Centers for Medicare and Medicaid Services (CMS). 16 , 17 , 18
We used TM claims and MA encounter records to provide the first evidence on whether MA is able to manage costs of Part B drugs by incentivizing use of lower cost drugs where they exist. Specifically, we sought to address two research questions. First, are MA enrollees more likely to get the low‐cost drug in four clinical scenarios where similar or equally effective drugs exist? Second, are differences between TM and MA prescribing due to differences in the hospitals/clinician practices that typically treat TM and MA enrollees (cross‐clinician organization differences) or differences in how hospitals/clinician practices prescribe for TM and MA enrollees (within‐clinician organization differences) or a combination of the two factors?
2. METHODS
2.1. Data and sample
To conduct this study, we used TM claims and MA encounter data from 2016, including a 20% sample of TM outpatient and carrier (clinician) claims and a 20% sample of MA outpatient and carrier encounter records. These data allow us to identify which drugs enrollees received, the associated diagnosis codes, and the hospital or clinician practice where the enrollee was administered the drug.
The MA encounter data have only recently become available to researchers, and considerable attention has been paid to the quality of the data. Organizations such as the Government Accountability Office (GAO), 19 the HHS Office of the Inspector General (OIG), 20 and MedPAC 21 have reviewed the accuracy and completeness of the 2014 and 2015 data. While the reviews identified several weaknesses 22 including a high volume of missing home health claims and inaccurate information on clinician specialty, the data files used for this study (carrier and outpatient records) were found to be mostly complete, and these reviews did not raise concerns about the primary data element we drew from these files (Healthcare Common Procedure Coding System [HCPCS] procedure code). We also chose to use the 2016 data rather than 2015 data, as data accuracy and completeness is improving each year, and this was the most recent data available at the time we began analysis. These data have been used for several other studies evaluating MA. 23 , 24
We obtained enrollee sociodemographic characteristics and insurance plan details from the 2016 Master Beneficiary Summary File (MBSF) and used the 2016 outpatient, carrier, and inpatient files to calculate Elixhauser comorbidity index scores. 25 , 26 If the enrollee has MA coverage, the MBSF indicates for each month the specific contract the enrollee is covered by. Contracts are uniquely identified by contract ID and are a collection of MA plans for one or more counties for a single MA insurer.
We restricted our sample to older adults (65+) residing in one of the 50 states or Washington, DC. We also required continuous enrollment in TM or MA health maintenance organization (HMO) or preferred provider organization (PPO) coverage beginning in January either until December or until the month of death. For each clinical setting described below, we restricted the analysis to enrollees who received one of the low‐cost or high‐cost drugs who were treated for a specific clinical condition (defined based on diagnosis codes) where the drug and its alternative(s) are considered similarly or equally effective. We required that the diagnosis code appear on the same claim/encounter record as the drug HCPCS code. For full details on our sample inclusion and exclusion, please see Figure S1 and Methods S1 of Supporting information.
2.2. Clinical settings
We compared Part B drugs received by MA and TM enrollees in four clinical scenarios where there are multiple drugs available which are similarly or equally effective but with costs that vary substantially. External factors such as supply issues, marketing, provider, and patient preferences may influence prescribing and exchangeability; however, we focused on clinical indications where the drugs are exchangeable per published clinical literature/guidelines 27 , 28 , 29 , 30 , 31 , 32 , 33 , 34 , 35 , 36 , 37 , 38 , 39 and applied exclusion criteria to remove beneficiaries with a clinical indication causing one of the drugs to be contraindicated or less effective.
For scenario #1, we examined prescribing of bevacizumab, aflibercept, and ranibizumab, which are antivascular endothelial growth factor (anti‐VEGF) agents that can be injected into the eye. These drugs are considered equally effective at slowing the progression of vision loss due to macular degeneration. 27 , 28 , 29 , 30 , 31 While each drug is commonly used to treat macular degeneration, the costs differ substantially; the average per‐dose costs observed in the TM claims for aflibercept and ranibizumab was more than 28 times the cost of bevacizumab (Table S1).
For the second and third scenarios, we examined prescribing of the bone resorption inhibitors denosumab and zoledronic acid, which are used for osteoporosis (scenario #2) and for malignant neoplasms (scenario #3). 32 , 33 , 34 Denosumab has somewhat better efficacy at increasing bone mineral density, but most studies do not show differences in fracture reduction between the two drugs. 35 For postmenopausal osteoporosis, the clinical practice guideline from the American Association of Clinical Endocrinologists and American College of Endocrinology lists both denosumab and zoledronic acid as possible first‐line therapies for the treatment of osteoporosis. 36 As in scenario #1, there are substantial cost differences among these treatment options; for the treatment of osteoporosis, zoledronic acid costs $135 per dose compared to $928 for denosumab. The difference is even greater in the case of malignant neoplasms, where the average cost of a dose of denosumab is close to 20 times more than the average cost of a dose of zoledronic acid.
Finally, for scenario #4, we examined prescribing of intravenous iron to treat iron deficiency anemia. Ferric carboxymaltose and iron dextran are considered similarly safe and effective. 37 , 38 , 39 Yet, the cost per dose for ferric carboxymaltose was more than six times the cost per dose for iron dextran.
2.3. Study design
We first compared the sociodemographic and comorbidity characteristics of individuals in each clinical scenario with TM and MA coverage. We summarized the presence of comorbid conditions using the Elixhauser comorbidity index. 25 , 26
We then examined whether MA enrollees were more likely to get the low‐cost drug in each of the four clinical scenarios. For scenario #1, focused on treatment of macular degeneration, the low‐cost drug was bevacizumab. For scenarios #2 and #3, for the treatment of osteoporosis and malignant neoplasms, the low‐cost drug was zoledronic acid. For scenario #4, focused on iron deficiency anemia, the low‐cost drug was iron dextran.
Using Pearson chi‐squared tests, we tested whether there were statistically significant differences in the unadjusted share of individuals with MA versus TM coverage who received the low‐cost drug alternative for each scenario. We considered differences to be statistically significant if the two‐sided p‐value was below 0.05.
MA and TM enrollees differ on sociodemographic and clinical characteristics, which may affect the likelihood that an enrollee selects MA or TM coverage, as well as the likelihood that the enrollee is prescribed the low‐cost drug. 40 Additionally, market factors such as drug supply chains and MA penetration may affect whether a beneficiary receives the low‐cost drug. 41 To account for these sociodemographic, clinical, and market factors, we employed the following specification to estimate the adjusted difference in the probability that an MA versus TM enrollee received the low‐cost drug:
In this linear probability model, Y i is whether an enrollee receives the low‐cost drug. MA i is the independent variable and is a dichotomous variable indicating whether an enrollee had MA coverage in 2016. X i is a vector of categorical variables for an enrollee's age, sex, dual‐eligible status, race, and number of comorbid conditions calculated using the Elixhauser comorbidity index. 25 , 26 W c is a vector of county‐level‐fixed effects, and we clustered standard errors at the county level. Because the data are cross‐sectional, we do not have a time index in the equation.
To quantify the difference in prescribing patterns, we estimated the change in spending for TM if TM prescribing patterns aligned with MA prescribing patterns for each scenario.
Finally, we sought to understand whether differences in prescribing were attributable to differences in the hospitals/clinician practices that treat TM and MA enrollees or differences in how hospitals/clinician practices prescribe for TM versus MA enrollees. We identified clinician practices based on tax number and hospitals based on organizational NPI. We examined whether there was variation in how often enrollees received the low‐cost drug across hospitals and clinician practices, as a lack of variation would mean that differences in prescribing could not be attributed to different hospitals and clinician practices typically treating TM and MA enrollees.
We then ran alternative versions of the linear probability models with hospital and clinician practice fixed effects instead of county fixed effects, to examine whether MA enrollees were more likely to receive the low‐cost drug than TM enrollees within hospitals and clinician practices. A positive coefficient for MA coverage would indicate that hospitals and clinician practices more often prescribe the low‐cost drug to their MA patients compared to TM patients.
We also used results from this regression with hospital‐ and clinician practice‐fixed effects to determine whether MA enrollees were more often treated at hospitals and clinician practices that favored prescribing low‐cost part B drugs. We compared the coefficient for MA coverage from the regression with county‐fixed effects (model 1) to the coefficient for MA coverage from the regression with hospital‐ and clinician‐fixed effects (model 2). A smaller, positive coefficient for MA coverage from model 2 compared to the coefficient for MA coverage from model 1 indicates that some of the differences in prescribing are attributable to MA enrollees being treated at more efficient hospitals and clinician practices than TM enrollees.
This study was approved by the Johns Hopkins Bloomberg School of Public Health Institutional Review Board (approval #11261). We conducted all analyses in Stata 16.
3. RESULTS
3.1. Description of the study population
In total, 178,023 TM enrollees and 57,710 MA enrollees in our 20% sample met the criteria for one or more of the clinical scenarios (Table 1). For both TM and MA, enrollees were primarily female and White with an average age of nearly 80 years. The share of enrollees that was dually eligible for Medicaid ranged from approximately 10% of TM enrollees who received treatment for macular degeneration to approximately 17% of enrollees with MA coverage who received intravenous iron. Elixhauser scores were similar between TM and MA enrollees for each clinical scenario but varied substantially across scenarios, ranging from an average Elixhauser comorbidity index score of approximately 4 for individuals who received a bone resorption inhibitor for osteoporosis to approximately 8 for individuals who received intravenous iron. For each clinical scenario, a larger share of TM enrollees had an inpatient hospitalization in 2016, with differences ranging from 2.0 percentage points for enrollees receiving treatment for malignant neoplasms to 4.9 percentage points for enrollees receiving treatment for macular degeneration.
TABLE 1.
Characteristics of TM and MA enrollees by clinical scenario, 2016
| Scenario #1 (anti‐VEGF for age‐related macular degeneration) | Scenario #2 (bone resorption inhibitors for osteoporosis) | Scenario #3 (bone resorption inhibitors for malignant neoplasms) | Scenario #4 (intravenous iron for iron deficiency anemia) | |||||
|---|---|---|---|---|---|---|---|---|
| TM | MA | TM | MA | TM | MA | TM | MA | |
| Summary statistic | (n = 71,532) | (n = 25,627) | (n = 81,814) | (n = 23,011) | (n = 15,447) | (n = 5306) | (n = 13,249) | (n = 4685) |
| Demographics | ||||||||
| Female (%) | 63.8% | 62.4% | 92.4% | 93.1% | 38.2% | 36.6% | 65.7% | 66.7% |
| Age (%) | ||||||||
| 65–69 | 4.6% | 5.2% | 16.7% | 18.0% | 20.1% | 17.8% | 20.2% | 20.9% |
| 70–74 | 9.9% | 12.5% | 22.3% | 24.5% | 34.6% | 27.5% | 23.6% | 26.6% |
| 75–79 | 16.3% | 17.8% | 21.6% | 22.6% | 21.9% | 23.3% | 21.4% | 22.8% |
| 80+ | 69.2% | 64.5% | 39.4% | 34.9% | 33.5% | 31.5% | 34.8% | 29.7% |
| Dual eligible (%) | 9.6% | 10.7% | 9.0% | 11.8% | 10.9% | 12.7% | 13.6% | 17.3% |
| Race/ethnicity (%) | ||||||||
| White | 93.7% | 89.6% | 89.9% | 84.5% | 83.8% | 76.0% | 85.7% | 77.3% |
| Black | 1.1% | 2.1% | 2.4% | 3.6% | 8.2% | 13.0% | 7.4% | 13.0% |
| Asian/Pacific Islander | 1.7% | 1.9% | 3.0% | 4.1% | 1.9% | 2.3% | 1.2% | 1.2% |
| Hispanic | 2.5% | 5.5% | 3.2% | 6.4% | 4.0% | 7.1% | 4.1% | 7.4% |
| American Indian/Alaska Native | 0.3% | 0.1% | 0.2% | 0.2% | 0.4% | 0.2% | 0.3% | — a |
| Other/unknown | 0.8% | 0.7% | 1.4% | 1.3% | 1.8% | 1.5% | 1.3% | — b |
| Urbanicity—CBSA (%) | 80.4% | 88.6% | 79.8% | 87.8% | 80.8% | 88.8% | 79.6% | 87.8% |
| Census region of residence (%) | ||||||||
| Midwest | 21.4% | 19.9% | 23.9% | 24.1% | 24.0% | 24.1% | 18.1% | 16.8% |
| Northeast | 21.6% | 22.9% | 15.7% | 17.8% | 18.9% | 20.3% | 12.9% | 15.7% |
| South | 36.2% | 29.9% | 43.0% | 35.7% | 38.4% | 34.6% | 54.0% | 50.6% |
| West | 20.7% | 27.4% | 17.4% | 22.5% | 18.8% | 21.1% | 15.0% | 17.0% |
| Medical utilization | ||||||||
| Any inpatient hospitalization (%) | 23.1% | 18.2% | 19.4% | 15.3% | 39.7% | 37.7% | 47.7% | 43.9% |
| Any ED visit (%) | 38.6% | 34.8% | 35.4% | 32.3% | 52.9% | 53.1% | 58.3% | 57.3% |
| Clinical profile | ||||||||
| Elixhauser comorbidity index (mean and SD) c | 4.6 (3.2) | 4.8 (3.2) | 4.2 (3.1) | 4.3 (3.1) | 6.9 (3.4) | 7.2 (3.5) | 8.4 (3.7) | 8.8 (3.7) |
| Elixhauser comorbidity index score (%) c | ||||||||
| Low (0–2) | 29.5% | 26.3% | 33.2% | 33.6% | 6.1% | 5.3% | 2.9% | 2.1% |
| Medium (3–5) | 38.0% | 37.6% | 38.7% | 37.4% | 33.8% | 30.4% | 20.9% | 19.1% |
| High (6+) | 32.5% | 36.1% | 28.1% | 29.0% | 60.1% | 64.3% | 76.2% | 78.8% |
| Number of claims for clinical scenario (mean and SD) | 5.5 (3.6) | 5.5 (3.9) | 1.4 (0.6) | 1.4 (0.7) | 4.9 (3.8) | 5.0 (4.1) | 2.4 (2.5) | 2.5 (2.8) |
Note: Part B drug use includes claims in Part B carrier and outpatient files and MA encounter carrier and outpatient files. Race/ethnicity is defined based on the RTI race code included in the 2016 master beneficiary summary file (MBSF).
Suppressed due to small cell size.
Suppressed due to small cell size of American Indian/Alaska Native row.
Calculated using carrier, inpatient, and outpatient claims.
Eligible population size (i.e., patients receiving some treatment for the clinical condition and meeting the inclusion/exclusion criteria based on age, location of residence, and type of Medicare coverage) varied across the four clinical settings; in the 20% sample of TM claims and MA encounters, 71,532 TM enrollees and 25,627 MA enrollees received an anti‐VEGF agent to treat age‐related macular degeneration, 81,814 TM enrollees and 23,011 MA enrollees received a bone resorption inhibitor to treat osteoporosis, 15,447 TM enrollees and 5,306 MA enrollees received a bone resorption inhibitor to treat a malignant neoplasm, and 13,249 TM enrollees and 4,685 MA enrollees received intravenous iron for iron deficiency anemia.
3.2. Low‐cost drug use in MA versus TM
In an unadjusted comparison, a statistically significantly larger share of MA enrollees received the low‐cost drug for each of the four scenarios compared to their TM counterparts (Figure 1). For anti‐VEGF agents to treat age‐related macular degeneration, more than 60% of MA enrollees received the lowest‐cost drug compared to just over 45% of TM enrollees (p‐value: <0.001). When bone resorption inhibitors were used to treat osteoporosis, almost one‐third of MA enrollees received the low‐cost drug compared to under a quarter of TM enrollees (p‐value: <0.001). When bone resorption inhibitors were used to treat individuals with malignant neoplasms, close to 40% of MA enrollees received the low‐cost drug compared to just 30% of TM enrollees (p‐value: <0.001). Finally, for intravenous iron, 44% of MA enrollees received the low‐cost drug compared to 37% of TM enrollees (p‐value: <0.001).
FIGURE 1.
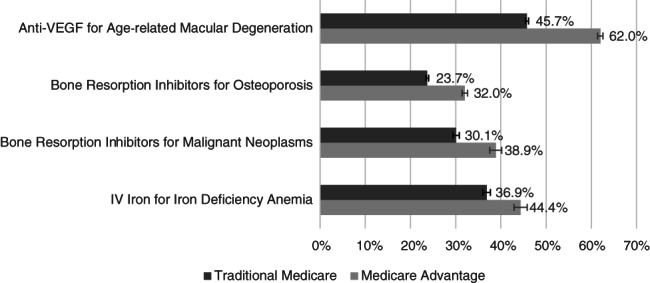
Unadjusted percent of enrollees receiving the low‐cost drug for TM versus MA enrollees, 2016. Error bars indicate 95% confidence intervals. The majority of claims for all drugs in these clinical scenarios occurred in clinician practices with the exception of the low‐cost drug to treat osteoporosis, which was more often administered in a hospital outpatient department (Figure S2)
After adjusting for sociodemographic and clinical characteristics and county fixed effects, MA enrollees had a statistically significantly higher probability of receiving the low‐cost drug in all four clinical scenarios (Table 2). The largest difference was for anti‐VEGF agents, where MA enrollees who were being treated for age‐related macular degeneration had a 13‐percentage point higher probability of receiving the low‐cost drug compared to TM enrollees. For bone resorption inhibitors, MA enrollees had a 6‐percentage point higher probability of receiving the low‐cost drug to treat osteoporosis and an 8‐percentage point higher probability of receiving the low‐cost drug to treat malignant neoplasms compared to TM enrollees. Finally, for intravenous iron, MA enrollees had a 5‐percentage point higher probability of receiving the low‐cost drug compared to TM enrollees. These results were also robust to balancing via propensity scores.
TABLE 2.
Percentage point difference in the probability of a beneficiary receiving a low‐cost drug for MA versus TM enrollees, adjusting for county and sociodemographic and clinical characteristics
| Scenario #1 (anti‐VEGF for age‐related macular degeneration) | Scenario #2 (bone resorption inhibitors for osteoporosis) | Scenario #3 (bone resorption inhibitors for malignant neoplasms) | Scenario #4 (intravenous iron for iron deficiency anemia) | |
|---|---|---|---|---|
| (n = 96,922) | (n = 104,597) | (n = 20,139) | (n = 17,393) | |
| Insurance type | ||||
| TM | Referent | Referent | Referent | Referent |
| MA | 13.4 [11.7; 15.0]*** | 5.6 [3.7; 7.6]*** | 8.4 [5.9; 11.0]*** | 5.3 [2.4; 8.2]*** |
| Gender | ||||
| Male | Referent | Referent | Referent | Referent |
| Female | 0.7 [0.1; 1.3]* | −4.5 [−5.6; −3.3]*** | 8.7 [7.2; 10.1]*** | 1.0 [−0.4; 2.4] |
| Dual eligible | ||||
| No | Referent | Referent | Referent | Referent |
| Yes | 9.4 [8.0; 10.9]*** | 0.6 [−0.6; 1.8] | 2.3 [−0.3; 4.9] | 4.0 [1.4; 6.5]** |
| Age category | ||||
| 65–69 | Referent | Referent | Referent | Referent |
| 70–74 | −1.2 [−2.8; 0.4] | −0.8 [−1.7; 0.0] | −1.7 [−3.8; 0.4] | 0.4 [−1.5; 2.3] |
| 75–79 | −1.7 [−3.2; −0.2] | −2.8 [−3.7; −2.0]*** | −4.6 [−6.7; −2.5]*** | −1.3 [−3.3; 0.7] |
| 80+ | −1.4 [−2.7; −0.1] | −7.5 [−8.4; −6.6]*** | −9.9 [−11.7; −8.1]*** | −1.2 [−3.1; 0.8] |
| Elixhauser index | ||||
| Low (0–2) | Referent | Referent | Referent | Referent |
| Medium (3–5) | 0.2 [−0.4; 1.0] | 0.3 [−0.4; 1.0] | 3.8 [1.0; 6.6]** | −4.5 [−9.1; −0.0]* |
| High (6+) | 1.7 [−6.9; 7.0] | −2.1 [−3.0; −1.3]*** | 4.7 [2.0; 7.4]** | −7.6 [−12.0; −3.2]** |
| Race/ethnicity | ||||
| White | Referent | Referent | Referent | Referent |
| Black | 7.3 [4.9; 9.6]*** | 3.3 [1.3; 5.4]** | 2.9 [0.3; 5.5]* | −0.5 [−3.2; 2.2] |
| Asian | 6.6 [3.9; 9.4]*** | −5.8 [−8.5; −3.1]*** | 3.4 [−1.8; 8.7] | 0.2 [−6.1; 6.5] |
| Hispanic | 9.4 [7.3; 11.5]*** | 1.7 [0.0; 3.4]* | 5.5 [1.4; 9.7]** | −4.5 [−11.2; 2.1] |
| North American Native | 0.1 [−6.9; 7.0] | −2.2 [−7.9; 3.5] | 2.3 [−11.6; 16.2] | 3.1 [−1.2; 7.4] |
| Other/unknown | −1.1 [−4.8; 2.6] | −0.8 [−3.2; 1.5] | 6.5 [1.0; 12.0]* | −11.0 [−21.4; −0.6]* |
Note: For each clinical scenario, we fit a linear probability model with county‐fixed effects and sociodemographic and clinical characteristics. Only individuals residing in a county with at least two individuals who met the clinical scenario criteria are included in each model. Due to the large number of counties, we do not report coefficients for the individual county‐fixed effects. In Table S3, we provide results from the sensitivity analysis where we ran the regressions at a claim level (instead of beneficiary level). The results are consistent with the results reported here in Table 2.
Abbreviations: MA, Medicare advantage; TM, traditional Medicare.
p‐value <0.05; **p‐value <0.01; ***p‐value <0.001.
For each scenario, the Medicare program would have saved money if TM prescribing patterns matched MA prescribing patterns. We estimated that in 2016, Medicare could have saved $202.8 million for macular degeneration (7.7% of TM spending for macular degeneration), $27.7 million for osteoporosis (6.1%), $101.2 million for malignant neoplasms (20.3%), and $5.9 million for intravenous iron treatments (7.3%) if TM enrollees received low‐cost drugs as often as MA enrollees.
3.3. Differences in prescribing across and within hospitals and clinician practices
There was wide variation in the prescribing of high‐ versus low‐cost drugs when comparing clinician organizations (hospitals and clinician practices). The majority of organizations administered a mix of high‐ and low‐cost drugs. For macular degeneration, osteoporosis, malignant neoplasms, and iron deficiency anemia, we found that 74%, 62%, 61%, and 35% of clinician organizations, respectively, prescribed both high‐cost and low‐cost drugs (Figure 2). However, across scenarios, we found that 14%–37% of clinician organizations exclusively prescribed the high‐cost drug(s). Exclusively prescribing the low‐cost drug was less common for each scenario.
FIGURE 2.
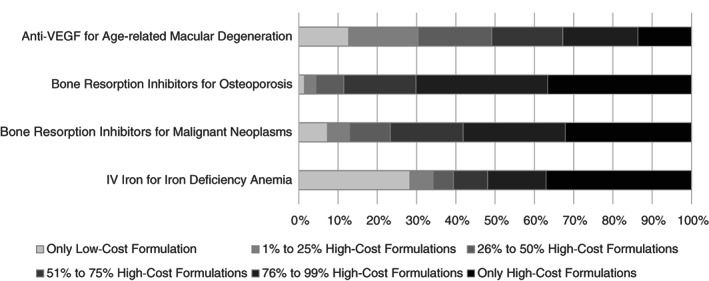
Share of clinician organizations based on prescribing of low‐cost and high‐cost drugs. We excluded clinician organizations with fewer than 10 claims and encounter records for a given scenario. The figure includes data for 1899 organizations for anti‐VEGF for age‐related macular degeneration, 3350 organizations for bone resorption inhibitors for osteoporosis, 1670 organizations for bone resorption inhibitors for malignant neoplasms, and 830 organizations for intravenous iron for iron deficiency anemia. The full distribution is provided in Figure S3
To account for differences in the prescribing behaviors of the clinician organizations that typically treat MA patients versus TM patients, for example, if MA patients more often receive treatment at organizations that prefer low‐cost drugs and TM patients more often receive treatment at organizations that prefer high‐cost drugs, we ran an alternative version of the regression for each scenario where we included clinician organization fixed effects instead of county fixed effects.
Consistent with the primary specification of the regression model, even after accounting for differences in the hospitals and clinician practices that treat MA and TM patients, MA enrollees had a higher probability of receiving the low‐cost drug in each scenario (Figure 3; see Table S2 for full regression results). For three of the four scenarios (macular degeneration, osteoporosis, and malignant neoplasms), the difference in probability of getting the low‐cost drug for MA versus TM enrollees was smaller when the regression included prescribing organization–fixed effects. This shows that differences in receipt of low‐cost drugs for MA versus TM can be attributed to a mix of differences within organizations in the selection of drugs for MA versus TM enrollees, as well as differences in the organizations that treat MA and TM enrollees.
FIGURE 3.
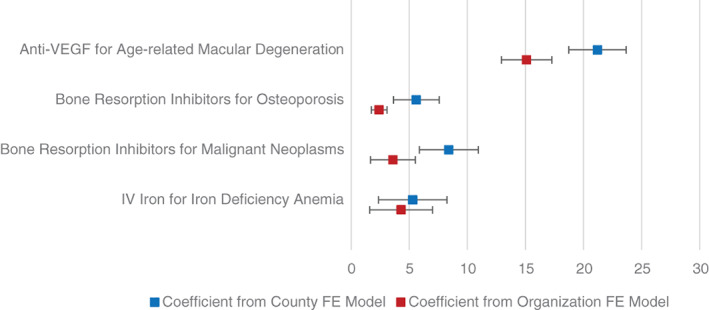
Regression adjusted differences in probability of receiving the low‐cost drug for individuals with MA compared to TM coverage. The figure shows point estimates and 95% confidence intervals for the difference in probability of receiving the low‐cost drug for individuals with MA compared to TM coverage for each scenario. Only individuals residing in a county with at least two individuals who met the clinical scenario criteria are included in each model. We fit linear probability models and adjusted for county (clinician organization) fixed effects, sociodemographic characteristics, and clinical characteristics. We provide full regression results for the county fixed effects model in Table 2 and the organization fixed effects model in Table S2. In Tables S3 and S4, we provide results from when we ran the regressions at a claim‐level (instead of beneficiary‐level). The results are consistent with the results reported here in this figure. In Tables S5 and S6, we provide results from when we ran the regressions without the Elixhauser comorbidity index. The results are consistent with the results reported here in this figure [Color figure can be viewed at wileyonlinelibrary.com]
4. DISCUSSION
This study had two main findings. First, we found that, in four scenarios where similarly or equally effective Part B drugs exist and are substantially different in terms of cost, older adults receiving treatment for the given condition with MA coverage more often received the low‐cost drug alternative compared with older adults with TM coverage. This finding was robust to controls for patient characteristics, county, and hospital/clinician practice and is consistent with incentives built into the MA program where revenues for MA insurers are directly tied to enrollment and enrollee utilization of health care. Accordingly, MA health insurer margins shrink when enrollees receive high‐cost Part B drugs. Because there is no analogous intermediary in TM, it is only through MA where Medicare has a party incentivized to control Part B costs. Second, we found that differences in MA and TM prescribing could be attributed to a mix of two factors: MA patients being treated by more efficient organizations (that favored prescribing low‐cost part B drugs) and within organizations, clinicians more often prescribing low‐cost drugs to their MA patients.
We estimated savings ranging from $6 million for intravenous iron to $203 million for macular degeneration if TM prescribing patterns aligned with MA prescribing patterns, representing approximately 6%–20% of TM spending across the scenarios. While the possible savings are a small portion of the TM Part B budget, they are illustrative of savings that could grow over time. Since 2016, there are more clinical settings in which multiple similarly or equally effective drugs are available (including approval of biosimilars), increasing the possible savings associated with selection of low‐cost drugs and heightening the value of policy options that decrease wasteful spending on high‐cost drugs.
Our findings contribute to the growing body of literature evaluating the effects of MA compared to TM coverage. Prior work shows that MA provides higher quality or more efficient care, including in the postacute care setting, 9 for opioid use, 10 for hospital admissions and mortality, 11 for diabetes and cardiovascular disease, 12 for Alzheimer's disease and related dementias, 14 and for ambulatory services. 13 In contrast, two studies found that MA insurers directed enrollees to lower quality nursing homes and to lower quality home health agencies. 42 , 43 Inconsistent findings across these studies may reflect differences between clinical scenarios in the long‐term spending implications of selecting lower cost options, the relative performance of the low‐cost and high‐cost options, and whether there are quality measures or payment mechanisms in place to change the incentive to select a low‐cost option.
Consistent with the financial incentive to reduce spending, we found individuals with MA coverage more often received low‐cost drugs. Because we are focused on scenarios where drugs are similarly effective, this reflects more efficient care. There are several mechanisms through which MA may lead to more efficient prescribing of Part B drugs. More efficient prescribing within MA may reflect policies that direct enrollees to more efficient hospitals and clinician practices, such as network design, as well as specific contracting arrangements between pairs of MA insurers and clinician organizations. Contracting arrangements may include capitated payments to clinician organizations or policies that shift prescribing behaviors at the intensive margin, such as prior authorization or reimbursement schemes that deviate from ASP plus a percentage add‐on payment to incentivize prescribing low‐cost drugs. MA insurers use prior authorization to manage access to expensive Part B drugs 44 , 45 and may use this tool to deny claims for high‐cost Part B drugs when low‐cost alternatives exist. Use of prior authorization in TM is currently quite limited, but applying this tool to high‐cost Part B drugs with low‐cost alternatives could reduce drug spending but could also reduce access.
Prescribing low‐cost versus high‐cost drugs not only affects the Medicare budget but also has implications for enrollees. TM enrollees without supplemental insurance (e.g., Medigap) are responsible for 20% co‐insurance. Coverage documents for several large MA insurers indicate that 20% co‐insurance for these drugs is also typical for MA enrollees. 46 , 47 , 48 , 49 Nearly 80% of TM enrollees have supplemental coverage to reduce their out‐of‐pocket expenditures. 50 However, for beneficiaries without supplemental coverage, higher out‐of‐pocket costs for a high‐cost drug may affect their decision to receive treatment or otherwise cause financial strain. 51 MA enrollees are protected by an annual out‐of‐pocket maximum ($7,550 for in‐network expenses and $11,300 for in‐ and out‐of‐network expenses as of 2021); however, $7,550 may be unaffordable for many older adults, and thus a higher co‐insurance for the high‐cost drug in each scenario may also affect treatment decisions for MA enrollees.
Changing the payment structure for Part B drugs for TM may reduce wasteful spending. One option is to introduce capitation into the payment for Part B drugs through bundled payments. 52 This is already in place for the CMS oncology care model 53 and end‐stage renal disease demonstrations. 54 CMS has the opportunity to develop additional bundled payment models focusing on conditions where Part B drugs are a large portion of the cost of care, and there are low‐cost and high‐cost drugs available, such as for the treatment of age‐related macular degeneration. CMS could also use broader models of capitation that consider all of a hospital or clinician practice's spending or enrollee's care, such as global budgets or total cost of care models, to incentivize selection of low‐cost Part B drugs.
A complementary approach is to correct the problematic incentive in TM to prescribe high‐cost drugs when low‐cost drugs exist. Replacing the 4.3% add‐on payment with a fixed payment that reflects the cost to acquire, store, and administer each drug would level the playing field between the low‐cost and high‐cost drugs. 55 Alternatively, as MedPAC 1 has proposed for biologics and biosimilars, CMS could calculate consolidated payment rates in instances where similarly or equally effective drugs exist or simply reimburse based on the ASP of the lowest cost alternative.
4.1. Limitations
While our research fills an important gap in understanding prescribing of Part B drugs in TM and MA, several limitations are worth noting. First, we analyzed data from 2016, as this was the most recently available MA encounter data when we began the analysis. Drug selection may have changed since 2016. Additionally, since 2016, there are more indications and drug classes where multiple similarly or equally effective drugs exist. Second, while we control for many enrollee sociodemographic and clinical characteristics and market factors, unobservable differences may remain between MA and TM enrollees that affect the likelihood that an enrollee receives a low‐cost versus high‐cost drug. Third, there is no gold standard available to validate the MA encounter records. As we discuss in the methods section, the 2016 data are likely more complete and valid than the initially released 2015 data; however, MA contracts that less frequently reported encounter data may have different prescribing patterns than MA contracts with more complete data. Fourth, using claims and encounter data, we cannot observe all possible mechanisms through which capitated MA coverage may lead to more efficient prescribing of Part B drugs. For example, MA insurers may use tools such as prior authorization, capitated payments to hospitals or clinician practices, or payment policies that incentivize selecting low‐cost drugs (see one, ultimately unsuccessful, example in Yasaitis et al. 56 ) to increase use of low‐cost drugs. Fifth, it is important to note that using bevacizumab to treat age‐related macular degeneration is “off‐label.” However, bevacizumab is commonly used to treat age‐related macular degeneration, and several prior publications have evaluated this drug as a treatment option equivalent to aflibercept and ranibizumab. 27 , 28 , 29 , 30 , 31 , 57 Sixth, it is well documented that MA insurers employ upcoding to increase the risk scores for their enrollees and associated payment from CMS. 58 This upcoding makes it challenging to compare the clinical profiles of TM and MA enrollees. While we partially account for this possibility by running sensitivity analyses without the Elixhauser comorbidity index, we cannot fully account for the effects of upcoding.
5. CONCLUSION
In four clinical scenarios, we found that MA coverage was associated with more efficient prescribing of Part B drugs. Our findings suggest that this difference is driven in part by lower‐cost treatment patterns of hospitals and clinician practices that treat more MA enrollees and by hospitals and clinician practices more often treating their MA enrollees with the low‐cost option.
Supporting information
Data S1. Supporting information.
ACKNOWLEDGMENTS
This work was supported in part by Arnold Ventures and grant number T32HS000029 from the Agency for Healthcare Research and Quality. The content is solely the responsibility of the authors and does not necessarily represent the official views of the Agency for Healthcare Research and Quality or Arnold Ventures. We gratefully acknowledge Arjun Gupta for his input on identifying kidney dysfunction for individuals prescribed a bone resorption inhibitor.
Anderson KE, Polsky D, Dy S, Sen AP. Prescribing of low‐ versus high‐cost Part B drugs in Medicare Advantage and traditional Medicare. Health Serv Res. 2022;57(3):537-547. doi: 10.1111/1475-6773.13912
Funding information Agency for Healthcare Research and Quality, Grant/Award Number: T32HS000029; Arnold Ventures
REFERENCES
- 1. MedPAC . Medicare and the health care delivery system. chapter 3: Medicare payment strategies to improve price competition and value for part B drugs. Medicare Payment Advisory Commission. Report to the Congress. Washington, DC: June 2019. http://medpac.gov/docs/default-source/reports/jun19_medpac_reporttocongress_sec.pdf.
- 2. Assistant Secretary for Planning and Evaluation (ASPE). Office of Health Policy . Medicare part B drugs: trends in spending and utilization, 2006‐2017. Issue Brief. November 20, 2020. https://aspe.hhs.gov/system/files/pdf/264416/Part-B-Drugs-Trends-Issue-Brief.pdf. Accessed April 9, 2021
- 3. Werble C. Medicare part B. Health Affairs. Health Policy Brief. Prescription Drug Pricing #5. August 10, 2017. https://www.healthaffairs.org/do/10.1377/hpb20171008.000171/full/. Accessed August 1, 2021.
- 4. Dean EB, Johnson P, Bond AM. Physician, practice, and patient characteristics associated with biosimilar use in medicare recipients. JAMA Netw Open. 2021;4(1):e2034776. [DOI] [PMC free article] [PubMed] [Google Scholar]
- 5. Gupta A, Wang P, Ali SA, et al. Use of bone‐modifying agents among Medicare beneficiaries with multiple myeloma. JAMA Oncol. 2020;6(2):296‐298. [DOI] [PMC free article] [PubMed] [Google Scholar]
- 6. Socal MP, Anderson KE, Sen A, Bai G, Anderson GF. Biosimilar uptake in Medicare part B varied across hospital outpatient departments and physician practices: the case of Filgrastim. Value Health. 2020;23(4):481‐486. [DOI] [PMC free article] [PubMed] [Google Scholar]
- 7. Hambley BC, Anderson KE, Shanbhag SP, Sen AP, Anderson GF. Payment incentives and the use of higher‐cost drugs: a retrospective cohort analysis of intravenous iron in the Medicare population. Am J Manag Care. 2020;26(12):516‐522. [DOI] [PMC free article] [PubMed] [Google Scholar]
- 8. MedPAC . Medicare Advantage Program Payment System. October 2016. http://www.medpac.gov/docs/default-source/payment-basics/medpac_payment_basics_16_ma_final.pdf. Accessed October 7, 2021.
- 9. Huckfeldt PJ, Escarce JJ, Rabideau B, et al. Less intense postacute care, better outcomes for enrollees in Medicare advantage than those in fee‐for‐service. Health Aff. 2017;36(1):91‐100. [DOI] [PMC free article] [PubMed] [Google Scholar]
- 10. Baker LC, Bundorf MK, Kessler DP. The effects of Medicare advantage on opioid use. J Health Econ. 2020;70:102278. [DOI] [PMC free article] [PubMed] [Google Scholar]
- 11. Afendulis CC, Chernew ME, Kessler DP. The effect of Medicare advantage on hospital admissions and mortality. Am J Health Econ. 2017;3(2):254‐279. [Google Scholar]
- 12. Landon BE, Zaslavsky A, Saunders R, et al. A comparison of relative resource use and quality in Medicare advantage health plans versus traditional Medicare. AJMC. 2015;21(8):559‐566. [PMC free article] [PubMed] [Google Scholar]
- 13. Ayanian JZ, Landon BE, Zaslavsky AM, Saunders RC, Pawlson LG, Newhouse JP. Medicare beneficiaries more likely to receive appropriate ambulatory services in HMOs than in traditional Medicare. Health Aff. 2013;32(7):1228‐1235. [DOI] [PMC free article] [PubMed] [Google Scholar]
- 14. Park S, White L, Fishman P, Larson EB, Coe NB. Health care utilization, care satisfaction, and health status for Medicare advantage and traditional Medicare beneficiaries with and without Alzheimer disease and related dementias. JAMA Netw Open. 2020;3(3):e201809. [DOI] [PMC free article] [PubMed] [Google Scholar]
- 15. Schwartz AY. Medicare advantage creates benefits for providers amid COVID‐19 and beyond. Health Affairs Blog June 7, 2021. https://www.healthaffairs.org/sponsored-content/medicare-advantage-creates-benefits-for-prividers-amid-covid19-and-beyond. Accessed August 2, 2021.
- 16. S.2543 ‐ Prescription Drug Pricing Reduction Act of 2019 . 116th Congress. https://www.congress.gov/bill/116th-congress/senate-bill/2543. Accessed April 10, 2021.
- 17. H.R.3 ‐ Elijah E. Cummings Lower Drug Costs Now Act . 116th Congress. https://www.congress.gov/bill/116th-congress/house-bill/3/text. Accessed April 10, 2021.
- 18. Centers for Medicare & Medicaid Services (CMS) . Most Favored Nation (MFN) Model. 85 FR 76180. https://www.federalregister.gov/documents/2020/11/27/2020-26037/most-favored-nation-mfn-model. Accessed April 10, 2021.
- 19. United States Government Accountability Office (GAO) . Medicare Advantage. Limited progress made to validate encounter data used to ensure proper payments. Washington, DC. January 2017. https://www.gao.gov/assets/690/682145.pdf. Accessed July 21, 2019.
- 20. Office of Inspector General (OIG). Medicare Advantage encounter data show promise for program oversight, but improvements are needed. Department of Health and Human Services. Washington, DC. January 2018. https://oig.hhs.gov/oei/reports/oei-03-15-00060.pdf. Accessed July 21, 2019.
- 21. Johnson A, Podulka J. Medicare Advantage (MA) encounter data validation and potential uses. Medicare Payment Advisory Commission (MedPAC). Washington, DC. April 5, 2018. http://www.medpac.gov/docs/default-source/default-document-library/ma-encounter-data-april18.pdf?sfvrsn=0. Accessed July 21, 2019.
- 22. Creighton S, Duddy‐Tenbrunsel R, Michel J. The promise and pitfalls of Medicare advantage encounter data. Health Affairs Blog February 25, 2019. https://www.healthaffairs.org/do/10.1377/hblog20190221.696651/full/. Accessed July 21, 2019.
- 23. Welch WP, Sen AP, Bindman AB. Concentration of physician services across insurers and effects on quality: early evidence from Medicare advantage. Med Care. 2019;57(10):795‐800. [DOI] [PubMed] [Google Scholar]
- 24. Kim D, Makineni R, Panagiotou OA. Assessment of completeness of hospital readmission rates reported in Medicare advantage contracts' healthcare effectiveness data and information set. JAMA Netw Open. 2020;3(4):e203555. [DOI] [PMC free article] [PubMed] [Google Scholar]
- 25. Elixhauser A, Steiner C, Harris DR, Coffey RM. Comorbidity measures for use with administrative data. Med Care. 1998;36:8‐27. [DOI] [PubMed] [Google Scholar]
- 26. Stagg V. ELIXHAUSER: Stata module to calculate Elixhauser index of comorbidity. Statistical software components S458077. 2015. Boston College Department of Economics.
- 27. Hutton D, Newman‐Casey PA, Tavag M, Zacks D, Stein J. Switching to less expensive blindness drug could save Medicare part B $18 billion over a ten‐year period. Health Aff. 2014;33(6):931‐939. [DOI] [PMC free article] [PubMed] [Google Scholar]
- 28. Ginsburg PB, Williams GA. Treatment‐specific payment approaches: the case of macular degeneration. Health Affairs Blog November 27, 2017. https://www.healthaffairs.org/do/10.1377/hblog20171117.667415/full/. Accessed May 8, 2019.
- 29. Virgili G, Parravano M, Menchini F, Brunetti M. Antiangiogenic therapy with anti‐vascular endothelial growth factor modalities for diabetic macular oedema. Cochrane Database Syst Rev. 2012;12:CD007419. [DOI] [PubMed] [Google Scholar]
- 30. Comparison of Age‐related Macular Degeneration Treatments Trials (CATT) Research Group , Martin DF, Maguire MG, et al. Ranibizumab and bevacizumab for treatment of neovascular age‐related macular degeneration: two‐year results. Ophthalmology. 2012;119(7):1388‐1398. [DOI] [PMC free article] [PubMed] [Google Scholar]
- 31. Chakravarthy U, Harding SP, Rogers CA, et al. Alternative treatments to inhibit VEGF in age‐related choroidal neovascularisation: 2‐year findings of the IVAN randomised controlled trial. Lancet. 2013;382(9900):1258‐1267. [DOI] [PubMed] [Google Scholar]
- 32. Fizazi K, Carducci M, Smith M, et al. Denosumab versus zoledronic acid for treatment of bone metastases in men with castration‐resistant prostate cancer: a randomised, double‐blind study. Lancet. 2011;377:813‐822. [DOI] [PMC free article] [PubMed] [Google Scholar]
- 33. Stopeck AT, Lipton A, Body J, et al. Denosumab compared with Zoledronic acid for the treatment of bone metastases in patients with advanced breast cancer: a randomized, double‐blind study. J Clin Oncol. 2010;28(35):5132‐5139. [DOI] [PubMed] [Google Scholar]
- 34. Snedecor SJ, Carter JA, Kaura S, Botteman MF. Denosumab versus zoledronic acid for treatment of bone metastases in men with castration‐resistant prostate cancer: a cost‐effectiveness analysis. J Med Econ. 2013;16(1):19‐29. [DOI] [PubMed] [Google Scholar]
- 35. Lyu H, Jundi B, Xu C, et al. Comparison of Denosumab and bisphosphonates in patients with osteoporosis: a meta‐analysis of randomized controlled trials. J Clin Endocrinol Metab. 2019;104(5):1753‐1765. [DOI] [PMC free article] [PubMed] [Google Scholar]
- 36. Camacho PM, Petak SM, Binkley N, et al. American Association of Clinical Endocrinologists/American College of Endocrinology Clinical Practice Guidelines for the diagnosis and treatment of postmenopausal osteoporosis – 2020 update. Endocr Pract. 2020;26(Suppl 1):1‐46. [DOI] [PubMed] [Google Scholar]
- 37. Auerbach M, Al TK. Low‐molecular weight iron dextran and iron sucrose have similar comparative safety profiles in chronic kidney disease. Kidney Int. 2008;73(5):528‐530. [DOI] [PubMed] [Google Scholar]
- 38. Mehmood T, Swe K, Das G, Gozu A, Auerbach M, Aung S. Safety and efficacy of total dose infusion of low molecular weight (LMW) iron dextran in a large population of anemic patients across a broad spectrum of diagnoses associated with iron lack. Blood. 2014;124(21):4028. [Google Scholar]
- 39. Adkinson NF, Strauss WE, Macdougall IC, et al. Comparative safety of intravenous ferumoxytol versus ferric carboxymaltose in iron deficiency anemia: a randomized trial. Am J Hematol. 2018;93(5):683‐690. [DOI] [PMC free article] [PubMed] [Google Scholar]
- 40. Meyers DJ, Mor V, Rahman M, Trivedi AN. Growth in Medicare advantage greatest among black and Hispanic Enrollees. Health Aff. 2021;40(6):945‐950. [DOI] [PMC free article] [PubMed] [Google Scholar]
- 41. Bundorf MK, Schulman KA, Stafford JA, et al. Impact of managed care on the treatment, costs, and outcomes of fee‐for‐service Medicare patients with acute myocardial infarction. Health Serv Res. 2004;39(1):131‐152. [DOI] [PMC free article] [PubMed] [Google Scholar]
- 42. Meyers DJ, Mor V, Rahman M. Medicare advantage Enrollees more likely to enter lower‐quality nursing homes compared to fee‐for‐service Enrollees. Health Aff. 2018;37(1):78‐85. [DOI] [PMC free article] [PubMed] [Google Scholar]
- 43. Schwartz ML, Kosar CM, Mroz TM, Kumar A, Rahman M. Quality of home health agencies serving traditional Medicare vs Medicare advantage beneficiaries. JAMA Netw Open. 2019;2(9):e1910622. [DOI] [PMC free article] [PubMed] [Google Scholar]
- 44. Schwartz AL, Brennan TA, Verbrugge DJ, Newhouse JP. Measuring the scope of prior authorization policies: applying private insurer rules to Medicare part B. JAMA Health Forum. 2021;2(5):e210859. [DOI] [PMC free article] [PubMed] [Google Scholar]
- 45. Anderson KE, Alexander GC, Ma C, Dy SM, Sen AP. Medicare advantage coverage restrictions for the costliest physician‐administered drugs. Am J Manag Care. Forthcoming. [DOI] [PMC free article] [PubMed] [Google Scholar]
- 46. Humana . Your 2020 Evidence of Coverage. HumanaChoice. H5216‐076 (PPO). Upstate South Carolina. Spartansburg/Greenville Metro Area.
- 47. Aetna . 2020 Evidence of Coverage for Aetna Medicare Select Plan (HMO).
- 48. Kaiser Permanente . Evidence of Coverage. Your Medicare Health Benefits and Services and Prescription Drug Coverage as a Member of Kaiser Permanente Senior Advantage Core (HMO). January 1–December 31, 2020.
- 49. United Healthcare . Evidence of Coverage 2021. AARP Medicare Advantage Choice (PPO)
- 50. Cubanski J, Damico A, Neuman T, Jacobson G. Sources of supplemental coverage among Medicare beneficiaries in 2016. Kaiser Family Foundation; November 28, 2018. https://www.kff.org/medicare/issue-brief/sources-of-supplemental-coverage-among-medicare-beneficiaries-in-2016/. Accessed April 21, 2020.
- 51. Roberts ET, Glynn A, Cornelio N, et al. Medicaid coverage ‘cliff’ increases expenses and decreases care for near‐poor Medicare beneficiaries. Health Aff. 2021;40(4):552‐561. [DOI] [PMC free article] [PubMed] [Google Scholar]
- 52. Bach PB, Mirkin JN, Luke JJ. Episode‐based payment for cancer care: a proposed pilot for Medicare. Health Aff. 2011;30(3):500‐509. [DOI] [PubMed] [Google Scholar]
- 53. Centers for Medicare & Medicaid Services (CMS) . Oncology care model overview. February 2021. https://innovation.cms.gov/files/slides/ocm-overview-slides.pdf. Accessed April 10, 2021.
- 54. MedPAC . Outpatient dialysis services payment system. October 2016. http://www.medpac.gov/docs/default-source/payment-basics/medpac_payment_basics_16_dialysis_final.pdf. Accessed April 10, 2021.
- 55. National Academies of Sciences, Engineering, and Medicine . Medications in Single‐Dose Vials: Implications of Discarded Drugs. The National Academies Press; 2021. [PubMed] [Google Scholar]
- 56. Yasaitis L, Gupta A, Newcomb B, Kim E, Newcomer L, Bekelman J. An insurer's program to incentivize generic oncology drugs did not alter treatment patterns or spending on care. Health Aff. 2019;38(5):812‐819. [DOI] [PubMed] [Google Scholar]
- 57. Baisiwala S, Bundorf MK, Pershing S. Physician utilization patterns for VEGF‐inhibitor drugs in the 2012 United States Medicare population: Bevacizumab, Ranibizumab, and Aflibercept. Ophthalmic Surg Lasers Imaging Retina. 2016;47(6):555‐562. [DOI] [PubMed] [Google Scholar]
- 58. Geruso M, Layton T. Upcoding: evidence from Medicare on squishy risk adjustment. J Polit Econ. 2020;128(3):984‐1026. [DOI] [PMC free article] [PubMed] [Google Scholar]
Associated Data
This section collects any data citations, data availability statements, or supplementary materials included in this article.
Supplementary Materials
Data S1. Supporting information.