Abstract
By combining rice husk-derived nano-silica and reduced graphene oxide and then polymerizing PANI by in situ polymerization, we created polyaniline-coated rice husk-derived nano-silica@reduced graphene oxide (PANI-SiO2@rGO) composites with excellent electrochemical performance. ATR-FTIR and XRD analyses confirm the formation of PANI-SiO2@rGO, implying that SiO2@rGO served as a template in the formation of composites. The morphology of PANI-SiO2@rGO was characterized by SEM, HRTEM, and STEM, in which SiO2 nanoparticles were homogeneously loaded on graphene sheets and the PANI fibrous network uniformly covers the SiO2@rGO composites. The structure can withstand the large volume change as well as retain electronic conductivity during Li-ion insertion/extraction. Over 400 cycles, the assembled composite retains a high reversible specific capacity of 680 mA h g−1 at a current density of 0.4 A g−1, whereas the SiO2@rGO retains only 414 mA h g−1 at 0.4 A g−1 after 215 cycles. The enhanced electrochemical performance of PANI-SiO2@rGO was a result of the dual protection provided by the PANI flexible layer and graphene sheets. PANI-SiO2@rGO composites may pave the way for the development of advanced anode materials for high-performance lithium-ion batteries.
By combining rice husk-derived nano-silica and reduced graphene oxide and then polymerizing PANI by in situ polymerization, we created polyaniline-coated rice husk-derived nano-silica@reduced graphene oxide composites with excellent electrochemical performance.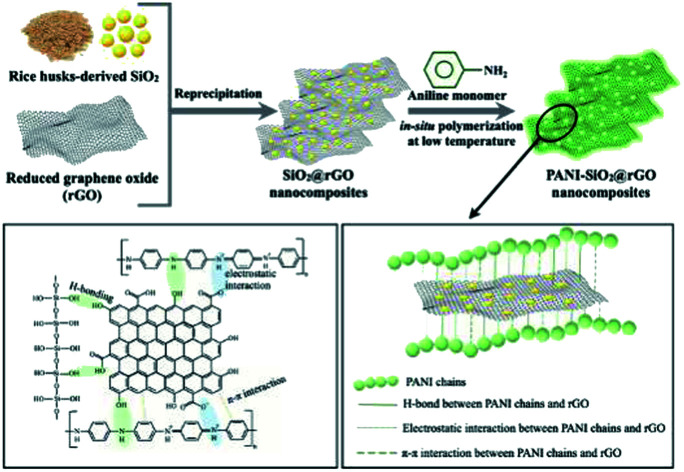
Introduction
Lithium-ion batteries (LIBs) are a type of rechargeable battery that is frequently used in electric vehicles, portable electronic devices, and energy integration systems.1,2 Rice production, which is one of Thailand's most important food crops, generates one of the most significant wastes, rice husks (RHs), which are disposed of in landfills. In recent years, due to the high silica content of RHs, their use as a raw material in the production of a wide range of silicon-based materials has been significantly increased. Additionally, RHs can be directly combustible, resulting in the production of silica as a result of an acid treatment process. The main goal of this research is to determine the most effective method of adding RHs to electrode materials in order to make them more effective anodes.50,51 Silica is a promising anode material for rechargeable lithium-ion batteries (LIBs) due to its low cost and ease of synthesis. The theoretical capacity of this material is several times that of graphite anode (1965 mA h g−1). Additionally, while volume expansion is inevitable during the lithiation process, silica exhibits a smaller volume change during the charging/discharging process than silicon.3 Recently, silica was found to be an effective material for accommodating the expansion of Si during the cycling process, resulting in satisfactory reversible capacity and cycle performance.4 However, silica has a number of flaws that severely limit its industry promotion. Taking this into consideration, some functional SiO2 and porous carbons (such as graphite-like carbon, carbon nanotubes, and graphene) have been used to improve cycling stability and rate capability, leveraging the conductive carbon framework and porous structure for buffering expansion.
There are numerous methods for enhancing electrochemical performance. Graphite has been proposed for use in conjunction with SiO2 materials. Due to their low capacity and low surface area, commercial graphite anodes are unable to meet the demands for high energy and power densities in technological applications (372 mA h g−1).5 Graphene is a one-atom-thick carbon sheet that has generated considerable interest in energy storage applications due to its fascinating properties such as high electron mobility, excellent electrochemical stability, large surface area, and high mechanical strength.6,7 However, there is a critical issue of graphene sheets aggregating during the electrode preparation process.8 Thus, reduced graphene oxide (rGO) composites have been address to solve graphene sheets restacking problem. RGO is typically synthesized by oxidizing graphite powder via a modified Hummers' method9 and then reducing graphene oxide. The sheet-like structure of rGO makes it an ideal template for polymers. The functionalities facilitate both the uniform distribution of rGO sheets within a polymer matrix and the interfacial interactions between the rGO and the polymer matrix.
Conducting polymers are well-known for their high degree of flexibility and low specific capacitance. Due its low cost, ease of synthesis from readily available monomers, chemical stability, mechanical flexibility, relatively high conductivity, controllable electric conductivity, and good environmental stability, polyaniline (PANI) has been identified as one of the most promising conducting polymeric materials.10 Numerous strategies for the synthesis of GO-PANi and rGO-PANi nanocomposites have been developed. However, there are only few publications on PANI-SiO2@rGO nanocomposites, Ravi et al. reported on a composite of polyaniline and commercial reduced graphene oxide-silica (from TEOS solution) prepared via ultrasound irradiation and subsequent sulfonation of PANI-RGO-SiO2 composite using chlorosulfonic acid. The ternary composite (SPANI-RGO-SiO2) was identified to improve the electrochemical performance as electrode material for high-performance supercapacitors.11 Male et al. demonstrate that PANI modified with reduced graphene oxide-silica (rGOS) improves the pseudocapacitance and cycle stability. They demonstrated that incorporating graphene silica into polyaniline can help improve its thermal stability, specific capacitance, ESR and improving cycle life.12 These previous works used complicated polymerization method and commercial chemical. Moreover, no works have been applied these composites for use as anode materials in lithium-ion batteries before.
PANI-rGO composites are promising materials because rGO is an excellent host for active polymers and can serve as a stable and conductive network with improved electrical conductivity and cycle stability. SiO2 has also been investigated as a possible silicon (Si) substitute. SiO2 has a number of advantages over Si, including cost savings, simplified synthesis, and less volume expansion. However, due to its low conductivity and high volume change, its application range is limited.13
To fully exploit the benefits of rGO, SiO2 and PANI in this work, we synthesized nano-SiO2 from rice husk wastes and reduced graphene oxide (rGO) by oxidizing and subsequent reducing graphite powder. Using the synthesized rGO as the host of SiO2, the PANI-SiO2@rGO composites were prepared by in situ chemical polymerization of aniline monomer using ammonium persulfate as initiator, which makes the SiO2 particles in the composite get dual protection. The enhanced performance of PANI-SiO2@rGO could be attributed to this unique structure, which is beneficial for buffering the volume variation, accelerating electron transfer, suppressing SiO2 particle aggregation, and stabilizing the SEI films. The resulting nanomaterials have been structurally and spectroscopically characterized. Additionally, the electrochemical performance was investigated systematically.
Experimental section
Materials
Graphite (powder, <20 μm, synthetic), aniline (C6H7N, >99%) were purchased from Sigma-Aldrich Co. Ammonium persulphate (APS; (NH4)2S2O8, 98%), potassium permanganate (KMnO4) was purchased from KEMAUS. Sodium hydroxide (NaOH), hydrochloric acid (HCl, 37%) were purchased from RCI-Labscan. sulfuric acid (H2SO4, 98%) was purchased from JT Baker.
Synthesis of silica/reduced graphene oxide and polyaniline (SiO2@rGO and PANI) composite via in situ polymerization
Preparation of silica from rice husk (SiO2)
Rice husks (RHs) from the agricultural waste were rinsed with room temperature water to remove mechanical impurities and dust before being dried at 100 °C until completely dry. The washed and dried RHs were immersed in an aqueous HCl solution overnight to hydrolyze the cellulose and hemicellulose and remove the metal contaminants. It was then washed with water until the pH reached 7 and dried at a temperature of 100 °C. The RHs were then burned in two stages in a muffle furnace: first at 500 °C for 2 hours and subsequently at 700 °C for 2 hours.
Preparation of reduced graphene oxide (rGO)
Graphene oxide (GO) was synthesized from graphite powder using a modified Hummers' method and then reduced sequentially in a tube furnace. Reduced graphene oxide (rGO) was synthesized via heat treatment at 800 °C for 5 hours in an inert atmosphere.52
Preparation of composite silica and reduced graphene oxide (SiO2@rGO) (the ratio of SiO2 to rGO of 30 : 70)
Initially, as-prepared silica was reprecipitated for 2 hours at 120 °C in a NaOH solution. Following that, rGO was distributed throughout the suspension. After adjusting the pH of the mixture to 7 with hydrochloric acid solution, it was stirred overnight at room temperature. Finally, it was centrifuged and washed with deionized water and ethanol. The samples were then dried in a hot air oven at 60 °C.
Preparation of silica/reduced graphene oxide and polyaniline (SiO2@rGO and PANI) composite
PANI-SiO2@rGO composites were synthesized via in situ polymerization based on a SiO2@rGO to PANI ratio of 1 : 3. The suspended SiO2@rGO was stirred for 30 minutes in 10 ml of ethanol/DI water and 5 ml of H2SO4 and then sonicated to obtain a homogeneous dispersion. Additionally, aniline monomer was added dropwise to the aforementioned solution while vigorously stirring in an ice bath. Dropwise additions of ammonium persulfate were established to this solution, and the mixture was continuously stirred for 6 hours in an ice bath. The solution turned dark green as a result of polymerization, a characteristic of the formation of polyaniline emeraldine salt. Centrifugation was used to obtain the precipitate suspension, which was then carefully rinsed with water and ethanol repeatedly until a clear solution was obtained. The final composite was dried at a temperature of 60 °C.
Materials characterization
The morphology of the samples was examined using a scanning electron microscope (SEM, JEOL JSM-7800 F-Prime). The microstructures of the materials were examined using high-resolution transmission electron microscopy (HRTEM, JEOL JEM-2200FS). Scanning transmission electron microscopy (STEM, JEM-ARM200F) was used to perform elemental analysis using an energy dispersive X-ray spectroscopy (EDX). Attenuated total reflectance – Fourier transform infrared (ATR-FTIR) spectra were collected using an ATR-FTIR spectrometer (Bruker, Tensor 27) at room temperature. The phases of composites were determined using X-ray diffraction (XRD) on a Rigaku Miniflex II desktop diffractometer equipped with Cu Kα radiation. Thermal gravimetric analysis (TGA) was used to determine the thermal stability of a TG-DTA8122 (Japan).
Measurements of electrochemical performances
Half-cell experiments were conducted using coin-type cells (CR2032) equipped with pure Li metal foil serving as the counter and reference electrodes. To fabricate the working electrode, a slurry mixture of prepared active materials, super P, and sodium alginate at a weight ratio of 70 : 15 : 15, was coated on 99.99% copper foil. The electrolyte was a solution of LiPF6 in ethylene carbonate (EC). The cells were assembled in a glovebox filled with argon. Electrochemical impedance spectroscopy (EIS) was accomplished on an electrochemical workstation (PGSTAT 302N) by applying an alternating current (AC) voltage of 2 mV in the frequency range from 100 kHz to 0.1 Hz. And the cycle voltammetry measurements of the cells were measured at a scan rate of 0.1 mV s−1 over the range of 0.1–3.0 V at room temperature. The discharge–charge cycling was performed at room temperature using a battery test system (Neware BTS-4000).
Results and discussions
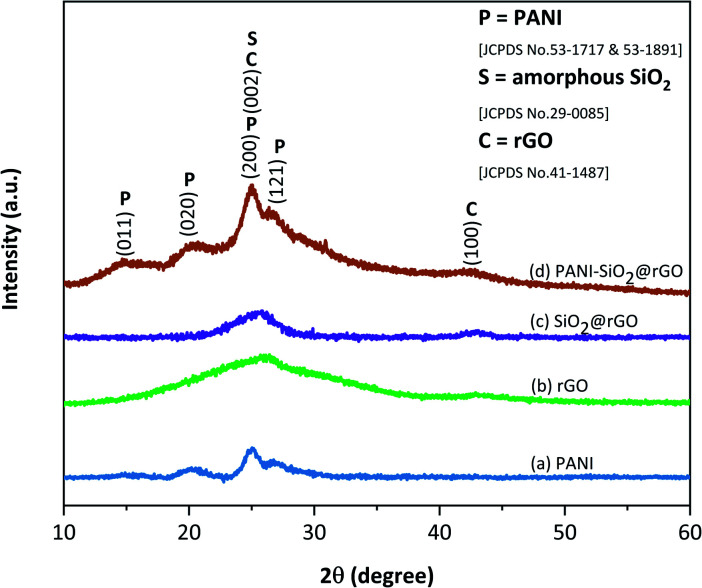
XRD patterns of PANI, rGO, SiO2@rGO, PANI-SiO2@rGO (Fig. 1) confirm the formation of composites. The primary diffraction broad peaks at 26.02° and second peak at 42.1° in the XRD pattern of pure rGO correspond to (002) and (100) planes of the graphitic structure (JCPDS no 41-1487).9,14,15 Following the addition of SiO2, a broad peak at 25.4° corresponds to amorphous silica (JCPDS no 29-0085), indicating the amorphous nature of the powders.16–18 Meanwhile, the peak intensity of rGO is weakening, indicating that the SiO2 layer has been coated on rGO.19 The XRD patterns for PANI-SiO2@rGO revealed representative peaks of bare PANI at 15.0°, 20.1°, 24.8°, 26.7°, which correspond respectively to (011), (020), (200), and (121) crystal planes of PANI in the emeraldine salt form (JCPDS no 53-1717 & 53-1891).20 These peaks directly relate to the monoclinic space group P21.21–23 Furthermore, the peaks at 15.0°, 20.1° and 24.8° are assigned to the repeat unit of the PANI chain, and the periodicity perpendicular and parallel to the polymer backbone chain, respectively. Peak at 24.8° is more intense than peak at 20.1°, which corresponds to highly doped emerald salt. Furthermore, the rGO and SiO2@rGO peaks at 26.02° and 25.4°, which belong to the rGO and SiO2 phases, were not observed clearly in the PANI-SiO2@rGO pattern. This omission could indicate that the rGO sheets were completely covered by PANI chains. The PANI-SiO2@rGO XRD pattern can confirm the successfully formed of PANI-SiO2@rGO composite.
Fig. 1. X-ray diffraction patterns of (a) PANI, (b) rGO, (c) SiO2@rGO, and (d) PANI-SiO2@rGO.
The main text of the article should appear here with headings as appropriate.
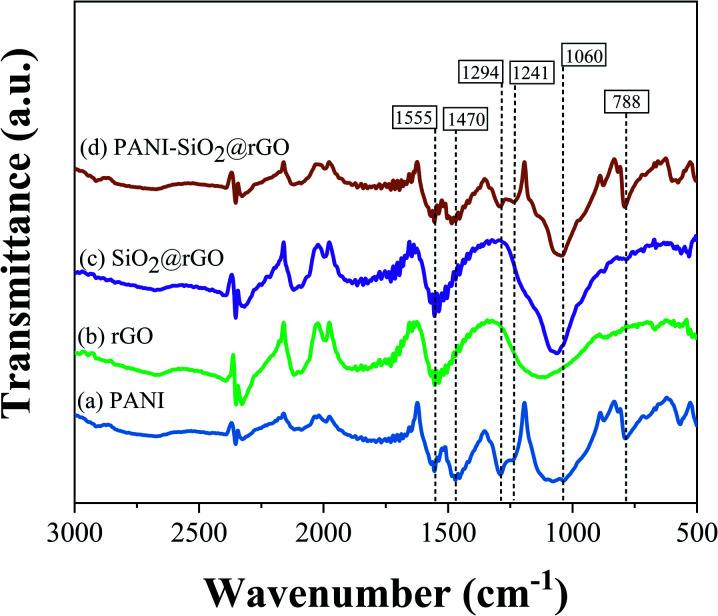
According to infrared spectra of rGO (Fig. 2), the major peaks at 1555 cm−1 and 1130 cm−1 corresponded to the stretching vibrations of the C C and C–OH bands, respectively.24–26 The presence of SiO2 was indicated by the presence of the characteristic peak of Si–O–Si asymmetric stretching vibration/Si–OH asymmetric bending at 1060 cm−1 in the FTIR spectrum of SiO2/rGO.27 The PANI deposition on the rGO sheet can be perceived from the observation of absorption peaks at 1470 cm−1 and 1555 cm−1 which were associated with the C C bands stretching vibration of the quinoid and benzenoid units. Additionally, the appearance of C–N band stretching at 1294 cm−1 can confirm the presence of a covalent bond between PANI and the rGO sheet.28 As a consequence, the stretching vibration of C N and C–N, which can be associated to the emeraldine salt phase, were detected at 1241 and 1294 cm−1. Furthermore, the peak at 1060 cm−1 corresponded to the C–H in-plane bending of the 1,2,4-substituted benzene of PANI.9,29,30 The FTIR spectra of composites were nearly equivalent to bare PANI, bare rGO and SiO2@rGO materials. An analysis of the PANI-SiO2@rGO FTIR spectra reveals significant PANI-SiO2@rGO characteristic peak contributions, demonstrating that PANI was successfully synthesized on SiO2@rGO composites.
Fig. 2. Infrared spectra of (a) PANI, (b) rGO, (c) SiO2@rGO and (d) PANI-SiO2@rGO.
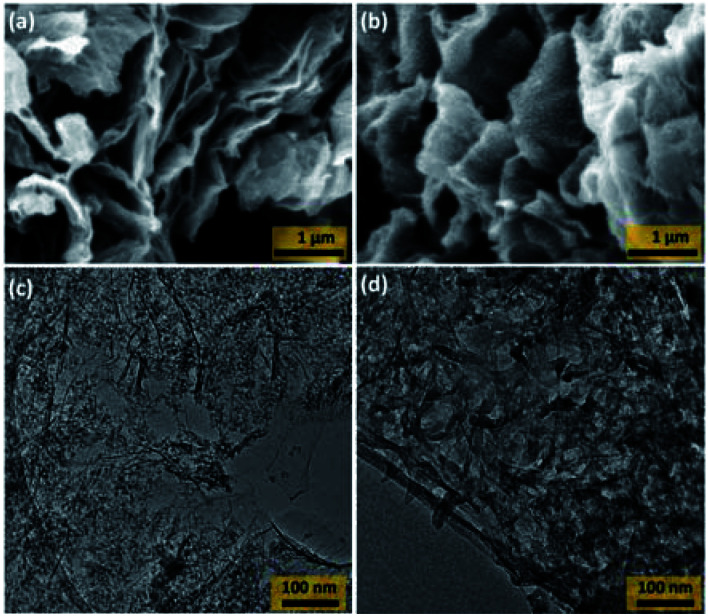
The morphology of the SiO2@rGO and PANI-SiO2@rGO composites were investigated by scanning electron microscopy (SEM). As illustrated in Fig. 3(a), the as-prepared SiO2@rGO had the morphology of thin exfoliated sheets of rGO, which no visible SiO2 particles. Following polymerization, the SiO2@rGO composite surfaces exhibited the spherical morphology of PANI (Fig. 3(b)), providing a bridge for the coalescence rGO and PANI via electrostatic interaction, π–π interaction, and H-bonding. In order to examine the morphology in greater detail, transmission electron microscopy (TEM) was employed. The TEM images of SiO2@rGO in Fig. 3(c) represent the appearance of a SiO2 particles covering the rGO sheet-like structure. While PANI-SiO2@rGO composite appeared as fibrous network that uniformly covers the SiO2@rGO composites (Fig. 3(d)). This could confirm the PANI deposition on the surface of SiO2@rGO composites. We hypothesized that since the SiO2@rGO had been coated with the PANI shell, the flexible shell would significantly buffer the volume change of the SiO2 spheres when they intercalated and deintercalated with lithium ions repeatedly.3,31 It is anticipated that this distinct coral-like structure will improve the electrochemical performance of PANI-SiO2@rGO composites as LIBs anodes.
Fig. 3. SEM images of (a) SiO2@rGO and (b) PANI-SiO2@rGO composite. TEM images of (c) SiO2@rGO and (d) PANI-SiO2@rGO composite.
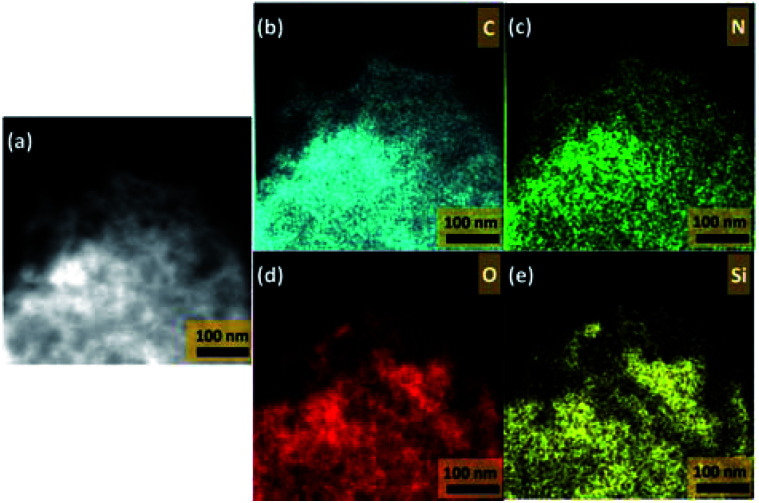
The EDS mapping, as depicted in Fig. 4(a)–(e), demonstrated elemental distribution ranges of carbon (C), nitrogen (N), oxygen (O) and silicon (Si), which was clear that Si and O from SiO2 were evenly covered on the graphene sheet. The obvious distribution of N element after the composite was assembled with PANI, as shown in Fig. 4(e), revealed that SiO2@rGO has been covered by PANI during the in situ polymerization process.
Fig. 4. STEM images (a), and EDS elemental mapping images (b)-(e) of PANI-SiO2@rGO composite.
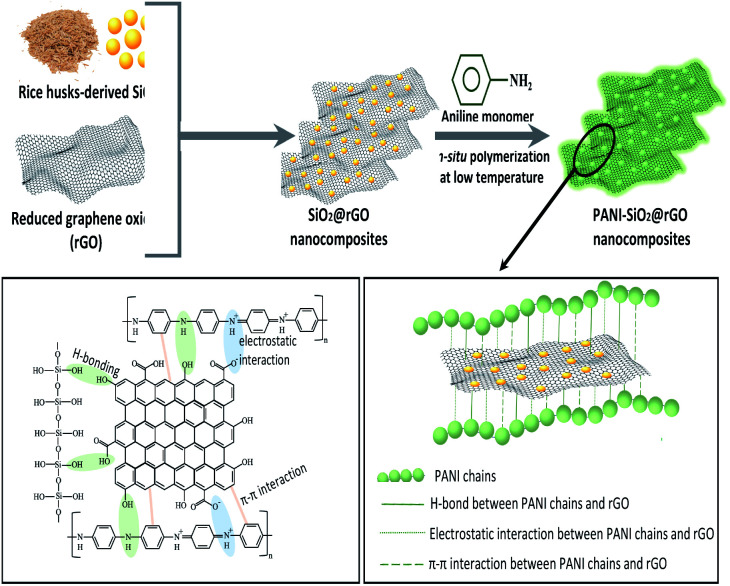
The process for producing SiO2@rGO was depicted in Scheme 1. A composite of polyaniline with SiO2@rGO was prepared by in situ polymerization in the presence of aniline as monomer and ammonium persulfate as an initiator.
Scheme 1. Schematic diagram of the synthesis route of PANI-SiO2@rGO composite.
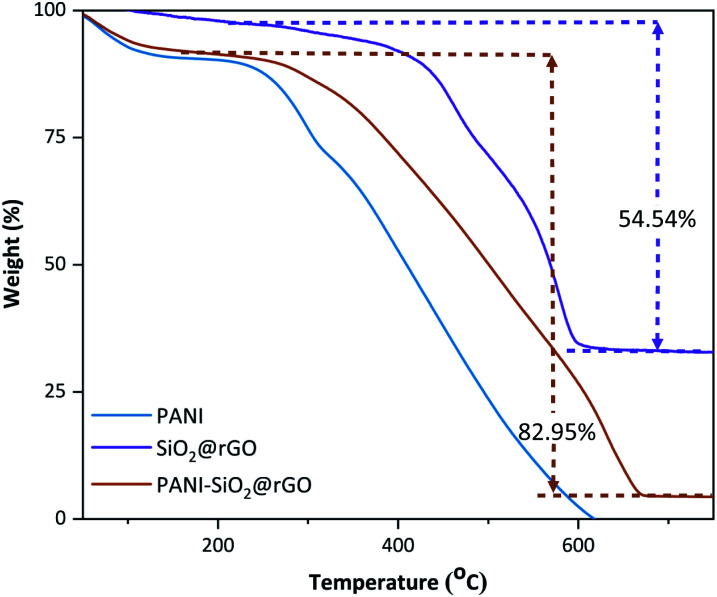
As a consequence, polyaniline on the outer surface of the rGO sheets was hierarchically polymerized on the rGO's basal plane, resulting in the formation of PANI-SiO2@rGO.21 Consider that the hydrogen bonds between the phenolic OH and PANI as part of the interaction forces. These forces are responsible for holding the layers of the rGO and PANI matrix in place. The strongest H-bonds responsible for the binding of PANI to rGO are those that have more electrostatic forces originating from protonated N and lone pairs on periodic OH or saturated ring OH, which are the ones that are responsible for the binding of PANI to rGO. A further stabilizing effect of the stacking between the aromatic rings of polyaniline and the bonds of rGO is the fact that the bound complex structure of the composite is further stabilized. Furthermore, SiO2 has the ability to bind with rGO. The Si–O layer on the surface of SiO2 particles promoting the formation of hydrogen bonds between the phenolic hydroxyl group (–OH) from rGO and the surface Si–O layer, which in turn increases the contact between rGO and SiO2. To summarize, the PANI-SiO2@rGO composite is tend to conductive, allowing for an increase in both the electrochemical reaction rate and the lithium storage capacity of the PANI-SiO2@rGO composite anode. Thermogravimetric measurements were determined in order to explore the percentage of SiO2 present in SiO2@rGO and PANI-SiO2@rGO composites, and the corresponding results were depicted in Fig. 5. The loss take place in two stages. The loosely bound or physically adsorbed water molecules can be attributed to the initial weight loss of approximately 20% (up to 200 °C).32 Another possibility was the loss of C O species and followed by gradual decomposition of carbon dioxide up to 650 °C and degradation of the polymer backbone with residual carbon, which would constitute the second step degradation.29 Thus, the calculated SiO2 content in the SiO2@rGO and PANI-SiO2@rGO composite samples were 36.5 weight% and 5.68 weight%, respectively. Furthermore, the amount of PANI present in PANI-SiO2@rGO was approximately 28.4 weight%.
Fig. 5. Thermogravimetric analysis curves for PANI, SiO2@rGO and PANI-SiO2@rGO composites.
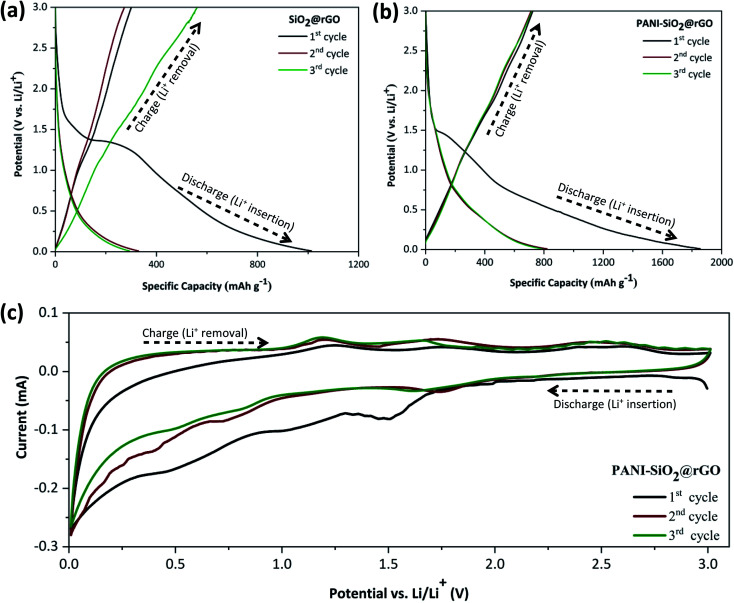
The electrochemical profile of PANI-SiO2@rGO composite was investigated in a coin-type cell using lithium foil as a reference and counter electrode. Simultaneous experiments were conducted using a SiO2@rGO composite anode for the comparison. The initial three discharge–charge curves of the SiO2@rGO and PANI-SiO2@rGO electrodes over a potential window of 0.01–3.00 V (vs. Li/Li+) at a current density of 0.4 A g−1 were shown in Fig. 6(a) and (b), respectively. The SiO2/rGO composite electrode has first discharge and charge specific capacities of 1012 and 300 mA h g−1, respectively, with a poor coulombic efficiency (CE) of 29.6%. The PANI-SiO2@rGO composite electrode has initial discharge/charge specific capacities of 1508 and 647 mA h g−1, respectively, with a CE of 42.9%. A low first coulombic efficiency is due to lithium loss caused by the reduction of silica in the SiO2@rGO and PANI-SiO2@rGO composites. It was proposed that SiO2 reacts with Li+ in the following manner. The amorphous nano-SiO2 in the SiO2@rGO and PANI-SiO2@rGO composites was reduced to Si and Li2O or Li4O4 consumes a significant amount of lithium and contributed significantly to the irreversible capacity of the initial discharge. When the composite is discharged further, the reduced Si react with Li+ to form Li–Si alloys.33,34 This reaction is highly reversible, which contributes to the composite's increased reversibility. Additionally, carbon contributes to the cyclability and stability of composites, as lithium-ion intercalation and deintercalation occur during cycling.5 The electrochemical reaction mechanism of PANI-SiO2@rGO can be summarized as follows:
| SiO2 + 4Li+ + 4e− → 2Li2O + Si | 1 |
| 2SiO2 + 4Li+ + 4e− → Li4SiO4 + Si | 2 |
| Si + xLi+ + xe− → LixSi | 3 |
| C + yLi+ye− → LiyC | 4 |
Fig. 6. Discharge–charge profiles of (a) SiO2@rGO, and (b) PANI-SiO2@rGO composites at a current density of 400 mA g−1; (c) cyclic voltammograms of the PANI-SiO2@rGO electrode at 0.1 mV s−1 for the first three cycles.
As can be seen, both electrodes contain potentials gradient plateaus between 1.5 and 0.5 V, indicating the formation of the solid electrolyte interface (SEI) layer.34–36 The following cycles reveals that the SEI layer occurs only in the first cycle, as the corresponding slopes gradually become steeper and even the plateaus disappear. The slope below 0.5 V is due to irreversible electrochemical reactions between lithium ions with SiO2 and a series of silicate salts (eqn (1) and (2)), which results in an increased of irreversible capacity and thus low coulombic efficiency. Following that, lithium ions begin reacting with the reduced amorphous silicon to form LiSi alloy, as described in eqn (3), resulting in reversible capacity for the subsequent cycles. Simultaneously, porous carbon can be used to produce reversible capacity (eqn (4)).34,37,38 At potential greater than 1.5 V, all of the charge voltage profiles appear to be very steep rather than flat. Another reason could be that the solvent decomposition reaction occurs on the oxide electrode's surface, resulting in the formation of the SEI film. The SEI film is a layer on the surface of the electrode materials that forms as a result of the reaction between the electrode material and the electrolyte on the solid–liquid interface during the charge and discharge process for the first cycle. The partial disintegration of the SEI film is hypothesized to be the primary cause of the low coulombic efficiency observed during the first cycle. On the other hand, the PANI-SiO2@rGO has a higher initial CE than the SiO2@rGO composite electrode, which could be because the PANI coating shell inhibits electrolyte decomposition on the SiO2@rGO surface. All of these characteristics are demonstrated further in the cyclic voltammetry, as illustrated in Fig. 6(c), for the first three cycles at a scan rate 0.2 mV s−1 within the potential window of 0.0–3.0 V (vs. Li/Li+). The cathodic peaks correspond to the discharge curve's plateaus, while the anodic peaks correspond to the charge curve's peaks. There are two cathode peaks in the range of 0.5–1.0 V during the first cycle, which correspond to the electrolyte decomposition and the formation of the SEI film on the electrode surface. The peak in the curve diminishes after the first cycle, indicating that the formation of the SEI film is irreversible and thus results in the initial irreversible capacity. Additionally, the curve at 0.5 V demonstrated combined effects of the successive formation of Li2O and Li4SiO4 alloys (eqn (1) and (2)), as well as the lithiation of the rGO material (eqn (4)).39,40 As a result, a weak anodic shoulder peak at 0.2 V in the subsequent charge process can probably be attributed to the rGO component's reversible delithiation.
Additionally, during the process discharge, the Si by eqn (1) and (2) reacted with Li+ to form a Li–Si alloy. The oxidation peak, located approximately at 1.1 V is extremely broad in the Li de-intercalation region and is consistent with the dealloying reaction between SiO2 and the Li–Si alloys.40 The cathode potential peak, on the other hand at 1.5 V, which was attributed to the alloying process of LixSiy.37 The redox couple formed by the respective alloying and de-alloying reactions between Si and Li+ ensures the PANI-SiO2@rGO composite has a high reversible lithium storage capacity. The curves here overlap nicely with the cyclic voltammogram curve in the subsequent cycle, indicating that the electrode has a stable circulation performance.
In lithium-ion batteries, the electrolyte reacts during cycling, forming a thin passivation layer on the anode surface known as the solid-electrolyte-interphase (SEI) layer. A continuous and stable SEI layer can shield the anode from irreversible electrochemical reactions.41,42 To verify the SEI layer, TEM images of the PANI-SiO2@rGO electrode after cycling were acquired in order to better understand the morphology and phase composition characterization of the SEI layer. The SEI can be estimated through the analysis of TEM experiment results, as illustrated in Fig. 7. The following sequence of TEM images shows the SEI layer that formed on the PANI-SiO2@rGO anode after cycle performance testing: on the Fig. 7(a) illustrates the formation of an island-like structure on the electrode surface as it grows. Furthermore, on the electrode surface, it is possible to observe a completely formed continuous SEI layer on the electrode surface in Fig. 7(b). Additionally, after cycling, the structural stability of the materials has a significant effect on the electrode's final electrochemical performance, especially for long cycle life electrodes. TEM images are depicted in Fig. 7(c). The structure is clearly well-preserved. This superior performance is due to the unique structure of the SiO2 nanoparticles, which do not aggregate.
Fig. 7. The TEM investigation of PANI-SiO2@rGO nanocomposite after cycle: solid-electrolyte interface (SEI) formation of (a) island-like structure and (b) completely formed layer, and (c) microstructural-cycled PANI-SiO2@rGO.
Additionally, SiO2 nanoparticles change to Si nanoparticles after cycling, as shown in the TEM images of the electrodes. SiO2 nanoparticles are uniform in size and sphere-shaped. It demonstrated the uniform distribution of nanoparticles. Furthermore, the nanocomposites contain fewer aggregated SiO2 nanoparticles attached to the rGO sheet. As a result, it is clear that the composite has the best dispersion, implying that it must confirm the stability of the materials.
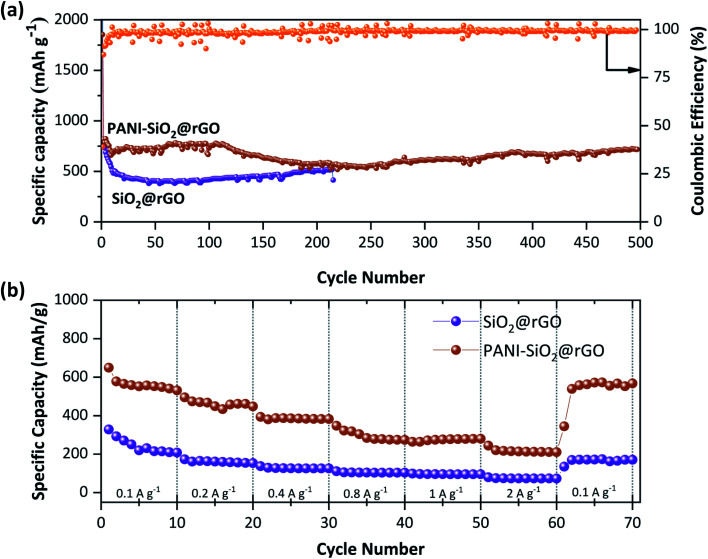
To examine the effect of PANI on the SiO2@rGO anode material, Fig. 8(a) compares the long-term cycling stability of the PANI-SiO2@rGO composite electrode to that of the SiO2@rGO nanocomposite electrode. PANI-SiO2@rGO nanocomposite electrodes exhibit excellent long-term cycling performance at 0.4 A g−1 and retain a significant reversible capacity of 680 mA h g−1 after 400 cycles, nearly twice the capacity of commercial graphite anodes. While, the SiO2@rGO nanocomposite electrode demonstrates a discharge capacity of only 414 mA h g−1 after 215 cycles. This indicates that the SiO2 in PANI-SiO2@rGO nanocomposite did not undergo service pulverization and that the PANI coating could reduce electrolyte decomposition on the SiO2 surface and act as a flexible shell to buffer the volumetric change of SiO2.31,43,44 According to the above results, it was clear that the PANI shell's superior mechanical properties can buffer the volumetric expansion/shrinkage of SiO2 nanoparticles and maintain the integrity of the working electrode structure during discharge/charge cycles, thereby contributing to the long-term cycling stability. The rate performance of PANI-SiO2@rGO and SiO2@rGO nanocomposites electrodes was investigated using current densities ranging from 0.1 to 2.0 A g−1, as shown in Fig. 8(b). The PANi-SiO2@rGO nanocomposite electrode has discharge capacities of 563.6, 462.1, 385.5, 295.9, 274.8 and 217.1 mA h g−1, respectively, at current densities of 0.1, 0.2, 0.4, 0.8, 1, and 2 A g−1. After 2 A g−1, the PANI-SiO2@rGO nanocomposite retained a discharge capacity 539.4 mA h g−1 when the current density switched back to 0.1 A g−1, indicating the composite's outstanding rate performance. All of these results indicate that using PANI-SiO2@rGO nanocomposites to enhance the electrochemical performance of SiO2@rGO is a viable strategy. The enhanced lithium storage capacity of PANI-SiO2@rGO nanocomposites may be a result of their unique architecture. To begin, the shorter path created by SiO2's nanoscale facilitates lithium-ion diffusion and electronic transport at the expense of the rate capability. Second, the coated rGO sheets on the SiO2 surface act as a continuous conductive medium between SiO2 nanoparticles, significantly increasing the conductivity of PANI-SiO2@rGO nanocomposite electrodes. Thirdly, the PANI elastomer is capable of accommodating the volume change of the nanocomposite during Li-alloying/dealloying processes, effectively inhibiting SiO2 pulverization.31,45,46
Fig. 8. Cycling performance and coulombic efficiency of SiO2@rGO and PANI-SiO2@rGO composites at 400 mA g−1 (a) and rate capability of SiO2@rGO and PANI-SiO2@rGO composites (b).
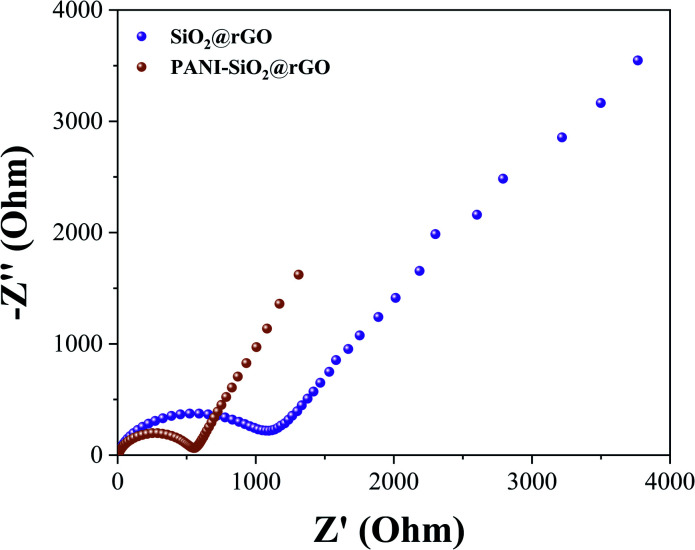
To investigate the improved cycling stability, rate performance, and charge transfer characteristics of the PANI-SiO2@rGO and SiO2@rGO nanocomposite electrodes, electrochemical impedance spectroscopy (EIS) measurements were performed, as shown in Fig. 8. The EIS data were analyzed using Nyquist plots, with the electrode potentially blocking the ionic exchange generated at the electrode/electrolyte interface. At low frequencies, the straight line is due to the Warburg diffusion impedance. The diameter of the semicircle indicates the difficulty associated with charge transfer in an electrochemical system.45,47–49 As illustrated in Fig. 9, the impedance curves for PANI-SiO2@rGO and SiO2@rGO nanocomposites electrode exhibit a single semicircle at high frequency region and a straight line at low frequency region. Although the impedance spectra of both electrodes are similar, the diameters of the two semicircles are different. The semi-circle of SiO2@rGO is significantly larger than that of PANI-SiO2@rGO, implying that SiO2@rGO exhibits a higher electrochemical charge transfer resistance. In other words, charge transfer is greater in the PANI-SiO2@rGO nanocomposite electrode/electrolyte than in the SiO2@rGO nanocomposite electrode, implying that it may have a higher Li-ion transfer conductivity, which is consistent with the cycling performance.42
Fig. 9. The Nyquist plots of SiO2@rGO and PANI-SiO2@rGO composites.
Conclusions
In summary, PANI-SiO2@rGO nanocomposites were synthesized via a simple in situ polymerization method. PANI-SiO2@rGO nanocomposites were synthesized by attaching SiO2 particles to an exfoliated rGO sheet and covering it with the fibrous-like network structure of PANI. The specific capacity of PANI-SiO2@rGO can reach 680 mA h g−1 at 400 mA g−1 when Li+ undergoes the 215th cycles, while the ICE increases to 42.9% when compared to SiO2@rGO nanocomposites. The superior performance could be explained by the fact that PANI-SiO2@rGO works synergistically to overcome the disadvantages of inner SiO2 nanoparticles, such as large volume change and low conductivity, by providing a protective and conductive matrix that buffers the volume change and prevents the SiO2 nanoparticles from aggregating. Not only does the addition of PANI effectively suppress the volume change of SiO2 active materials and stabilize the electrode structure, it also increases the anode's overall electronic conductivity. This work demonstrates the capability of a flexible PANI layer to exhibit the desired electrochemical properties. This low-cost method of self-assembly may enable the development of advanced devices for use in high-performance LIBs.
Conflicts of interest
There are no conflicts to declare.
Supplementary Material
Acknowledgments
This work was gratefully supported by the financial funding from Center of Excellence in Materials Science and Technology, Excellence for Innovation in Chemistry (PERCH-CIC), Ministry of Higher Education, Science, Research and Innovation, the post-doctoral fellowships, Chiang Mai University. This research project was supported by Fundamental Fund 2022, Chiang Mai University. The authors would also like to thank the Renewable Energy Laboratory-Advanced Battery Research Unit, Chiang Mai University for sample preparation, battery cell fabrication, and electrochemical measurements. Department of Chemistry, Faculty of Science, Chiang Mai University, should indeed be acknowledged for characterization and facilities assistance. Advanced electron microscopy was supported by the Collaborative Research Program of Institute for Chemical Research, Kyoto University [Grant No. 2022-127].
References
- Patil S. B. Raghu M. S. Kishore B. Nagaraju G. J. Mater. Sci.: Mater. Electron. 2019;30:316–322. doi: 10.1007/s10854-018-0295-3. [DOI] [Google Scholar]
- Patil S. B. Kishore B. Vishwanatha R. Ebeling G. Nagaraju G. J. Mater. Sci.: Mater. Electron. 2019;30:14456–14463. doi: 10.1007/s10854-019-01815-x. [DOI] [Google Scholar]
- Yang L. Y. Li H. Z. Liu J. Sun Z. Q. Tang S. S. Lei M. Sci. Rep. 2015;5:10908. doi: 10.1038/srep10908. [DOI] [PMC free article] [PubMed] [Google Scholar]
- Liu Z. Yu Q. Zhao Y. He R. Xu M. Feng S. Li S. Zhou L. Mai L. Chem. Soc. Rev. 2019;48:285–309. doi: 10.1039/C8CS00441B. [DOI] [PubMed] [Google Scholar]
- Asenbauer J. Eisenmann T. Kuenzel M. Kazzazi A. Chen Z. Bresser D. Sustain. Energy Fuels. 2020;4:5387–5416. doi: 10.1039/D0SE00175A. [DOI] [Google Scholar]
- Zhang H. Yang Y. Ren D. Wang L. He X. Energy Storage Mater. 2021;36:147–170. doi: 10.1016/j.ensm.2020.12.027. [DOI] [Google Scholar]
- Kim J. Yun A. J. Sheem K. Y. Park B. Nanomaterials. 2021:11. doi: 10.3390/nano12010011. [DOI] [PMC free article] [PubMed] [Google Scholar]
- Tang W. Peng L. Yuan C. Wang J. Mo S. Zhao C. Yu Y. Min Y. Epstein A. J. Synth. Met. 2015;202:140–146. doi: 10.1016/j.synthmet.2015.01.031. [DOI] [Google Scholar]
- Mitra M. Kulsi C. Chatterjee K. Kargupta K. Ganguly S. Banerjee D. Goswami S. RSC Adv. 2015;5:31039–31048. doi: 10.1039/C5RA01794G. [DOI] [Google Scholar]
- Snook G. A. Kao P. Best A. S. J. Power Sources. 2011;196:1–12. doi: 10.1016/j.jpowsour.2010.06.084. [DOI] [Google Scholar]
- Ravi B. Rajender B. Palaniappan S. Int. J. Polym. Mater. Polym. Biomater. 2016;65:835–840. doi: 10.1080/00914037.2016.1171221. [DOI] [Google Scholar]
- Male U. Uppugalla S. Srinivasan P. J. Solid State Electrochem. 2015;19:3381–3388. doi: 10.1007/s10008-015-2978-5. [DOI] [Google Scholar]
- Liu Z. Guan D. Yu Q. Xu L. Zhuang Z. Zhu T. Zhao D. Zhou L. Mai L. Energy Storage Mater. 2018;13:112–118. doi: 10.1016/j.ensm.2018.01.004. [DOI] [Google Scholar]
- Mehta S. S. Nadargi D. Y. Tamboli M. S. Alshahrani T. Minnam Reddy V. R. Kim E. S. Mulla I. S. Park C. Suryavanshi S. S. Sci. Rep. 2021;11:5023. doi: 10.1038/s41598-021-84416-1. [DOI] [PMC free article] [PubMed] [Google Scholar]
- Sarkar S. K. Raul K. K. Pradhan S. S. Basu S. Nayak A. Phys. E: Low-Dimens. Syst. Nanostructures. 2014;64:78–82. doi: 10.1016/j.physe.2014.07.014. [DOI] [Google Scholar]
- Jia P. Y. Liu X. M. Li G. Z. Yu M. Fang J. Lin J. Nanotechnology. 2006;17:734–742. doi: 10.1088/0957-4484/17/3/020. [DOI] [Google Scholar]
- Kaur T. Singh G. P. Kaur G. Kaur S. Gill P. K. Mater. Res. Express. 2016;3:85026. doi: 10.1088/2053-1591/3/8/085026. [DOI] [Google Scholar]
- Xu W. Z. Guo S. C. Xie K. Wang Y. Kang Z. Int. J. Electrochem. Sci. 2018:5645–5653. [Google Scholar]
- Chen Y. Du N. Zhang H. Yang D. RSC Adv. 2015;5:46173–46180. doi: 10.1039/C5RA05869D. [DOI] [Google Scholar]
- Viswanathan A. Shetty A. N. Electrochim. Acta. 2017;257:483–493. doi: 10.1016/j.electacta.2017.10.099. [DOI] [Google Scholar]
- Kim J. Kim M. Cho S. Yoon C.-M. Lee C. Ryu J. Jang J. ChemNanoMat. 2016;2:236–241. doi: 10.1002/cnma.201600006. [DOI] [Google Scholar]
- Ding H. Long Y. Shen J. Wan M. J. Phys. Chem. B. 2010;114:115–119. doi: 10.1021/jp908847u. [DOI] [PubMed] [Google Scholar]
- Zhang L. Wan M. Wei Y. Macromol. Rapid Commun. 2006;27:366–371. doi: 10.1002/marc.200500760. [DOI] [Google Scholar]
- Gong Y. Li D. Fu Q. Pan C. Prog. Nat. Sci. 2015;25:379–385. doi: 10.1016/j.pnsc.2015.10.004. [DOI] [Google Scholar]
- Sharma N. Sharma V. Jain Y. Kumari M. Gupta R. Sharma S. K. Sachdev K. Macromol. Symp. 2017;376:1700006. doi: 10.1002/masy.201700006. [DOI] [Google Scholar]
- Ossonon B. D. Bélanger D. RSC Adv. 2017;7:27224–27234. doi: 10.1039/C6RA28311J. [DOI] [Google Scholar]
- Jumari A. Yudha C. S. Widiyandari H. Lestari A. P. Rosada R. A. Santosa S. P. Purwanto A. Appl. Sci. 2020:10. [Google Scholar]
- Amrollahi S. Ramezanzadeh B. Yari H. Ramezanzadeh M. Mahdavian M. Compos. B Eng. 2019;173:106804. doi: 10.1016/j.compositesb.2019.05.015. [DOI] [Google Scholar]
- Mooss V. A. Athawale A. A. J. Polym. Sci., Part A: Polym. Chem. 2016;54:3778–3786. doi: 10.1002/pola.28277. [DOI] [Google Scholar]
- Lin N. Zhou J. Wang L. Zhu Y. Qian Y. ACS Appl. Mater. Interfaces. 2015;7:409–414. doi: 10.1021/am506404b. [DOI] [PubMed] [Google Scholar]
- Liao Y. Liang K. Ren Y. Huang X. Front. Chem. 2020;8:96. doi: 10.3389/fchem.2020.00096. [DOI] [PMC free article] [PubMed] [Google Scholar]
- Danchenko Y. Andronov V. Vazhynskyi S. Khmyrov I. Khmyrova A. IOP Conf. Ser. Mater. Sci. Eng. 2021;1164:12021. doi: 10.1088/1757-899X/1164/1/012021. [DOI] [Google Scholar]
- Lener G. Otero M. Barraco D. E. Leiva E. P. M. Electrochim. Acta. 2018;259:1053–1058. doi: 10.1016/j.electacta.2017.10.126. [DOI] [Google Scholar]
- Guo B. Shu J. Wang Z. Yang H. Shi L. Liu Y. Chen L. Electrochem. Commun. 2008;10:1876–1878. doi: 10.1016/j.elecom.2008.09.032. [DOI] [Google Scholar]
- Xu W. Z. Guo S. C. Xie K. Wang Y. Kang Z. Int. J. Electrochem. Sci. 2018;13:5645–5653. [Google Scholar]
- Favors Z. Wang W. Bay H. H. George A. Ozkan M. Ozkan C. S. Sci. Rep. 2014;4:4605. doi: 10.1038/srep04605. [DOI] [PMC free article] [PubMed] [Google Scholar]
- Liu X. Yang M. Zhu X. Yang H. Zhou K. Pan D. J. Mater. Sci.: Mater. Electron. 2018;29:6098–6104. doi: 10.1007/s10854-018-8585-3. [DOI] [Google Scholar]
- Chen L. Zheng J. Lin S. Khan S. Huang J. Liu S. Chen Z. Wu D. Fu R. ACS Appl. Energy Mater. 2020;3:3562–3568. doi: 10.1021/acsaem.0c00084. [DOI] [Google Scholar]
- Jayabalan A. D. Din M. M. U. Indu M. S. Karthik K. Ragupathi V. Nagarajan G. S. Panigrahi P. Murugan R. Ionics. 2019;25:5305–5313. doi: 10.1007/s11581-019-03066-6. [DOI] [Google Scholar]
- Pereira-Nabais C. Światowska J. Chagnes A. Ozanam F. Gohier A. Tran-Van P. Cojocaru C.-S. Cassir M. Marcus P. Appl. Surf. Sci. 2013;266:5–16. doi: 10.1016/j.apsusc.2012.10.165. [DOI] [Google Scholar]
- Wang A. Kadam S. Li H. Shi S. Qi Y. Npj Comput. Mater. 2018;4:15. doi: 10.1038/s41524-018-0064-0. [DOI] [Google Scholar]
- Zhang Y. Du N. Yang D. Nanoscale. 2019;11:19086–19104. doi: 10.1039/C9NR05748J. [DOI] [PubMed] [Google Scholar]
- Charlton M. Hatchard T. D. Obrovac M. N. J. Electrochem. Soc. 2020;167:80501. doi: 10.1149/1945-7111/ab8822. [DOI] [Google Scholar]
- Chen Y. IOP Conf. Ser. Mater. Sci. Eng. 2019;677:022115. doi: 10.1088/1757-899X/677/2/022115. [DOI] [Google Scholar]
- Buga M.-R. Spinu-Zaulet A. A. Ungureanu C. G. Mitran R.-A. Vasile E. Florea M. Neatu F. Molecules. 2021:26. doi: 10.3390/molecules26154531. [DOI] [PMC free article] [PubMed] [Google Scholar]
- Wang F. Chen G. Zhang N. Liu X. Ma R. Carbon Energy. 2019;1:219–245. doi: 10.1002/cey2.24. [DOI] [Google Scholar]
- Dong X. Zheng X. Deng Y. Wang L. Hong H. Ju Z. J. Mater. Sci. 2020;55:13023–13035. doi: 10.1007/s10853-020-04905-y. [DOI] [Google Scholar]
- Cao L. Huang J. Lin Z. Yu X. Wu X. Zhang B. Zhan Y. Xie F. Zhang W. Chen J. Meng H. J. Mater. Res. 2018;33:1219–1225. doi: 10.1557/jmr.2017.298. [DOI] [Google Scholar]
- Zu L. Cui X. Jiang Y. Hu Z. Lian H. Liu Y. Jin Y. Li Y. Wang X. Materials. 2015;8:1369–1383. doi: 10.3390/ma8041369. [DOI] [PMC free article] [PubMed] [Google Scholar]
- Autthawong T. Yodbunork C. Yodying W. Boonprachai R. Namsar O. Yu A. Chimupala Y. Sarakonsri T. ACS Omega. 2022;7(1):1357–1367. doi: 10.1021/acsomega.1c05982. [DOI] [PMC free article] [PubMed] [Google Scholar]
- Namsar O. Autthawong T. Boonprachai R. Yu A. Sarakonsri T. J Mater Sci: Mater Electron. 2022;33(9):6536–6548. doi: 10.1007/s10854-022-07828-3. [DOI] [Google Scholar]
- Autthawong T. Chimupala Y. Haruta M. Kurata H. Kiyomura T. Yu A. Chairuangsri T. Sarakonsri T. RSC Adv. 2020;10(71):43811–43824. doi: 10.1039/D0RA07733J. [DOI] [PMC free article] [PubMed] [Google Scholar]


