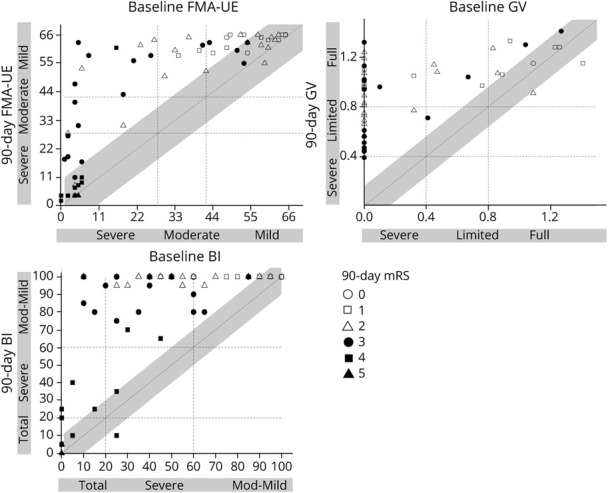
Figure 3. Relationships Between mRS Outcome at 90 Days and Clinically Relevant Changes in Impairment and Function From Baseline to 90 Days.

Top panel shows change in Fugl-Meyer Assessment of Upper Extremity (FMA-UE) defined by minimal clinically important difference (MCID) = 10 (gray-shaded diagonal) and severity category shift (FMA-UE: ≤28 severe-moderate, ≤42 moderate, >42 mild upper extremity motor impairment). Middle panel shows change in gait velocity (GV) defined by MCID = 0.1 (gray-shaded diagonal) and severity category shift (GV: ≤0.46 severe, ≤0.93 limited, >0.93 full ambulation). Bottom panel shows change in Barthel Index (BI) defined by MCID = 10 (gray-shaded diagonal) and severity category shift (BI: ≤20 severe, ≤60 moderate, >60 mild disability). Shapes represent mRS levels at 90 days as indicated in legend. Filled markers represent poor outcome (mRS score ≥3); open makers represent good outcome (mRS score ≤2). Of the patients who achieved at least MCID change on FMA-UE, BI, and GV (all markers left of gray diagonal bars), 48%, 46%, and 41% did not achieve a good outcome on the mRS, respectively. There was poor agreement between achieving mRS good outcome and meaningful change in arm impairment, gait speed, and activities of daily living.
