

SUMMARY
The cerebral cortex is spontaneously active, but the function of this ongoing activity remains unclear. To test whether spontaneous activity encodes learned experiences, we measured the response of neuronal populations in mouse primary visual cortex with chronic two-photon calcium imaging during visual habituation to a specific oriented stimulus. We find that, during habituation, spontaneous activity increases in neurons across the full range of orientation selectivity, eventually matching that of evoked levels. This increase in spontaneous activity robustly correlates with the degree of habituation. Moreover, boosting spontaneous activity with two-photon optogenetic stimulation to the levels of visually evoked activity accelerates habituation. Our study shows that cortical spontaneous activity is linked to habituation, and we propose that habituation unfolds by minimizing the difference between spontaneous and stimulus-evoked activity levels. We conclude that baseline spontaneous activity could gate incoming sensory information to the cortex based on the learned experience of the animal.
In brief
The cerebral cortex is spontaneously active. Miller et al. find that spontaneous cortical activity increases after a visual habituation, a simple form of learning. Furthermore, boosting spontaneous activity with optogenetics is sufficient to accelerate visual habituation. This reveals a direct role of spontaneous cortical activity in visual learning.
Graphical Abstract

INTRODUCTION
The cerebral cortex is spontaneously active (Berger, 1929; Fox and Raichle, 2007), and the function of this activity remains unclear (Harmelech and Malach, 2013; Raichle, 2009). Using calcium imaging of mouse primary visual cortex in vitro and in vivo, we previously found that cortical spontaneous activity, defined as the neural activity that is present in the absence of any sensory stimulation, has spatiotemporal structures that are statistically indistinguishable from sensory-evoked activity (Carrillo-Reid et al., 2015; MacLean et al., 2005; Miller et al., 2014). In other words, the neuronal ensembles activated together by sensory inputs are also active together spontaneously. These findings suggest that intrinsic cortical ensembles are recruited by sensory stimuli. Similar to hippocampal replay, spontaneously active cortical ensembles may act to store learned patterns of activity (Berkes et al., 2011; Ji and Wilson, 2007; Kenet et al., 2003; Miller et al., 2014). This could enable the cortex to predict and respond to incoming sensory inputs, based on past experience. Based on this model, we hypothesized that learning should reshape spontaneous cortical activity to become more similar to sensory-evoked activity. Furthermore, we hypothesized that changes in spontaneous cortical activity could help drive learning.
To test this hypothesis, we used a visual habituation paradigm. Habituation is a major form of adaptive behavior and requires learning and memory (Ramaswami, 2014). Animals learn to tune out a stimulus after repeated exposure, as reflected by their decreased behavioral response to the stimulus. To study learning-related changes in both sensory-evoked activity and spontaneous activity in the primary visual cortex (V1), we imaged the activity of the same neurons in layer 2/3 of V1 in mice using chronic (longitudinal in time) two-photon calcium imaging before and after mice habituate to a visual stimulus. We found that this simple form of learning greatly increases spontaneous activity levels, both during pre-trial and pre-stimulus periods, while stimulus-evoked activity remains stable through the habituation process. This effectively equalizes average spontaneous and evoked activity levels. Moreover, the degree of increase in spontaneous activity relative to evoked activity linearly correlates with the degree of habituation across animals. Interestingly, spontaneous activity increased broadly in neurons across the full range of orientation selectivity. Finally, using two-photon optogenetic stimulation, we found that boosting spontaneous activity levels to that of stimulus-evoked activity is sufficient to accelerate habituation. Our study suggests that habituation unfolds by minimizing the difference between spontaneous and stimulus-evoked activity levels.
RESULTS
Mice behaviorally habituate to repeated visual stimuli
To determine learning-related neuronal changes in spontaneous and visually evoked activity in mouse V1, we used a visual habituation paradigm (Cooke et al., 2015; Ramaswami, 2014). Mice were presented with five trials of 30 s of a pre-stimulus period with a gray screen followed by 100 s of drifting gratings with a single orientation daily for 7 consecutive days (Figures 1A and 1B). This protocol induces visual habituation, as reflected by a decrease in animals’ behavioral movement in response to the stimulus (Cooke et al., 2015). In a control group, the same drifting gratings were presented on day 1 and day 7, but from day 2 to day 6, drifting gratings with different orientations were presented in a random order each day. We measured stimulus-induced running speed over 10 s after the onset of visual stimulation as a behavioral output (Figures 1C–1E; also see Figure S1 for the details of calculating running speed) and then calculated a habituation index from it (Figure 1F).
Figure 1. Mice behaviorally habituate to drifting oriented gratings.

(A) Illustration of a head-fixed awake chronic two-photon imaging setup. Mice were presented with drifting gratings, and their running speed was recorded by a photodiode. Note that the tapes on the wheel, which were shown here for visual clarity, were only present at the bottom of the wheel.
(B) Visual stimulation protocol. Mice became accustomed to head fixation for 3 days while being presented with a gray screen for 30 min. Over the next 7 days, mice were presented with five trials of drifting gratings with a single orientation daily for 10 min. One orientation was randomly selected for each mouse. In a control group, drifting gratings with the same orientation as the habituation group were presented on day 1 and day 7, but from day 2 to day 6, drifting gratings with different orientations were presented in a random order each day.
(C) Example of animal’s running speed during 30 s of pre-stimulus and 100 s of visual stimulus periods averaged over five trials from day 1 through day 7 (see Figure S1 for the details of calculating running speed). Red area indicates the 10-s window that is used to calculate stimulus-induced running (see Figure S1).
(D) Example of running speed from a control mouse.
(E) Running habituates in habituation group, but not control group. Running speed was normalized by day 1 running speed in each mouse (see Figure S2 for raw running speed). n = 14 mice for habituation group; n = 11 mice for control group; *p = 0.004, **p = 0.015, and ***p = 0.0004 by two-way ANOVA with Sidak’s multiple comparisons test.
(F) Habituation index was calculated from normalized running speed (habituation index = [normalized running speed on day 1] − [normalized running speed on day N]). *p = 0.004, **p = 0.015, and ***p = 0.0004 by two-way ANOVA with Sidak’s multiple comparisons test.
Data are presented as mean + SEM.
We found that mice robustly habituated to the familiar visual stimulus after 5 days (Figures 1E and 1F; also see Figure S2 for raw running speed). Habituation was due to the repeated visual stimulus and not to the behavioral setup, since the control group that was exposed to the same behavioral setup did not habituate. Also, the increase in habituation index was not due to a general change in locomotion because normalized running speed over the entire 100 s of visual stimulation did not change (Figures S3A and S3D). In addition to the change in animals’ running speed, we also measured total time spent running and pupil diameters as behavioral outputs, and both measurements supported the conclusion that mice became habituated to the visual stimulus after repeated exposures (Figure S4).
To determine whether this habituation was specific to the stimulus, we presented mice with five trials of the familiar stimulus and five trials of the orthogonal stimulus in a random order on day 7 or day 8 after mice are habituated (Figure S3G). Interestingly, there was no significant difference in the habituation indices between the familiar and orthogonal stimuli. This suggests that, even though the repeated exposure to a stimulus is required to form habituation, once animals get habituated to the stimulus, this habituation is no longer specific to the stimulus.
Spontaneous activity increases as mice habituate
We used this robust behavioral paradigm to measure neuronal responses underlying visual habituation with in vivo two-photon calcium imaging. To explore how habituation reshapes cortical activity, we imaged the activity of the same neurons in layer 2/3 of V1 over the course of visual habituation on day 1 and day 7 (Figures 2A and 2B). At the end of the visual habituation sessions, orientation tuning of all neurons was measured on day 1 and day 7 (Figure S5). On each imaging day, spontaneous pre-trial activity was also measured for 10 min prior to visual stimulation while mice were kept in the dark with a blackout curtain enclosing the setup and the computer monitor turned off. Unexpectedly, we noticed that neuronal activity during the pre-stimulus periods increased on day 7. To confirm this, we analyzed population activity as well as single-cell activity during the pre-stimulus and visual stimulus periods. We found that mean activity during the pre-stimulus period increased significantly after habituation (34.7% increase in population activity on day 7 compared with day 1), whereas the evoked population activity during visual stimulus did not change (Figures 2C–2E and S6A). Due to this increase in mean spontaneous activity, the difference in population activity between pre-stimulus and visual stimulus periods on day 1 disappeared by day 7 after habituation. Interestingly, the spontaneous population activity during the pre-trial period, i.e., prior to the visual stimulation session, also increased after habituation (40.4% increase on day 7 compared with day 1; Figure 2F). In addition to changes in ΔF/F, we also measured calcium transient rate and found the same result (Figure S6B).
Figure 2. Habituation increases spontaneous activity.

(A and B) Top: raster plots of neuronal activity from the same 125 neurons during pre-trial, pre-stimulus, and visual stimulus periods on (A) day 1 and (B) day 7.Bottom: examples of ΔF/F traces on (A) day 1 and (B) day 7 are shown. See Figure S8 for example of ΔF/F traces on days 1, 3, 5, and 7.
(C) Mean ΔF/F of population during pre-stimulus and visual stimulus periods on day 1 and day 7. n = 7 mice; *p = 0.041; **p = 0.007 by one-way ANOVA with Tukey’s multiple comparisons test.
(D) A comparison of mean ΔF/F of single cells during visual stimulus periods on day 1 and day 7. n = 530 cells from 7 mice.
(E) A comparison of mean ΔF/F of single cells during pre-stimulus periods on day 1 and day 7. Red elliptical highlights the cells with significantly increased pre-stimulus ΔF/F on day 7. n = 530 cells from 7 mice.
(F) Mean ΔF/F of population during pre-trial period on day 1 and day 7. n = 7 mice; **p = 0.009 by paired t test.
(G) Percentage of cells per animal that significantly increase pre-stimulus ΔF/F on day 7, compared with day 1 (defined as pre-stimulus cells). Data are presented as mean ± SD.
(H) Distributions of preferred orientations of pre-stimulus cells and the other cells. n = 7 mice; p = 0.36 by two-way ANOVA with Sidak’s multiple comparisons test. Data are presented as mean + SEM.
The increases in spontaneous population activity during pre-stimulus and pre-trial periods were specific to mice that habituated, as population activity did not change in the control group (Figure S7). Importantly, the increases in population activity during pre-stimulus and pre-trial periods were not due to the overall changes in animals’ locomotion, because the mean running speed did not change during pre-stimulus or pre-trial period (Figures S3B, S3C, S3E, and S3F). These results demonstrate that habituation specifically increases cortical spontaneous activity.
Habituation increases spontaneous activity across all orientation selectivity
We speculated that the habituation-induced increase in pre-stimulus activity could derive from neurons that are selective for the stimulus, since they were stimulated preferentially. This would suggest that stimulus-evoked neuronal ensembles are being primed in preparation for the specific expected stimulus (SanMiguel et al., 2013). To test this, we measured the orientation selectivity of the 23% ± 2% of imaged cells that significantly increased spontaneous activity during pre-stimulus period on day 7 (Figure 2G). Surprisingly, we found that they were a mixed population, spanning the full range of orientation selectivity (Figure 2H). In fact, the distribution of preferred orientations of cells with increased activity during the pre-stimulus period was indistinguishable from that of all other cells (Figure 2H). Thus, it appears that spontaneous activity in V1 increases nonspecifically after habituation in this paradigm, regardless of whether neurons responded to the habituated stimulus or not.
Behavioral habituation correlates with the reduction in the difference between mean pre-stimulus and stimulus-induced activity
Since habituation increased population activity during the pre-stimulus period, but not during visual stimulation, the difference between pre-stimulus activity and stimulus-induced neuronal activity significantly decreased after habituation (Figure 3A). Because of this, we hypothesized that the equalization of mean pre-stimulus activity to stimulus-evoked activity may drive habituation. Consistent with this hypothesis, we found a strong correlation between the equalization of mean pre-stimulus activity to stimulus-evoked activity and habituation index (Figure 3B).
Figure 3. Habituation correlates with a reduction in the difference between mean pre-stimulus and stimulus-induced activity.
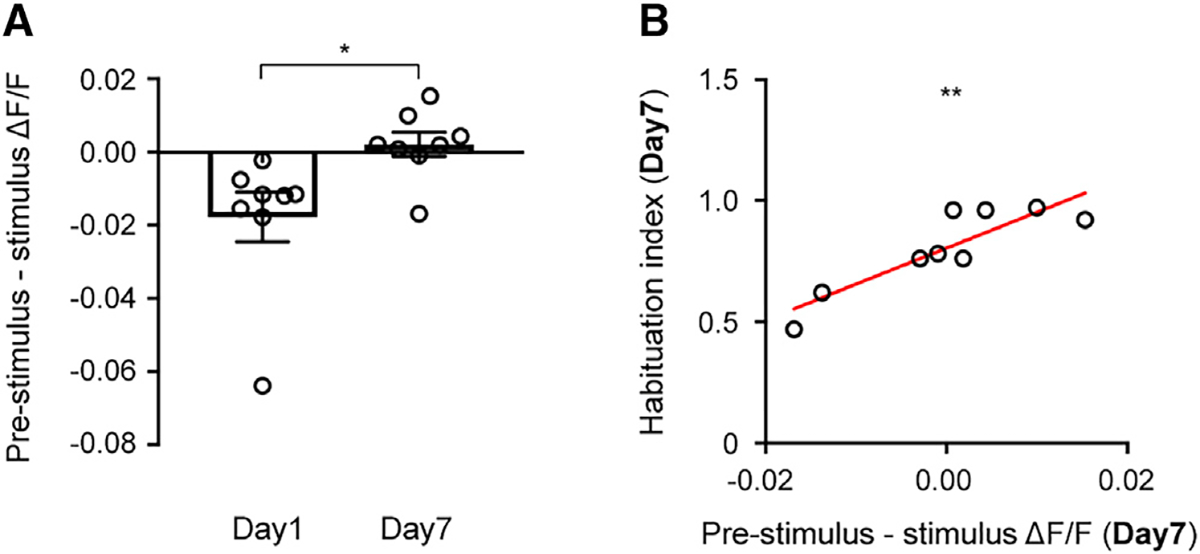
(A) Mean population ΔF/F during the pre-stimulus period subtracted by mean population ΔF/F during the stimulus period on day 1 and day 7; *p = 0.03 by paired t test.
(B) Mean population ΔF/F during pre-stimulus period subtracted by mean population ΔF/F during stimulus period on day 7 significantly correlated with habituation index on day 7. r = 0.87; n = 9 mice; **p = 0.002 by Pearson’s correlation coefficient.
Data are presented as mean + SEM.
Increasing pre-visual stimulus activity accelerates habituation
We then set out to examine whether there is a direct relationship between the equalization of mean pre-stimulus activity to stimulus-evoked activity and habituation. To test this, we mimicked the increase in pre-trial and pre-stimulus spontaneous activity using two-photon optogenetics (Packer et al., 2012), and we determined the effect of this manipulation on behavioral habituation (Figures 4A and 4B). To confirm that we were boosting spontaneous V1 activity to the level seen with natural habituation, we simultaneously imaged V1 activity during optogenetic stimulation (Carrillo-Reid et al., 2016). Mice were injected with GCaMP6f and C1V1 in V1 7 or 8 weeks prior to the optogenetic stimulation experiment. On the experimental day, baseline activity was measured for 10 min prior to performing optogenetic stimulation. Mice then underwent the same habituation paradigm described before (Figure 1), with the addition of optogenetic stimulation during the pre-stimulus and pre-trial periods in order to boost activity during these periods to mimic the effects of natural habituation.
Figure 4. Increasing pre-visual stimulus activity accelerates habituation.

(A) Illustration of a head-fixed setup with simultaneous two-photon imaging and two-photon optogenetic stimulation.
(B) Mice became accustomed to head fixation for 3 days while being presented with gray screen. Over the next 4 days, mice were presented with five trials of drifting gratings with a single orientation daily as described in Figure 1. In addition, two-photon optogenetic stimulation was performed during pre-trial and pre-stimulus periods. Calcium signals were recorded simultaneously.
(C) Mean % increase in population ΔF/F during pre-visual stimulus period on day 1 and day 3 of optogenetic stimulation, compared with the baseline population ΔF/F in the absence of optogenetic stimulation on day 1. The red line indicates mean % increase in population ΔF/F during pre-visual stimulus period on day 7 of natural habituation. n = 7 mice for both groups; *p = 0.027 by paired t test.
(D) Habituation index on day 1 and day 3 of optogenetic stimulation. The red line indicates habituation index on day 7 of natural habituation. n = 7 mice for both groups; ***p = 0.0009 by paired t test.
(E) Mean population ΔF/F during pre-visual stimulus period subtracted by mean population ΔF/F during visual stimulus period on day 3 was significantly correlated with habituation index on day 3 after optogenetic stimulation. r = 0.77; n = 7 mice; *p = 0.022 by Pearson’s correlation coefficient.
(F) A proposed model illustrating the role of spontaneous activity in visual habituation. When an animal is exposed to a visual stimulusfor the first time, a sharp stimulus-induced increase in neuronal activity above baseline leads to behavioral response. After repeated exposure to the visual stimulus, spontaneous activity increases (red arrow). As a result, stimulus-induced neuronal activity relative to pre-visual stimulus activity is reduced, and this results in a reduced behavioral response.
Data are presented as mean ± SEM.
Control mice underwent the same experimental procedure except that they were injected only with GCaMP6f. The distribution of orientation selectivity of optogenetically stimulated neurons was indistinguishable from that of neurons that increase spontaneous activity during habituation (Figures S8A and S8B). To rule out the possibility that the calcium signals may be affected by the presence of C1V1, we compared the distributions of mean ΔF/F and orientation-selective index of cells expressing C1V1 with those of cells that do not express C1V1 and found no difference between two populations (Figures S8C and S8D).
On the 1st day of optogenetic stimulation, pre-visual stimulus activity increase reached that of day 3 of natural habituation (19.17% ± 6.42% increase on day 1 of optogenetic stimulation and 17.62% ± 3.88% increase on day 3 of natural habituation). By day 3 of optogenetic stimulation, we were able to boost pre-visual stimulus V1 activity to the level seen on day 7 of natural habituation (37.69% ± 12.29% increase on day 3 of optogenetic stimulation and 34.7% ± 10.05% increase on day 7 of natural habituation; Figure 4C). In this way, we were able to experimentally accelerate the increase of spontaneous activity and compare the impact of increasing pre-visual stimulus activity to a level seen before habituation (day 1 of optogenetic stimulation and day 3 of natural habituation activity level) with a level seen after habituation (day 3 of optogenetic stimulation and day 7 of natural habituation activity level).
We found that optogenetically boosting pre-visual stimulus V1 activity to that seen after natural habituation induced the full day 7 level of behavioral habituation (Figure 4D; habituation index of 0.67 ± 0.08 on day 3 of optogenetic stimulation and 0.81 ± 0.05 on day 7 of natural habituation). Importantly, this behavioral effect emerged only when pre-visual stimulus V1 activity reached the full level seen in natural habituation (day 3 of optogenetic stimulation; Figure 4D).
As a control, we also tested whether optogenetic stimulation itself in the absence of visual stimulation could induce any changes in animals’ running speed, the main behavioral readout of habituation in our experiments. For this, we focused on our optogenetic stimulation data during pre-trial period in the absence of visual stimulation and analyzed mean running speed before, during, and after optogenetic stimulation (Figure S8E). We found that the optogenetic stimulation per se does not induce changes in animals’ running speed. This is important for two reasons. First, it shows that optogenetic stimulation does not cause a boost in baseline running that obscures stimulus-induced running. Second, it makes it unlikely that optogenetic stimulation induces an artificial percept that is equivalent to that induced by true drifting grating visual stimuli (if they were experiencing such a percept, they would run when first exposed to the optogenetic stimulation). Also, control mice that were injected with only GCaMP6 displayed no habituation on day 3 of optogenetic stimulation (Figure S8F).
Individual correlations between pre-visual stimulus activity and accelerated habituation
To probe further the potential direct relation between spontaneous activity and habituation, we took advantage of small inter-animal differences in optogenetic activation and habituation in the optogenetic cohort. We found a strong correlation between degree of increase in mean pre-visual stimulus activity with optogenetics and the degree of habituation (Figure 4E). While habituation accelerated in all animals, animals with greater stimulated activity, relative to visually evoked activity, also displayed greater behavioral habituation. Thus, there was a “dose-response” relationship of optogenetically increasing mean pre-visual stimulus activity and habituation.
DISCUSSION
Here, we report evidence that a change in cortical spontaneous activity is causally related to a simple form of learning. With two-photon calcium imaging of mouse primary visual cortex, we monitored the activity of the V1 neurons as visual habituation unfolded and unexpectedly discovered a sizable increase in spontaneous V1 activity. This only occurred in the spontaneous activity, as we found no such increase in visually evoked activity. Furthermore, spontaneous activity only increased after the repetition of a familiar stimulus and did not increase after the presentation of varied novel stimuli. We also found that, after several days of habituation, mean spontaneous activity increased to the level of stimulus-evoked activity. This equalization of mean activity was a signature of habituation—it was strongly correlated with the degree of habituation. We hypothesized that the equalization of mean spontaneous and stimulus-evoked activity could be causally linked to habituation. We tested this with two-photon optogenetics and found that boosting pre-visual stimulus activity levels to that of visual stimulus levels indeed induces habituation. Thus, increases in spontaneous activity to visually evoked levels may represent a previously unknown mechanism of sensory learning and a novel form of cortical plasticity.
The increase in spontaneous activity that we found after habituation differs from changes in neuronal activity that occur after instrumental learning, where learned sequences of activity replay at rest and may form a kind of internal practice (Eagleman and Dragoi, 2012; Guidotti et al., 2015; Henschke et al., 2020; Ji and Wilson, 2007). In contrast, after habituation, we see a widespread increase in V1 activity across the entire spectrum of orientation selectivity. Remarkably, this increase in spontaneous activity is present even prior to the first visual stimulus of the session. Importantly, the habituation of running that we described is not stimulus specific (Ramaswami, 2014) but represents a novel form of habituation that can generalize across stimuli. In summary, our findings provide a direct demonstration that boosting spontaneous activity can accelerate a form of learning.
Limitations of the study
Our findings raise two questions for future study. First, what are the circuit mechanisms underlying the increase in spontaneous activity? One possibility is that the increase in excitatory drive results from disinhibition, perhaps by the cingulate cortex. Indeed, mouse cingulate cortex projects directly to V1, and this input has a net inhibitory effect in V1 activity (Zhang et al., 2014). Therefore, decreased input from cingulate cortex could boost pyramidal neuron activity in V1 via disinhibition. Furthermore, the cingulate cortex is a key regulator of visual attention (Corbetta and Shulman, 2002; Kastner and Ungerleider, 2000; Kim et al., 2016; Posner and Petersen, 1990; Wu et al., 2017), and thereby, a decrease in attention could increase spontaneous activity in V1. Alternatively, the increase in spontaneous activity may be driven by V1 itself as a way to locally regulate attentional processes or perceptual saliency.
Second, how could an increase in spontaneous activity result in behavioral habituation? We propose that, prior to habituation, the presentation of a novel stimulus generates a rapid increase in V1 activity from baseline, and this rapid increase could be a signal for behavioral activation (Figure 4F). As a form of perceptual saliency, this novel stimulus-induced V1 activity could be read by and acted on by a motor program (Goodale, 2011) or relayed to a regulator of arousal, such as the locus coeruleus (Hagan et al., 1999; Sara and Bouret, 2012), and secondarily increase locomotion through an increase in arousal. The learning-induced increases in spontaneous activity would cancel out this rapid increase in V1 activity, perhaps canceling a resulting attentional signal, and lead to behavioral habituation.
STAR★METHODS
RESOURCE AVAILABILITY
Lead contact
Further information and requests for resources and reagents should be directed to and will be fulfilled by the lead contact, Jae-eun Kang Miller (jkm2149@cumc.columbia.edu).
Materials availability
This study did not generate new reagents.
Data and code availability
Microscopy data reported in this paper will be shared by the lead contact upon request. All original code has been deposited at Zenodo and is publicly available as of the date of publication. DOIs are listed in the key resources table. Any additional information required to reanalyze the data reported in this paper is available from the lead contact upon request.
KEY RESOURCES TABLE.
| REAGENT or RESOURCE | SOURCE | IDENTIFIER |
|---|---|---|
|
| ||
| Bacterial and virus strains | ||
|
| ||
| AAV1.Syn.GCaMP6f.WPRE.SV40 | the University of Pennsylvania Vector Core | 50943-AAV1 |
| AAVDJ-CaMKII-C1V1-(E162T)-TS-p2A-mCherry-WPRE | Stanford Neuroscience Gene Vector and Virus Core | GVVC-AAV-48 |
|
| ||
| Deposited data | ||
|
| ||
| matlab codes | Zenodo | https://doi.org/10.zenodo5281/zenodo.6026825 |
|
| ||
| Experimental models: Organisms/strains | ||
|
| ||
| C57BL/6 mice | jax | 000664 |
EXPERIMENTAL MODEL AND SUBJECT DETAILS
Animals
All experimental procedures were carried out in accordance with Columbia University institutional animal care guidelines. Experiments were performed on C57BL/6 male mice at the age of postnatal day 70–P150. Twenty-five mice were used for the behavior experiment (14 mice for the habituation group and 11 mice for the control group) and 13 out of 25 mice were imaged using chronic calcium imaging (7 mice for the habituation group and 6 mice for the control group). The seven mice in the habituation group that were imaged were exposed to 5 trials of the familiar stimulus and 5 trials of the orthogonal stimulus presented in a random order on day 7 (n = 5 mice) or day 8 (n = 2 mice). Two additional mice were added to the habituation group for analysis for Figure 3. Three mice were used to test parameters for two-photon photostimulation and 14 mice were used for the two-photon photostimulation experiment (7 mice for the experimental group and 7 mice for the control group).
METHOD DETAILS
Surgery and training
Virus injection, head plate implantation, and craniotomy were carried out in that order over the course of 4–8 weeks. In the first surgery (virus injection), 3–7 weeks prior to the first imaging session, mice were anesthetized with isoflurane (initially 3% (partial pressure in air) and reduced to 1%–2%). Carprofen (5 mg/kg) was administered intraperitoneally. A small window was made through the skull above left V1 using a dental drill (coordinates from lambda: X = −250, Y = 30 μm) taking care not to pierce the dura mater. A glass capillary pulled to a sharp micropipette was advanced with the stereotaxic instrument. For chronic calcium imaging only, 400nL solution of 3:1 diluted AAV1.Syn.GCaMP6f.WPRE.SV40 (obtained from the University of Pennsylvania Vector Core) was injected into putative layer 2/3 at a rate of 80 nL/min at a depth of 250 μm from the pial surface using a UMP3 microsyringe pump (World Precision Instruments). For simultaneous two-photon optogenetics and calcium imaging, 650nL solution of mixed AAV1-syn-GCaMP6f and AAVDJ-CaMKII-C1V1-(E162T)-TS-p2A-mCherry-WPRE (1.5:5 ratio; obtained from Stanford Neuroscience Gene Vector and Virus Core) was injected using the same procedure. Our lab previously reported that 40%–60% of the cells co-expressed both viruses using this injection method (Carrillo-Reid et al., 2016). After surgery animals received carprofen injections for 2 days as post-operative pain medication.
Approximately 3 weeks (for chronic calcium imaging only) or 7 weeks (for simultaneous two-photon optogenetics and calcium imaging) after virus injection, mice were anesthetized as previously described and a titanium head plate was attached to the skull centered on the virus injection site using dental cement. Mice were allowed to recover for a day in their home cage and given carprofen intraperitoneally (5mg/kg) for 2 days. Mice then underwent training to maneuver with their head fixed approximately 1 inch above a rotating wheel while being presented with gray screen for 30 min daily for 3 days. After the first training session, mice could distribute weight on the wheel evenly and appeared calm (grooming, locomotion). This head-fixed awake preparation allows mice to move freely.
After being accustomed to head-fixation for 3 days, mice were anesthetized again with isoflurane. Dexamethasone sodium phosphate (2 mg/kg) and enrofloxacin (4.47 mg/kg) were administered subcutaneously. Carprofen (5 mg/kg) was administered intraperitoneally. A small circle of the skull centered on the virus injection site (approximately 2 mm in diameter) was removed using a dental drill and the dura mater was carefully removed using fine forceps. A circular glass coverslip (3 mm in diameter) was put on top of the exposed brain and secured using Krazy glue. After surgery animals received carprofen injections for 2 days as post-operative pain medication. Mice were then allowed to recover for a day in their home cage before the first imaging session.
Visual habituation
Visual stimuli were generated using the MATLAB Psychophysics Toolbox(Brainard, 1997) and displayed on a liquid crystal display monitor (19-inch diameter, 60-Hz refresh rate) positioned 15 cm from the right eye, roughly at 45° to the long axis of the animal. Pre-trial spontaneous calcium signals were measured for 10 min in the dark condition with a computer monitor turned off prior to the visual stimulation session (pre-trial period). The imaging setup was completely enclosed with blackout fabric (Thorlabs). After pre-trial spontaneous calcium signals were collected, mice were presented with 5 trials of mean luminescence gray screen for 30 s (pre-stimulus period) followed by full-field sine wave gratings at a single orientation drifting in one direction (100% contrast, 0.05 cycles per degree, and two cycles per second) for 100 s (visual stimulus period). Orientation was randomly chosen for each mouse. Visual stimulation was repeated for 7 days. In a control group, drifting gratings at a single orientation were presented on day 1 and day 7, but from day 2 to day 6 drifting gratings with different orientations were presented in a random order each day. To calculate orientation tuning curves of all imaged cells, mice were presented with an additional orientation tuning session at the end of a visual habituation session on day 1 and day 7. Full-field sine wave grating stimuli (100% contrast, 0.05 cycles per degree, two cycles per second) drifting in eight different directions were presented in random order for 5 s, followed by 5 s of mean luminescence gray screen (10 repetitions).
Previously, a behavioral output of a visual habituation was reliably measured in mice as a fidget behavior in response to the onset of a visual stimulus in a head-fixed restraint condition (Cooke et al., 2015). Similarly, increased running speed at the onset of a visual stimulus was used as a behavioral output in our head-fixed freely moving condition. Running was tracked using a photodiode coupled to a custom-made circuit board to provide a voltage output. Small pieces of black tape (0.5 cm width) were placed under a rotating wheel with 0.5cm intervals and a photodiode was positioned in a rotating wheel as shown in Figure 1A. As mice pass a piece of black tape, it generates a shift in a voltage signal and the number of shifts in a unit of time provides a running speed (Figure S1).
We applied the following three steps to determine habituation index. Step 1 is to determine a stimulus-induced running speed by dividing the mean running speed over 10 s after the onset of visual stimulation with the mean baseline running speed over 2 s before the onset of visual stimulation in each trial. ΔRS(t) = RSv(t)/RSb(t), where RSv(t) is the mean running speed over 10 second-window after onset of visual stimulation on trial t, and RSb(t) is the mean running speed over 2 second-window before trial t. Stimulus-induced running speed was determined as a mean of ΔRS across 5 trials. Step 2 is to determine the change in stimulus-induced running speed throughout the habituation paradigm relative to the first day. To do so, took the stimulus-induced running speed of each day throughout the habituation paradigm, and divided it by the stimulus-induced running speed of day1 in each mouse. Norm-ΔRS = [ΔRS(dayN)/ΔRS(day1)], where ΔRS(dayN) is stimulus-induced running speed on day N and ΔRS(day1) is stimulus-induced running speed on day 1. This shows the day-by-day change in stimulus-induced running speed over the course of habituation. Finally in step 3, we calculate habituation index as follows: Habituation index = NormΔRS(day1) minus NormΔRS(dayN). This approach is a simple way to show that habituation increases over time (as shown by the increasing habituation index). However, we also see clear habituation when we use the raw running speed as shown in Figure S3.
Measuring pupil diameter
Pupil diameter was recorded with two synchronized cameras using Kinovea software: one positioned at the pupil, and another positioned to capture the screen. Both cameras recorded at 60 frames-per-second. The entire experiment was conducted in the dark room with NIR illumination. Videos were converted with Handbrake to.mp4 for better windows support. The converted videos were processed using Davinci Revolve, extracting and writing separate.mp4’s for the 120 frames (2 s) before and 600 frames (10 s) after each stimulus induction. Thus, each mouse’s daily training produced 5 ‘PRE’ videos and 5 ‘POST’ videos. Each PRE and POST video was imported into MATLAB as a grayscale 3D tensor of pixels in the format WidthXHeightXTime. The mean of each pixel over time was calculated, and the resulting WidthXHeight mean imaged was written as a new image. Pupil size was estimated using ImageJ; the images were uniformly contrast enhanced (1.0% of pixels saturated) and their area manually approximated using the oval selection tool. Blinding was implemented through the BlindAnalysis plugin. With the mean pupil areas for each PRE-POST of every cycle, we calculated the POST/PRE ratio for each cycle within each animal’s sessions.
Two-photon calcium imaging and two-photon optogenetic stimulation
Activity of cortical neurons was recorded by imaging changes of fluorescence with a two-photon microscope (Bruker; Billerica, MA) and a Ti:Sapphire laser (Chameleon Ultra II; Coherent) at 940 nm through a 25× objective (water immersion, N.A. 1.05, Olympus). Resonant galvanometer scanning and image acquisition (frame rate 30.206 or 3.246 fps, 512 × 512 or 256 × 256 pixels, ~250μm beneath the pial surface) were controlled by Prairie View Imaging software.
Simultaneous two-photon imaging and optogenetic stimulation were performed with two different femtosecond-pulsed lasers attached to a commercial microscope. An imaging laser (λ = 940 nm) was used to excite a genetically encoded calcium indicator (GCaMP6f) while an optogenetic stimulation laser (λ = 1040 nm) was used to excite a red shifted opsin (C1V1) that preferentially responds to longer wavelengths (Spirit 1040–8, Spectra-physics, Santa Clara, California). The two laser beams on the sample are individually controlled by two independent sets of galvanometric scanning mirrors.
Population optogenetic stimulation was performed by synchronizing the photostimulation galvanometers with the imaging galvanometers integrated into the dual beam microscope, i.e. the optogenetic stimulation beam was scanned across the whole field of view. This generates a 4Hz stimulation in each pixel. Using a separate cohort (n = 3 mice), we tried four different laser powers (2.25, 4.5, 5.7, and 10 mW) and decided to use the laser power of 5.7mW and the stimulation duration of 500ms for the rest of optogenetic stimulation experiments (Carrillo-Reid et al., 2016; Yang et al., 2018). This stimulation parameter increased spontaneous activity by 35.6% ± 8.8% over the duration of 1-min stimulation. This increase mimics the increase in spontaneous activity after 7 days of natural habituation.
In the optogenetic stimulation experiment, the baseline pre-trial activity was measured for 10 min prior to performing photostimulation. After measuring the baseline activity, neurons expressing C1V1 were stimulated during 15 min of pre-trial period and during the entire pre-stimulus period. During the pre-trial period, the photostimulation beam was scanned across the whole field of view with the duration of 500 ms, followed by 10 s interval for 28 trials in one session lasting for 5 min. Three sessions were repeated with 5 min interval between sessions. During the pre-stimulus period, the photostimulation beam was scanned across the whole field of view with the duration of 500 ms, followed by 4 s interval for 6 trials lasting for the entire pre-stimulus period. In the experimental group, this stimulation protocol increased neuronal activity by 35.6% ± 9.2% over the first 1 minute-period, similarly as in our pilot experiment. However, over the entire pre-visual stimulus period, this stimulation protocol increased neuronal activity by 19.17% ± 7.0% on the first day of optogenetic stimulation and this increase is similar to the pre-visual stimulus activity levels on day 3 of natural habituation. By day 3 of optogenetic stimulation, however, pre-visual stimulus activity increased by 37.7% ± 8.3% which is similar to the pre-visual stimulus activity levels on day 7 of natural habituation.
Image analysis
Image analysis was performed using ImageJ and built-in and custom-built software in MATLAB. Images were first converted to TIFF format and registered to correct for x−y motion using Turboreg plug-in in ImageJ (Thevenaz et al., 1998). Initial image processing was carried out using custom-written software in MATLAB (Caltracer 3 Beta, available at our laboratory website). Regions of interest (ROIs) were drawn around each cell using a semi-automated algorithm based on fluorescence intensity (mean projection), fluorescence change (standard-deviation projection), and cell size and shape and were adjusted by visual inspection. All pixels within each ROI were averaged to give a single time course, and ΔF/F was calculated by subtracting each value with the mean of the lower 50% of previous 10-s values and dividing it by the mean of the lower 50% of previous 10-s values. Neurons with noisy signal with no apparent calcium transient were detected by visual inspection and excluded from further analysis. Neuropil contamination was removed by first selecting a spherical neuropil shell (6.2-μm thickness) surrounding each neuron and then subtracting the average signal of all pixels within the spherical neuropil shell, excluding adjacent ROIs and pixels within 0.3 μm surrounding ROIs, from the average signal of all pixels within the ROI.
To analyze the orientation selective index (OSI), we used data recorded during an additional imaging session on day 1 in which mice were presented with full-field sine wave grating stimuli (100% contrast, 0.05 cycles per degree, two cycles per second) drifting in eight different directions in random order for 5 s, followed by 5 s of mean luminescence gray screen (10 repetitions). Average ΔF/F was taken as the response to each grating stimulus. Responses from 10 trials were averaged to obtain an orientation-tuning curve or matrix. The preferred orientation was taken as the modulus of the preferred direction to 180°. The OSI was calculated as (Rbest − Rortho)/(Rbest + Rortho), where Rbest is the best direction and Rortho is the average of responses to the direction orthogonal to the best direction(Hofer et al., 2011). Cells with an OSI <0.4 were considered to be unselective for orientation.
QUANTIFICATION AND STATISTICAL ANALYSIS
Statistical tests were performed in Prism (Graphpad) software. Differences between two groups or within a group were assessed using non-paired or paired Student’s t-test, respectively. Differences between multiple groups were assessed using one-way analysis of variance (ANOVA) followed by a Tukey’s multiple comparisons test. Differences between and within multiple groups were assessed using two-way analysis of variance followed by a Sidak’s multiple comparisons test. To evaluate the association between two variables, Pearson correlation coefficient was used. p < 0.05 was considered statistically significant. Two-tailed test was used unless stated otherwise.
Supplementary Material
Highlights.
Mice behaviorally habituate to repeated visual stimuli
Spontaneous activity, not visually evoked activity, increases after habituation
This increase in spontaneous activity robustly correlates with habituation
Boosting spontaneous activity with two-photon stimulation accelerates habituation
ACKNOWLEDGMENTS
We thank all laboratory members for comments and help and especially Reka Letso for virus injections. This work was supported by the National Eye Institute (R01EY011787 and K99EY024653).
Footnotes
DECLARATION OF INTERESTS
The authors declare no competing interests.
SUPPLEMENTAL INFORMATION
Supplemental information can be found online at https://doi.org/10.1016/j.celrep.2022.110751.
REFERENCES
- Berger H (1929). Über das Elektrenkephalogramm des Menschen. Archiv für Psychiatrie und Nervenkrankheiten 87, 527–570. [Google Scholar]
- Berkes P, Orban G, Lengyel M, and Fiser J (2011). Spontaneous cortical activity reveals hallmarks of an optimal internal model of the environment. Science 331, 83–87. [DOI] [PMC free article] [PubMed] [Google Scholar]
- Brainard DH (1997). The psychophysics toolbox. Spat. Vis 10, 433–436. [PubMed] [Google Scholar]
- Carrillo-Reid L, Miller JE, Hamm JP, Jackson J, and Yuste R (2015). Endogenous sequential cortical activity evoked by visual stimuli. J. Neurosci 35, 8813–8828. [DOI] [PMC free article] [PubMed] [Google Scholar]
- Carrillo-Reid L, Yang W, Bando Y, Peterka DS, and Yuste R (2016). Imprinting and recalling cortical ensembles. Science 353, 691–694. [DOI] [PMC free article] [PubMed] [Google Scholar]
- Cooke SF, Komorowski RW, Kaplan ES, Gavornik JP, and Bear MF (2015). Visual recognition memory, manifested as long-term habituation, requires synaptic plasticity in V1. Nat. Neurosci 18, 262–271. [DOI] [PMC free article] [PubMed] [Google Scholar]
- Corbetta M, and Shulman GL (2002). Control of goal-directed and stimulus-driven attention in the brain. Nat. Rev. Neurosci 3, 201–215. [DOI] [PubMed] [Google Scholar]
- Eagleman SL, and Dragoi V (2012). Image sequence reactivation in awake V4 networks. Proc. Natl. Acad. Sci. U S A 109, 19450–19455. [DOI] [PMC free article] [PubMed] [Google Scholar]
- Fox MD, and Raichle ME (2007). Spontaneous fluctuations in brain activity observed with functional magnetic resonance imaging. Nat. Rev. Neurosci 8, 700–711. [DOI] [PubMed] [Google Scholar]
- Goodale MA (2011). Transforming vision into action. Vis. Res 51, 1567–1587. [DOI] [PubMed] [Google Scholar]
- Guidotti R, Del Gratta C, Baldassarre A, Romani GL, and Corbetta M (2015). Visual learning induces changes in resting-state fMRI multivariate pattern of information. J. Neurosci 35, 9786–9798. [DOI] [PMC free article] [PubMed] [Google Scholar]
- Hagan JJ, Leslie RA, Patel S, Evans ML, Wattam TA, Holmes S, Benham CD, Taylor SG, Routledge C, Hemmati P, et al. (1999). Orexin A activates locus coeruleus cell firing and increases arousal in the rat. Proc. Natl. Acad. Sci. U S A 96, 10911–10916. [DOI] [PMC free article] [PubMed] [Google Scholar]
- Harmelech T, and Malach R (2013). Neurocognitive biases and the patterns of spontaneous correlations in the human cortex. Trends Cogn. Sci 17, 606–615. [DOI] [PubMed] [Google Scholar]
- Henschke JU, Dylda E, Katsanevaki D, Dupuy N, Currie SP, Amvrosiadis T, Pakan JMP, and Rochefort NL (2020). Reward association enhances stimulus-specific representations in primary visual cortex. Curr. Biol 30, 1866–1880.e5. [DOI] [PMC free article] [PubMed] [Google Scholar]
- Hofer SB, Ko H, Pichler B, Vogelstein J, Ros H, Zeng H, Lein E, Lesica NA, and Mrsic-Flogel TD (2011). Differential connectivity and response dynamics of excitatory and inhibitory neurons in visual cortex. Nat. Neurosci 14, 1045–1052. [DOI] [PMC free article] [PubMed] [Google Scholar]
- Ji D, and Wilson MA (2007). Coordinated memory replay in the visual cortex and hippocampus during sleep. Nat. Neurosci 10, 100–107. [DOI] [PubMed] [Google Scholar]
- Kastner S, and Ungerleider LG (2000). Mechanisms of visual attention in the human cortex. Annu. Rev. Neurosci 23, 315–341. [DOI] [PubMed] [Google Scholar]
- Kenet T, Bibitchkov D, Tsodyks M, Grinvald A, and Arieli A (2003). Spontaneously emerging cortical representations of visual attributes. Nature 425, 954–956. [DOI] [PubMed] [Google Scholar]
- Kim J, Wasserman EA, Castro L, and Freeman JH (2016). Anterior cingulate cortex inactivation impairs rodent visual selective attention and prospective memory. Behav. Neurosci 130, 75–90. [DOI] [PMC free article] [PubMed] [Google Scholar]
- MacLean JN, Watson BO, Aaron GB, and Yuste R (2005). Internal dynamics determine the cortical response to thalamic stimulation. Neuron 48, 811–823. [DOI] [PubMed] [Google Scholar]
- Miller JE, Ayzenshtat I, Carrillo-Reid L, and Yuste R (2014). Visual stimuli recruit intrinsically generated cortical ensembles. Proc. Natl. Acad. Sci. U S A 111, E4053–E4061. [DOI] [PMC free article] [PubMed] [Google Scholar]
- Packer AM, Peterka DS, Hirtz JJ, Prakash R, Deisseroth K, and Yuste R (2012). Two-photon optogenetics of dendritic spines and neural circuits. Nat. Methods 9, 1202–1205. [DOI] [PMC free article] [PubMed] [Google Scholar]
- Posner MI, and Petersen SE (1990). The attention system of the human brain. Annu. Rev. Neurosci 13, 25–42. [DOI] [PubMed] [Google Scholar]
- Raichle ME (2009). A paradigm shift in functional brain imaging. J. Neurosci 29, 12729–12734. [DOI] [PMC free article] [PubMed] [Google Scholar]
- Ramaswami M (2014). Network plasticity in adaptive filtering and behavioral habituation. Neuron 82, 1216–1229. [DOI] [PubMed] [Google Scholar]
- SanMiguel I, Widmann A, Bendixen A, Trujillo-Barreto N, and Schroger E (2013). Hearing silences: human auditory processing relies on preactivation of sound-specific brain activity patterns. J. Neurosci 33, 8633–8639. [DOI] [PMC free article] [PubMed] [Google Scholar]
- Sara SJ, and Bouret S (2012). Orienting and reorienting: the locus coeruleus mediates cognition through arousal. Neuron 76, 130–141. [DOI] [PubMed] [Google Scholar]
- Thevenaz P, Ruttimann UE, and Unser M (1998). A pyramid approach to subpixel registration based on intensity. IEEE Trans. Image Process 7, 27–41. [DOI] [PubMed] [Google Scholar]
- Wu D, Deng H, Xiao X, Zuo Y, Sun J, and Wang Z (2017). Persistent neuronal activity in anterior cingulate cortex correlates with sustained attention in rats regardless of sensory modality. Sci. Rep 7, 43101. [DOI] [PMC free article] [PubMed] [Google Scholar]
- Yang W, Carrillo-Reid L, Bando Y, Peterka DS, and Yuste R (2018). Simultaneous two-photon optogenetics and imaging of cortical circuits in three dimensions. eLife 7, e32671. [DOI] [PMC free article] [PubMed] [Google Scholar]
- Zhang S, Xu M, Kamigaki T, Hoang Do JP, Chang WC, Jenvay S, Miyamichi K, Luo L, and Dan Y (2014). Selective attention. Long-range and local circuits for top-down modulation of visual cortex processing. Science 345, 660–665. [DOI] [PMC free article] [PubMed] [Google Scholar]
Associated Data
This section collects any data citations, data availability statements, or supplementary materials included in this article.
Supplementary Materials
Data Availability Statement
Microscopy data reported in this paper will be shared by the lead contact upon request. All original code has been deposited at Zenodo and is publicly available as of the date of publication. DOIs are listed in the key resources table. Any additional information required to reanalyze the data reported in this paper is available from the lead contact upon request.
KEY RESOURCES TABLE.
| REAGENT or RESOURCE | SOURCE | IDENTIFIER |
|---|---|---|
|
| ||
| Bacterial and virus strains | ||
|
| ||
| AAV1.Syn.GCaMP6f.WPRE.SV40 | the University of Pennsylvania Vector Core | 50943-AAV1 |
| AAVDJ-CaMKII-C1V1-(E162T)-TS-p2A-mCherry-WPRE | Stanford Neuroscience Gene Vector and Virus Core | GVVC-AAV-48 |
|
| ||
| Deposited data | ||
|
| ||
| matlab codes | Zenodo | https://doi.org/10.zenodo5281/zenodo.6026825 |
|
| ||
| Experimental models: Organisms/strains | ||
|
| ||
| C57BL/6 mice | jax | 000664 |