

Abstract
Propionic Acidemia (PA) and Methylmalonic Acidemia (MMA) are inborn errors of metabolism affecting the catabolism of valine, isoleucine, methionine, threonine and odd-chain fatty acids. These are multi-organ disorders caused by the enzymatic deficiency of propionyl-CoA carboxylase (PCC) or methylmalonyl-CoA mutase (MUT), resulting in the accumulation of propionyl-coenzyme A (P-CoA) and methylmalonyl-CoA (M-CoA in MMA only). Primary metabolites of these CoA esters include 2-methylcitric acid (MCA), propionyl-carnitine (C3), and 3-hydroxypropionic acid, which are detectable in both PA and MMA, and methylmalonic acid, which is detectable in MMA patients only (Chapman et al., 2012). We deployed liver cell-based models that utilized PA and MMA patient-derived primary hepatocytes to validate a small molecule therapy for PA and MMA patients. The small molecule, HST5040, resulted in a dose-dependent reduction in the levels of P-CoA, M-CoA (in MMA) and the disease-relevant biomarkers C3, MCA, and methylmalonic acid (in MMA). A putative working model of how HST5040 reduces the P-CoA and its derived metabolites involves the conversion of HST5040 to HST5040-CoA driving the redistribution of free and conjugated CoA pools, resulting in the differential reduction of the aberrantly high P-CoA and M-CoA. The reduction of P-CoA and M-CoA, either by slowing production (due to increased demands on the free CoA (CoASH) pool) or enhancing clearance (to replenish the CoASH pool), results in a net decrease in the CoA-derived metabolites (C3, MCA and MMA (MMA only)). A Phase 2 study in PA and MMA patients will be initiated in the United States.
Keywords: Propionic Acidemia, Methylmalonic Acidemia
Introduction
Propionic acidemia (PA) (Online Mendelian Inheritance in Man [OMIM] #606054) and methylmalonic acidemia (MMA) (OMIM #251000 for MMUT gene mutations; seen also in cobalamin complementation groups cblA, OMIM # 251100, and cblB, OMIM #251110) are rare, autosomal recessive intoxication-type disorders of propionic acid metabolism. PA and MMA are caused by enzymatic deficiency of propionyl-CoA carboxylase (PCC), methylmalonyl-CoA mutase (MUT) or in enzymes involved in the synthesis of its cofactor, 5’-deoxyadenosyl-cobalamin (vitamin B12). PCC converts propionyl-coenzyme A (P-CoA) to methylmalonyl-CoA (M-CoA) and MUT subsequently converts M-CoA to succinyl-CoA, which feeds into the TCA cycle for energy production (Figure 1). The catabolism of the branched-chain amino acids valine and isoleucine, as well as methionine, threonine, odd-chain fatty acids and the side chain of cholesterol (minor contributor) funnel into the tricarboxylic acid (TCA) cycle through PCC and MUT (1–3). Both diseases are characterized by the accumulation of toxic primary and secondary metabolites derived from unmetabolized precursors originating from the diet, endogenous catabolism or the intestinal microbiota (4, 5). Primary metabolites that accumulate include 2-methylcitric acid (MCA), propionyl-carnitine (C3), and 3-hydroxypropionic acid, which are detectable in both PA and MMA, and methylmalonic acid, which is detectable in MMA patients only (3). Secondary metabolites that accumulate, including ammonia, lactate, ketones, and some amino acids, are thought to be derived from inhibition of the urea cycle and mitochondrial enzymes by the primary metabolites (6). To date, most of these biomarkers have been utilized for diagnosis of PA and MMA, but evidence is building for the usefulness of biochemical parameters as surrogates for disease activity which may be likely to predict clinical benefit of treatment regimens that can normalize the levels of these metabolites (3, 4, 6–11). For example, in a recent study, plasma MCA levels were decreased by approximately 50% in patients with PA or MMA who underwent a liver and/or kidney transplant (11).
Figure 1.
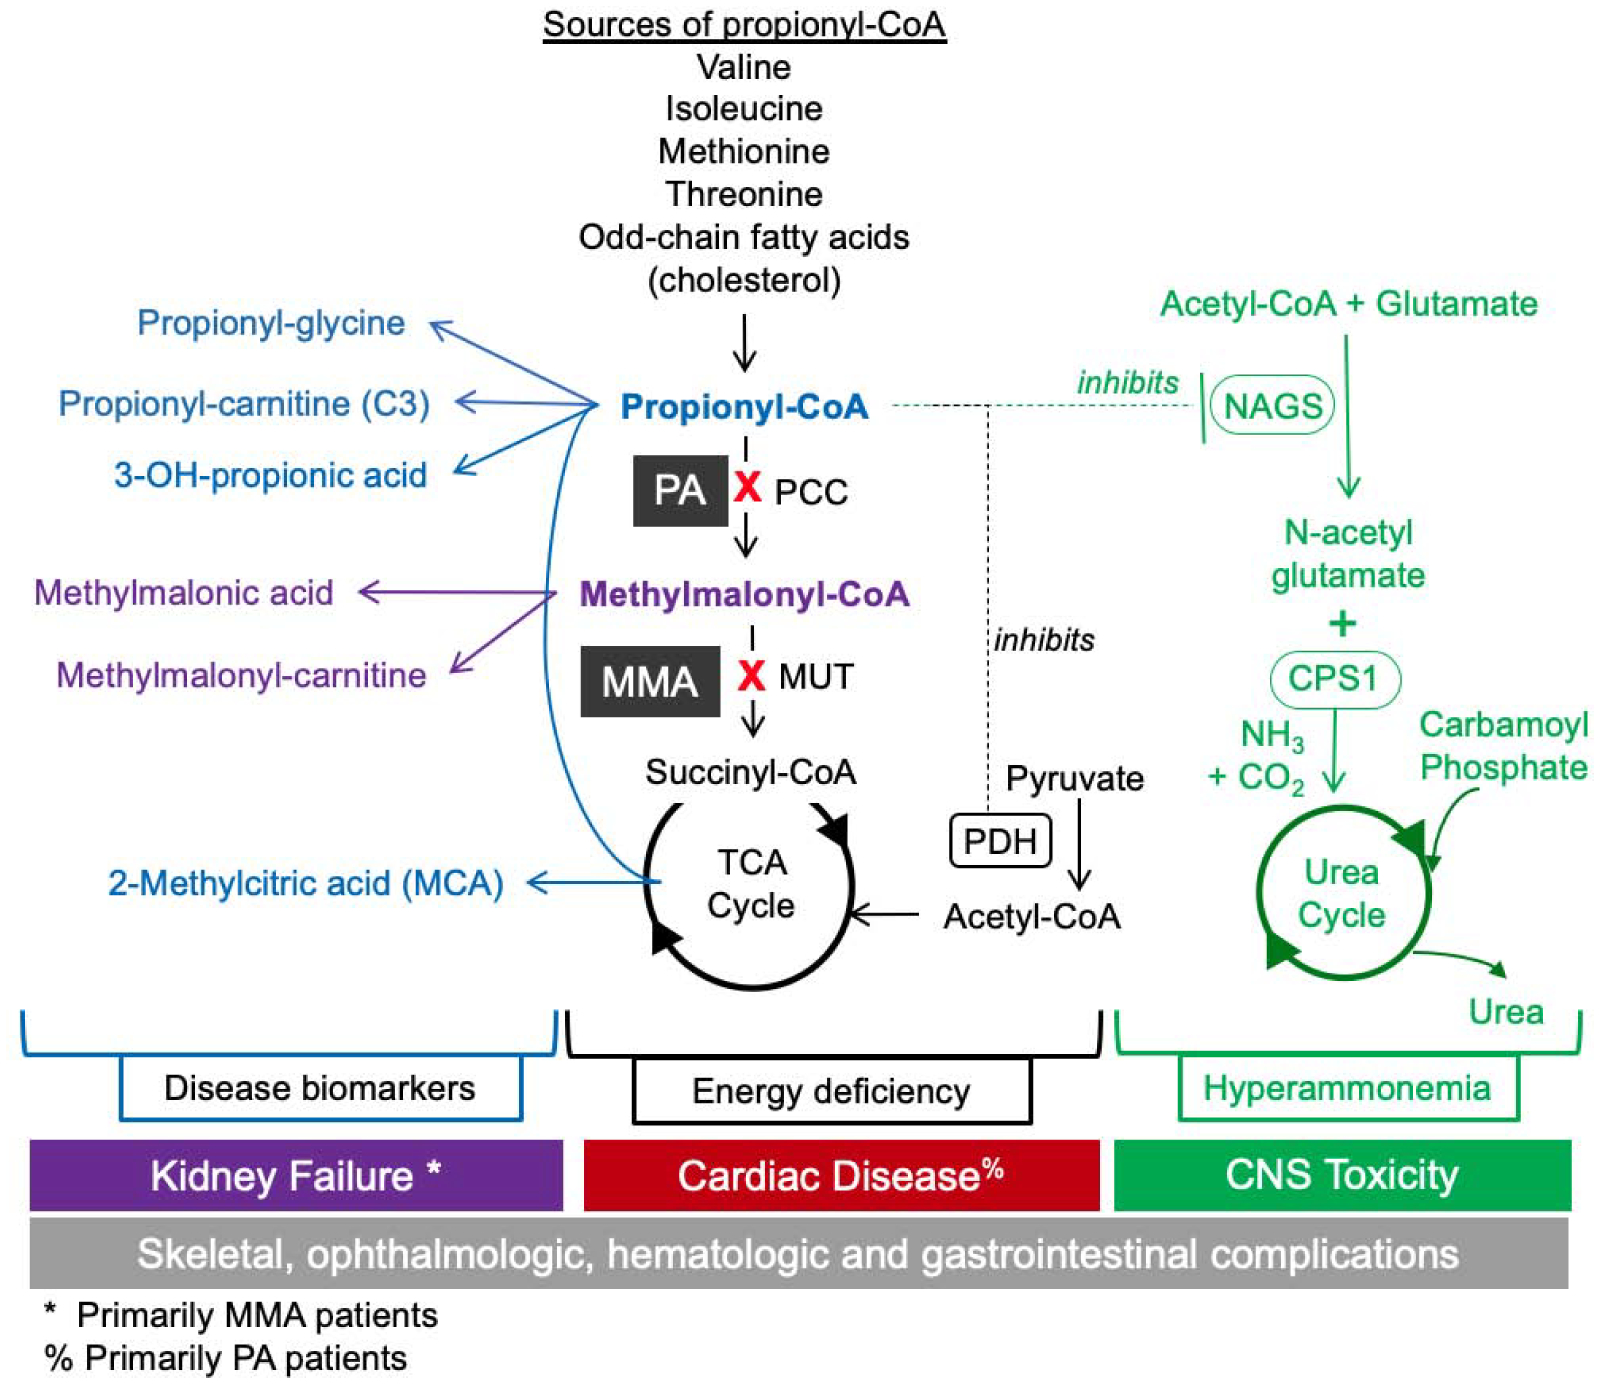
PA and MMA Biochemical Pathways and Biomarkers. PA and MMA are caused by enzymatic deficiency of propionyl-CoA carboxylase (PCC) and methylmalonyl-CoA mutase (MUT). PCC converts propionyl-CoA (P-CoA) to methylmalonyl-CoA (M-CoA) and MUT subsequently converts M-CoA to succinyl-CoA, which feeds into the TCA cycle for energy production. The catabolism of the branched-chain amino acids valine and isoleucine, as well as methionine, threonine, odd-chain fatty acids and the side chain of cholesterol funnel into the TCA cycle through PCC and MUT. Primary metabolites of P-CoA include 2-methylcitric acid (MCA), propionyl-carnitine (C3), 3-hydroxypropionic acid, and propionyl-glycine which are detectable in both PA and MMA, and methylmalonic acid and methylmalonyl-carnitine, which are detectable in MMA patients only. Elevated P-CoA has been shown to inhibit N-acetylglutamate synthase (NAGS), which reduces ureagenesis, thereby causing a secondary hyperammonemia and potential encephalopathy. High concentrations of P-CoA can inhibit PDH, which reduces acetyl-CoA levels and mitochondrial energy production. P-CoA acts as an alternative substrate for citrate synthase (CS), resulting in production of MCA. PA and MMA are multi-systemic diseases affecting renal, gastrointestinal, immune, CNS, hepatic, hematologic, and cardiovascular systems, and are associated with morbidity and mortality in infancy and childhood, and for survivors, debilitating end-organ damage and death. PA and MMA affect sequential steps in the same propionate catabolic pathway, leading to similar acute and chronic disease manifestations, although some later stage disease complications appear to be more specific to either PA or MMA.
PA and MMA are multi-systemic diseases affecting renal, gastrointestinal, immune, central nervous system, hepatic, hematologic, and cardiovascular systems, and are associated with morbidity and mortality in infancy and childhood, and for survivors, debilitating end-organ damage and death into adulthood (12) (Figure 1). PA and MMA affect sequential steps in the same propionate catabolic pathways, leading to similar acute and chronic disease manifestations, although some later stage disease complications appear to be more specific to either PA or MMA (4, 13–16). PA and MMA are classified as intoxication disorders because the intramitochondrial accumulation of P-CoA, M-CoA, and other downstream metabolites induce synergistic inhibition of mitochondrial energy metabolism and ammonia detoxification (Figure 1). P-CoA is one carbon longer than acetyl-CoA, and at elevated concentrations can inhibit enzymes that utilize acetyl-CoA as a substrate or act as an alternate substrate, replacing acetyl-CoA in enzymatic reactions. P-CoA has been shown to inhibit N-acetylglutamate synthase (NAGS), the rate-limiting enzyme of the urea cycle, thereby causing a secondary hyperammonemia and potential encephalopathy (17, 18). Furthermore, elevated P-CoA can inhibit pyruvate dehydrogenase (PDH), which reduces acetyl-CoA levels and mitochondrial energy production (19). In the TCA cycle, P-CoA acts as an alternative substrate for citrate synthase (CS), resulting in production of MCA, which acts as an endogenous inhibitor of energy metabolism through inhibition of the TCA cycle enzymes CS and isocitrate dehydrogenase (6). Finally, P-CoA has been demonstrated to inhibit β-oxidation, possibly through a direct interaction with acyl-CoA dehydrogenase (ACDH) (20). Overall, elevated P-CoA and its derived metabolites have an adverse impact on metabolic pathways involved in energy production and ammonia detoxification, which drive the clinical manifestations of both PA and MMA.
We hypothesized that a therapeutic which reduces P-CoA would relieve the toxicity associated with P-CoA, M-CoA and their downstream metabolites in PA and MMA patients. Using previously described in vitro disease models of PA and MMA (21), we performed a phenotypic screen focused on low molecular weight organic acids that reduced intracellular levels of P-CoA. Subsequent data analysis to identify compounds that (1) showed robust cellular potency for P-CoA lowering and (2) based on chemical structure would not undergo metabolism via the canonical β-oxidation pathway led to the selection of 2,2-dimethylbutanoic acid, referred to herein as HST5040, as the lead candidate (Figure 2., (22)).
Figure 2.
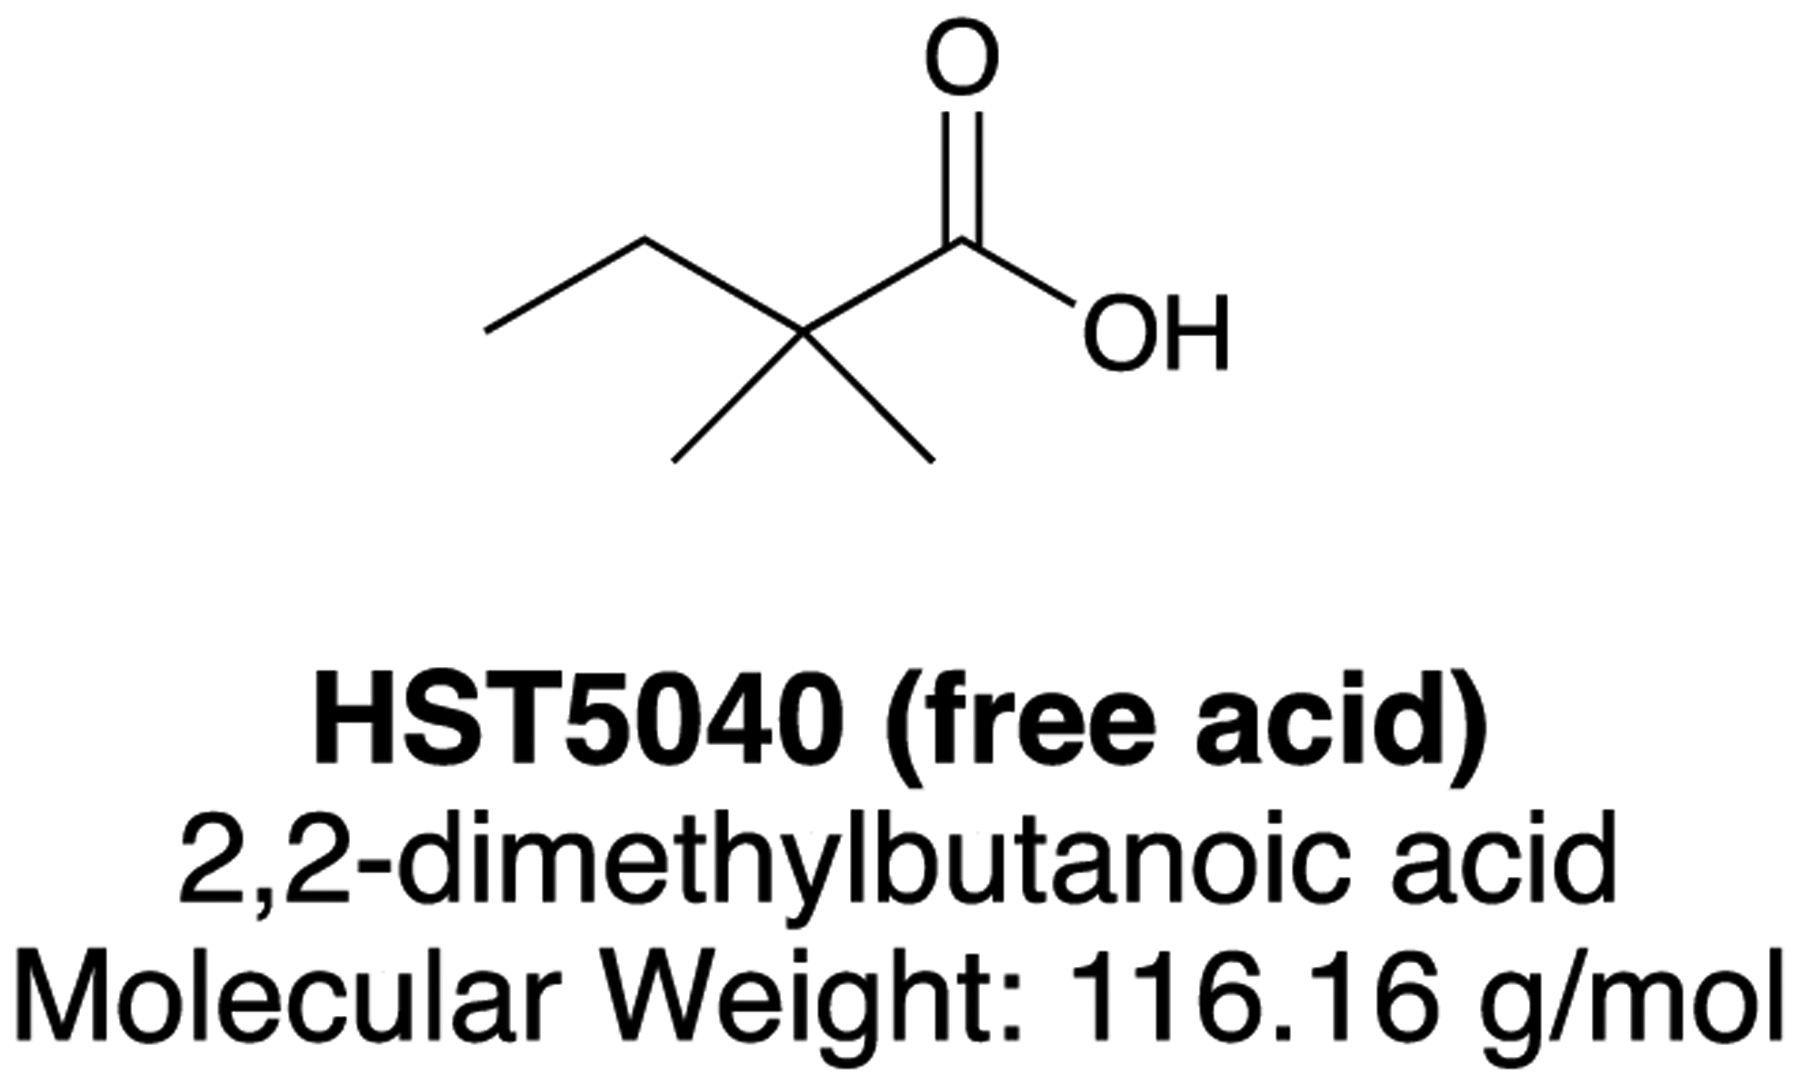
Structure of HST5040
The primary objective of this study was to characterize the pharmacology of HST5040 in PA and MMA primary hepatocyte (pHep) disease models. The secondary objective of this study was to determine the EC50 and EC90 values for HST5040 in order to inform a dose range for the clinical evaluation of efficacy in PA and MMA patients. We demonstrate that in PA and MMA pHep disease models, HST5040 reduces P-CoA, M-CoA and derived metabolites to near normal levels and provide key insights into the novel mechanism of action of HST5040.
Results
Pharmacological Activity of HST5040 in Primary Hepatocytes from PA and MMA Patients Cultured in a Hepatocyte Bioreactor
The pharmacodynamic activity of HST5040 was studied in vitro using pHeps derived from livers explanted from PA and MMA patients at the time of liver transplant (CNHS IRB Pro0004911). The pharmacologic activity of HST5040 was characterized in three PA and three MMA donors with N=2 experimental runs per donor. The PA and MMA donors have been extensively characterized, including genotyping, assessment of PCC and/or MUT protein expression, and the quantification of intracellular metabolite levels and other relevant disease biomarkers (21). PA and MMA pHeps were used to create disease models in a novel hepatocyte bioreactor (referred to as ‘bioreactor’ throughout) and static cell culture formats (23–25). The bioreactor recapitulates human disease biology by using tissue from patients and principles of blood flow, as shown in Supplemental Figure 1 (21). Briefly, PA, MMA and normal human pHeps were exposed to HST5040 (concentrations ranging from 0.1 μM to 100 μM) over the course of 6 days and P-CoA, M-CoA, MCA, acetyl-carnitine (C2) and C3 were measured at the completion of the experimental runs by HT-MS/MS or LC-MS/MS methods (previously described (21)). Representative activity data from PA donor 1 and MMA donor 1 in the bioreactor are shown in Figure 3 (see Supplemental Figure 2 for results from all donors). Biomarker levels are normalized to cell counts and cell volume to account for donor-to-donor variability in the plating density and attachment (26). In representative donor responses shown in Figures 3–6, the concentrations in the dose-response curve were spaced at half-logs, base 10. For the purpose of curve fitting, the 0 μM concentration was mapped to 0.01 μM, a full log below the lowest non-zero concentration. This was done to facilitate the inclusion of the zero doses on a log scale. As shown in Figure 3A, HST5040 dose-dependently reduced P-CoA in both PA and MMA pHeps with EC50 values of 1.84 μM and 3.90 μM, respectively. HST5040 reduced M-CoA in the MMA pHeps with an EC50 value of 3.25 μM (Figure 3B). Analysis of PA pHep cell lysates, which should not have any detectable M-CoA due to the lack of PCC activity, demonstrated an apparent background level of 12C-M-CoA of ~25–50 μM (Figure 3B). This is most likely due to the presence of 12C-succinyl-CoA in the sample, which has the same mass and was not separated from M-CoA in our detection methods. In experiments described below, 13C-M-CoA produced from 13C-labeled precursors was measured to determine a more accurate percent reduction. HST5040 reduced the C3 concentration and the C3/C2 ratio with an EC50 similar to that for the reduction in P-CoA (Figure 3C, D). MCA is reduced in both the PA and MMA donors, with EC50 values of 1.96 μM and 1.66 μM, respectively (Figure 3E).
Figure 3. HST5040 reduces disease-relevant biomarkers in PA and MMA pHep disease models.
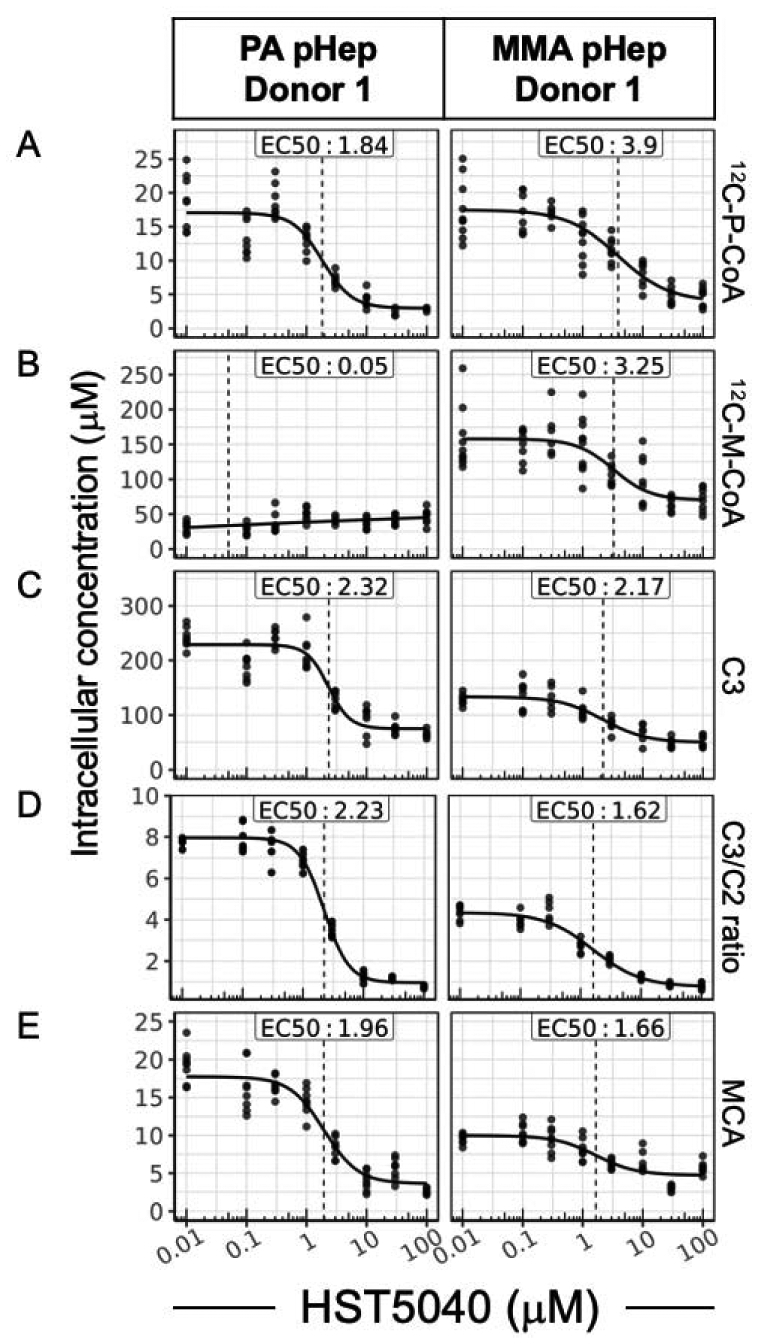
Representative data from a PA and MMA pHep donor exposed to HST5040 from 0 μM (represented as 0.01 μM in graphs) to 100 μM for 6 days in the bioreactor. Biomarker levels are normalized to pHep intracellular concentration. Each black dot is a sample with N=8 for each experiment. The calculated EC50 is shown for each biomarker. (A) 12C-P-CoA, (B) 12C-M-CoA, (C) and C3 and C2 were measured by HT-MS/MS. (D) The ratio of C3/C2 was a calculated from measured C3 and C2 levels in the pHeps. (E) MCA was measured by in cell lysates by LC-MS/MS.
Figure 6. The relationship between the HST5040 mechanism of action and CoA pools in static cell culture.
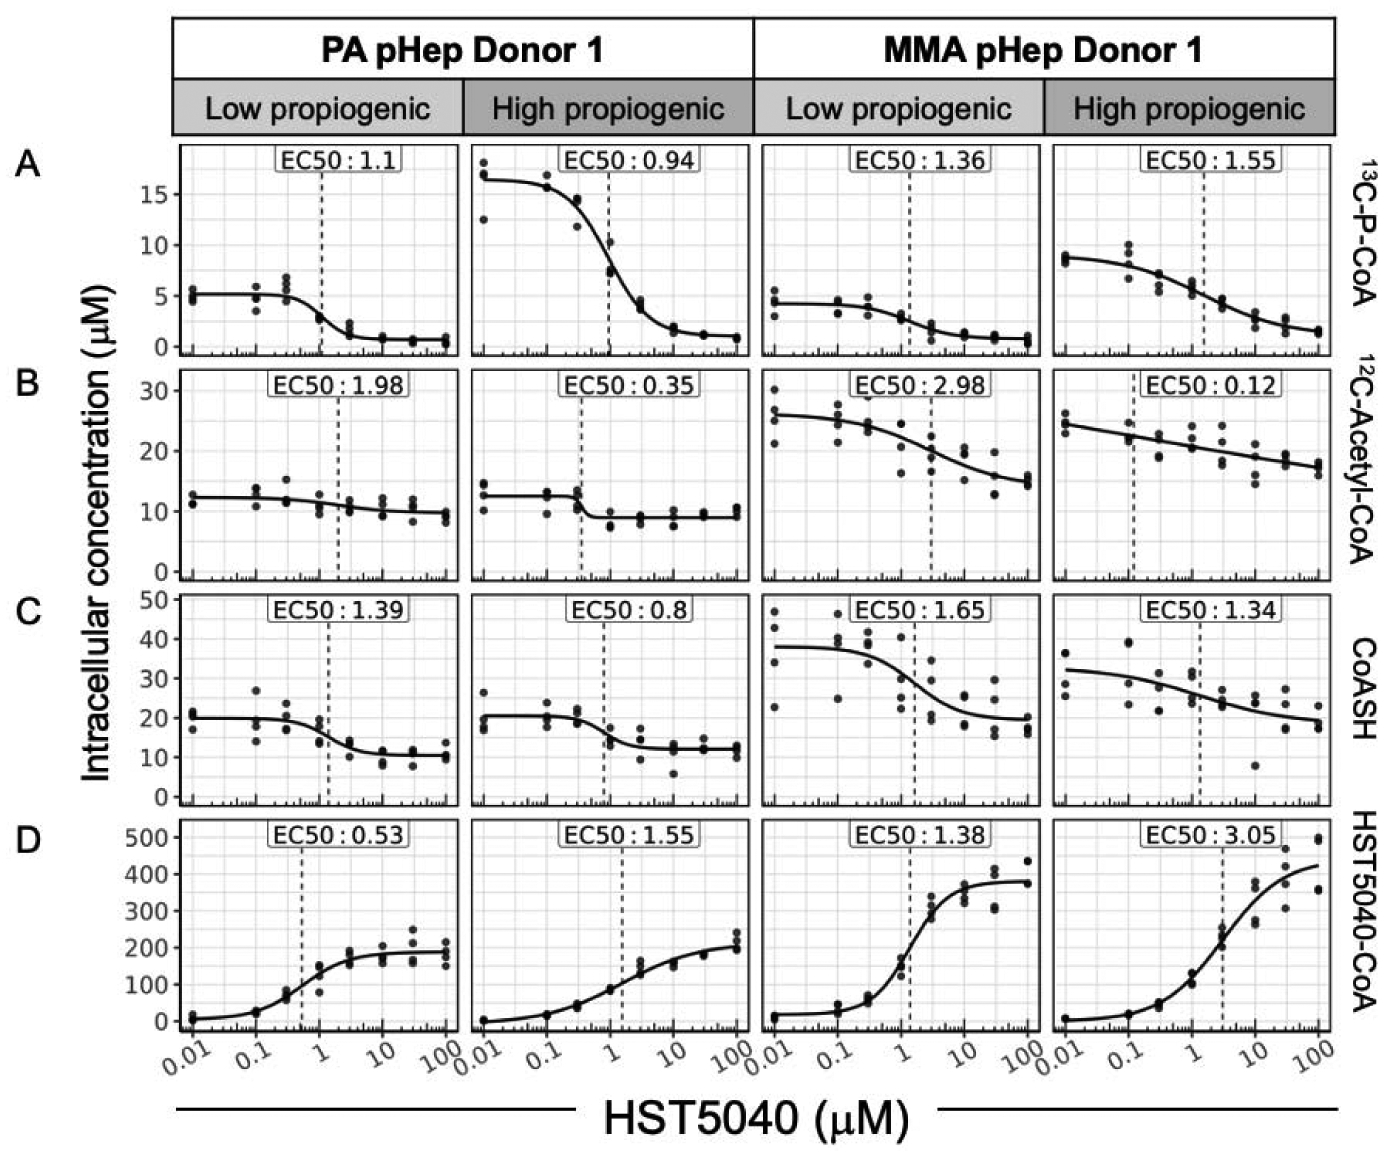
Representative data from a PA and MMA pHep donor exposed to HST5040 from 0 μM (represented as 0.01 μM in graphs) to 100 μM for 1.5 hours in static cell culture with low or high propiogenic media formulation to mimic a stable or catabolic metabolic disease state, respectively. Analyte levels are normalized to pHep intracellular concentration. Each black dot is a sample with N=8 for each experiment. The calculated EC50 is shown for each analyte. (A) 13C-P-CoA, (B) 12C-Acetyl-CoA, (C) CoASH, and (D) HST5040-CoA were measured by HT-MS/MS.
The summary data for all three PA and three MMA donors is presented in Table 1. The EC50 and EC90 values were calculated based on 4-parameter logistic regression models fit to dose-response data. To ensure reliable estimates of EC50 and EC90 values, dose response curves (DRC) that did not meet quality control criteria based on (1) signal-to-noise ratios, and (2) saturation of response effects, were discarded (see Data Analysis for additional details). The EC90 values for P-CoA reduction were 18.4 ± 11.3 μM and 36.1 ± 30.1 μM, in PA and MMA pHeps, respectively (Table 1). Similarly, HST5040 reduced the concentration of C3 in PA and MMA pHeps with EC90 values of 30.8 ± 26.4 μM and 18.1 ± 16.2 μM, respectively. The EC90 value for reduction in MCA in PA (7.9 ± 3.6 μM) and MMA (7.5 ± 6.4 μM) pHeps was lower than other biomarkers. The average EC90 value across all biomarkers was 17.1 ± 13.4 μM. To allow for a uniform comparison and inclusion of data from PA and MMA donors that had DRCs that did not meet the DRC-specific criteria, we selected a fixed concentration (30 μM) to determine the average reduction across each biomarker. The average reduction in P-CoA levels in PA and MMA pHeps at 30 μM was −78.8 ± 10.9% and −74.2 ± 11.6 % and for C3 levels was −68.9 ± 14.6% and −65.9 ± 10.7%, respectively. The average reduction (expressed as log2 fold change) in the C3/C2 ratio was −2.1 ± 1.2 in PA pHeps and −2.2 ± 0.2 in MMA pHeps. MCA was reduced by −78.6 ± 12.9% in PA pHeps and −66.7 ± 14.9% in MMA pHeps. Overall, the EC90 values and reduction in biomarker concentrations were consistent across all the biomarkers, suggesting that HST5040 has a “global” effect on correcting relevant metabolic abnormalities in PA and MMA consistent with the biochemical pathways driving these disease phenotypes.
Table 1.
Summary results of biomarker levels and HST5040 EC50/EC90 values in PA and MMA disease models in the bioreactor
| Biomarker | Disease pHeps | Number of DRCs in EC calculations* | Average EC50 μM | Average EC90 μM | % change @ 30μM |
|---|---|---|---|---|---|
| 12C-Propionyl-CoA (P-CoA) | PA | 6 | 1.9 ± 1 | 18.4 ± 11.3 | −78.8 ± 10.9 |
| MMA | 5 | 2.1 ± 1.5 | 36.1 ± 30.1 | −74.2 ± 11.6 | |
| 12C-Methylmalonyl-CoA (M-CoA) | PA | NA | NA | NA | NA |
| MMA | 3 | 2 ± 1.2 | 12.6 ± 12.9 | −55 ± 6.6 | |
| 12C-Propionyl-Carnitine (C3) | PA | 6 | 2.7 ± 1.8 | 30.8 ± 26.4 | −68.9 ± 14.6 |
| MMA | 4 | 1.4 ± 0.5 | 18.1 ± 16.2 | −65.9 ± 10.7 | |
| 12C-Acetyl-Carnitinc (C2) | PA | 4 | 6.1 + 2.6 | 18.5 ± 11.6 | 108.2 + 88.5 |
| MMA | 3 | 4.3 ± 2.2 | 31.3 ± 26.9 | 44.6 ± 26.8 | |
| 2-Methylcitric acid (MCA) | PA | 5 | 1.1 ± 0.5 | 7.9 ± 3.6 | −78.6 ± 12.9 |
| MMA | 5 | 0.8 ± 0.5 | 7.5 ± 6.4 | −66.7 ± 14.9 |
Values are average ± slandard deviation
NA - Not applicable
3 PA and 3 MMA donors with N=2 experiments per donor was performed. Dose-response curves (DRCs) that passed QC criteria were included in the EC50/EC90 average values. The % change at 30 μM includes data from all donors and experiments.
Pharmacological Activity of HST5040 in Primary Hepatocytes from PA and MMA Patients in Static Cell Culture
Static cell culture experiments were utilized to further characterize the impact of HST5040 on disease-relevant biomarkers. While the bioreactor is best to recapitulate the disease biology and study the effect of chronic exposure to HST5040, we have found that short, acute static cell culture experiments are also useful to study other aspects of HST5040 pharmacology. Furthermore, the static cell culture is a smaller format, which allows for a higher throughput testing of different experimental conditions, media customization, incorporation of stable-isotopically-labeled (SIL) precursors and the measurement of additional metabolites.
We wanted to further understand the biochemistry and biomarker response to HST5040 during a stable metabolic state vs. metabolic decompensation. To recreate a milieu representative of a stable metabolic state, we designed a media formulation based on amino acid levels measured in the plasma of PA and MMA patients during a routine clinical visit (13, 27). The formulation will be referred to as ‘low propiogenic’, as the propiogenic precursor levels are relatively low when patients are in a stable, well-state. During a metabolic decompensation, the body switches to a predominantly catabolic state, when glycogen, fat, and protein are mobilized as energy sources. The catabolic state demands a high flux of metabolites through the amino acid pathways converging on P-CoA. Propiogenic amino acid precursors are not elevated in plasma of PA and MMA patients, but are catabolized leading to the build-up of P-CoA and other toxic metabolites (28). In order to mimic the levels of propiogenic precursors that tissues in PA and MMA patients are exposed to, we looked to clinical data from Maple Syrup Urine Disease (MSUD) patients undergoing a metabolic decompensation (28). In MSUD, the valine and isoleucine catabolic pathways are blocked upstream at the level of the branched chain α-ketoacid dehydrogenase and therefore the inability to utilize amino acids and α-ketoacids leads to the buildup in the plasma of patients. Using this data, the propiogenic load experienced during a catabolic state was calculated to be approximately five-times greater than the load during a stable metabolic state. This formulation, which contains five-fold greater concentrations the levels of the amino acid levels measured in the plasma of PA and MMA patients, will be referred to as ‘high propiogenic’ and concentrations for each media formulation can be found in Collado et al. 2020 (21).
PA and MMA pHeps were treated with HST5040 (concentrations ranging from 0.1 μM to 100 μM) for 30 minutes in low propiogenic media, followed by either a continuation of low propiogenic media or switched to the high propiogenic media for 1 hour. The media used during the 1 hour incubation contained propiogenic SIL-amino acids and ketoacids which are metabolized into labeled P-CoA and M-CoA in the cells. The SIL amino acids and ketoacids were a mix of 13C and MeD8 labelling and their catabolism produced 13C3-P-CoA or 2H3-P-CoA (denoted as 13C-P-CoA for simplicity) with the same mass, independent of the type of SIL (also true for 13C-M-CoA and 13C-methylmalonic acid). Representative data shown in Figure 4 illustrate that 13C-P-CoA, 13C-M-CoA, and 13C-methylmalonic acid levels increased in PA and MMA pHeps when exposed to high propiogenic media due to the greater metabolite flux through the propiogenic pathways (Figure 4A, B, C).
Figure 4. HST5040 reduces disease-relevant biomarkers in low and high propiogenic conditions in PA and MMA disease models.
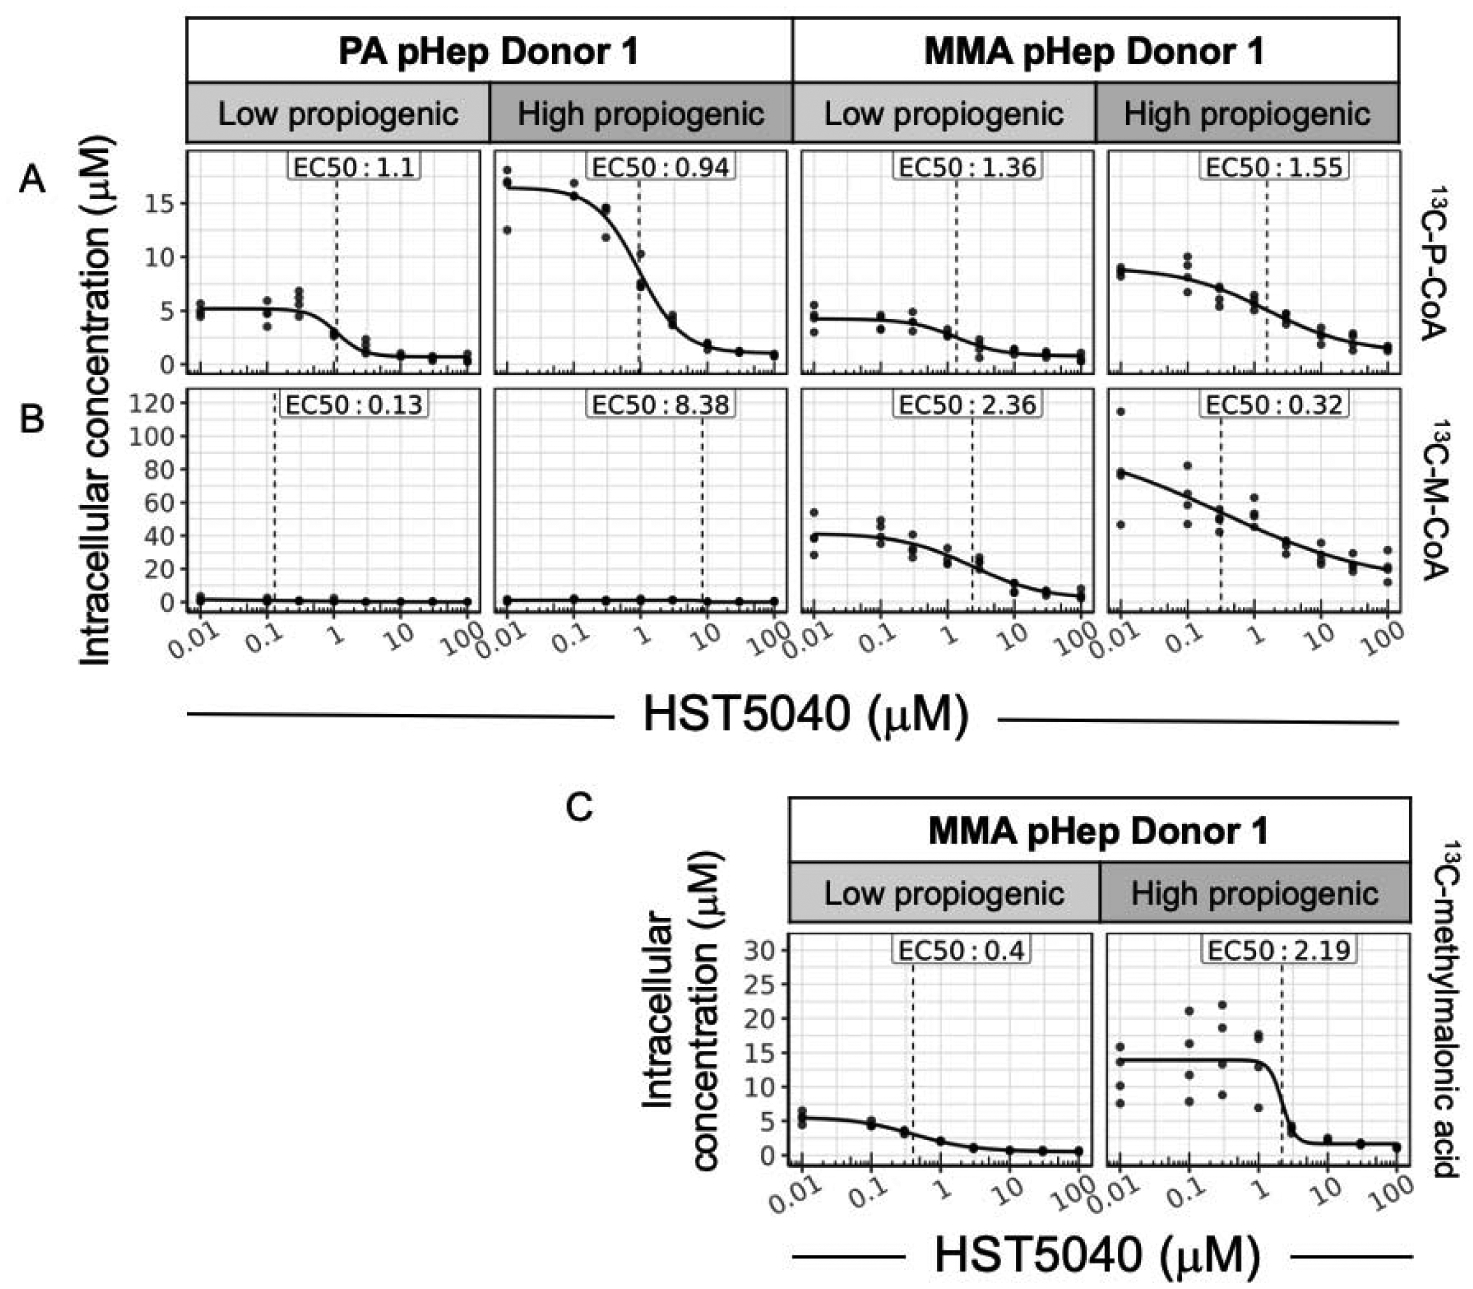
Representative data from a PA and MMA pHep donor exposed to HST5040 from 0 μM (represented as 0.01 μM in graphs) to 100 μM for 1.5 hours in static cell culture with low or high propiogenic media formulation to mimic a stable or catabolic metabolic disease state, respectively. Biomarker levels are normalized to pHeps intracellular concentration. Each black dot is a sample with N=4 for each experiment. The calculated EC50 is shown for each biomarker. (A) 13C-P-CoA and (B) 13C-M-CoA were measured by HT-MS/MS. C) Methylmalonic acid was measured by in MMA pHep lysates by LC-MS/MS.
The EC50 values for HST5040-dependent reduction in 13C-P-CoA and 13C-M-CoA were similar and independent of low vs. high propiogenic media conditions (Table 2). The average EC90 value across all biomarkers was 11 ± 9.6 μM. At the dose of 30 μM selected for this calculation (as described above), the percent reduction in 13C-P-CoA in PA and MMA pHeps exposed to low propiogenic media was −76.4 ± 12.6% and −77.6 ± 9.8%, respectively. When PA and MMA pHeps were exposed to high propiogenic sources to mimic a catabolic state during a metabolic decompensation, HST5040 reduced 13C-P-CoA by −5.3 ± 9.1% in PA pHeps and −75.9 ± 7.3% in MMA pHeps. The reduction in 13C-M-CoA in MMA pHeps appeared to be greater under these conditions (low propiogenic: −76.5 ± 13.2%; high propiogenic: −73 ± 5.8%) compared to the 12C-M-CoA values measured in the bioreactor (−55 ± 6.6% reduction) (Table 1; Table 2). It is hypothesized that this difference is due to the lower background detection level in 13C-M-CoA compared to 12C-M-CoA (Figure 3B vs. Figure 4B). The EC90 values for reduction of P-CoA and M-CoA are closely matched in the different experimental designs and media formulations. These results indicate that the integrity of the metabolic pathways is unaffected during the very short duration of the static culture experiments.
Table 2.
Summary results of biomarker levels and HST5040 EC50/EC90 values from PA and MMA pHeps exposed to low and high propiogenic conditions in static cell culture
| Media formulation | Biomarker | Disease pHeps | Number of DRCs in EC calculations* | Average EC50 μM | Average EC90 μM | % change @ 30μM |
|---|---|---|---|---|---|---|
| low propiogenic | 13C-Propionyl-CoA (13C-P-CoA) | PA | 5 | 2 ± 1.8 | 6.9 ± 5.4 | −76.4 ± 12.6 |
| MMA | 6 | 1.3 ± 0.6 | 15.7 ± 18 | −77.6 ± 9.8 | ||
| l2C-Methylmalonyl-CoA (13C-M-CoA) | PA | NA | NA | NA | NA | |
| MMA | 5 | 2.9 ± 1.6 | 30.9 ± 16.2 | −76.5 ± 13.2 | ||
| 13C-Methymalonic acid | PA | NA | NA | NA | NA | |
| MMA | 6 | 0.8 ± 0.9 | 4.5 ± 2.3 | −87 ± 5.4 | ||
| high propiogenic | 13C-Propionyl-CoA (13C-P-CoA) | PA | 6 | 1.7 ± 1 | 11.6 ± 7.4 | −85.3 ± 9.1 |
| MMA | 6 | 1.6 ± 0.8 | 48.2 ± 47.5 | −75.9 ± 7.3 | ||
| 12C-Methylmalonyl-CoA (13C-M-CoA) | PA | NA | NA | NA | NA | |
| MMA | 4 | 2.7 ± 1.6 | 21.2 ± 2 | −73 ± 5.8 | ||
| 13C-Methymalonic acid | PA | NA | NA | NA | NA | |
| MMA | 6 | 1.1 ± 0.9 | 4.6 ± 3 | −91 ± 4 |
Values are average ± standard deviation
NA - Not applicable
3 PA and 3 MMA donors with N=2 experiments per donor was performed. Dose-response curves (DRCs) that passed QC criteria were included in the EC50/EC90 average values. The % change at 30 includes dala from all donors and experiments.
As described earlier, 12C-methymalonic acid has a high detection background, therefore it cannot be accurately measured. Using SIL propiogenic sources allows for the precise measurement of 13C-methylmalonic acid. In pHeps from the three MMA patients treated with 30 μM HST5040, reductions in 13C-methylmalonic acid of −87 ± 5.4% and a −91 ± 4% were observed in low and high propiogenic media, respectively. EC90 values were 4.5 ± 2.3 μM and 4.6 ± 3 μM, respectively. Similar to the observation of a lower EC90 value for MCA in the bioreactor, the EC90 value for reduction in methylmalonic acid was lower than the acyl-CoA biomarkers.
Taken together, the data in both bioreactor and static cell culture pHeps demonstrate that HST5040 reduces the levels of P-CoA and M-CoA, the primary metabolites underlying disease pathogenesis. These reductions lead to a decrease in the levels of immediate downstream metabolites C3, MCA, and methylmalonic acid, which are linked to the pathophysiology of PA and MMA. Furthermore, HST5040 reduces disease-relevant biomarkers, independent of the elevated biomarker levels in PA and MMA pHeps exposed to low or high propiogenic loads. This data suggests that HST5040 treatment will provide benefit during both periods of metabolic stability and an acute metabolic decompensation when the propiogenic load may be much greater in PA and MMA patients.
HST5040 Mechanism of Action
Because carboxylic acids can be biotransformed to acyl-coenzyme A thioester derivatives, we investigated the formation of 2,2-dimethylbutyryl-CoA, also referred to as HST5040-CoA (29). In PA, MMA, and normal pHeps, formation of HST5040-CoA was dose-dependent and similar whether cells were exposed to HST5040 over 1.5 hours or 6 days (Figure 5D; Figure 6D). This data also demonstrates that the formation of HST5040-CoA is not unique to PA and MMA, as illustrated by the similar levels in normal pHeps. Importantly, the EC50 for HST5040-CoA formation is similar to the EC50 for the reduction of P-CoA (Table 1 vs. 3 and Table 2 vs. 4). In our initial screen to identify HST5040, some structural analogues did not form a corresponding CoA metabolite and did not reduce propionyl-CoA, which further supports the mechanistic link to HST5040-CoA (22). We postulate that the coincident production of HST5040-CoA and reduction of P-CoA are evidence supporting a mechanistic connection involving a redistribution of Coenzyme A through its free form (CoASH) favoring HST5040-CoA.
Figure 5. The relationship between the HST5040 mechanism of action and CoA pools in the bioreactor.
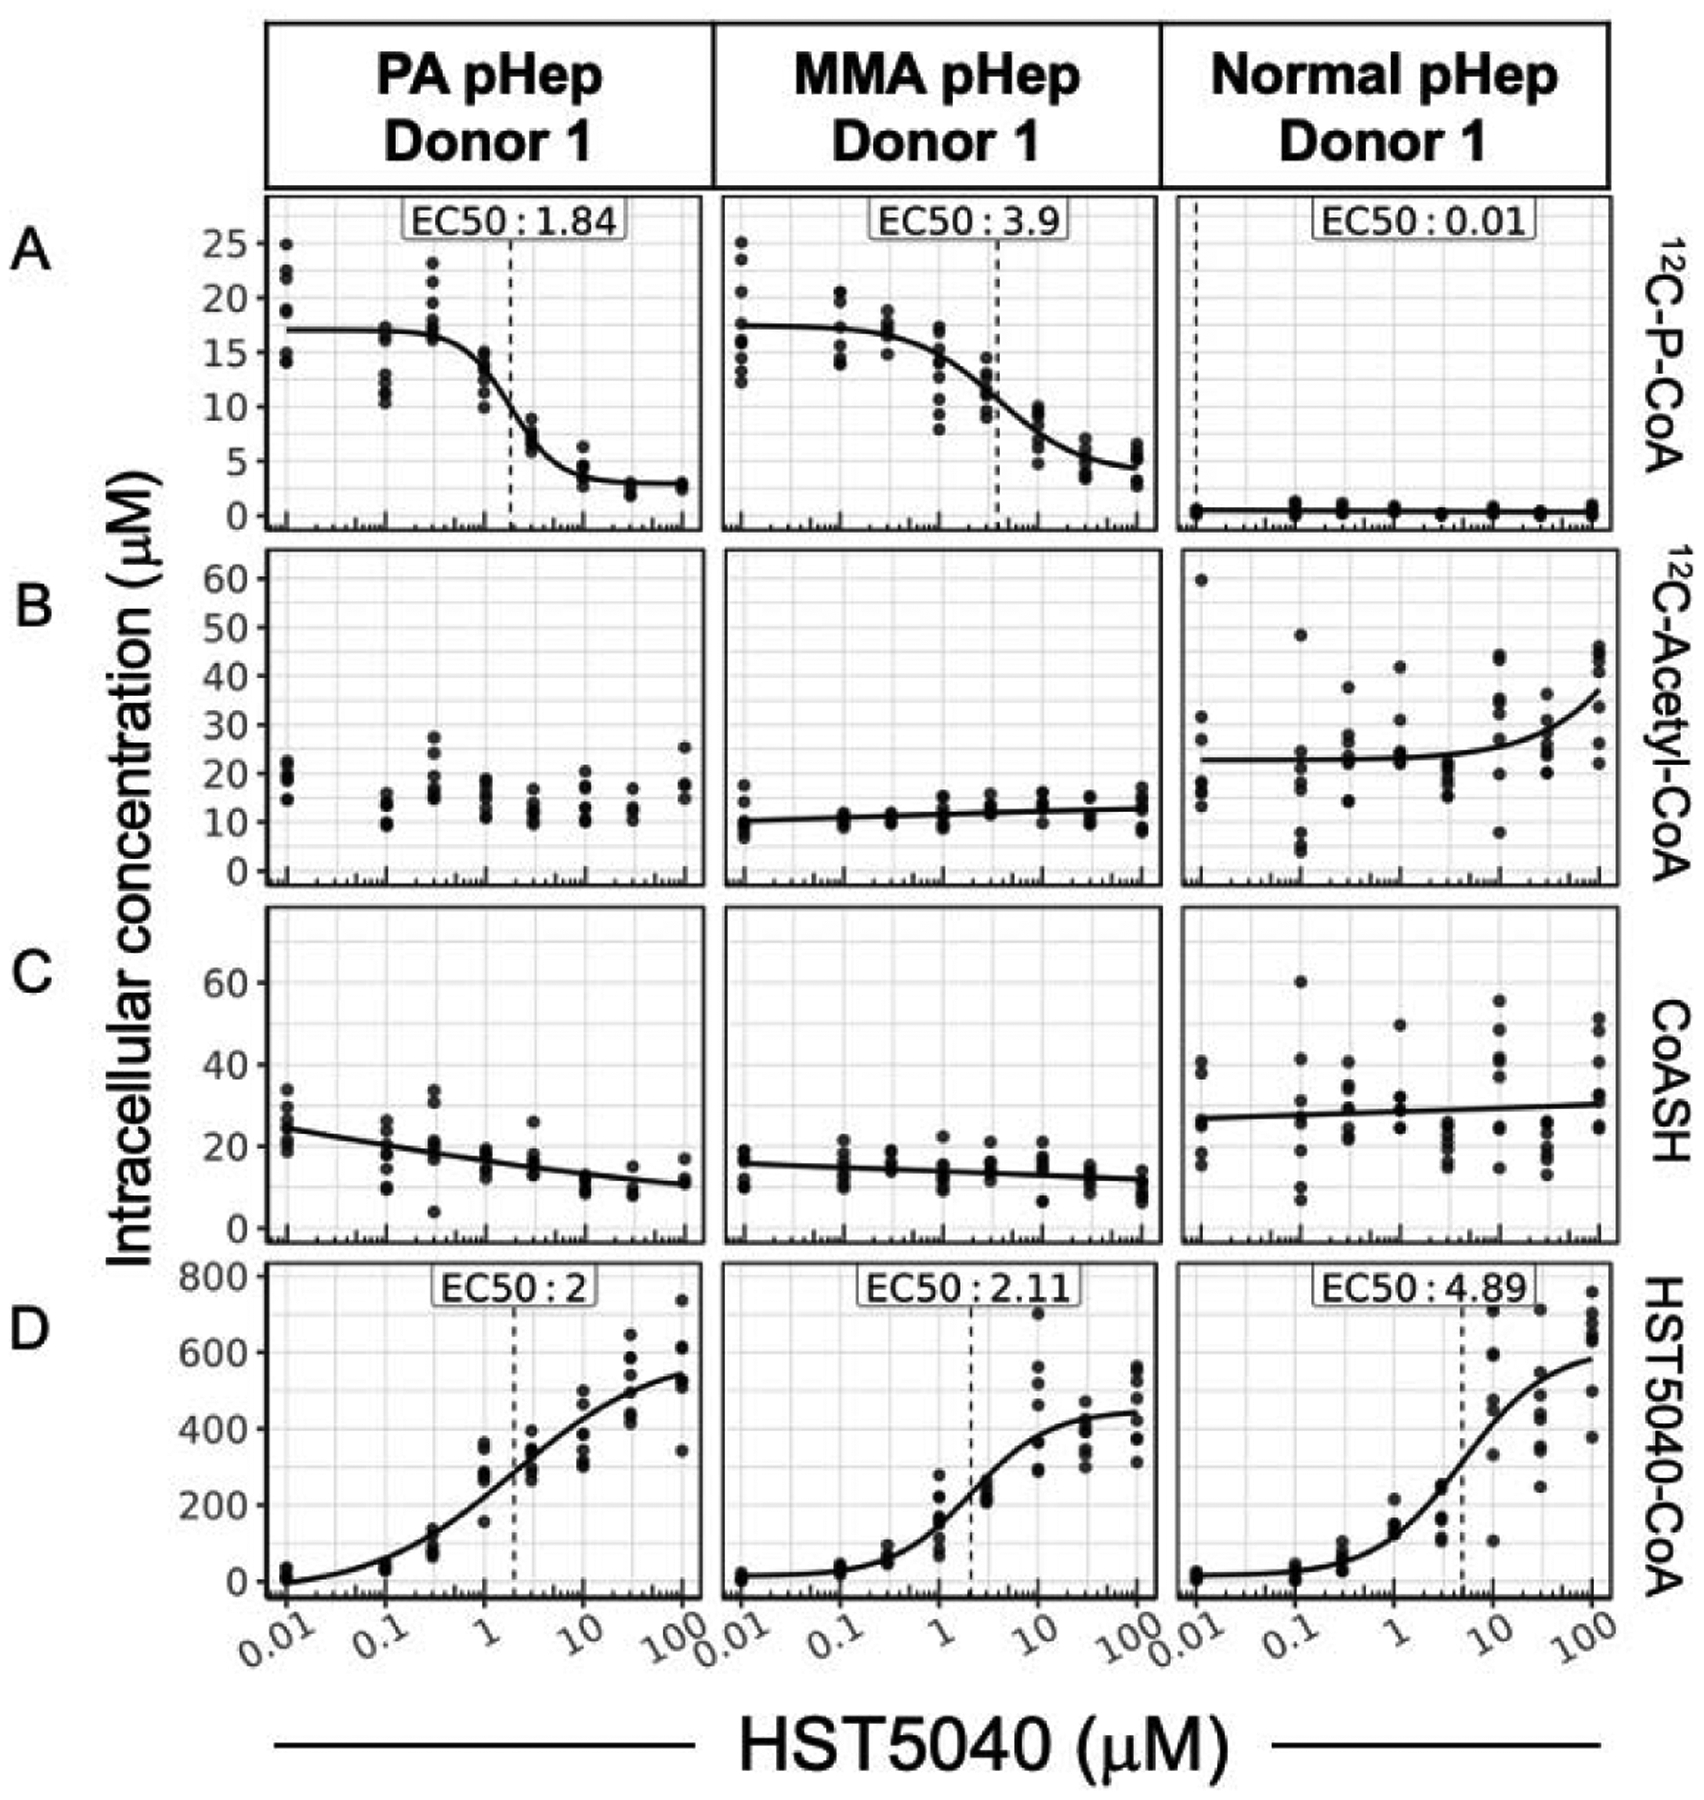
Representative data from a PA and MMA pHep donor exposed to HST5040 from 0 μM (represented as 0.01 μM in graphs) to 100 μM for 6 days in the bioreactor. Analyte levels are normalized to pHep intracellular concentration. Each black dot is a sample with N=8 for each experiment. The calculated EC50 is shown for each biomarker. (A) 12C-P-CoA, (B) 12C-Acetyl-CoA, (C) CoASH, and (D) HST5040-CoA were measured by HT-MS/MS.
An overall significant reduction in CoASH would be undesirable in these patient populations, therefore we measured levels of CoASH in the PA and MMA disease models to determine if the formation of HST5040-CoA impacts cellular levels of CoASH. In relatively short duration static experiments (1.5 hours) with low propiogenic media conditions, HST5040 reduced CoASH levels by −55.2 ± 7.1% and −47.7 ± 13.4% in PA and MMA pHeps, respectively (Table 4 and Figure 6C for representative graphs). In static experiments with high propiogenic media conditions, HST5040 reduced CoASH levels by −48 ± 14.3% and −28.7 ± 7.3% in PA and MMA pHeps, respectively (Table 4 and Figure 6C for representative graphs). The effect of HST5040 on CoASH is less pronounced in PA and MMA pHeps exposed to HST5040 for 6 days in the bioreactor (Figure 5C, Table 3). HST5040 reduced CoASH levels by −31.3 ± 24.2% and −22.3 ± 22.3% in PA and MMA pHeps, respectively (Table 3). Normal pHeps showed a similar trend in reduction of CoASH (−35.2 ± 3%, Table 3). Overall, there was a high degree of donor-to-donor variability in CoASH levels, as illustrated in Figure 5C and the standard deviation in the percent reduction (Table 3). Because many of the curves did not pass quality control (see Data Analysis section), the EC50 /EC90 values could be calculated for only 1 PA and 1 MMA donor (Table 3). Of note, the calculated EC50 value for the observed decrease in free CoASH is 10-fold less potent than the EC50 value for the reduction in disease biomarkers (Table 1; Table 3). While there is a trend towards a decrease in CoASH with increasing dose of HST5040, the change is statistically significant in less than half of the individual PA and MMA donors. To this end, in vitro data has shown that free CoASH levels have moderate acute perturbations but appear to recover and are not substantially altered during chronic HST5040 exposure (up to 6 days in the bioreactor).
Table 4.
Summary results of HST5040 pharmacology and CoA pools from PA and MMA pHeps exposed to low and high propiogenic conditions in static cell culture
| Media formulation | Analyte | Disease pHeps | Number of DRCs in EC calculations* | Average EC50 μM | Average EC90 μM | % change @ 30μM |
|---|---|---|---|---|---|---|
| low propiogenic | 12C-Acetyl-CoA | PA | 4 | 0.4 + 0.2 | 1.6 ± 1.3 | −36.6 ± 13.5 |
| MMA | 6 | 2.5 ± 2.6 | 28.4 ± 52 | −35.5 ± 18.1 | ||
| CoASH | PA | 5 | 0.9 ± 0.3 | 9.1 ± 5.8 | −55.2 ± 7.1 | |
| MMA | 5 | 2.3 ± 1.6 | 14.2 ± 13.5 | −47.7 ± 13.4 | ||
| HST5040-CoA | PA | 5 | 1.4 ± 0.6 | 15.3 ± 11.3 | NC | |
| MMA | 6 | 2 ± 0.7 | 18 ± 15.7 | NC | ||
| high propiogenic | 12C-Acetyl-CoA | PA | 3 | 0.7 ± 0.5 | 1.9 ± 1.3 | −27 ± 3.4 |
| MMA | 2 | 1.4 ± 1.4 | 6.4 ± 7.1 | −14.6 ± 12.6 | ||
| CoASH | PA | 4 | 2.1 ± 1.6 | 11.1 ± 13 | −48 ± 14.3 | |
| MMA | 2 | 13.1 ± 14.8 | 65.6 ± 81.2 | −28.7 ± 7.3 | ||
| HST5040-CoA | PA | 6 | 2.6 ± 1.6 | 42 ± 45.8 | NC | |
| MMA | 6 | 5.4 ± 2.8 | 80.1 ± 57 | NC |
Values are average ± standard deviation
NC - Value could not be calculated
3 PA and 3 MMA donors wilh N=2 experiments per donor was performed. Dose-response curves (DRCs) that passed QC criteria were included in the EC50/EC90 average values. The % change at 30 μM includes dala from all donors and experiments.
Table 3.
Summary results of HST5040 pharmacology and CoA pools in PA and MMA disease models in the bioreactor
| Analyte | Disease pHeps | Number of DRCs in EC calculations* | Average EC50 μM | Average EC90 μM | % change @ 30μM |
|---|---|---|---|---|---|
| 12C-Acetyl-CoA | PA | 3 | 2.3 ± 1.9 | 14.4 ± 13.6 | 54 ± 80.6 |
| MMA | 0 | NA | NA | 13.5 ± 24.9 | |
| normal | 0 | NA | NA | 20 ± 2.9 | |
| CoASH | PA | 2 | 11.6 ± 1.2 | 29.8 ± 24.3 | −31.3 ± 24.2 |
| MMA | 2 | 14.1 ± 8.4 | 23.8 ± 20.2 | −22.3 ± 22.3 | |
| normal | 0 | NA | NA | −35.2 ± 3 | |
| HST5040-CoA | PA | 6 | 3 ± 1.5 | 47.1 ± 39.7 | NA |
| MMA | 6 | 3.5 ± 1.7 | 52.4 ± 45.6 | NA | |
| normal | 2 | 8.3 ± 8 | 26.1 ± 3.1 | NA |
Values are average ± standard deviation
NA - Not applicable
3 PA and 3 MMA donors with N=2 experiments per donor was performed. Dose-response curves (DRCs) thaï passed QC criteria were included in Ihe EC50/EC90 average values. The % change at 30 μM includes data from all donors and experiments.
In PA and MMA pHeps, where P-CoA and M-CoA levels are elevated, there is a significant reduction in P-CoA and M-CoA pools with HST5040 treatment (Table 1; Table 2). To test whether there are changes in other relevant CoA esters or whether there is a preferential reduction in the metabolites that accumulate in PA and MMA, the effect of HST5040 on levels of acetyl-CoA were measured in PA, MMA, and normal pHeps. In static culture pHeps, there is a partial dose-dependent reduction in acetyl-CoA with acute exposure to HST5040 (Figure 6B). In static experiments with low or high propiogenic media conditions, HST5040 reduced acetyl-CoA levels by approximately 30% in PA and MMA pHeps (Table 4). Overall, EC50/EC90 values for acetyl-CoA are consistent with the reduction in other biomarkers (Table 2; Table 4). There was significant variability in acetyl-CoA levels following HST5040 treatment in the bioreactor, with PA, MMA, and normal pHep showing a trend towards increased acetyl-CoA (54 ± 80.6%, 13.5 ± 24.9%, 20 ± 2.9%, respectively, Table 3). The differences in the impact of HST5040 on acetyl-CoA suggest that with HST5040 treatment over time, acetyl-CoA may equilibrate and remain relatively stable and within the normal range observed across different pHep donors.
Since P-CoA is produced by many catabolic pathways, it is important to understand if HST5040 will impact the P-CoA derived from every source. Experiments to isolate individual propiogenic pathways demonstrated that HST5040 reduced P-CoA from every source (Supplemental Figure 3). In the experiments shown here, pHeps were exposed to a combination of all major sources of P-CoA, including isoleucine, valine, threonine, methionine, and odd-chain fatty acids, and HST5040 reduces P-CoA and derived metabolites to near normal levels. These data suggest that HST5040 can reduce P-CoA derived from all sources, potentially impacting all P-CoA production and clearance pathways. The proposed mechanism of action of HST5040 is consistent with this observation that the cell-based pharmacology is independent of P-CoA source and synthesis pathway.
Activity of HST5040 in mouse hepatocytes
The reduction of P-CoA and subsequent markers requires the biotransformation of HST5040 to HST5040-CoA in the mechanistic model outlined above. In order to determine experimental conditions for evaluation of HST5040 in a murine disease model, we determined the EC50 for formation of HST5040-CoA in normal mouse pHeps. Plated pHeps from mice were exposed to HST5040 (1 μM – 1 mM) for 1 hour and the formation of HST5040-CoA was measured in cell lysates by HT-MS/MS. The EC50 value for the formation of HST5040-CoA in mouse hepatocytes was 130 ± 31.5 μM, with an EC90 value > 1000 μM. Mouse hepatocytes have an EC50 value for the formation of HST5040-CoA nearly 20-fold higher than human (5.9 ± 1.0 μM). These data imposed significant limitations on the utility of murine disease models of PA/MMA for assessing the activity and efficacy of HST5040.
HST5040 PK Profiling
A pharmacokinetic study was conducted in CD-1 mice to assess the exposure to HST5040 following oral administration. HST5040 has a half-life following oral dosing of 1.9 ± 0.5 hours (Supplemental Figure 4) suggesting once daily dosing by oral gavage would be challenging to sustain therapeutically relevant drug exposures. Since gavage is stressful, BID or more frequent dosing is not recommended, especially in metabolically compromised mice (30). Osmotic mini-pumps offer the ability to dose continuously by subcutaneous infusion. Alzet® mini-pumps (releasing 1 μL/hour for 7 days) were filled with an aqueous solution of HST5040 (500 mg/mL) and surgically implanted in a subdermal pocket between the scapula. Following subcutaneous infusion, the plasma concentration of HST5040 reached steady-state by the 8 hour time point and remained relatively consistent thereafter. However, despite stock concentrations near the limit of solubility, the mean steady-state plasma levels only approached 90 μM and fell well short of the EC50 for the formation of HST5040-CoA in mouse hepatocytes (130 ± 31.5 μM), and more than 10-fold short of the EC90. Based on the EC50 for the formation of HST5040-CoA in mouse hepatocytes and these pharmacokinetic experiments, we have concluded that it will not be possible to achieve and sustain a therapeutically relevant plasma concentration of HST5040 in mice.
Discussion
The primary objectives of this study were to characterize the pharmacodynamic activity of HST5040 in human primary PA and MMA pHep disease models and to establish a basis for subsequent dose range predictions for the evaluation of HST5040 in human clinical trials. Our studies show that HST5040 reduces toxic metabolites P-CoA, M-CoA (MMA only), MCA, and methylmalonic acid (MMA only) and the related disease biomarker, C3, in pHeps from PA and MMA patients in a dose dependent manner. The finding that the EC50 values and reduction of disease-relevant biomarkers were similar in PA and MMA pHeps exposed to low-propiogenic and high-propiogenic conditions indicated that HST5040 is efficacious in reducing P-CoA (and other metabolites) regardless of the biomarker level. This suggests that HST5040 has the potential to be effective during metabolic stability and during a catabolic state induced by a metabolic decompensation when a patient may be exposed to higher loads of propiogenic sources due to endogenous catabolism of muscle and fat. We hypothesize that HST5040 will lead to a sustained reduction in the levels of the toxic metabolites in PA and MMA patients. For the purpose of projecting a dose range for the clinical evaluation of efficacy in PA and MMA patients, the EC90 exposure concentration was selected as the target Cmin plasma concentration. To obtain a robust estimate of the EC90, the 10% trimmed mean of the EC90 estimates across all analytes were calculated. This analysis yielded EC90 estimates of 17.1 ± 13.4 μM and 10.3 ± 9.3 μM in the bioreactor and static cell culture, respectively, across all PA and MMA donors and biomarkers measured. Given this data, a concentration of 20 μM (2.32 μg/mL) was selected as the target Cmin plasma concentration to inform dose level simulations for a Phase 2 trial of HST5040 in patients with PA and MMA. At this concentration and above, the accumulation of toxic propionyl and methylmalonyl metabolites is expected to be minimal.
We have proposed a working model for a mechanism of action of HST5040 that consistently explains the experimental observations. First, HST5040 reduces P-CoA derived from all sources, including catabolism of isoleucine, valine, threonine, methionine, odd-chain fatty acids (Supplemental Figure 3). PA and MMA pHeps were exposed to media containing high concentrations of individual 13C-labeled amino acids and odd-chain fatty acids, and HST5040 reduces P-CoA to near normal levels. In high and low propiogenic media, which are made up of disease-relevant levels of the amino acid sources of P-CoA, HST5040 reduces P-CoA independent of the source levels. Because there is no single common enzyme across all P-CoA precursor catabolism pathways, it is likely that the mechanism of action is independent of P-CoA source and synthesis pathway. Thus, HST5040 activity is not likely due directly to its effect on a particular enzyme. Second, HST5040 is biotransformed into HST5040-CoA at a similar EC50 to the reduction in P-CoA, which supports a mechanistic connection between HST5040-CoA production and the reduction in P-CoA. Studies are underway to confirm which acyl-CoA synthetases are involved in formation of HST5040-CoA. A putative working model of how HST5040 is reducing the toxic P-CoA metabolites involves the HST5040 conversion to HST5040-CoA that drives a redistribution of free and conjugated CoA pools, resulting in the differential reduction of P-CoA and M-CoA in PA and MMA disease models. The reduction of P-CoA and M-CoA, either by slowing production (due to high demands on the CoASH pool) or enhancing clearance (to replenish the CoASH pool), results in a net decrease in metabolites C3, MCA and MMA (MMA only) to near normal levels while having limited impact on the total free CoASH pool (as discussed later).
It is hypothesized that reduction of elevated P-CoA will relieve the toxicity caused by P-CoA, M-CoA, and their downstream metabolites in PA and MMA patients and reset the cellular pathophysiology. Current hypotheses in the literature suggest that P-CoA and other metabolites inhibit key enzymes involved in energy production and urea cycle pathways (6). The geminal dimethyl groups at the α-carbon of HST5040 provide a significant increase in steric bulk relative to both acetic and propionic acid. We hypothesize that this increase in steric bulk shifts the subsequent biological reactivity profile of HST5040-CoA relative to both P-CoA and acetyl-CoA such that it cannot engage in the same secondary processes that these sterically smaller CoA esters do (Supplemental Figure 5). For example, HST5040-CoA may not inhibit secondary processes (e.g., NAGS) whereas P-CoA has been shown to do so (18). Additionally, without an acidic hydrogen in the alpha position, HST5040-CoA is unable to undergo enolization which prohibits it from participating in certain biochemical transformations such as reaction with oxaloacetate (such as happens with P-CoA to form MCA). Therefore, an HST5040-induced reduction in P-CoA should relieve inhibition on NAGS, boost urea cycle function, and lower blood ammonia levels. A reduction in P-CoA is expected to have a beneficial impact on energy production by relieving the inhibition of multiple enzymes in the mitochondrial energy metabolism pathways.
We expect the redistribution toward HST5040-CoA to prevent/reverse the metabolic disruptions caused by P-CoA and M-CoA and have a positive pleiotropic effect on metabolism in PA and MMA patients. Additional evidence supporting this hypothesis can be extrapolated from the literature by analogy with carboxylic acids structurally related to HST5040. Pivalic acid (2,2-dimethylpropanoic acid) is similar in structure to HST5040 (2,2-dimethylbutanoic acid), differing by only one carbon (Supplemental Figure 5). Both are similar in that subsequent metabolism by the canonical β-oxidation metabolic pathway is blocked as neither molecule possesses a proton on the alpha carbon. As a result, their corresponding CoA ester is not further metabolized. Pivalate has been used to generate prodrugs to increase oral bioavailability (e.g. pivampicillin). After hydrolysis of the prodrug, pivalate can be further biotransformed by acyl-CoA synthases to form pivaloyl-CoA (31).The production of pivaloyl-CoA in isolated hepatocytes induced only minimal inhibition of pyruvate dehydrogenase and had no effect on β-oxidation (32, 33). This is in stark contrast to the profound inhibition of both pyruvate dehydrogenase and β-oxidation induced by propionyl-CoA (17, 20, 34). This suggests that the major contributor to the disruption in these pathways is the preferential accumulation of the CoA metabolite and that HST5040-CoA (by analogy to pivaloyl-CoA) will induce significantly less enzyme inhibition than P-CoA and have a positive impact on metabolic pathways involved in energy production and ammonia clearance.
CoA sequestration, toxicity and redistribution, a phenomenon known as “CASTOR”, has been used to describe what occurs when one or more acyl-CoA species accumulates to high levels, potentially causing a reciprocal decrease of acetyl-CoA and CoASH. The CASTOR phenomenon has been proposed to be associated with toxicity in many disorders of intermediary metabolism, including PA and MMA (35). However, there is little to no supporting evidence of this phenomenon due to lack of reliable noninvasive methods to accurately study tissue CoA levels in humans. Evidence from in vitro models demonstrate that high concentrations of P-CoA and M-CoA lead to an overall increase in the size of the total acyl-CoA pool while preserving the size of the CoASH and acetyl-CoA pools (33, 36). In our disease model studies, we observed some reductions in acetyl-CoA and CoASH with HST5040 treatment, particularly in static culture conditions with 1 hour exposure. Importantly, following chronic (6 day) exposures to HST5040 in the bioreactor, there were only minor changes in cellular concentrations of CoASH and no significant change in acetyl-CoA levels. This may reflect not only the modest impact on CoASH and acetyl-CoA but also the propensity of the system to equilibrate during chronic periods alleviating the decreases observed in the shorter static experiments. In fact, pantothenate kinase, the rate-limiting enzyme in the biosynthesis of CoASH, is negatively regulated by acyl-CoAs and CoASH and may sense the levels of acetyl-CoA and CoASH and up-regulate CoA biosynthesis in response to increased mitochondrial demand to support energy pathways (37–39). Phenotypically, our mechanism of action studies show that the formation of HST5040-CoA and a marked reduction of P-CoA levels occurs while other acyl-CoA pools are either unaffected or subject to small, transient alterations. Based on our own experiments and evidence from the literature, it is expected that CoASH levels and overall CoA adduct pools will not be substantially altered during chronic HST5040 therapy and that these important CoA pools will be maintained to support physiological homeostasis but this needs to be proven in clinical studies in PA and MMA patients. Finally, we believe that the potential risk of carnitine depletion is minimal since PA and MMA patients are routinely given carnitine supplementation as standard of care, which will be maintained during clinical trials (13).
During the course of our studies, it was realized that extensive human safety information from published Phase 1 and Phase 2 clinical trials was available from prior studies of 2,2-dimethylbutanoic acid as a potential treatment of sickle cell disease and β-thalassemia (40–44). The previous work was based on a hypothesized mechanism of action that is unrelated to our current pharmacology studies and disease indications. In multiple Phase 2 clinical trials in >185 patients, 2,2-dimethylbutanoic acid had acceptable safety and tolerability at doses higher than those that may be required for activity in PA/MMA. While it must be confirmed in clinical studies in PA and MMA patients, the prior collection of clinical and non-clinical literature suggests that 2,2-dimethylbutanoic acid will have potential to be safe and well tolerated at the anticipated doses to treat PA and MMA patients.
While PA and MMA are separate genetic disorders, the novel pharmacology demonstrated with HST5040 suggests it may have a similar therapeutic effect in both diseases. As a small molecule, HST5040 has the potential for broad tissue distribution and thus activity in multiple organ systems. While the studies demonstrating the HST5040 pharmacology were performed in only primary hepatocyte disease models due to the limitation of tissue from patients, we expect the mechanism of action to be effective in all tissues as the BCAA and CoA pathways are active in every organ. This is important in PA and MMA because the clinical manifestations that may arise are due to the effects of abnormal metabolism in multiple tissues, especially high-energy tissues, in these patients (add reference to CS paper). HST5040 is the only oral, small molecule therapy under development for the treatment of PA and MMA and is being evaluated in a Phase 2 clinical study.
Materials and Methods
Liver tissue procurement and isolation of hepatic cells
Primary hepatocytes were isolated from liver tissue as previously described (21). Briefly, primary hepatocytes were isolated from liver explants from three individuals with PA and three individuals with MMA. Subjects were consented to the Children’s National Bio-repository for cells, tissues and DNA (CNHS IRB Pro0004911) following guidelines for the Federal Policy for the Protection of Human Subjects (the Common Rule, codified at 45 CFR Part 46). Hepatocyte isolation from liver tissue obtained from the patients were performed at either QPS Hepatic Biosciences (Research Triangle Park, NC) or at HemoShear Therapeutics, LLC (Charlottesville, VA) using a protocol previously described by LeCluyse (45). Control hepatocytes from healthy control livers were procured from QPS Hepatic Biosciences or isolated and cryopreserved at HemoShear Therapeutics. Only donors that passed quality controls demonstrating a differentiated hepatocyte phenotype after cryopreservation were used in experiments.
Cell Culture and Bioreactor Operating Conditions
Primary hepatocyte experiments in HemoShear Therapeutics’ technology, referred to as the bioreactor throughout the manuscript, were previously described (21, 24, 25). Primary hepatocytes were plated in a collagen gel sandwich configuration on the undersurface of the membranes of 75 mm polycarbonate transwells (Corning) and cultured overnight using previously described protocols (Figure S1; (24)). On the second day, the transwells were set up within the bioreactors in a configuration to allow for control of hemodynamics and transport as described previously (24). A proprietary hepatocyte flow medium was continuously perfused on both sides while shear stress was applied on the top surface based on the calculations described below. The devices were housed in a controlled environment at 37°C with 5% CO2 mixed with air. For all the flow experiments described in this study the shear stress of 0.6 dyn/cm2 was used derived from reference values for the pressure gradient across the sinusoid (ΔP), the radius of sinusoids (r), and the length of the sinusoids (l) obtained from the literature (21). The hepatocytes were cultured for 7 days and harvested for measurement of both mitochondrial metabolites (acyl-CoAs) and other clinically relevant biomarkers (acyl-carnitines, MCA) in hepatocyte cell lysates.
Static cell culture and treatments
Primary human hepatocytes from individual donors were plated in a collagen gel sandwich configuration on 48-well plates (Corning) and cultured in customized Hepatocyte Maintenance Medium purchased from Corning using previously described protocols (21). Primary hepatocytes were pre-treated with HST5040 for 30 minutes, followed by a 1 hour incubation with low or high propiogenic media formulations (for formulation, see (21). Hepatocytes were harvested for measurement of both mitochondrial metabolites (acyl-CoAs) and other clinically relevant biomarkers (MMA) in hepatocyte cell lysates.
Mouse and human hepatocytes were purchased as pre-seeded Ready-Plates from Sekisui XenoTech (Cambridge, MA). Opti Culture hepatocyte media was also purchased from XenoTech (K8400) for the feeding and treatment of the cultured hepatocytes.
HST5040 preparation
A 10 mM stock solution of HST5040 (2,2-dimethylbutanoic acid, Sigma, D152609) was prepared in media. From this stock, 100 μM and 30 μM dilutions were prepared, and 10-fold serially diluted in media to achieve a final treatment concentration range of 1000 μM to 0.1 μM.
Acyl-CoA and Acylcarnitine measurements
Methods for extraction of acyl-CoAs and acylcarnitines from primary hepatocytes and detection and quantitation by high-throughput mass-spectrometry are previously described (21).
Organic acid measurements
Methods for extraction of organic acids from primary hepatocytes and detection and quantitation by LC-MS/MS are previously described (21).
Pharmacokinetics and bioavailability of HST5040A following single intravenous bolus injection and single oral administration to the male CD-1 mouse
Four groups of four male CD-1 mice were fasted for two hours and given HST5040A either intravenously at 30 mg/kg or orally at 30, 100 and 300 mg/kg, respectively. The compound was prepared in sterile saline at 6 mg/mL and was administered at 5 mL/kg for the intravenous route. For the oral route, the compound was formulated in sterile water at 3, 10 and 30 mg/mL and administered at 10 mL/kg. Blood samples were collected from the mice receiving the intravenous dose at 0.083, 0.25, 0.5, 1, 2, 4, 6, 8, and 24 hours post dosing, while the blood collection schedule for the orally treated mice was 0.25, 0.5, 1, 2, 3, 4, 6, 8, and 24 hours post dosing. The blood samples were collected into K2EDTA tubes and processed for plasma by centrifugation. The concentration of HST5040 in the plasma was determined by liquid chromatography tandem mass spectrometry (LC-MS/MS). Pharmacokinetic parameters were calculated by noncompartmental analysis (NCA) using Phoenix® WinNonlin 6.3.
HST5040 Continuous Exposure with an Osmotic Mini-Pump in CD-1 mice
CD-1 mice received subcutaneous (SC) infusion of vehicle (PBS, pH 7.4) or HST5040 at a constant rate for a period of 6 days. Alzet® mini-pumps (Model 2001, releasing 1 μL/hr for 7 days) were filled with an aqueous solution of HST5040 (500 mg/mL) and surgically implanted in a subdermal pocket between the scapula. The steady-state plasma concentration of HST5040 was measured by liquid chromatography-tandem mass spectrometry (LC-MS/MS).
Statistics
We investigated the pharmacologic activity of HST5040 using pHep-based disease models of PA and MMA. Three PA and three MMA donors were tested in each experiment at N=2 experimental runs per donor. Experimental runs that failed the quality control criteria for both cellular imaging and albumin levels (device only) were not included in further analysis. The EC50 and EC90 values were calculated based on 4-parameter logistic regression models fit to dose-response data. To ensure reliable estimates of EC50 and EC90 values, dose response curves that did not meet quality control criteria based on (1) signal-to-noise ratios, and (2) saturation of response effects were discarded. In the case of the signal-to-noise criterion, curves were discarded for the purposes of calculating an EC50/EC90 that had a signal-to-noise ratio less than 1.5 with “signal” defined as the absolute difference between the high and low ends of the fitted dose response curve, and “noise” defined as the residual standard error. The saturation criterion required that a fitted dose response curve, within the experimental dose range, span at least 80% of the range of its asymptotic values. The number of experiment curves included in the EC50 and EC90 calculations is noted in the ‘number of DRCs in EC calculations’ column of the tables. The percent change values were calculated by comparing analyte concentrations in the untreated condition to those at a dose near the EC90 value. A dose of 30 μM was selected for this calculation and is approximately 1 standard deviation (SD) above the mean estimate of the EC90 value across all analytes. Thus, the percent change values represent high-end estimates for responses near the EC90 concentration. The percent change values were calculated using all data datasets since, unlike EC50 and EC90 values, they do not require logistic regression fits. Biomarker levels are normalized to cell counts and cell volume to account for differences in the number of cells plated for each donor (26).
Supplementary Material
Acknowledgments
The authors would like to express thanks to HemoShear Therapeutics scientists Andrew Pryor, Justin Taylor, Nathan Day, Morgan Donovan, Crystal Passmore, Sarah Mayer, Austin Payne and Christina Cabrera for technical assistance. We thank Mark Hayes, HemoShear Therapeutics head of regulatory, for his critical review of the manuscript. We would also like to thank HemoShear Therapeutics transplant network coordinator Jeanine Fogarty and collaborators Wanxing Cui and Nada Yazigi from Georgetown University Hospital, Washington, DC, Karl-Dimiter Bissig from Duke University, Durham, NC, Ira Fox and Alina Ostrowska from UPMC Children’s Hospital of Pittsburgh and Lawrence Merrit from Seattle Children’s Hospital. This research was supported in part by SBIR grant R44TR001407 and HemoShear Therapeutics, Inc.
Footnotes
Publisher's Disclaimer: This is a PDF file of an unedited manuscript that has been accepted for publication. As a service to our customers we are providing this early version of the manuscript. The manuscript will undergo copyediting, typesetting, and review of the resulting proof before it is published in its final form. Please note that during the production process errors may be discovered which could affect the content, and all legal disclaimers that apply to the journal pertain.
Conflict of Interest
The following authors have units of ownership in HemoShear Therapeutics, LCC: Allison J Armstrong, Maria Sol Collado, Matthew W Olson, Steve A Hoang, Christin A Hamilton, Brian A Johns, Brian R Wamhoff, John E Reardon, and Robert A Figler. Author, Kimberly A Chapman, is the PI on the HemoShear Therapeutics’ sponsored HERO (Helping Reduce Organic Acids) Clinical Trial at Children’s National Medical Center, Washington DC.
References
- 1.Thompson GN, Chalmers RA. Increased Urinary Metabolite Excretion during Fasting in Disorders of Propionate Metabolism [Internet]. Pediatric Research 1990;27(4):413–416. [DOI] [PubMed] [Google Scholar]
- 2.Sbai D et al. Contribution of odd-chain fatty acid oxidation to propionate production in disorders of propionate metabolism. The American journal of clinical nutrition 1994;59:1332–1337. [DOI] [PubMed] [Google Scholar]
- 3.Haijes HA, Jans JJM, van der Ham M, van Hasselt PM, Verhoeven-Duif NM. Understanding acute metabolic decompensation in propionic and methylmalonic acidemias: a deep metabolic phenotyping approach [Internet]. Orphanet Journal of Rare Diseases 2020;15(1):68. [DOI] [PMC free article] [PubMed] [Google Scholar]
- 4.Zwickler T et al. Usefulness of biochemical parameters in decision-making on the start of emergency treatment in patients with propionic acidemia. Journal of Inherited Metabolic Disease 2014;37(1):31–37. [DOI] [PubMed] [Google Scholar]
- 5.Zwickler T et al. Metabolic decompensation in methylmalonic aciduria: Which biochemical parameters are discriminative?. Journal of Inherited Metabolic Disease 2012;35(5):797–806. [DOI] [PubMed] [Google Scholar]
- 6.Häberle J, Chakrapani A, Ah Mew N, Longo N. Hyperammonaemia in classic organic acidaemias: A review of the literature and two case histories. Orphanet Journal of Rare Diseases 2018;13(1). doi: 10.1186/s13023-018-0963-7 [DOI] [PMC free article] [PubMed] [Google Scholar]
- 7.Filipowicz HR, Ernst SL, Ashurst CL, Pasquali M, Longo N. Metabolic changes associated with hyperammonemia in patients with propionic acidemia. Molecular Genetics and Metabolism 2006;88(2):123–130. [DOI] [PubMed] [Google Scholar]
- 8.Han L et al. Biochemical, molecular and outcome analysis of eight chinese asymptomatic individuals with methyl malonic acidemia detected through newborn screening. American Journal of Medical Genetics, Part A 2015;167(10):2300–2305. [DOI] [PubMed] [Google Scholar]
- 9.Al-Dirbashi OY et al. Assessment of methylcitrate and methylcitrate to citrate ratio in dried blood spots as biomarkers for inborn errors of propionate metabolism. Scientific Reports 2019;9(1). doi: 10.1038/s41598-019-48885-9 [DOI] [PMC free article] [PubMed] [Google Scholar]
- 10.Wang Y, Sun Y, Jiang T. Clinical Application of LC–MS/MS in the Follow-Up for Treatment of Children with Methylmalonic Aciduria [Internet]. Advances in Therapy 2019;36(6):1304–1313. [DOI] [PubMed] [Google Scholar]
- 11.Maines E et al. Plasma methylcitric acid and its correlations with other disease biomarkers: The impact in the follow up of patients with propionic and methylmalonic acidemia. Journal of Inherited Metabolic Disease [published online ahead of print: 2020]; doi: 10.1002/jimd.12287 [DOI] [PubMed] [Google Scholar]
- 12.Fraser JL, Venditti CP. Methylmalonic and propionic acidemias: Clinical management update. Current Opinion in Pediatrics 2016;28(6):682–693. [DOI] [PMC free article] [PubMed] [Google Scholar]
- 13.Chapman KA et al. Acute management of propionic acidemia. Molecular Genetics and Metabolism. 2012:16–25 [DOI] [PMC free article] [PubMed] [Google Scholar]
- 14.Chapman KA, Gramer G, Viall S, Summar ML. Incidence of maple syrup urine disease, propionic acidemia, and methylmalonic aciduria from newborn screening data. Molecular Genetics and Metabolism Reports 2018;15:106–109. [DOI] [PMC free article] [PubMed] [Google Scholar]
- 15.Baumgartner MR et al. Proposed guidelines for the diagnosis and management of methylmalonic and propionic acidemia. Orphanet Journal of Rare Diseases 2014;9(1). doi: 10.1186/s13023-014-0130-8 [DOI] [PMC free article] [PubMed] [Google Scholar]
- 16.Haijes HA, Jans JJM, Tas SY, Verhoeven-Duif NM, van Hasselt PM. Pathophysiology of propionic and methylmalonic acidemias. Part 1: Complications. Journal of Inherited Metabolic Disease 2019;42(5):730–744. [DOI] [PubMed] [Google Scholar]
- 17.Coude FX, Sweetman L, Nyhan WL. Inhibition by propionyl-coenzyme A of N-acetylglutamate synthetase in rat liver mitochondria. A possible explanation for hyperammonemia in propionic and methylmalonic acidemia. The Journal of clinical investigation 1979;64(6):1544–1551. [DOI] [PMC free article] [PubMed] [Google Scholar]
- 18.Dercksen M et al. Inhibition of N-acetylglutamate synthase by various monocarboxylic and dicarboxylic short-chain coenzyme A esters and the production of alternative glutamate esters. Biochimica et Biophysica Acta - Molecular Basis of Disease 2014;1842(12):2510–2516. [DOI] [PubMed] [Google Scholar]
- 19.Schwab MA et al. Secondary mitochondrial dysfunction in propionic aciduria: A pathogenic role for endogenous mitochondrial toxins. Biochemical Journal 2006;398(1):107–112. [DOI] [PMC free article] [PubMed] [Google Scholar]
- 20.Brass EP, Beyerinck RA. Effects of propionate and carnitine on the hepatic oxidation of short-and medium-chain-length fatty acids. 1988; 250:819–825. [DOI] [PMC free article] [PubMed] [Google Scholar]
- 21.Collado MS et al. Biochemical and anaplerotic applications of in vitro models of propionic acidemia and methylmalonic acidemia using patient-derived primary hepatocytes. Molecular Genetics and Metabolism 2020;130(3):183–196. [DOI] [PMC free article] [PubMed] [Google Scholar]
- 22.Armstrong AJ et al. Identification of 2,2-dimethylbutanoic acid (HST5040), a Clinical Development Candidate for the Treatment of Propionic Acidemia and Methylmalonic Acidemia. Manuscript submitted [DOI] [PubMed] [Google Scholar]
- 23.Dash A et al. Pharmacotoxicology of clinically-relevant concentrations of obeticholic acid in an organotypic human hepatocyte system. Toxicology in Vitro 2017;39:93–103. [DOI] [PMC free article] [PubMed] [Google Scholar]
- 24.Dash A et al. Hemodynamic flow improves rat hepatocyte morphology, function, and metabolic activity in vitro. American Journal of Physiology - Cell Physiology 2013;304(11). doi: 10.1152/ajpcell.00331.2012 [DOI] [PMC free article] [PubMed] [Google Scholar]
- 25.Chapman KA et al. Recapitulation of metabolic defects in a model of propionic acidemia using patient-derived primary hepatocytes. Molecular Genetics and Metabolism 2016;117(3):355–362. [DOI] [PMC free article] [PubMed] [Google Scholar]
- 26.Lodish H, Berk A, Zipursky SL. Molecular Cell Biology, 4th edition. New York-W. H. Freeman; 2000. [Google Scholar]
- 27.Grünert SC et al. Propionic acidemia: Clinical course and outcome in 55 pediatric and adolescent patients. Orphanet Journal of Rare Diseases 2013;8(1). doi: 10.1186/1750-1172-8-6 [DOI] [PMC free article] [PubMed] [Google Scholar]
- 28.Wajner M et al. Reduction of large neutral amino acid concentrations in plasma and CSF of patients with maple syrup urine disease during crises. Journal of Inherited Metabolic Disease 2000;23(5):505–512. [DOI] [PubMed] [Google Scholar]
- 29.Skonberg C, Olsen J, Madsen KG, Hansen SH, Grillo MP. Metabolic activation of carboxylic acids. Expert Opinion on Drug Metabolism and Toxicology 2008;4(4):425–438. [DOI] [PubMed] [Google Scholar]
- 30.Walker MK et al. A less stressful alternative to oral gavage for pharmacological and toxicological studies in mice. Toxicology and Applied Pharmacology 2012;260(1):65–69. [DOI] [PMC free article] [PubMed] [Google Scholar]
- 31.Brass EP. Pivalate-Generating Prodrugs and Carnitine Homeostasis in Man [Internet]. Pharmacological Reviews 2002;54(4):589. [DOI] [PubMed] [Google Scholar]
- 32.Ruff LJ, Brass EP. Metabolic effects of pivalate in isolated rat hepatocytes [Internet]. Toxicology and Applied Pharmacology 1991;110(2):295–302. [DOI] [PubMed] [Google Scholar]
- 33.Brass EP. Overview of coenzyme A metabolism and its role in cellular toxicity [Internet]. Chemico-Biological Interactions 1994;90(3):203–214. [DOI] [PubMed] [Google Scholar]
- 34.Gregersen N The specific inhibition of the pyruvate dehydrogenase complex from pig kidney by ropionyl-CoA and isovaleryl-CoA. Biochemical Medicine 1981;26(1):20–27. [DOI] [PubMed] [Google Scholar]
- 35.Mitchell GA et al. Hereditary and acquired diseases of acyl-coenzyme A metabolism. Molecular Genetics and Metabolism 2008;94(1):4–15. [DOI] [PubMed] [Google Scholar]
- 36.Brass EP, Tahiliani AG, Allen RH, Stabler SP. Coenzyme A Metabolism in Vitamin B-12—Deficient Rats [Internet]. The Journal of Nutrition 1990;120(3):290–297. [DOI] [PubMed] [Google Scholar]
- 37.Zhang YM, Rock CO, Jackowski S. Biochemical properties of human pantothenate kinase 2 isoforms and mutations linked to pantothenate kinase-associated neurodegeneration. Journal of Biological Chemistry 2006;281(1):107–114. [DOI] [PubMed] [Google Scholar]
- 38.Zhang YM, Rock CO, Jackowski S. Feedback regulation of murine pantothenate kinase 3 by coenzyme A and coenzyme A thioesters. Journal of Biological Chemistry 2005;280(38):32594–32601. [DOI] [PubMed] [Google Scholar]
- 39.Leonardi R, Rock CO, Jackowski S, Zhang Y-M. Activation of human mitochondrial pantothenate kinase 2 by palmitoylcarnitine. PNAS 2007: 105(5) 1494–1499. [DOI] [PMC free article] [PubMed] [Google Scholar]
- 40.Perrine SP et al. Evaluation of safety and pharmacokinetics of sodium 2,2 dimethylbutyrate, a novel short chain fatty acid derivative, in a phase 1, double-blind, placebo-controlled, single-dose, and repeat-dose studies in healthy volunteers. Journal of Clinical Pharmacology 2011;51(8):1186–1194. [DOI] [PMC free article] [PubMed] [Google Scholar]
- 41.Kutlar A et al. A dose-escalation phase IIa study of 2,2-dimethylbutyrate (HQK-1001), an oral fetal globin inducer, in sickle cell disease. American Journal of Hematology 2013;88(11). doi: 10.1002/ajh.23533 [DOI] [PubMed] [Google Scholar]
- 42.Kutlar A et al. A phase 1/2 trial of HQK-1001, an oral fetal globin inducer, in sickle cell disease. American Journal of Hematology 2012;87(11):1017–1021. [DOI] [PMC free article] [PubMed] [Google Scholar]
- 43.Fucharoen S et al. A randomized phase I/II trial of HQK-1001, an oral fetal globin gene inducer, in β-thalassaemia intermedia and HbE/β-thalassaemia. British Journal of Haematology 2013;161(4):587–593. [DOI] [PMC free article] [PubMed] [Google Scholar]
- 44.Reid ME et al. A double-blind, placebo-controlled phase II study of the efficacy and safety of 2,2-dimethylbutyrate (HQK-1001), an oral fetal globin inducer, in sickle cell disease. American Journal of Hematology 2014;89(7):709–713. [DOI] [PubMed] [Google Scholar]
- 45.LeCluyse Edward L and Alexandre E Isolation and Culture of Primary Hepatocytes from Resected Human Liver Tissue [Internet]. In: Maurel P ed. Hepatocytes: Methods and Protocols. Totowa, NJ: Humana Press; 2010:57–82 [DOI] [PubMed] [Google Scholar]
Associated Data
This section collects any data citations, data availability statements, or supplementary materials included in this article.