

Abstract
We developed a COVID-19 transmission model to compare the effects of nonpharmaceutical public health interventions (NPIs) on health and economic outcomes. An interdisciplinary approach informed the selection and use of multiple NPIs, combining quantitative modeling of the health and economic impacts of interventions with qualitative assessments of other important considerations (e.g., cost, ease of implementation, equity). We used our model to analyzed strategies that periodically switch between a base NPI and a high NPI level. We find that this systematic strategy could have produced similar health outcomes as static strategies but better social welfare and economic outcomes. Our findings suggest that there are opportunities to shape the tradeoffs between economic and health outcomes by carefully evaluating a more comprehensive range of reopening policies.
Keywords: COVID-19, economic outcomes, health outcomes, nonpharmeceutical interventions
Resumen
Desarrollamos un modelo de transmisión de COVID-19 para comparar los efectos de las intervenciones de salud pública (NPI) no farmacéuticas en los resultados económicos y de salud. Un enfoque interdisciplinario informó la selección y el uso de múltiples ISFL, combinando modelos cuantitativos de los impactos económicos y de salud de las intervenciones con evaluaciones cualitativas de otras consideraciones importantes (por ejemplo, costo, facilidad de implementación, equidad). Usamos nuestro modelo para analizar estrategias que cambian periódicamente entre un NPI base y un nivel alto de NPI. Encontramos que esta estrategia sistemática podría haber producido resultados de salud similares a los de las estrategias estáticas, pero mejores resultados económicos y de bienestar social. Nuestros hallazgos sugieren que existen oportunidades para dar forma a las compensaciones entre los resultados económicos y de salud al evaluar cuidadosamente una gama más completa de políticas de reapertura.
Palabras clave: COVID-19, resultados económicos, resultados de salud, intervenciones no farmacéuticas
Abstract
我们提出一个新冠肺炎(COVID-19)传播模型,用于比较非 药物公共卫生干预(NPIs)对卫生和经济结果产生的效果。 通过跨学科方法选择和使用不同NPIs,并对干预产生的卫生 和经济影响进行定量建模,同时结合有关其他重要考量因素 (例如成本,执行难度,公平)的定性评估。我们使用模型 分析定期在基准NPI和高NPI层面切换的不同策略。我们发 现,这一系统性策略能够产生与静态策略相似的卫生结果, 以及更高的社会福利和经济结果。我们的研究发现暗示,通 过仔细评估更全面的经济重新开放政策,有可能影响经济结 果和卫生结果之间的得失。
关键词: 新冠肺炎(COVID-19), 经济结果, 卫生结果, 非药物干预
1. Introduction
Coronavirus disease 2019 (COVID-19) is unprecedented in terms of scale and speed, affecting millions worldwide. Until recently, vaccines and effective treatments for COVID-19 were unavailable. National leaders have had to take extraordinary measures to mitigate the virus’s spread and prevent health care systems from being overwhelmed. Policy-makers have implemented a range of nonpharmaceutical public health interventions (NPIs). These interventions include partial closings (e.g., schools and non-essential businesses, prohibiting large gatherings, quarantining the most vulnerable) and complete lockdown (e.g., placing all residents under stay-at-home orders). The goal of NPIs is to delay and reduce the peak number of cases per day, reduce pressure on health services, and allow time for vaccines to be distributed [1]. If NPIs are relaxed too soon, a new wave of infections may occur. However, NPIs have wide-ranging effects on the health, economy, and social well-being of populations, which has led to growing pandemic fatigue and a decline in adherence to NPIs since they were first initiated [2, 3]. Decision-makers are faced with tough decisions, such as how to sequence, relax, and possibly reinstate mitigation measures. Exacerbating these decisions are significant uncertainties, including new variants and behavioral responses to extended interventions.
Mathematical and simulation models of COVID-19 transmission dynamics are invaluable tools to help decision-makers forecast and compare intervention outcomes, predict the timing of peaks in cases and deaths, medical supply needs, and if and when we should expect additional waves. They enable the projection and comparison of population-level outcomes over hypothetical scenarios. Model outcomes include the incidence and prevalence of the infection over time and for different population groups. The hypothetical scenarios can consist of the impact of varying pharmaceutical and nonpharmaceutical public health interventions, distributing vaccines, and the emergence of new strains.
We developed a COVID-19 transmission Population-Based Model (PBM) used as part of a web-based COVID-19 decision support tool that compares the effects of different non-pharmaceutical public health interventions (NPIs) on health and economic outcomes. An interdisciplinary approach informed the selection of NPI portfolios, combining quantitative modeling of the health/economic impacts with qualitative assessments of cost, ease of implementation, and equity. An in-depth description of our approach was previously published as a RAND report describing how the PBM, the economic model, and a systematic assessment of NPIs informed the web tool [4].
We expanded our original model [4] to account for additional uncertainties and consider an expanded set of NPI strategies. In this paper, we consider periodic NPI strategies. These are strategies whereby the enacted NPI systematically changes at fixed intervals between low and high stringency levels. Recent research has demonstrated that high-frequency periodic NPIs [5] have the potential to mitigate COVID-19 resurgences while providing more predictability and alleviating the damaging effects on economic activity and social well-being. We use our updated model to explore if a periodic strategy could have provided benefits compared to fixed strategies in mitigating the virus’s transmission by keeping a low value for the effective reproductive number (Rt ) and close to one.1 We find that a periodic strategy can dominate fixed strategies, improving health and days spent under restrictions. This could have led to improvements in economic outcomes due to both the reductions in the days spent under restrictions and the greater certainty of planned restrictions’ timing and duration.
The paper is structured as follows. First, we provide an overview of our model structure. Then, we briefly analyze a set of illustrative scenarios, including periodic and fixed strategies, identifying if the periodic strategies used by other modelers [5] produce similar results in our model. Finally, we provide detailed information on our mathematical model and present sensitivity analyses.
2. Model Overview
Theory-based epidemiological models use a theoretical understanding of biological and social processes to represent a disease’s clinical and epidemiological course. The most typical model considers the population in four different disease states: susceptible, exposed, infected, and Removed (SEIR). Our PBM incorporates several extensions to the SEIR model of disease transmission. It is formulated deterministically by coupled ordinary differential equations (ODEs) and integrated numerically by solvers for stiff problems [6-9]. We extend the SEIR framework to better describe COVID-19 transmission by adding additional disease states and considering population strata based on age and chronic conditions. The PBM models the effects of different NPIs on health outcomes and income loss, from partial closings to complete lockdown. Unlike many other COVID-19 models, we simulate the impact of NPIs on different mixing modes (such as home, school, and work) separately, allowing us to model various interventions flexibly. Our PBM also includes population strata and specify mixing pattern heterogeneities across the population strata and for each mode. These heterogeneities included in our model allow us to set the NPI more specifically, with mixing rates reduced deferentially by mixing mode. Our model is designed to help policy-makers understand the NPIs to implement, and estimate how effects of NPIs, weigh trade-offs among policy-makers should enforce long-them, make decisions about which term interventions to control the virus.
Figure 1 shows a simplified illustration of the disease states included in the first basic version of our PBM. The model includes a pre-symptomatic highly infectious state that is part of the incubation phase, which leads to either an asymptomatic state or a state with mild symptoms, a fraction of which continues to severe disease. Most of those who develop severe symptoms are hospitalized. Non-hospitalized severely-symptomatic either recover or die. The hospitalized state includes compartments for both the main hospital and the ICU, where individuals are admitted if they were to develop critical symptoms. Capacities can be set for the hospital and ICU beyond which no additional patients can be added. At each of the infectious states, individuals can be tested for COVID-19. Each compartment comprises ten population strata, five age groups, and two health states (those with and without at least one chronic condition). These strata allow the model to simulate how the disease impacts different population groups, including differences in population size, mixing mortality rate, and the proportion who are asymptomatic. Disease progression rates are based on figures given in the literature and are sampled from distributions if uncertain. The force of infection (the rate that susceptible individuals become exposed) is characterized by how many infectious people are in each state, each state’s transmissibility, and mixing levels. We estimate transmissibilities for each state based on biological and social factors. For instance, viral loads are highest early in the disease [10], so these states have higher biological transmissibility. We assume that those who receive positive tests or exhibit symptoms have lower social transmissibility because they take measures to limit others’ exposure. The total transmissibility of a state is the product of biological and social transmissibilities. The population-weighted sum of transmission is proportional to the number of new infections.
Figure 1:
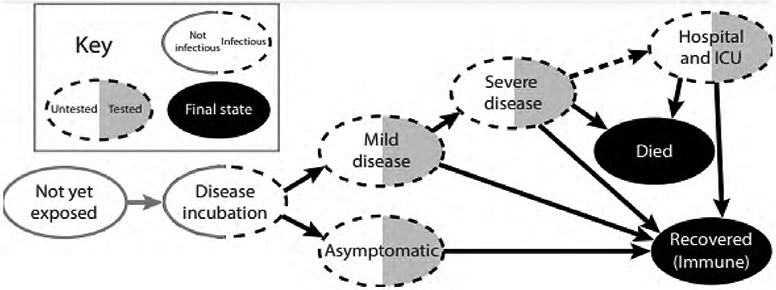
COVID-19 PBM disease states
In our model, NPIs are portfolios of restrictions mandated at the state level, as described in table 1. The set of NPIs levels used by each state is characterized by a discrete set of intervention levels ranging from 1 (no intervention) to 6 (close schools, bars, restaurants, and non-essential businesses; and issue a shelter-in-place order for everyone but essential workers). Each intervention level is associated with mixing matrices that describe how strata interact with each other in six different settings: household, work, school, commercial, recreation, and other. Interventions are modeled as changing the level of mixing which occurs in each of these settings. For instance, closing schools reduce school and work mixing but increases home mixing. Given the specified model structure, the NPI time-series, and the mixing matrices, we calibrate our model for each state using time series of reported deaths. Our Supplemental Information provides a detailed description of the mathematical formulation of our model.
Table 1.
Nonpharmaceutical intervention levels.
| NPI Level | Description |
|---|---|
| Level 1: No Intervention | No Intervention. |
| Level 2: Close schools | All schools are closed. |
| Level 3: Close schools, bars, and restaurants; and ban large events | In addition to school closures, all bars’ and restaurants’ dine-in services are closed, only allowing for take-out options. Also, large gatherings are banned. |
| Level 4: Close schools, bars, and restaurants; ban large events; and close nonessential businesses | In addition to school, bar, and restaurant closures, all nonessential businesses are closed. |
| Level 5: Close schools, bars, and restaurants; ban large events; close nonessential businesses; and shelter in place for the most vulnerable | In addition to the closure of all nonessential businesses, a shelter in place is recommended for the vulnerable population, including the elderly, children, and other at-risk populations. |
| Level 6: Close schools, bars, and restaurants; ban large events; close nonessential businesses; and shelter in place for everyone but essential workers | In addition to the interventions above, shelter in place order is issued for everyone but essential workers |
3. Exploring Periodic NPI Strategies
This section presents an illustrative retrospective analysis of policies that can be tested with the model, using California as an example. They illustrate that alternative plausible NPI strategies could have produced improved outcomes during 2020 in the absence of vaccines. The purpose of this analysis is two-fold. First, it demonstrates how our model can trace many-objective trade-off curves to support the analysis of reopening strategies. Second, this analysis demonstrates that a periodic switching of NPIs could have shifted society towards more desirable trade-off curves. That is, it could have led to a Pareto-improvement2.
We explore two types of strategies that policy-makers could have followed to manage NPIs in 2020. The first set of strategies are “fixed” NPI levels. This type of strategy holds the NPI level constant over time. Although this strategy has not been followed in California explicitly, the NPI mandates imposed in California are best approximated in our model by setting the NPI level to three. This NPI level was stable between July of 2020 through the end of the year. It represents our baseline scenario and is the scenario we used to calibrate our model.
Fixed NPIs are not, however, the only way to control the pandemic. Alternatively, one could use periodic strategies to curb transmission [5]. A periodic NPI can represent a strategy wherein society goes into more severe periods of NPIs then relaxes to lower levels of stringency. This strategy’s rationale is that those newly infected during the relaxed periods would take a few days before becoming infectious themselves. The enforcement of stringent NPIs would then limit the virus’s time and possibilities to spread further from these infectious individuals before they either recover or are hospitalized. This periodical switching would systematically reduce transmissions and force the dynamics of the epidemic to be controlled by the strategy’s frequency.
In essence, a periodic strategy uses the natural timescales of disease progression and infectivity to induce a synchronization phase that helps align when people are more likely to be infected together, allowing for the social distancing NPIs to be more effective. An example of a similar strategy includes schools adopting a hybrid learning model wherein students go to school every other week. Similarly, restaurants could open for indoor dining periodically. In the absence of vaccines, such policies may be desirable. They would provide stability, regularity, and increased predictability for businesses to plan against. The policies could, in principle, help suppress the transmission of the virus and simultaneously reduce uncertainties in economic activity.
Figure 2 illustrates the dynamics of periodic and fixed NPI strategies. The fixed NPI strategies represented in the figure suggest that under the NPI level three, Rt closely followed one and increased towards the end of December, driven by our model’s seasonal effect. Because Rt was close to one in the model, a departure from the current NPI level would be expected to produce a significant departure from the Rt = 1. Therefore, a policy that reopens the state (F-1) would be expected to produce a spike in prevalence and subsequently in the number of deaths. A more stringent, constant policy (F-5) would be expected to reduce the number of deaths.
Figure 2: Model Dynamics with Fixed and Periodic NPIs:
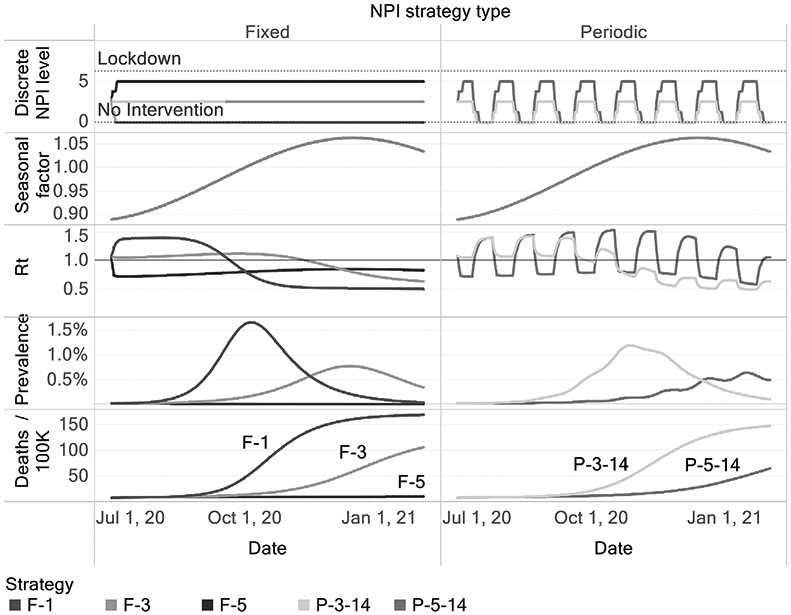
Fixed NPI strategies are coded with an “F” followed by the intervention level included in the NPI. Periodic NPI strategies are coded with a “P” followed by the maximum NPI level in the periodic strategy and the period in days. In that case, P-3-14 means that the state will switch between the NPI levels 3 and 1 every 14 days.
As figure 2 shows, the periodic strategy P-5-14 switches between NPI levels 1 and 5 every two weeks. This switching causes Rt to oscillate such that prevalence does not increase unchecked. As a consequence, the number of deaths is controlled. The choice of two weeks is based on the typical timescale describing the disease progression for most infected people. However, other choices for the periodicity could be explored.
When judging alternative strategies, policy-makers often have to weigh multiple criteria to make decisions, so one needs to translate model outcomes to meaningful criteria. One criterion could be the number of days of school closures, which has been an important concern during the COVID-19 pandemic. However, the number of days of school closures does not distinguish scenarios where non-essential businesses are closed for long periods, so other proxies for welfare loss are needed. One approach could be to use weights for each NPI level, such that those weights are proportional to the marginal daily welfare loss induced by each NPI level. Suppose we define the weights such that one day under lockdown is equivalent to a weight of one, and define that one day under no restrictions is equivalent to zero. We can then compute a proxy to social welfare that we can use to judge alternative strategies. Our weighted lockdown days metric corresponds to this criterion.
There are other plausible ways to compute NPI costs. NPIs arguably induce income loss. Our third metric uses the income loss under each NPI level estimated by a general equilibrium model [11] to account for the economic consequences of NPI restrictions. Although all these proxies are imperfect measures of social welfare loss induced by NPIs, our conclusions do not rely on their precision but on the assumption that NPI costs are increasing in the level of restriction. This structural assumption allows us to illuminate trade-offs and reveal Pareto-dominated strategies that rely on the structure of the epidemiological model3.
Figure 3 demonstrates that using a small set of alternative measures can support those decisions and reveal Pareto-dominated strategies. Strategy F-3, our baseline strategy, is Pareto-dominated by a wide range of strategies that oscillate between the NPI level of 5 and 1, using many periods, which is in line with prior research [5].
Figure 3: Tradeoff surface implied by alternative policies.
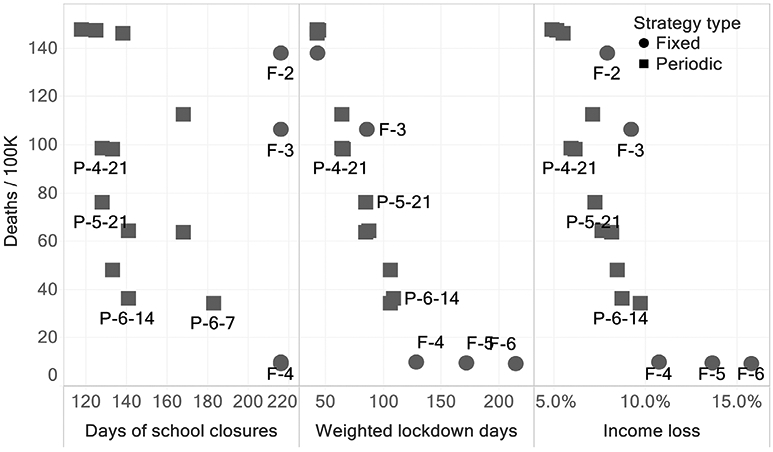
The vertical axis presents the number of Deaths / 100k at the end of the simulation run (Feb. 2021) in California. The horizontal axis contains several proxies that represent alternative criteria to evaluate the costs of NPIs. Across all these criteria, we find that periodic NPIs tend to dominate fixed NPIs.
We analyzed periodic strategies to illustrate that alternative NPIs strategies could Pareto-dominate fixed strategies and shift the trade-off surface among health and economic/social outcomes if implemented with high levels of compliance. Based on our analysis, policy-makers could have used periodic NPIs to manage the COVID-19 pandemic producing the same health outcomes while allowing essential activities, such as in-person education, to have happened in a controlled manner. Our analysis demonstrated that alternative NPI strategies could shift the trade-off curves among the relevant outcomes.
Including social welfare loss measures induced by NPIs in analyses seeking to inform COVID-19 reopening decisions is essential. Only including health outcomes in those analyses leaves the task of weighing other concerns to the policy-maker, who may or may not be able to do so consistently. Metrics of welfare loss induced by NPIs can be either derived directly from the model outcomes (e.g., days of school closures) or by using a weighted sum based on the NPIs stringency level, potentially using economic models in our prior work [4]. Our analyses provide a general guide to policy-makers that is valid despite the uncertainties that prevent us from providing precise estimates. As figure 3 demonstrated, if one ignores all the horizontal axes under the argument that those estimates might be imprecise, policy-makers might not be properly informed that alternative policies dominate some policies. This statement and the pattern seen in the trade-off curves do not rely on the precision of economic estimates but the theory-based epidemiological model structure
There are limitations to our analysis. First, we do not consider practicality: these periodic strategies might be regarded as unfeasible, impractical, or undesirable by policy-makers and the public. This consideration is significant because the strength of the periodic NPIs relies on the ability to abruptly reduce mixing, which can only be achieved with a high compliance level. Further, people may shift their mixing to the open periods reducing or even canceling the mitigation effects on transmission intended by the periodic NPI policy. The trade-off curves we present also should not be seen as static. Many other factors that have been held constant in our analysis might shift this curve.
Widespread adoption of high-quality masks, for example, would shift every point inwards, making society systematically better off. The emergence of new, more transmissible variant strains can shift the curve outwards. A more stringent strategy to eliminate community spread and prevent re-seeding (such as New Zealand’s strategy) can remove the health-economic trade-offs curve completely if successfully implemented. Adaptation measures to prevent transmission within schools would also shift this curve, strengthening periodic strategies even more attractive to allow in-person education. Moreover, the introduction of vaccines also shapes this trade-off curve over time. As vaccination roll-out advances, the marginal benefit of an additional day under stringent NPIs will decrease. Accounting for the vaccination dynamics will be essential to guide society to a new normal through a robust reopening plan.
Supplementary Material
Acknowledgments
We wish to thank Drs. Jeanne Ringel, Jennifer Bouey, Courtney Gidengil, and Carter Price at the RAND Corporation for their support in advising the authors in the model development and in finding parameter value estimates. We thank Drs. Robert Lempert, Carolyn Rutter at the RAND Corporation, and Dr. Jonathan Ozik at the Argonne National Laboratory for their support in advising the authors in model calibration and policy exploration methods. We thank Dr. Chris Bauch, a professor in applied mathematics at the University of Waterloo for his constructive comments that significantly improved our model. This research received internal RAND funding and was further funded by Mala Gaonkar and Surgo Foundation UK Limited, a separate legal entity to Surgo Ventures. We thank Drs. Michael Rich, Anita Chandra, and Peter Hussey for supporting our work and securing funding. We also thank the National Cancer Institute (R21CA157571), and the National Institute of Allergies and Infectious Diseases (R01AI118705) for providing support in projects that led to preliminary work and ideas that motivated this project.
Footnotes
The effective reproductive number (Rt ) found from population-based models provides an indication of the average number of secondary infections produced by a typical case of an infection in a population during the course of the epidemic. When Rt > 1 we get a growing number of new infections.
Consider the trade-off between deaths and lockdown days, a strategy A is Pareto dominated if there is some other strategy B that would decrease the number of deaths for the same number of lockdown days or decrease the number of lockdown days for the same number of deaths. Strategy B would be a Pareto-improvement over strategy A.
One might estimate the costs of NPIs using a willingness to pay or similar approach. As long as those weights are monotonically increasing (e.g., people are not deriving utility from NPI restrictions), our substantive findings would hold. While estimating more precise welfare costs of NPIs and using those costs as weights might be valuable to compare benefits from NPIs to costs, we doubt that these weights would be stable over time. Still, as long as these weights are monotonically increasing functions of the NPI level at any point in time, our substantive results would hold. Because these weights are highly uncertain and potentially not constant, we refrain from aggregate all outcomes under a single social welfare metric in our analyses as a traditional Cost-Benefit analysis would do. Instead, we assess Pareto-efficiency and seek strategies that dominate other strategies across a set of outcomes
References
- [1].Aledort Julia E., Lurie Nicole, Wasserman Jeffrey, and Bozzette Samuel A.. Non-pharmaceutical public health interventions for pandemic influenza: An evaluation of the evidence base. BMC public health, 7:208, August 2007. ISSN 1471-2458. doi: 10.1186/1471-2458-7-208. [DOI] [PMC free article] [PubMed] [Google Scholar]
- [2].Crane Matthew A., Shermock Kenneth M., Omer Saad B., and Romley John A.. Change in Reported Adherence to Nonpharmaceutical Interventions During the COVID-19 Pandemic, April- November 2020. JAMA, January 2021. ISSN 1538-3598. doi: 10.1001/jama.2021.0286. [DOI] [PMC free article] [PubMed] [Google Scholar]
- [3].Kantor Bella Nichole and Kantor Jonathan. Non-pharmaceutical Interventions for Pandemic COVID-19: A Cross-Sectional Investigation of US General Public Beliefs, Attitudes, and Actions. Frontiers in Medicine, 7, July 2020. ISSN 2296-858X. doi: 10.3389/fmed.2020.00384. [DOI] [PMC free article] [PubMed] [Google Scholar]
- [4].Vardavas Raffaele, Strong Aaron, Bouey Jennifer, Welburn Jonathan William, de Lima Pedro Nascimento, Baker Lawrence, Zhu Keren, Priest Michelle, Hu Lynn, and Ringel Jeanne S.. The Health and Economic Impacts of Nonpharmaceutical Interventions to Address COVID-19: A Decision Support Tool for State and Local Policymakers. https://www.rand.org/pubs/tools/TLA173-1.html, 2020. [Google Scholar]
- [5].Bin Michelangelo, Cheung Peter Y. K., Crisostomi Emanuele, Ferraro Pietro, Lhachemi Hugo, Roderick Murray-Smith Connor Myant, Parisini Thomas, Shorten Robert, Stein Sebastian, and Stone Lewi. Post-lockdown abatement of COVID-19 by fast periodic switching. PLOS Computational Biology, 17(1): e1008604, January 2021. ISSN 1553-7358. doi: 10.1371/journal.pcbi.1008604. [DOI] [PMC free article] [PubMed] [Google Scholar]
- [6].Brown Peter N., Byrne George D., and Hindmarsh Alan C.. VODE: A Variable-Coefficient ODE Solver. SIAM Journal on Scientific and Statistical Computing, 10(5):1038–1051, September 1989. ISSN 0196-5204. doi: 10.1137/0910062. [DOI] [Google Scholar]
- [7].Hindmarsh Alan C. and Petzold Linda R.. Algorithms and software for ordinary differential equations and differential-algebraic equations, Part II: Higher-order methods and software packages. Computers in Physics, 9(2):148–155, [Google Scholar]
- [8].Shampine LF and Gear CW. A User’s View of Solving Stiff Ordinary Differential Equations. SIAM Review, 21(1):1–17, January 1979. ISSN 0036-1445. doi: 10.1137/1021001. [DOI] [Google Scholar]
- [9].Soetaert Karline, Petzoldt Thomas, and Setzer R. Woodrow. Solving Differential Equations in R: Package deSolve. Journal of Statistical Software, 33(1):1–25, February 2010. ISSN 1548-7660. doi: 10.18637/jss.v033.i09.20808728 [DOI] [Google Scholar]
- [10].He Xi, Lau Eric H. Y., Wu Peng, Deng Xilong, Wang Jian, Hao Xinxin, Lau Yiu Chung, Wong Jessica Y., Guan Yujuan, Tan Xinghua, Mo Xiaoneng, Chen Yanqing, Liao Baolin, Chen Weilie, Hu Fengyu, Zhang Qing, Zhong Mingqiu, Wu Yanrong, Zhao Lingzhai, Zhang Fuchun, Cowling Benjamin J., Li Fang, and Leung Gabriel M.. Temporal dynamics in viral shedding and transmissibility of COVID-19. Nature Medicine, 26(5):672–675, May 2020. ISSN 1546-170X. doi: 10.1038/s41591-020-0869-5. [DOI] [PubMed] [Google Scholar]
- [11].Strong Aaron and Welburn Jonathan William. An Estimation of the Economic Costs of Social-Distancing Policies. May 2020. [Google Scholar]
Associated Data
This section collects any data citations, data availability statements, or supplementary materials included in this article.